
Novel Evaluation Method for Cleaner Production Audit in Industrial Parks: Case of a Park in Central China

 ,
,
Abstract
1. Introduction
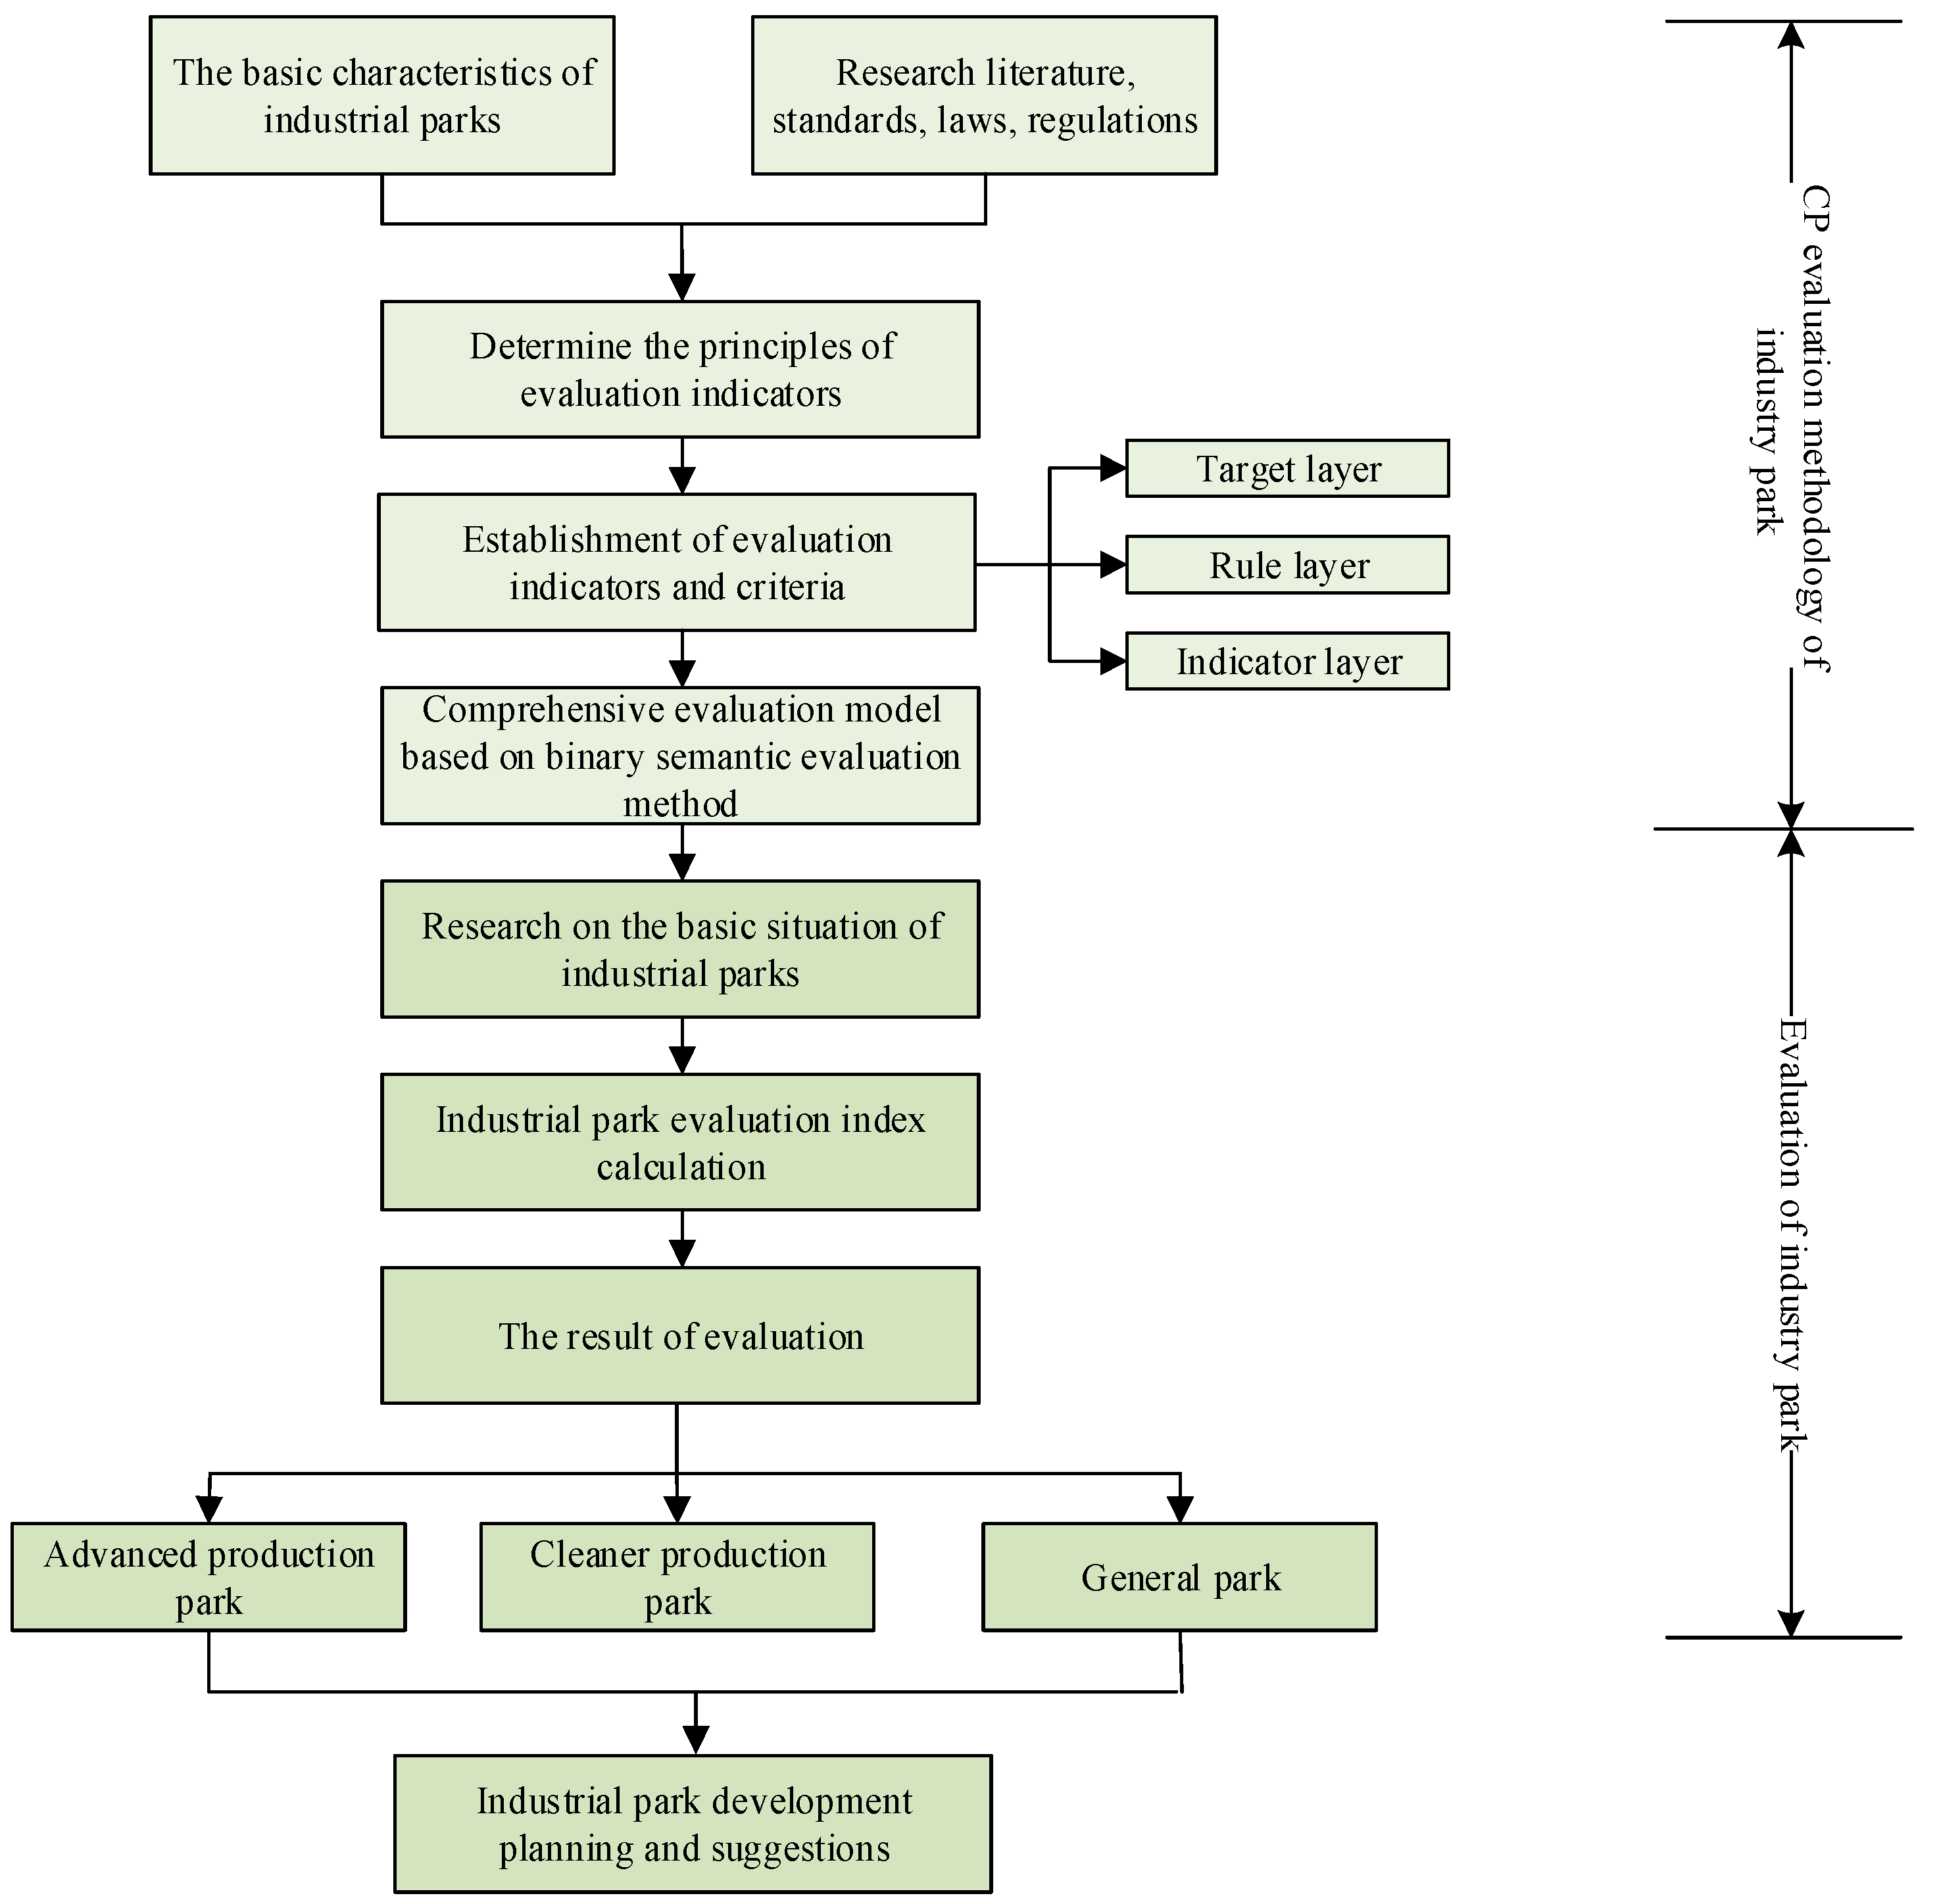
2. Methodology
2.1. Establish Index Framework and Standards
2.1.1. Principles for Determining Indicators
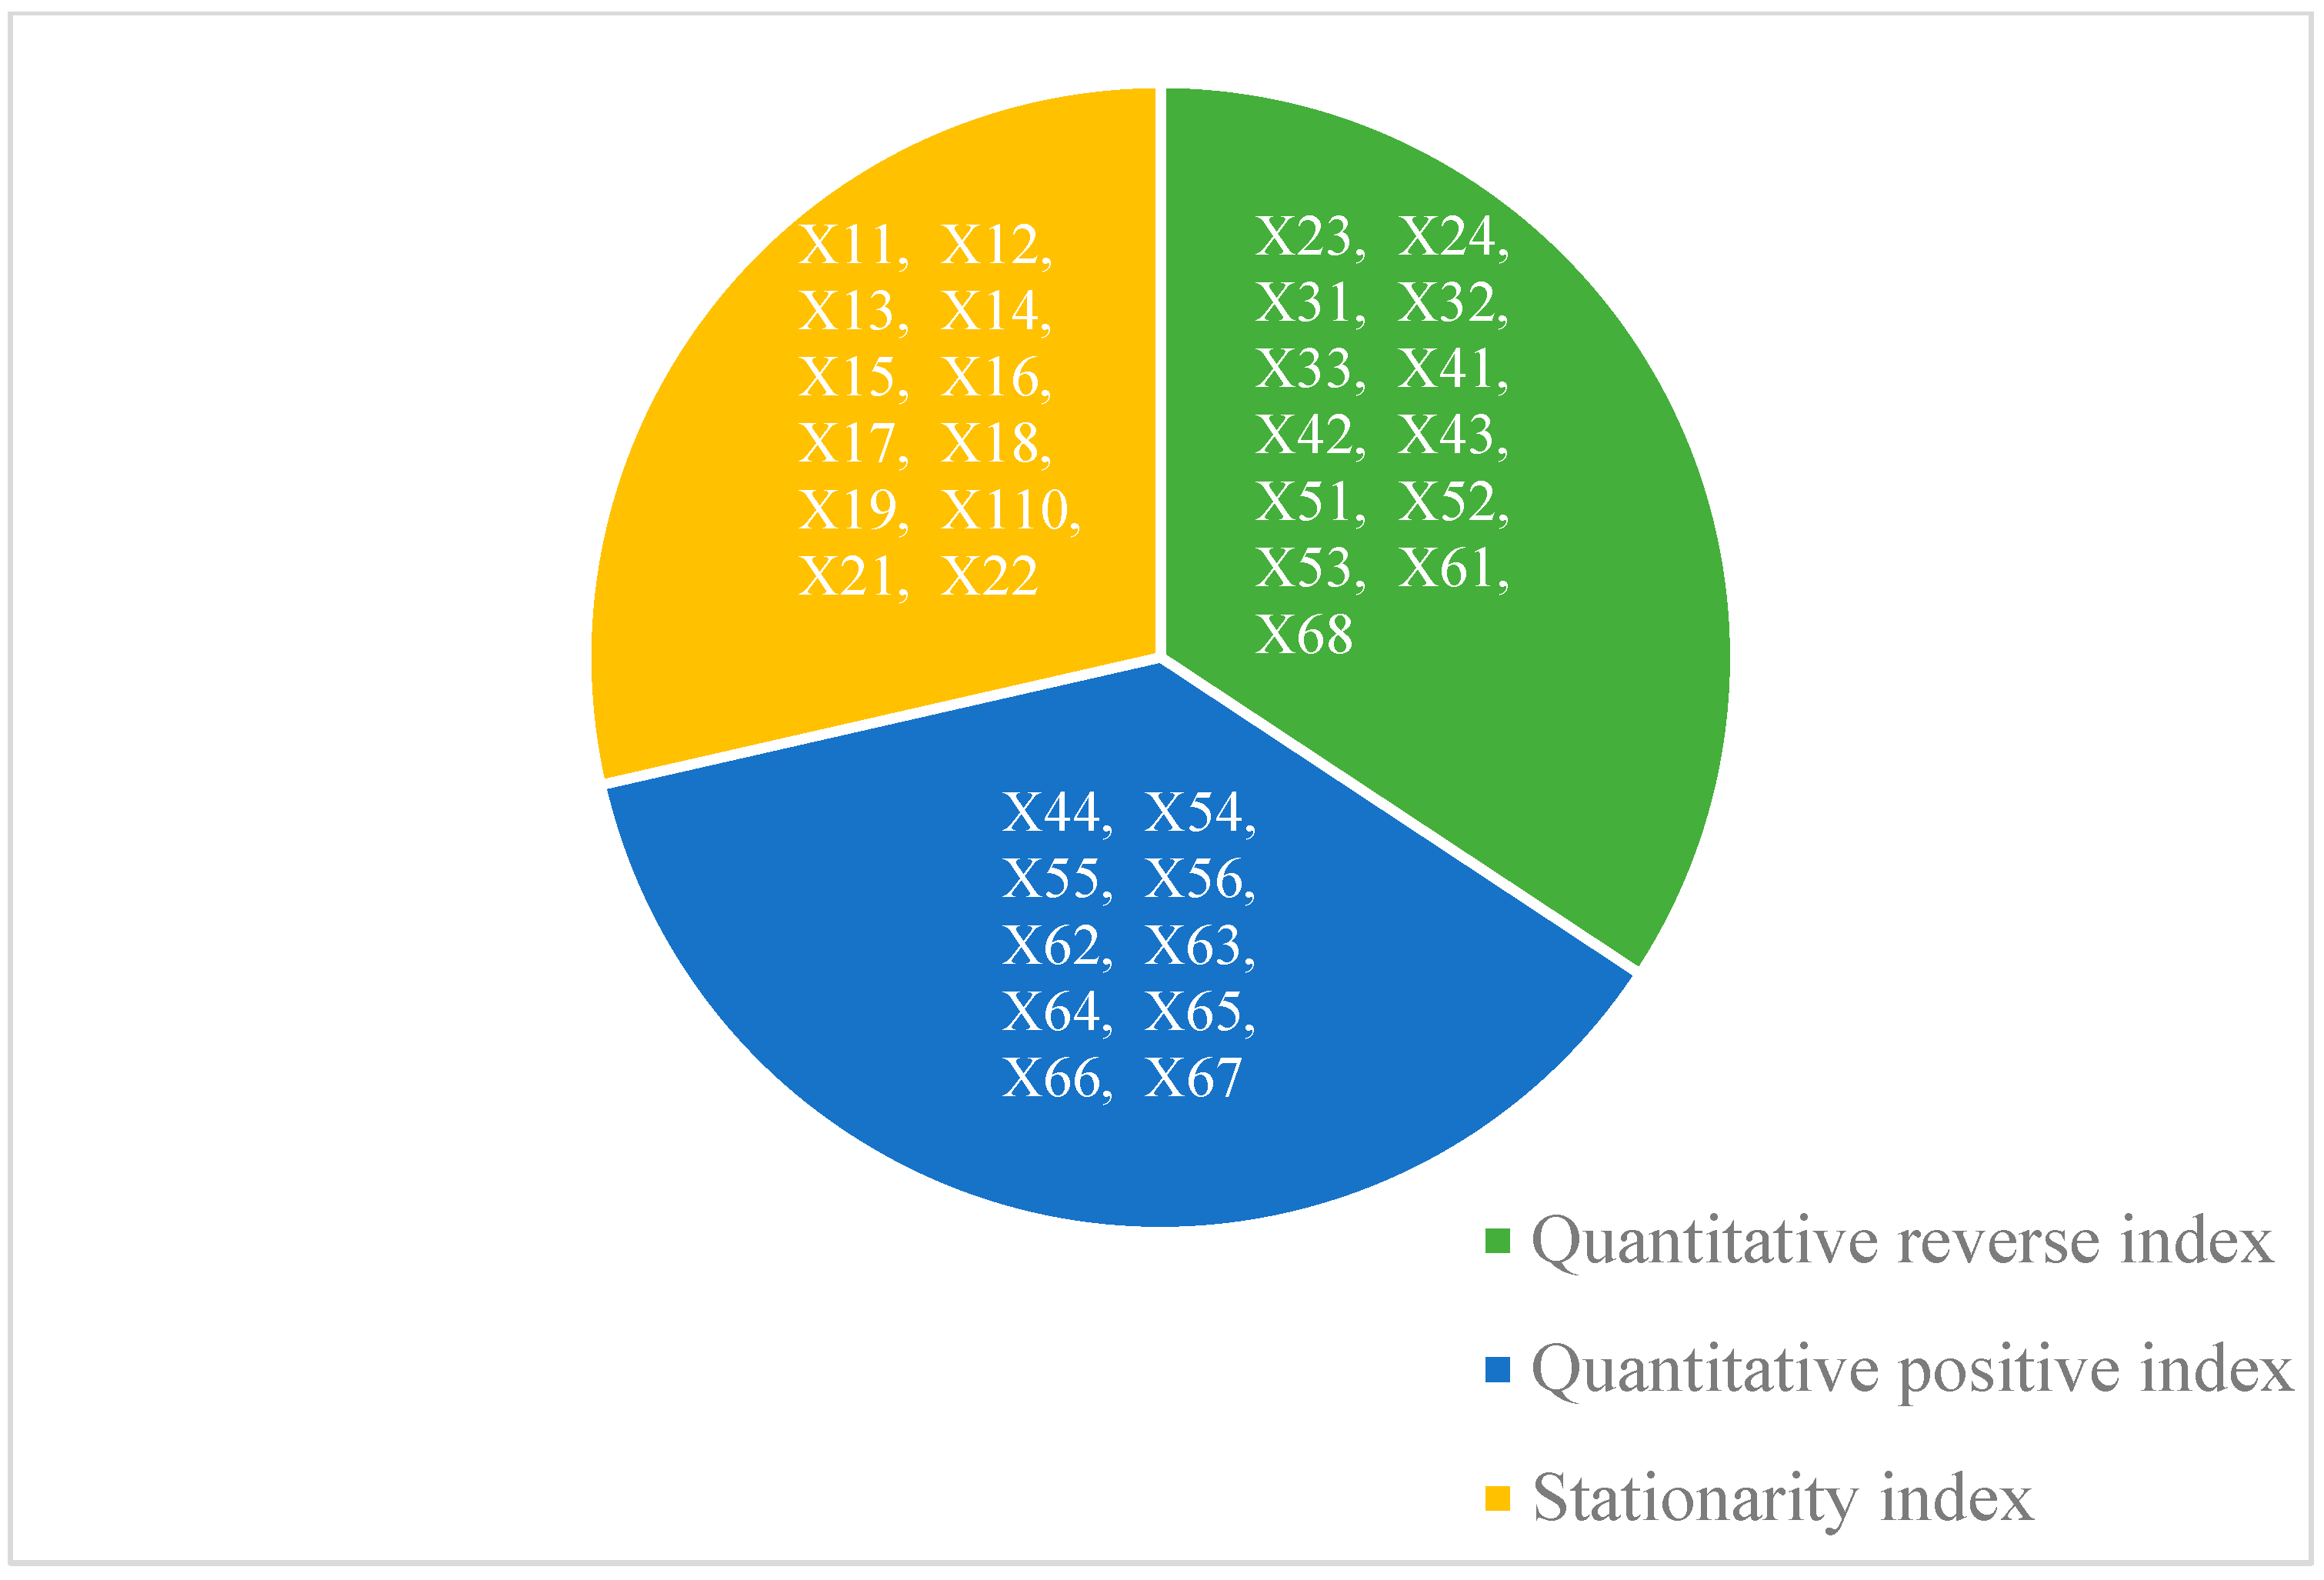
2.1.2. Screening of System Indicators
2.1.3. Determination of Index Reference Value
2.2. Fuzzy Analytic Hierarchy Process Based on Two-Tuple Linguistics
2.2.1. Establishments of Weight
2.2.2. Fuzzy Comprehensive Evaluation
2.2.3. Two-Tuple Semantics
3. Cleaner Production Evaluation System for Industrial Park
3.1. Building Evaluation System
Evaluation Framework
3.2. Fuzzy Hierarchy Evaluation Model Based on Two-Tuple Linguistics
3.2.1. Evaluation Grade and Classification Standard of Cleaner Production
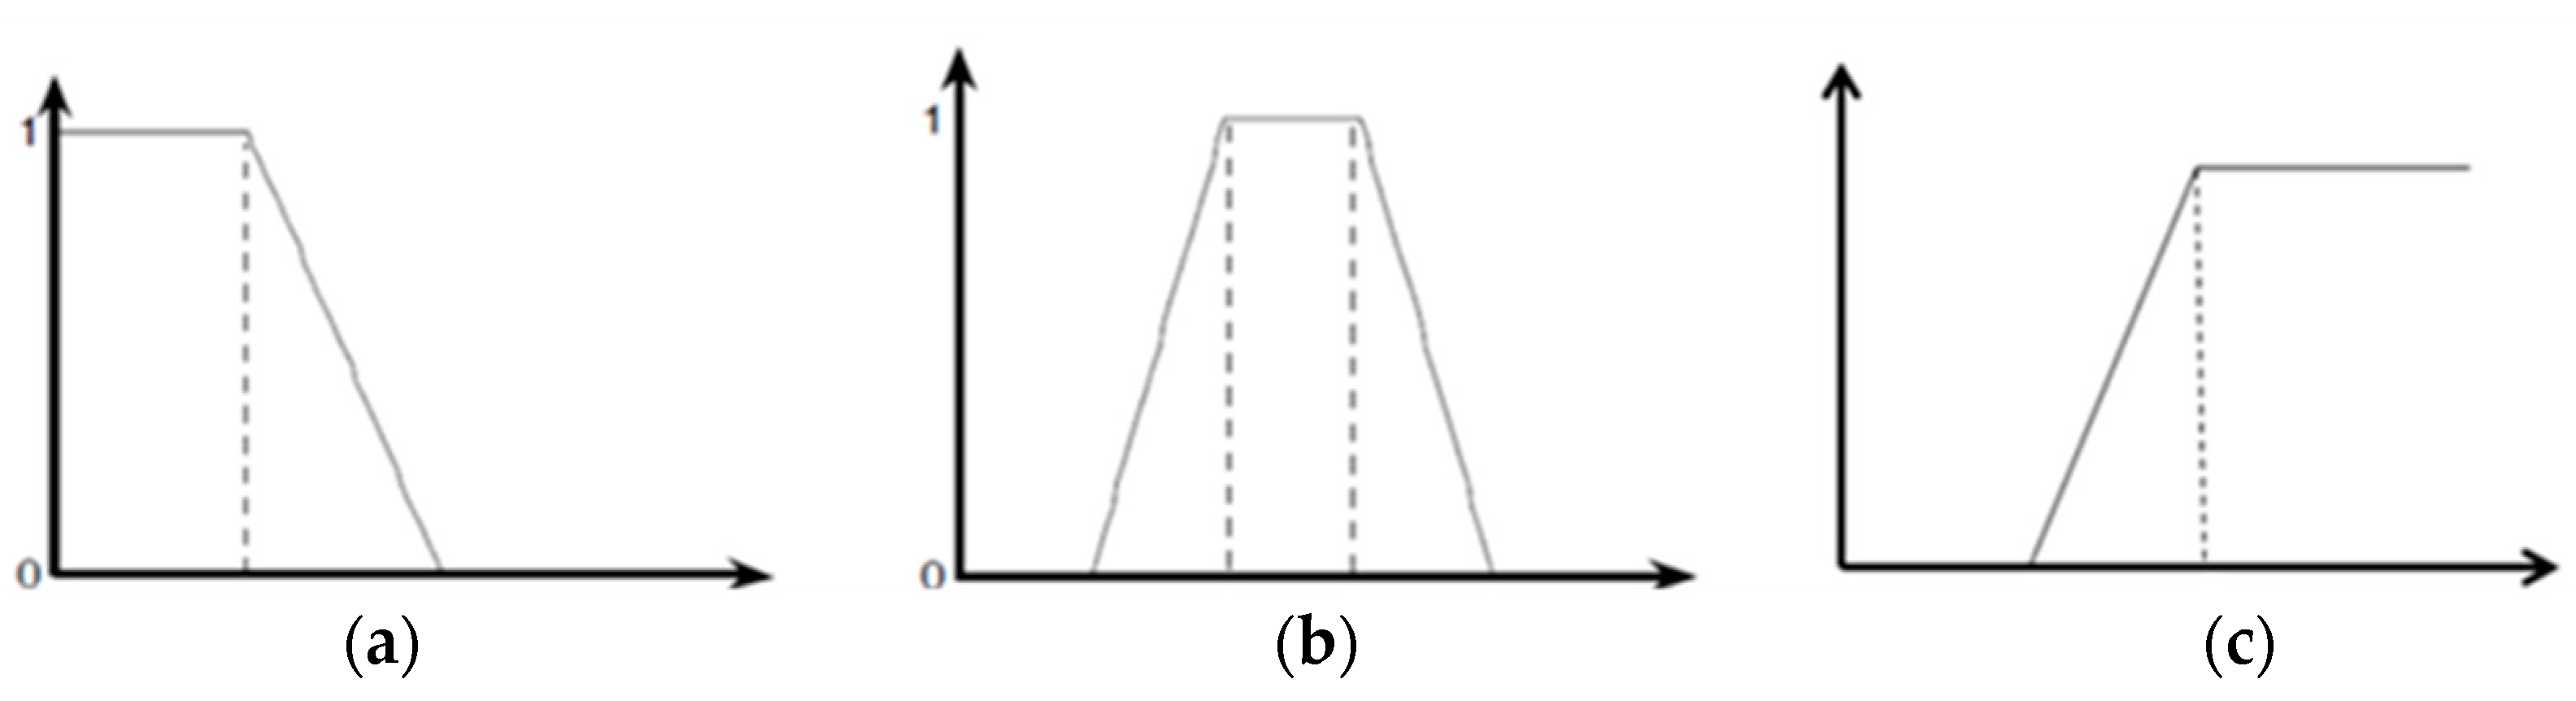
3.2.2. Grade Membership Function of Cleaner Production Evaluation Index
3.3. Comprehensive Application of Fuzzy Weighted Comprehensive Evaluation Method and Two-Tuple Linguistic Method
3.3.1. Fuzzy Comprehensive Model and Method of Cleaner Production Grade Evaluation
3.3.2. Binary Semantic Method of Cleaner Production Grade Evaluation
4. Case Study
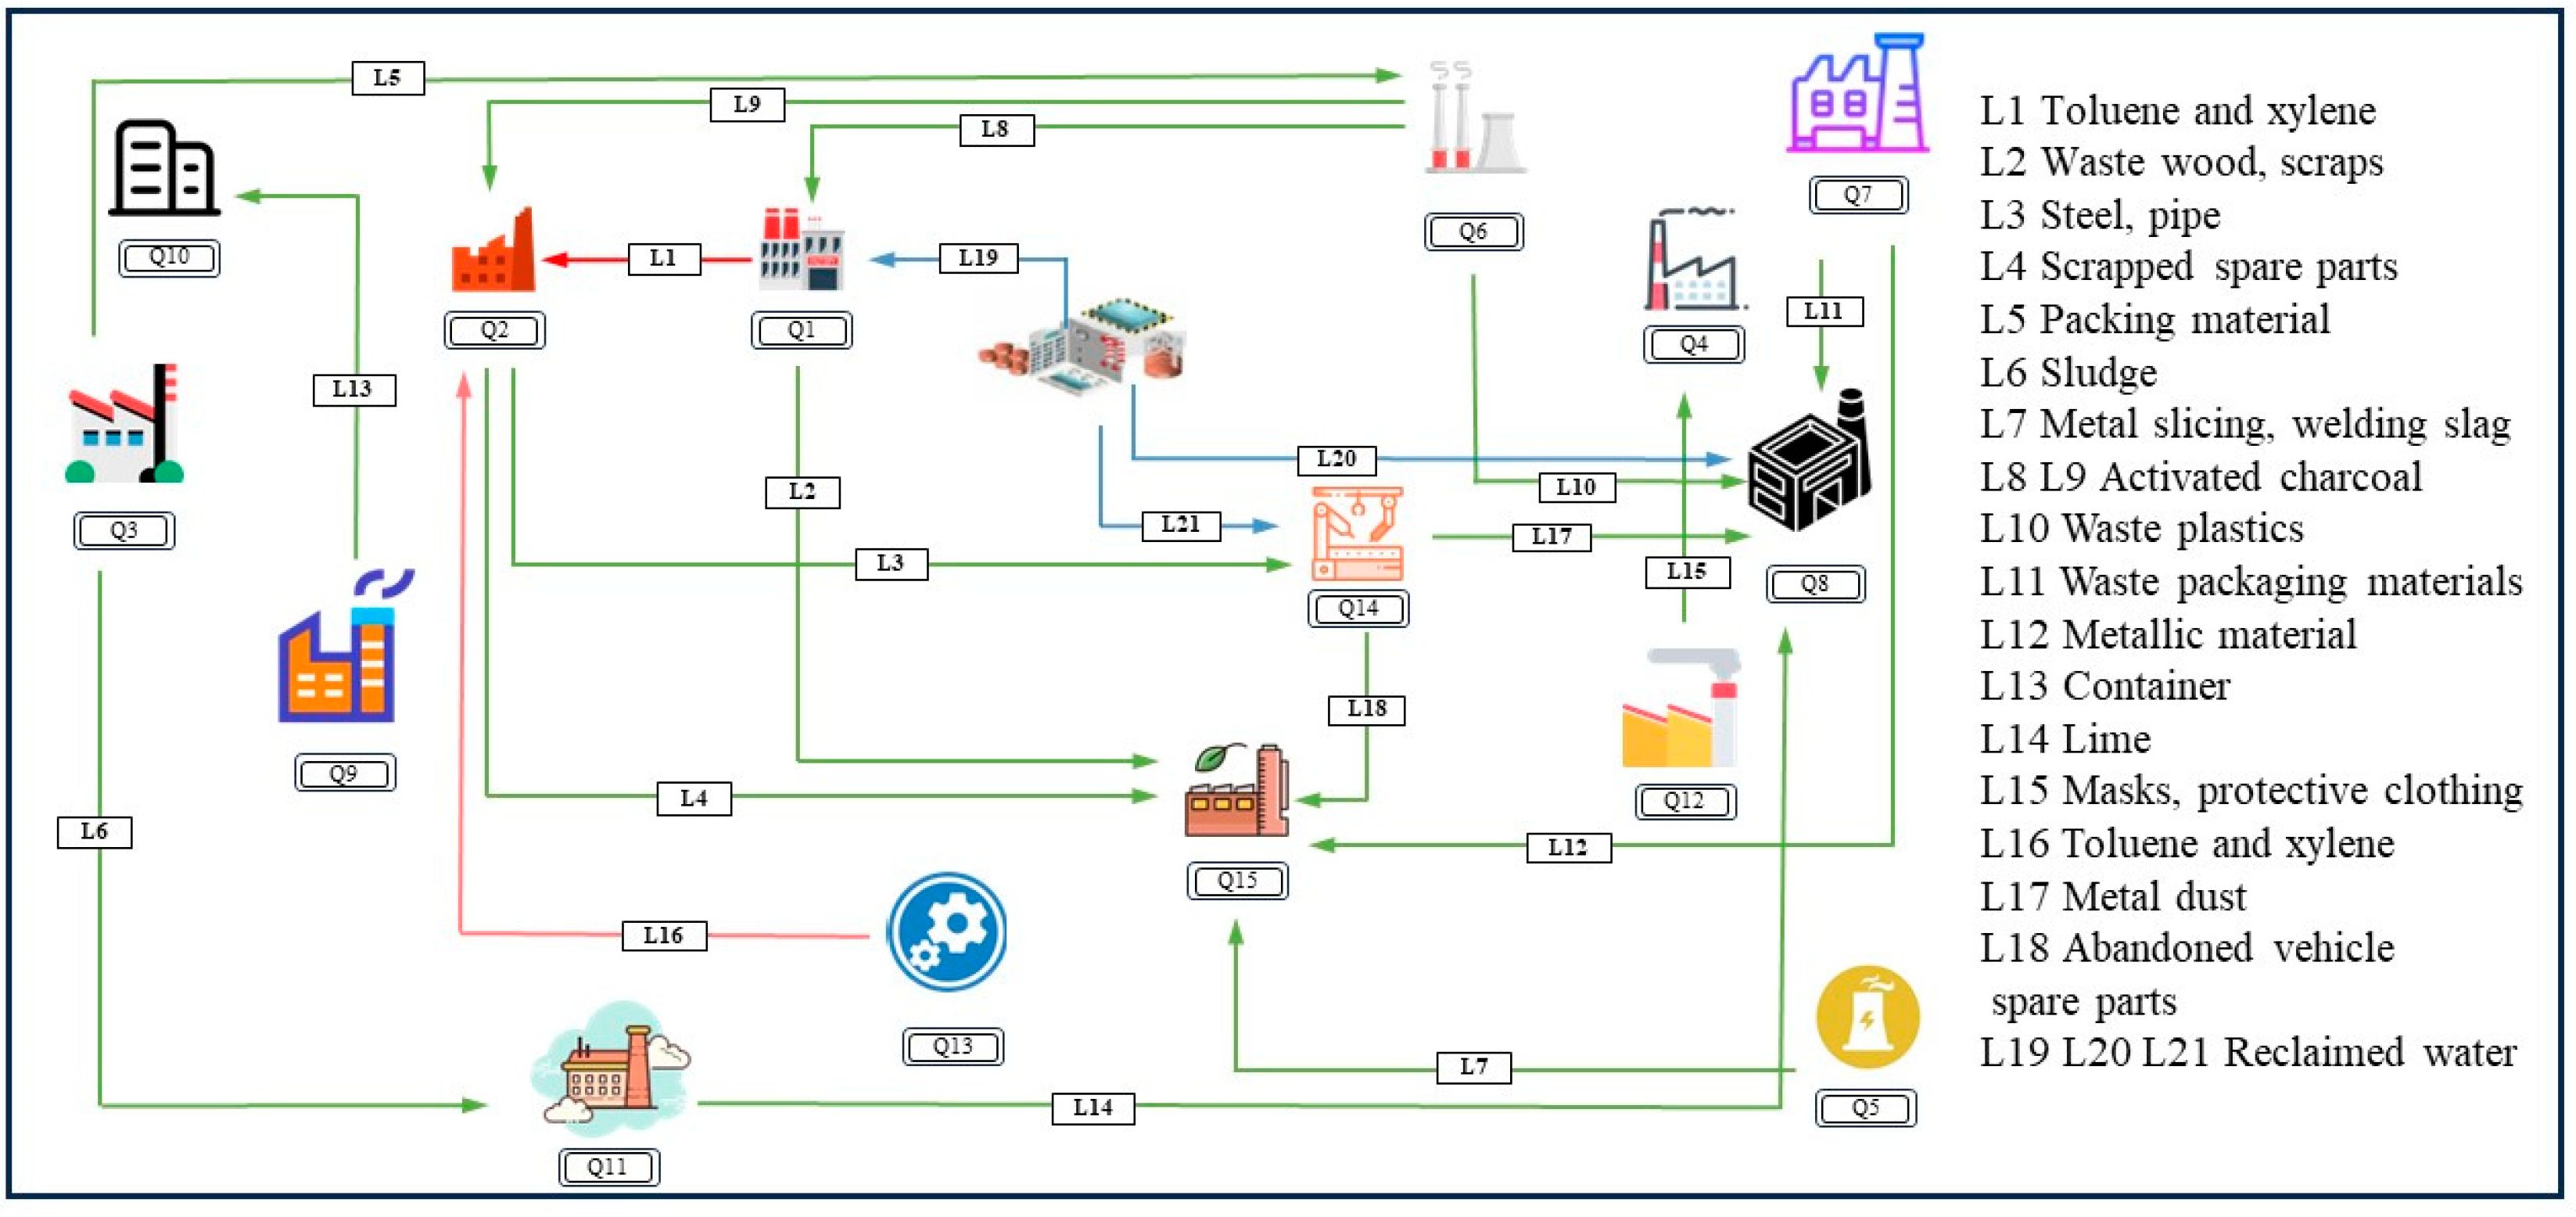
4.1. Basic Situation of Industrial Park
4.1.1. Research on the Current Situation of Industrial Park
4.1.2. Industrial Park Index Status Value
4.2. Evaluation of Cleaner Production Level in Industrial Park
4.3. Analysis and Suggestions for the Evaluation Results of Industrial Park G
4.3.1. Evaluation Results of Industrial Park G
4.3.2. Cleaner Production Recommendations
4.3.3. Industrial Park Green Low Carbon Cycle Development Plan
5. Discussion
6. Conclusions
Supplementary Materials
Author Contributions
Funding
Institutional Review Board Statement
Informed Consent Statement
Data Availability Statement
Conflicts of Interest
References
- Kim, T.-H.; Jeong, Y.-S. Analysis of Energy-Related Greenhouse Gas Emission in the Korea’s Building Sector: Use National Energy Statistics. Energies 2018, 11, 855. [Google Scholar] [CrossRef]
- Shan, Y.; Huang, Q.; Guan, D.; Hubacek, K. China CO2 emission accounts 2016–2017. Sci. Data 2020, 7, 54. [Google Scholar] [CrossRef] [PubMed]
- Yuan, X.; Jin, S.; Zhang, H. Optimal Green Technology Choice for Firms under an Emission Trading Scheme: End-of-Pipe vs. Cleaner Production. Sustainability 2023, 15, 16311. [Google Scholar] [CrossRef]
- Lopes, J.; Medeiros, D.L.; Kiperstok, A. Combining cleaner production and life cycle assessment for reducing the environmental impacts of irrigated carrot production in Brazilian semi-arid region. J. Clean. Prod. 2018, 170, 924–939. [Google Scholar] [CrossRef]
- Xiong, W.; Liu, L.; Xiong, M. Application of gray correlation analysis for cleaner production. Clean Technol. Environ. Policy 2010, 12, 401–405. [Google Scholar] [CrossRef]
- Fresner, J.; Jantschgi, J.; Birkel, S.; Baernthaler, J.; Krenn, C. The theory of inventive problem solving (TRIZ) as option generation tool within cleaner production projects. J. Clean. Prod. 2010, 18, 128–136. [Google Scholar] [CrossRef]
- Zhang, P.; Duan, N.; Dan, Z.; Shi, F.; Wang, H. An understandable and practicable cleaner production assessment model. J. Clean. Prod. 2018, 187, 1094–1102. [Google Scholar] [CrossRef]
- Li, Y.; Ma, C. Circular economy of a papermaking park in China: A case study. J. Clean. Prod. 2015, 92, 65–74. [Google Scholar] [CrossRef]
- Liu, X.; Zhou, C.; Ren, H.; Wang, X.; Zhong, L.; Li, N. Progress and Suggestions of Promoting Cleaner Production Audit in Industrial Parks. Chin. J. Environ. Manag. 2022, 3, 30–37. [Google Scholar] [CrossRef]
- Kim, H. Changes in Policies and Studies in Relation to Industrial Parks in China. J. Int. Area Stud. 2022, 26, 203–226. [Google Scholar] [CrossRef]
- Ye, C.; Li, S.; Zhuang, L.; Zhu, X. A comparison and case analysis between domestic and overseas industrial parks of China since the Belt and Road Initiative. J. Geogr. Sci. 2020, 30, 1266–1282. [Google Scholar] [CrossRef]
- He, Y.; Zhu, Z.; Xie, H.; Zhang, X.; Sheng, M. A case study in China of the influence mechanism of industrial park efficiency using DEA. Environ. Dev. Sustain. 2023, 25, 7261–7280. [Google Scholar] [CrossRef]
- Yao, W.; Bin, L.; Bo, Z.; Ling, X.; Lei, J.; Xia, M.X. Framework and Key Points of Industrial Park Cleaner Production Audit. Sichuan Environ. 2017, 36, 17–21. (In Chinese) [Google Scholar] [CrossRef]
- Liu, Z.; Dang, C.G.; Li, Z.; Wang, P.; Yuan, Y.; Liu, J.; Zhou, Q.; Zhou, C. Analysis on the Framework of Cleaner Production in Industrial Parks under the New Situation of Environmental Protection. Environ. Prot. 2017, 45, 60–65. (In Chinese) [Google Scholar] [CrossRef]
- Cong, W.; Shi, L. Heterogeneity of industrial development and evolution of cleaner production: Bibliometric analysis based on JCLP. J. Clean. Prod. 2019, 212, 822–836. [Google Scholar] [CrossRef]
- Guo, Y.; Tian, J.; Chen, L. Managing energy infrastructure to decarbonize industrial parks in China. Nat. Commun. 2020, 11, 981. [Google Scholar] [CrossRef] [PubMed]
- Bai, S.-W.; Zhang, J.-S.; Wang, Z. A methodology for evaluating cleaner production in the stone processing industry: Case study of a Shandong stone processing firm. J. Clean. Prod. 2015, 102, 461–476. [Google Scholar] [CrossRef]
- Timmerman, J.; Vandevelde, L.; Van Eetvelde, G. Towards low carbon business park energy systems: Classification of techno-economic energy models. Energy 2014, 75, 68–80. [Google Scholar] [CrossRef]
- Bao, J.; Zhang, J.; Shi, S.; Johansson, J. Cleaner production assessment of group company based on improved AHP and grey relational analysis. J. Intell. Fuzzy Syst. 2018, 35, 439–444. [Google Scholar] [CrossRef]
- Zhao, H.; Zhao, H.; Guo, S. Evaluating the comprehensive benefit of eco-industrial parks by employing multi -criteria decision making approach for circular economy. J. Clean. Prod. 2017, 142, 2262–2276. [Google Scholar] [CrossRef]
- Hong, H.; Gasparatos, A. Eco-industrial parks in China: Key institutional aspects, sustainability impacts, and implementation challenges. J. Clean. Prod. 2020, 274, 122853. [Google Scholar] [CrossRef]
- Wu, W.; Ding, K. Optimization Strategy for Parks and Green Spaces in Shenyang City: Improving the Supply Quality and Accessibility. Int. J. Environ. Res. Public Health 2022, 19, 4443. [Google Scholar] [CrossRef] [PubMed]
- Song, Z.; Gao, H.; Liu, W.; Li, L.; Zhang, W.; Wang, D. Systematic assessment of dredged sludge dewaterability improvement with different organic polymers based on analytic hierarchy process. J. Environ. Sci. 2021, 103, 311–321. [Google Scholar] [CrossRef]
- Li, S.; Wang, B. Research on Evaluating Algorithms for the Service Quality of Wireless Sensor Networks Based on Interval-Valued Intuitionistic Fuzzy EDAS and CRITIC Methods. Math. Probl. Eng. 2020, 2020, 5391940. [Google Scholar] [CrossRef]
- He, Z.; Li, M.; Cai, Z.; Zhao, R.; Hong, T.; Yang, Z.; Zhang, Z. Optimal irrigation and fertilizer amounts based on multi-level fuzzy comprehensive evaluation of yield, growth and fruit quality on cherry tomato. Agric. Water Manag. 2021, 243, 106360. [Google Scholar] [CrossRef]
- Eliche-Quesada, D.; Corpas-Iglesias, F.A.; Perez-Villarejo, L.; Iglesias-Godino, F.J. Recycling of sawdust, spent earth from oil filtration, compost and marble residues for brick manufacturing. Constr. Build. Mater. 2012, 34, 275–284. [Google Scholar] [CrossRef]
- Singh, A.P.; Chakrabarti, S.; Kumar, S.; Singh, A. Assessment of air quality in Haora River basin using fuzzy multiple-attribute decision making techniques. Environ. Monit. Assess. 2017, 189, 373. [Google Scholar] [CrossRef]
- Chang, Y.; Wu, X.; Chen, G.; Ye, J.; Chen, B.; Xu, L.; Zhou, J.; Yin, Z.; Ren, K. Comprehensive risk assessment of deepwater drilling riser using fuzzy Petri net model. Process Saf. Environ. Prot. 2018, 117, 483–497. [Google Scholar] [CrossRef]
- Fu, S.; Gu, S.; Zhang, Y.; Zhang, M.; Weng, J. Towards system-theoretic risk management for maritime transportation systems: A case study of the yangtze river estuary. Ocean Eng. 2023, 286, 115637. [Google Scholar] [CrossRef]
- Saha, S.; Gayen, A.; Pourghasemi, H.R.; Tiefenbacher, J.P. Identification of soil erosion-susceptible areas using fuzzy logic and analytical hierarchy process modeling in an agricultural watershed of Burdwan district, India. Environ. Earth Sci. 2019, 78, 649. [Google Scholar] [CrossRef]
- Zhou, M.; Zheng, Y.-Q.; Chen, Y.-W.; Cheng, B.-Y.; Herrera-Viedma, E.; Wu, J. A large-scale group consensus reaching approach considering self-confidence with two-tuple linguistic trust/distrust relationship and its application in life cycle sustainability assessment. Inf. Fusion 2023, 94, 181–199. [Google Scholar] [CrossRef]
- Zhang, B.; Li, C.-C.; Dong, Y.; Pedrycz, W. A Comparative Study Between Analytic Hierarchy Process and Its Fuzzy Variants: A Perspective Based on Two Linguistic Models. Ieee Trans. Fuzzy Syst. 2021, 29, 3270–3279. [Google Scholar] [CrossRef]
- Samonto, S.; Kar, S.; Pal, S.; Sekh, A.A.; Castillo, O.; Park, G.-K. Best fit membership function for designing fuzzy logic controller aided intelligent overcurrent fault protection scheme. Int. Trans. Electr. Energy Syst. 2021, 31, e12875. [Google Scholar] [CrossRef]
- Hasuike, T.; Katagiri, H. An objective formulation of membership function based on fuzzy entropy and pairwise comparison. J. Intell. Fuzzy Syst. 2017, 32, 4443–4452. [Google Scholar] [CrossRef]
- Zheng, G.; Zhu, N.; Tian, Z.; Chen, Y.; Sun, B. Application of a trapezoidal fuzzy AHP method for work safety evaluation and early warning rating of hot and humid environments. Saf. Sci. 2012, 50, 228–239. [Google Scholar] [CrossRef]
- Ashraf, S.; Abdullah, S.; Mahmood, T.; Aslam, M. Cleaner Production Evaluation in Gold Mines Using Novel Distance Measure Method with Cubic Picture Fuzzy Numbers. Int. J. Fuzzy Syst. 2019, 21, 2448–2461. [Google Scholar] [CrossRef]
- Yu, X.; Zheng, H.; Sun, L.; Shan, Y. An emissions accounting framework for industrial parks in China. J. Clean. Prod. 2020, 244, 118712. [Google Scholar] [CrossRef]
- Lyu, Y.; Gao, H.; Yan, K.; Liu, Y.; Tian, J.; Chen, L.; Wan, M. Carbon peaking strategies for industrial parks: Model development and applications in China. Appl. Energy 2022, 322, 119442. [Google Scholar] [CrossRef]
- Kim, H.-W.; Ohnishi, S.; Fujii, M.; Fujita, T.; Park, H.-S. Evaluation and Allocation of Greenhouse Gas Reductions in Industrial Symbiosis. J. Ind. Ecol. 2018, 22, 275–287. [Google Scholar] [CrossRef]
- Ranson, M.; Stavins, R.N. Linkage of greenhouse gas emissions trading systems: Learning from experience. Clim. Policy 2016, 16, 284–300. [Google Scholar] [CrossRef]
- Guan, D.; Meng, J.; Reiner, D.M.; Zhang, N.; Shan, Y.; Mi, Z.; Shao, S.; Liu, Z.; Zhang, Q.; Davis, S.J. Structural decline in China’s CO2 emissions through transitions in industry and energy systems. Nat. Geosci. 2018, 11, 551–555. [Google Scholar] [CrossRef]
- Giannetti, B.F.; Agostinho, F.; Eras, J.J.C.; Yang, Z.; Almeida, C.M.V.B. Cleaner production for achieving the sustainable development goals. J. Clean. Prod. 2020, 271, 122127. [Google Scholar] [CrossRef]


| Index | Current Value | Index | Current Value |
|---|---|---|---|
| Volatile organic compound emissions | 298 t/a | Industrial land area | 3.89 km2 |
| Sulfur dioxide emission | 264 t/a | Clean energy consumption | 14,580 tec/a |
| Nitrogen dioxide emissions | 298 t/a | Comprehensive utilization of industrial solid waste | 2154 t/a |
| Carbon emissions | 141 t/a | Reuse of industrial water | 379,820 m3/a |
| Particulate emissions | 130 t/a | The leading industry output value of the park | 22.70 million US dollars |
| Wastewater discharge | 17,240 m3/a | The added value of tertiary industry in the park | 4.02 billion US dollars |
| Chemical oxygen demand emissions | 342 t/a | Greening area of the park | 12.43% |
| Ammonia nitrogen emissions | 34.2 t/a | Park environmental protection investment | 1.55 billion US dollars |
| The amount of solid waste generated | 2154 t/a | Centralized treatment capacity of industrial wastewater in industrial park | 17,240 m3/a |
| Noise emission intensity of factory boundary | 52.5 dB | Cleaner production audit rate of key enterprises in the park | 100% |
| Overall energy consumption | 51,720 tec/a | Investigate the public’s satisfaction rate of the park environment | 90% |
| Water consumption | 474,100 m3/a |
| First-Grade Indexes | Second-Grade Indexes | Unit | Actuality Value |
|---|---|---|---|
| X1 Pollutant discharge index | X11 | kg/million dollars | 14.2617 |
| X12 | kg/million dollars | 11.0086 | |
| X13 | kg/million dollars | 12.4263 | |
| X14 | kg/million dollars | 5.8770 | |
| X15 | kg/million dollars | 5.4212 | |
| X16 | t/million dollars | 0.7189 | |
| X17 | kg/million dollars | 14.2617 | |
| X18 | kg/million dollars | 1.4263 | |
| X19 | t/million dollars | 0.0899 | |
| X110 | dB | 52.5000 | |
| X2 Indicators of resource and energy consumption | X21 | tec/million dollars | 2.1567 |
| X22 | t/million dollars | 19.7699 | |
| X23 | billion dollars/km2 | 1.5414 | |
| X24 | % | 28.1903 | |
| X3 Indicators of comprehensive utilization of resources | X31 | % | 100.0000 |
| X32 | % | 80.0000 | |
| X33 | % | — | |
| X4 Industrial cleanliness index | X41 | % | 85.0000 |
| X42 | % | 15.0812 | |
| X43 | / | 0.0625 | |
| X44 | % | Level I | |
| X5 Infrastructure improvement indicators | X51 | % | 12.4300 |
| X52 | % | 5.8000 | |
| X53 | % | 100.0000 | |
| X54 | / | Level II | |
| X55 | / | Level I | |
| X56 | / | Level III | |
| X6 Cleaner production management indicators | X61 | % | 100.0000 |
| X62 | / | Level I | |
| X63 | / | Level I | |
| X64 | / | Level II | |
| X65 | / | Level II | |
| X66 | / | Level III | |
| X67 | / | Level II | |
| X68 | % | 90.0000 |
Disclaimer/Publisher’s Note: The statements, opinions and data contained in all publications are solely those of the individual author(s) and contributor(s) and not of MDPI and/or the editor(s). MDPI and/or the editor(s) disclaim responsibility for any injury to people or property resulting from any ideas, methods, instructions or products referred to in the content. |
© 2024 by the authors. Licensee MDPI, Basel, Switzerland. This article is an open access article distributed under the terms and conditions of the Creative Commons Attribution (CC BY) license (https://creativecommons.org/licenses/by/4.0/).
Share and Cite
Li, Z.; Ding, J.; Tao, T.; Wang, S.; Pi, K.; Xiong, W. Novel Evaluation Method for Cleaner Production Audit in Industrial Parks: Case of a Park in Central China. Sustainability 2024, 16, 2330. https://doi.org/10.3390/su16062330
Li Z, Ding J, Tao T, Wang S, Pi K, Xiong W. Novel Evaluation Method for Cleaner Production Audit in Industrial Parks: Case of a Park in Central China. Sustainability. 2024; 16(6):2330. https://doi.org/10.3390/su16062330
Chicago/Turabian StyleLi, Zhu, Jianhe Ding, Tianqi Tao, Shulian Wang, Kewu Pi, and Wen Xiong. 2024. "Novel Evaluation Method for Cleaner Production Audit in Industrial Parks: Case of a Park in Central China" Sustainability 16, no. 6: 2330. https://doi.org/10.3390/su16062330
APA StyleLi, Z., Ding, J., Tao, T., Wang, S., Pi, K., & Xiong, W. (2024). Novel Evaluation Method for Cleaner Production Audit in Industrial Parks: Case of a Park in Central China. Sustainability, 16(6), 2330. https://doi.org/10.3390/su16062330