Abstract
The European Union (EU) has placed a strong focus on soil contamination and remediation in its Thematic Strategy for Soil Protection, emphasizing the critical need for comprehensive soil data at the EU level. To effectively support EU soil management strategies, it is necessary to develop soil-related indicators and standardized datasets across all EU member states. However, the lack of standardized methodologies for estimating the time required for contaminated site remediation is a dilemma in Italy and throughout Europe. This study examines statistical data on the time-consuming nature of the contaminated site remediation process in Italy. In fact, early intervention not only simplifies site remediation but also reduces long-term financial obligations such as monitoring costs and potential legal implications. This study categorized data according to remedial procedures, explored different management phases, and revealed different timescales for completing the procedure. The findings show that processes completed after preliminary investigations are often shorter in time than those completed following conceptual model assessments. In contrast, processes that require corrective measures typically take a longer period of time to complete. Notably, remedial interventions tend to have a shorter duration compared to risk management interventions. Furthermore, procedures that address both soil and groundwater contamination generally require more time compared to those that focus only on soil remediation. This study provides valuable insight into the time-consuming aspects of remediation procedures, recommending potential changes to regulatory frameworks to accelerate site remediation activities.
1. Introduction
Soil is crucial for the production of food, fiber, fuels, climate control, and water supply [1]. However, many businesses are unaware of the relationship between soil health and economic performance. Soil degradation can lead to pollution, mainly from agricultural and industrial activities. Compared to water or air, the soil tends to be a more prolonged habitation for pollutants [2,3,4]. Soil acts as a sink or filter, allowing contaminants to be absorbed quickly but disintegrate slowly [3,4,5,6]. Soil degradation has a negative impact on regional and global economies, climate change, and economic expansion by reducing soil water storage capacity and releasing inappropriate carbon [7,8,9,10,11,12,13,14], as shown in Figure 1. Contaminated land hinders economic expansion, reduces real estate prices, and reduces the attractiveness of municipalities owing to the release of harmful substances into the soil, air, and water [15,16,17].
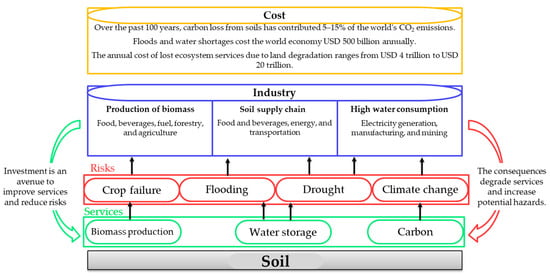
Figure 1.
Interrelation of soil, environment, and economy.
1.1. Soil Remediation
The “Green and Sustainable Remediation” (GSR) movement is a sustainable approach to soil remediation, incorporating environmental, social, economic, and technological sectors in the decision-making process [18]. GSR aims to minimize contamination risks while balancing community objectives, economic implications, and net environmental impacts [19,20]. It has evolved as a valuable strategy for optimizing all stages of site remediation, from site identification to project completion [21,22,23,24,25]. Technological screening is based on environmental and socioeconomic sustainability, and sustainable remediation projects require a thorough assessment of risk and site features [26,27,28]. In the European Union, there were around 2.8 million potentially contaminated sites in 2022 [29,30,31,32,33], highlighting the need for remediation due to its environmental, human health, and economic implications. Time is crucial for reducing threats, adhering to legal requirements, managing liabilities, limiting expenses, and improving property values [34]. Early identification and response lead to better and more sustainable outcomes for both the environment and the affected areas [35,36]. However, there are currently no global rules for soil regulation, exacerbated by a lack of regulation. The European Commission proposed a new soil-monitoring law in 2023 to conserve and restore soil while ensuring sustainable utilization [37,38,39,40]. The law is expected to set the EU on a road towards healthy soil by 2050 [39,41].
1.2. Legal Framework on Contaminated Site Management in Italy
The EU requires member states to regulate emissions from industrial operations through the national implementation of policies such as the Seveso Directive, the Industrial Emission Directive, and the Waste Framework Directive [42,43,44,45,46,47]. Italian legislation on contaminated sites has evolved over time, with the introduction of laws in 1986 and 1989. However, the core idea of a contaminated site has vanished, providing no genuine push for regeneration.
Italian legislation on Contaminated Sites Management was introduced with Ministerial Decree n. 471/99 (DM 471/99) and was significantly modified by Legislative Decree 152/06 (DLgs 152/06), which is still in force. DM 471/99 sets concentration limit values (CLA) for soil/subsoil and groundwater, and if these values are exceeded, the site is defined as contaminated [48,49]. Legislative Decree n. 152/06 sets screening values (CSCs) for soil/subsoil and groundwater; if the CSC is exceeded, the site is identified as potentially contaminated.
The competent authority for the administrative management of contaminated site procedures is usually the region, except for procedures within 42 sites of national interest (SINs), where the Ministry of Environment and Energy Security is responsible. The management of a region at the local level can be delegated to the relevant province or municipality.
Article 242 of Legislative Decree 152/06 sets the sequence of steps in the ordinary management procedure and the timing for each step (Table 1). Public authorities are accountable for the approval of technical documents, such as the characterization plan, site-specific risk assessment, remedial intervention projects, and certification of completed interventions.

Table 1.
Timescales relating to each step of the ordinary management procedure set by Article 242 of Legislative Decree 152/06.
1.3. Contaminated Site Management Steps in Italy
The procedure for managing contaminated sites involves communicating potential contamination to authorities and adopting measures to prevent or minimize threats to health or the environment. A preliminary investigation is necessary to assess whether a contamination event caused contamination. If no exceedance of the CSC is reported, the site is declared non-contaminated. Non-contaminated sites complete the administrative procedure without further action. Potentially contaminated sites undergo further investigation and site-specific risk assessment to verify if the site poses a risk to human health or the environment and to establish remediation targets. At recognized contaminated sites, one of three actions is required: remediation, permanent safety measures (MISPs), and operational safety measures (MISOs). A combination of these intervention types may be useful for specific needs in contaminated-site management. Once the remedial interventions are completed, the control body verifies the implementation and achievement of the reclamation objectives. Upon successful verification, a technical report is prepared, and a certificate of successful reclamation is issued by the province, concluding the overall management procedure.
DLgs 152/06 offers simplified procedures for specific sites, such as Articles 249 and 242bis, which simplify the management process by reducing the number of steps required and give the flexibility to forego the site-specific risk assessment and establish the remediation target as the CSC.
The management procedure can be divided into three main stages: notification, conceptual modelling, and intervention. The notification includes the initial steps of the administrative procedure, the conceptual model focuses on site characterization and risk assessment, and the intervention covers the actual remediation process and certification.
1.4. National Register on Contaminated Sites in Italy
MOSAICO is the national register of contaminated sites in Italy, containing data on administrative, geographic, and technical information related to management procedures. It was first populated in 2021 with data updated to 31 December 2020 [50]. MOSAICO contains all administrative procedures collected in regional registers according to Legislative Decree n. 152/06, including those that started and/or were completed under previous legislation. The total number of procedures recorded in MOSAICO was 33,222, with 15,072 ongoing and 18,150 completed procedures. Within the completed procedures, 8023 procedures (44% of the total amount) had reliable information on the start and end dates of the administrative management, allowing for the analysis of the time duration of site management. The timing of the remediation processes is crucial for environmental and health considerations, effectiveness, and cost-effectiveness. This article presents a study based on Italian legislation using MOSAICO to statistically analyze the time required for each procedure to conclude the remediation process. It also provides a comprehensive framework of remediation regulations for Italian contaminated sites and determines their efficacy in practical implementation.
2. Materials and Methods
This study includes a comprehensive analysis of the time duration of contaminated site management procedures, considering both completed and ongoing procedures.
The evaluation at the national level was conducted utilizing a dataset consisting of 8023 completed procedures recorded in MOSAICO. The dataset was assessed concerning several key factors: (i) the management stage in which closure occurred (notification, conceptual model, intervention); (ii) the type of procedure (previous or current legislation, and, for the latter, ordinary or simplified procedures); (iii) the competent authority responsible for the administrative process (region, province, municipality); (iv) the environmental media affected (soil/subsoil, groundwater, or both) for sites where interventions had been completed; and (v) the soil target concentration (CLA/CSC, CSR) for sites where interventions limited to soil/subsoil had been completed (i.e., groundwater was not affected by contamination).
The next part of this study focused on the province of Brescia in the Lombardy region of Italy. The province of Brescia has a history of industrial pollution stemming from some chemical industries that have operated since 1906 and were known for producing caustic soda and, later, PCBs (polychlorinated biphenyls) [51]. Subsequent environmental agency investigations verified the severe contamination, which designated those areas as polluted sites of national interest. Therefore, contaminated sites and remediation data of Brescia were analyzed in collaboration with the province of Brescia, the study of which consisted of 168 municipalities in question for a total of 609 procedures. The methodology of the present study for analyzing the times for remedial procedures was organized in several stages.
2.1. Timing of Reclamation Interventions at Sites
First, the number of procedures carried out under the legislation of D.M. 471/99 before 2006 and the procedures carried out under the legislation 152/2006 after 2006 were identified. In the second step, the obtained data were divided into two categories: the number of operations concluded and ongoing in each law to determine the present state of the proceedings. Furthermore, it was discovered that the type of proceedings varies depending on the type of contaminated site. Based on each proceeding, the total length of the completed process was identified in the province of Brescia and compared with regional- and national-level data.
2.2. Duration of the Intermediate Phases of the Remediation Process
This study focused on the precise length for each stage of the process after an overall review of the total time of the remedial processes investigated at the provincial level. In this phase, it was identified which process stages would require more time or create more problematic results for slowing down the process. Separate investigations were conducted:
- Ongoing procedures: To determine where the process was interrupted.
- Completed procedures: To identify the most critical phases that contributed to the overall operation slowness.
In both cases, the main stages were recognized (Figure 2), and their duration was calculated and analyzed.
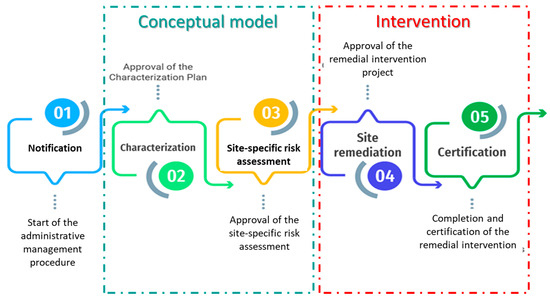
Figure 2.
The main stages of the ordinary management procedure set by Article 242 of Legislative Decree 152/06 for contaminated site management in Italy.
As already stated at the national level, the time duration of each step of the management procedure described in Table 1 is unknown; therefore, in this study, we performed this analysis only at the provincial level. Understanding how the duration of each management step affects the total time could provide suggestions to reduce the time spent on the overall management procedure.
2.3. Statistical Analysis
A statistical analysis was carried out on the dataset of 8023 completed procedures recorded in MOSAICO clustered into different classes (Table 2) based on six key factors: the method of conclusion of the procedure, the type of intervention, the type of procedure, the competent authority, the environmental matrix involved, and the remediation objective for the soil. Table 2 also provides all of the acronyms for each procedure used in the following text and figures.

Table 2.
Dataset for statistical analysis at the national level (* outliers are removed from the dataset).
All distributions were tested using data transformations, including LOG(X), SQRT(X), or 1/X, to assess their normality. The Mann–Whitney W test was performed to compare the medians of the distributions by analyzing pairs of samples. This test was constructed by combining two samples, sorting the data from smallest to largest, and comparing the mean ranks of the two samples in the combined data. A Kolmogorov–Smirnov test was also applied to compare the distributions of the two populations; the test is performed by computing the maximum distance between the cumulative distributions of two samples.
2.4. Critical Issues and Causes Found That Determine Changes to the Remediation Times
Common elements in each step that impacted the procedural time were discovered, and factors affecting phase delaying are reviewed in the Results and Discussion section.
3. Results and Discussion
3.1. Statistical Analysis at the National Level
In Table A1 (shown in Appendix A), summary statistics for each class are reported. The standardized skewness and standardized kurtosis, which are measures of population distribution shape, are found to be very high, pointing out that three populations heavily departed from a normal distribution. Indeed, the values of these statistics must be inside the range of −2 to +2 for normality.
3.1.1. Procedure Time Duration vs. Procedure Closure Mode
The first statistical analysis was performed on the complete dataset extracted from MOSAICO (8023 procedures) clustered into three classes according to the procedure closure mode (PCN, PCCM, PCI). The three classes followed non-parametric distribution. According to the Mann–Whitney W test, it was shown that no statistically significant difference between PCI and PCCM distribution was found, since the p-value was found to be 0.11, greater than 0.05, at a 95% confidence level. Conversely, the comparison between the medians of PCI and PCN distributions and the medians between PCN and PCCM distributions, both at the 95% confidence level, showed statistically significant differences with a p-value less than 0.05.
The PCN, PCCM, and PCI distributions are shown in Figure 3. Box plots represent the 25th and 75th percentiles (bottom and top of the box, respectively), while the inner line represents the median. The upper and lower whiskers of a box plot represent the inter-quartile range (IQR) multiplied by 1.5 above and below the 75th and 25th percentiles, respectively. Typically, whiskers aid in detecting outliers or data points that deviate considerably from the rest of the data. However, in our scenario, the locations (shown by circles) whose duration surpasses the whiskers do not qualify as outliers.
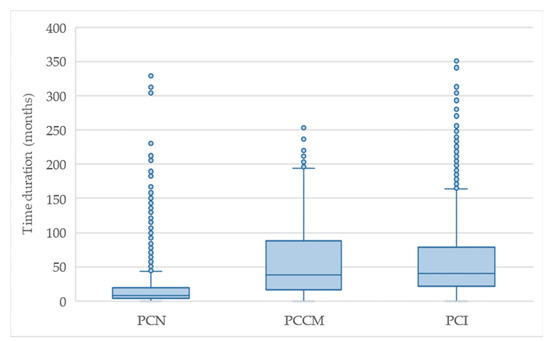
Figure 3.
Time duration for completed procedures in Italy according to closure modality: after notification without any further action (PCN), after conceptual model without any further intervention (PCCM), and after intervention (PCI).
In comparison to PCCM (38.3) and PCI (40.6), PCN’s median (in months) is 8.5, a much lower value. It is also true that PCN is closed after notification without any further action. Also, the lack of difference in timing between PCCM and PCI is found to be anomalous. In effect, the contaminated sites in Lombardy, which represent about 80% of the whole data population, showed an unusual behavior, since the PCCM was, on average, longer than PCI. The pattern of data distribution without the contaminated sites in Lombardy follows, instead, an expected order, with the PCCM timing being shorter than the PCI one. An in-depth study will be carried out in the future in order to understand the actual source of this trend.
3.1.2. Procedure Time Duration vs. Intervention Type
Another statistical analysis was performed on PCI. This population is divided into two classes (Table 2): PCIR (1749 sites) and PCIOMP (1200 sites). We applied the same statistical tests mentioned above, and, in this case, too, the obtained results showed no normal distributions and the absence of outliers.
The PCIR and PCIOMP medians (respectively 36.3 and 49.3 months; Figure 4) are statistically different (p-value less than 0.05) at the 95% confidence level; the difference is even more significant when comparing the 75th percentile (66.0 and 95.5 months). The PCIR duration distribution (percentiles) is systematically lower than PCIOMP. According to the Kolmogorov–Smirnov test, it was identified that the maximum distance is 0.18 with the p-value less than 0.05, and the two distributions are significantly different between them at a 95% confidence level.
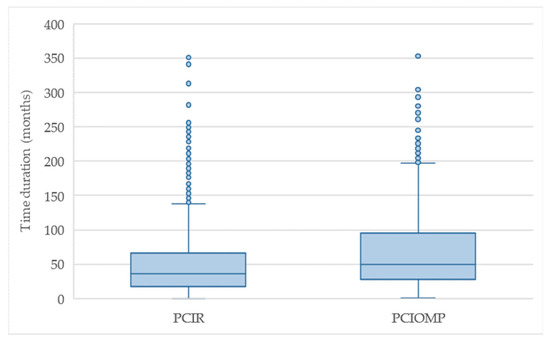
Figure 4.
Time duration for completed procedures with intervention in Italy according to intervention type: remediation (PCIR), other management processes (PCIOMP).
In our opinion, this finding could be ascribed to the complexity of the intervention type; usually, when the contaminants can be removed easily, the remediation process timing is shorter.
From the PCI population, three sub-populations were identified (Table 2): (i) ordinary administrative procedures as required by Legislative Decree n. 152/06 (PCIO152, 1096 sites); (ii) simplified procedures (PCIS152, 427 sites); and (iii) procedures activated under DM 471/99 (PCI471, 836 sites), which is no longer in force.
3.1.3. Procedure Time Duration vs. Procedure Type
Non-parametric distributions describe the PCIO152 and PCI471 duration, while the PCIS152 data are found to be lognormal. In order to compare the three groups, we performed non-parametric statistical tests. The distributions are significantly different (p-value less than 0.05 at the 95% confidence level). As shown in Figure 5, the timing median follows the order of
PCIO152 (48.7 months) > PCI471 (37.1 months) > PCIS152 (23.5 months)
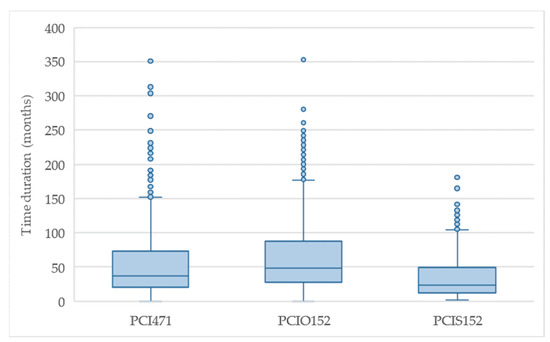
Figure 5.
Time duration for completed procedures with intervention in Italy according to the procedure type: DM 471/99 (PCI471), DLgs 152/06—ordinary procedures (PCIO152), DLgs 152/06—simplified procedures (PCIS152).
Concentrating the comparison between the PCIS152 and PCIO152, the duration of the simplified procedures is significantly lower for almost all percentiles compared to the ordinary procedures pertaining to the same law in force. The maximum distance calculated with the Kolmogorov–Smirnov test is 0.34. This value represents the maximum difference in percentiles for the same duration.
The absence of a correlation between the extension of the areas and the duration of the procedures was ascertained (Figure A1 shown in Appendix A). For this reason, the shorter duration of the simplified procedures, which mainly apply to small areas (<1000 m2), cannot be attributed to this factor. In terms of timing, the improvement from the previous (DM 471/99) to the current law (DLgs 152/06) is due to the utilization of simplified procedures. The process is notably quicker due to a reduced number of steps in PCIS152. Additionally, under PCIS152, approval and environmental status control occur at the end of the intervention.
3.1.4. Procedure Time Duration vs. Competent Authority
From the PCI population, time duration data were divided into three groups based on the competent authority for the administrative management (Table 2): (i) municipalities (PCIMUN, 2597 sites); (ii) provinces (PCIPROV, 284 sites); and (iii) regions (PCIREG, 61 sites). The PCIMUN and PCIPROV timing data are described by non-parametric distributions, while PCIREG data are found to be lognormal. In order to compare the three groups, we performed non-parametric statistical tests (Figure 6).
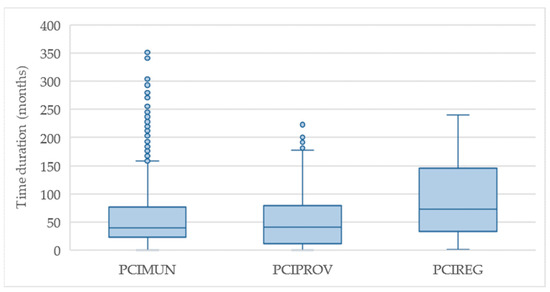
Figure 6.
Time duration for completed procedures with intervention in Italy according to the competent authority for the administrative management.
Distributions are significantly different (p-value less than 0.05 at 95% confidence level). The median duration follows the order of
PCIREG (73 months) > PCIPROV (40.5 months) > PCIMUN (40.2 months)
Municipalities were the competent authority in most of the closed procedures. The timing of PCIMUN and PCIPROV are practically the same, while PCIREG showed much longer timings. The probable explanation is that regions are generally involved in procedures that are more complex, both technically and administratively.
3.1.5. Procedure Time Duration vs. Environmental Media Affected
In Italy, the focus of contaminated site processes involves soil, subsoil, and groundwater (Table 2). Statistical analyses were carried out on soil and subsoil (PCIS, 857 sites) or soil/subsoil plus groundwater (PCIGW, 753 sites). There is no dataset analyzed solely for groundwater, as the available information is not statistically significant. The PCIS timing data are described by non-parametric distribution, while the PCIGW data are found to have gamma distribution. In order to compare the two groups, we performed non-parametric statistical tests. The distributions are significantly different (p-value less than 0.05 at the 95% confidence level) (Figure 7). The timing distribution for PCIS is significantly lower than PCIGW. The median for PCIS is 32.1 months, while the median for PCIGW is 62.6 months.
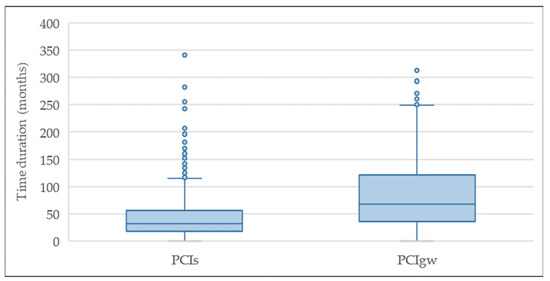
Figure 7.
Time duration for completed procedures with intervention according to the environmental media affected: soil/subsoil (PCIS), groundwater (PCIGW).
As expected, remediation interventions limited to soil/subsoil are significantly shorter in duration compared to those involving both soil/subsoil and groundwater. This difference arises from the fact that groundwater remedial interventions usually require a longer period of time, especially when source reduction interventions are not implemented simultaneously.
3.1.6. Procedure Time Duration vs. Soil/Subsoil Target Concentration
Finally, focusing on the PCIS data related to the soil/subsoil matrix, the duration of interventions was analyzed in two scenarios: first, when the remediation target is a generic value (CLA/CSC) set by regulations (PCISCSC, 805 sites), and second, when the remediation target is determined through site-specific risk assessment, resulting in a site-specific concentration depending on the site’s conditions of utilization (PCISCSR, 51 sites) (Figure 8).
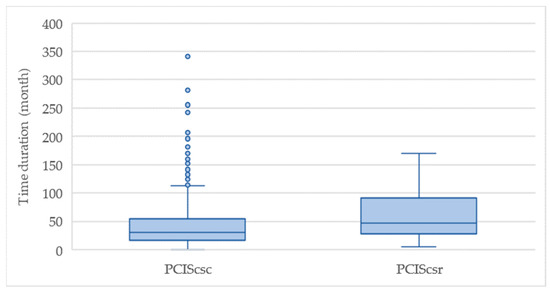
Figure 8.
Time duration for completed procedures with intervention limited to the soil/subsoil according to generic (CLA/CSC) or specific (CSR) target concentrations.
A non-parametric distribution characterizes the timing data for PCISCSC, while the data for PCISCSR follow gamma and lognormal distributions. Non-parametric statistical tests were conducted to compare these two groups. The distributions were found to be significantly different (p-value less than 0.05 at a 95% confidence level). Despite the limitations of the available data, the timing distribution for PCISCSC is significantly lower than that of PCISCSR. The median duration for PCISCSC is 30.3 months, whereas the median duration for PCISCSR is 47.4 months (Figure 8).
The decision to set CSRs as the remediation objective following risk assessment offers the potential for cheaper remediation operations, as the CSRs are usually higher than CSCs. However, this choice results in a longer duration for the completion of the procedure.
3.2. Statistical Analysis for the Province of Brescia
A case study involving provincial-level analysis was conducted by investigating and comparing the existing sites with those previously completed, specifically those that were remediated or did not exceed soil guideline values. In particular, as recently carried out, the data extracted from MOSAICO were compared with the data concerning the total area and the municipalities analyzed. This study analyzed 168 municipalities, which was around 80% of the total municipalities in the province of Brescia, and 609 proceedings were analyzed (covering 60% of the total proceedings in the province of Brescia). Two types of proceedings have been implemented in the province of Brescia, which are simplified (18% of total proceedings) and ordinary (82% of total proceedings). To date, 46% of these proceedings have been concluded, and 54% are still ongoing.
3.2.1. Comparative Analysis of Time Duration in the Province of Brescia
The statistical graphs depicting the total length of completed processes in the province of Brescia, the Lombardy Region, and the entire country of Italy show similar patterns. The processes have been differentiated based on the amount of time needed for each one to finish the process, as shown in Figure 9. The periods specified by specific areas, whether nationally, regionally, or provincially, were stated in years, with an extra intermediate range below three years in order to perform a more relevant comparison. As a result, according to how long it takes to complete each site in Brescia, the Lombardy region, and Italy, duration is divided into six categories.
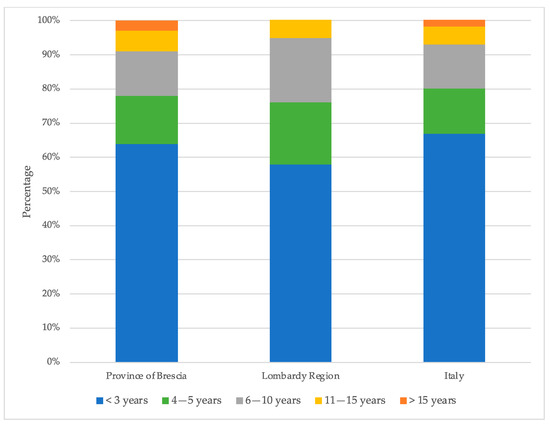
Figure 9.
Comparison of the overall distribution of time duration for completed procedures in the province of Brescia, in the Lombardy Region, and in Italy.
When the graphs in Figure 9 are compared, it is clear that in each case, almost 60% of the procedures were finished within three years. While around 14% of the processes took 4–5 years or 6–10 years, about 7% required 11–15 years. And finally, a little more than 3% needed more than 15 years. Figure 9 includes all procedures, even those that did not need remediation activities; therefore, there was a significant overrepresentation of procedures concluded within less than three years. Therefore, this study was constrained to the following categories in order to obtain a more insightful analysis based on the Brescia provincial data (Figure 10):
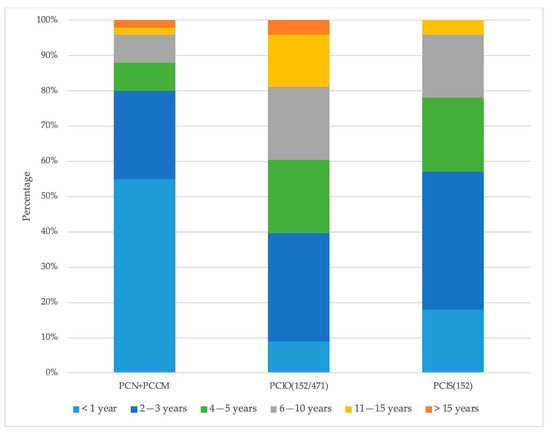
Figure 10.
Analysis of the overall time duration for completed procedures in the province of Brescia according to closure modality and procedure type: without intervention (PCN + PCCM), after intervention with ordinary procedures (PCIO (152/471)), and after intervention with simplified procedures (PCIS (152)).
- Procedures closed without remediation intervention;
- Procedures closed under the ordinary process with remediation intervention;
- Procedures closed under the simplified process with remediation intervention.
The Brescia province’s data analysis revealed a noticeable difference between procedures closed without intervention, procedures closed after notification, and procedures closed following characterization or after the development of specific remedial measures. In order to determine the timing of remedial interventions, it was required to analyze each datum independently. Procedures that do not require intervention are completed substantially faster than those that do, yet even these procedures include notable cases with extensive durations (>15 years) (Figure 10). Over 55% of proceedings were completed within one year under procedures closed without remedial involvement, and it was also noted that a sizable number of procedures under the regular process with corrective intervention were resolved within a year. Except for operations closed after more than 15 years, a fair degree of uniformity is seen for later time periods. Significantly, no proceedings were identified for the closed procedures under the simplified process with remediation intervention.
3.2.2. Procedure Time Duration vs. Procedure Closure Mode in the Province of Brescia
Based on the data presented in Figure 11, the median duration for procedures concluded after notification was found to be 20.8 months, with the 75th percentile at 44.8 months. Despite these relatively short average durations, it is noteworthy that certain procedures exhibited remarkably long tails, with one particular case lasting 210 months (equivalent to 17.5 years). Additionally, following the characterization and detailed remedial planning (PCIOMP) phase, the median duration for procedure closure was determined to be 30.5 months, with the 75th percentile reaching 59.7 months. Notably, the maximum duration in this category was 132 months (equivalent to 11 years), despite the general expectation of longer closure timeframes for these treatments. When comparing the data, it becomes evident that procedures progressing beyond the notification stage tend to display lengthier closure periods, potentially attributed to more extensive efforts to restore and utilize the affected area.
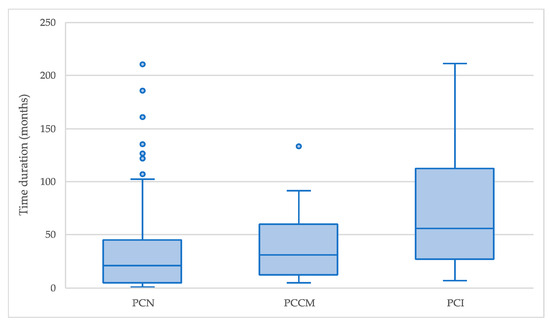
Figure 11.
Time duration for completed procedures in the province of Brescia according to closure modality: after notification without any further action (PCN), after conceptual model without any further intervention (PCCM), and after intervention (PCI).
3.2.3. Procedure Time Duration vs. Procedure Type in the Province of Brescia
The process involves two approaches: utilizing contamination threshold concentrations (CSCs) based on regulatory table targets or employing risk threshold concentrations (CSRs) based on the site-specific risk analysis data. Figure 12 illustrates the overall duration of the remediation process in ordinary procedures in the province of Brescia. Typically, contaminated sites with CSC targets exhibit lower levels compared to contaminated sites with CSR targets. Consequently, procedures pursued with CSC objectives tend to achieve completion at a faster pace than those undertaken with CSR objectives. Based on statistical analysis, it was observed that procedures concluded with CSR objectives had a median duration of 75.6 months, with the 75th percentile reaching 110.5 months. In contrast, procedures conducted under the intervention of CSC objectives had a median duration of 55.9 months, with the 75th percentile at 112 months. A comparative examination of the data displayed in the two graphs of Figure 12 highlights that procedures with CSR objectives, on average, take an additional 20.3 months compared to those with CSC objectives. This discrepancy may be attributed to the time required for the development and approval of risk analysis.
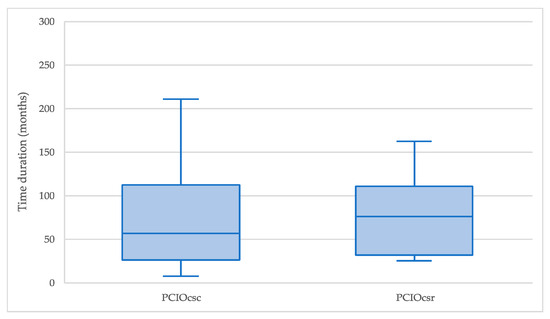
Figure 12.
Time duration of completed procedures with intervention limited to soil upon ordinary procedures in the province of Brescia according to generic (CLA/CSC) or specific (CSR) target concentrations.
Figure 13 illustrates the duration of contaminated site closures at the national level, distinguishing between procedures based on CLA/CSC or CSR objectives focusing on soil reference concentrations. An analysis of the data reveals that procedures concluded with the intervention of CSR objectives exhibited a median duration of 50.1 months, with the 75th percentile at 104.7 months. Conversely, procedures completed with the intervention of CLA/CSC objectives had a median duration of 42.2 months, with the 75th percentile at 63.6 months. Figure 12 and Figure 13 offer a comparative analysis between the data for the province of Brescia (Figure 12) and the national dataset (Figure 13). The comparison reveals that the province of Brescia demonstrates a higher median in terms of both CLA/CSC and CSR. However, the national dataset exhibits a higher range for CLA/CSC and CSR compared to the province of Brescia.
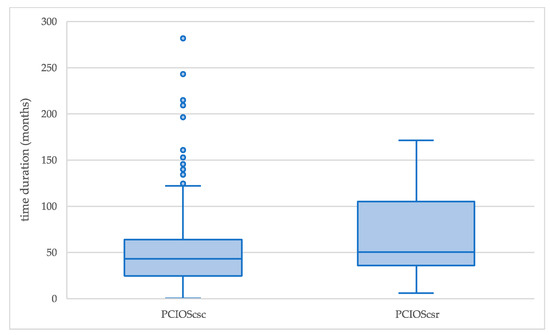
Figure 13.
Duration of procedures completed with soil-limited intervention in general procedures in Italy according to general (CLA/CSC) or specific (CSR) target concentrations.
3.2.4. Duration of Remedial Process Stages in Brescia Province
Figure 14 depicts the time duration of several steps of ordinary remediation processes in the province of Brescia. This study clearly depicts that one phase that significantly impacts the overall duration of remediation is the actual remediation phase, which encompasses the period from the approval of the operational remediation plan to the certification stage.
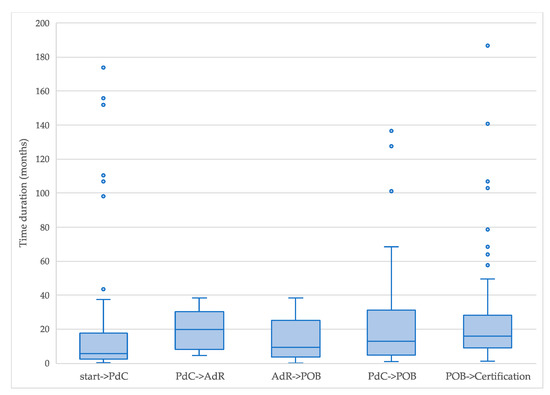
Figure 14.
The duration of the stages of the remedial process in the general procedures of the province of Brescia.
The statistical analysis presented in Figure 14 highlights the significant influence of the risk analysis clearance phase on the overall duration of the remediation process. Additionally, the graph demonstrates varying tail lengths for different phases. Notably, the initial phase, encompassing notification of the acceptance of the characterization plan, exhibits notably long tails and correspondingly extended maximum values, reaching a maximum duration of 173.6 months.
3.3. Critical Issues and Causes Affecting the Remediation Times
In Italy, concerning the total number of procedures, 54% of them were successfully completed. Surprisingly, two out of every three procedures are completed effectively without requiring remedial measures. At the national level, efforts are being made to compile the information that is already accessible, which consists of an evaluation of the state of these processes and an estimate of the number of notifications that are made annually (about 1100). Simple processes have been established to simplify the process, thereby reducing the length of the procedure by half. It is important to note that the initial stages of the process are the most important in terms of time management, as the incredibly tight deadlines set by the rules are often missed. Only 10–20% of instances resulted in operations being completed on time, even in later stages. In particular, remediating contaminated areas categorized as “CSC” often proceeds more quickly than contaminated soil categorized as “CSR”. Furthermore, it is critical to note that several “old” procedures—including possibly contaminated productive activities and pre-regulation landfills—have been implemented without a valid rationale.
A number of variables can cause the prolonged timelines seen in these processes:
- First, there are delays when a site changes from being a national priority contaminated site to a regional or local competence site, since there is no clearly defined procedure;
- Authorities in smaller municipalities face challenges in properly administering remedial operations due to the lack of qualified technicians capable of adequately managing complex procedures such as contaminated site remediation;
- Finding the person or organization responsible for the contamination, because this activity is the responsibility of the territorially competent province and requires lengthy investigations;
- Recourse to administrative justice by private entities who contest their responsibility in the site contamination and, consequently, the obligation to remediate it;
- When a public organization is the remedial implementing body, the bidding processes also take longer;
- Public city planning needs to be modified by the municipality when the intended use of a remediated site is changed from industrial to residential purposes;
- Inadequate site characterization, monitoring, and control plans result in authorities’ requests for extra information and revision of the remediation project;
- The use of remediation technologies that are not able to meet remedial objectives.
4. Conclusions
The timing of contaminated site remediation procedures holds paramount importance, as it impacts various critical aspects such as environmental and health considerations, effectiveness, adherence to legal requirements, land restoration, community involvement, and long-term environmental implications. This study aims to fill the gap in the scientific literature by investigating the timing of contaminated site remediation in the context of the Italian scenario, utilizing the MOSAICO database and referencing Italian legislation. Through rigorous statistical analysis, we have uncovered significant heterogeneity in the duration of administrative management procedures, influenced by various factors and stages of the remediation process.
Our findings show that procedures involving remediation interventions generally have shorter durations compared to those involving risk management interventions. Moreover, adopting simplified procedures is associated with reduced time duration, as expected. Additionally, procedures involving both soil and groundwater typically require longer durations than those limited to the soil. Within procedures limited to the soil, longer time durations are observed when the target concentration is the site-specific concentration (CSR).
The causes of the lengthening of remediation process times are multiple and require solutions of various kinds, such as regulatory, procedural, and technical. For example, a procedure must be defined that clarifies times, methods, and responsibilities when sites of national interest are downgraded to sites of local interest. Regional task forces should also be established to support officials of small municipalities who do not have specialist expertise in the matter. Finally, the competent authorities could set and publish guidelines which precisely define the data and technical standards that must be present in the project documents.
Future research is needed to comprehensively evaluate the remediation costs associated with contaminated sites and their correlation with time. Analyzing expenses at different stages and understanding this relationship will facilitate cost-effective decision making and resource optimization for successful site cleanup in Italy. Overall, this study provides a comprehensive framework of Italian contaminated site remediation regulations and emphasizes the significance of timely and efficient remediation actions to achieve successful outcomes. Understanding the duration of remedial procedures can help policymakers to design more efficient and sustainable environmental management techniques.
Author Contributions
Conceptualization, M.V.; methodology, F.A., E.B., F.P. (Federico Pinzin) and M.V.; software, F.A., E.B., F.P. (Federico Pinzin) and W.A.M.A.N.I.; validation, F.A., E.B., F.P. (Fabio Pascarella) and M.V.; formal analysis, F.A., E.B., F.P. (Federico Pinzin) and M.V.; investigation, F.A., E.B. and F.P. (Federico Pinzin); resources, F.P. (Fabio Pascarella) and M.V.; data curation, F.A., E.B. and F.P. (Federico Pinzin); writing—original draft preparation, F.A., E.B., F.P. (Federico Pinzin) and W.A.M.A.N.I.; writing—review and editing, W.A.M.A.N.I. and M.V.; visualization, F.A., E.B., F.P. (Federico Pinzin) and M.V.; supervision, F.P. (Fabio Pascarella) and M.V.; project administration, F.P. (Fabio Pascarella) and M.V. All authors have read and agreed to the published version of the manuscript.
Funding
This research received no external funding.
Informed Consent Statement
Not applicable.
Data Availability Statement
The data presented in this study are available on request from the corresponding author.
Acknowledgments
The authors are grateful to the Province of Brescia and ARPA Lombardy for providing the needed facilities and data. The authors extend their gratitude to Nicoletta Calace for her valuable assistance in data elaboration. They also like to acknowledge the National Environmental Protection System and all the participating Regions of Italy for their contribution to providing data for the MOSAICO database. Edoardo Pagano and Mariantonina Gruppuso are acknowledged for their invaluable contribution for collecting and analyzing necessary data.
Conflicts of Interest
The authors declare no conflicts of interest.
Appendix A

Table A1.
Summary statistics. Data extracted from MOSAICO (* outliers are removed from the dataset).
Table A1.
Summary statistics. Data extracted from MOSAICO (* outliers are removed from the dataset).
| Analysis/Variable | Dataset | No. of Observations | Distribution Type | Minimum | Maximum | Average | Median | Skewness | Kurtosis | 10th | 25th | 50th | 75th | 90th |
|---|---|---|---|---|---|---|---|---|---|---|---|---|---|---|
| Procedure time duration vs. procedure closure mode | completed procedures with time duration | 8023 | ||||||||||||
| Notification | 4180 | non-parametric | 0.0 | 328.7 | 18.4 | 8.5 | 3.7 | 19.5 | 1.6 | 4.0 | 8.5 | 20.0 | 45.9 | |
| Conceptual model | 894 | non-parametric | 0.2 | 258.8 | 57.6 | 38.3 | 1.2 | 0.7 | 7.4 | 16.9 | 38.3 | 88.6 | 138.8 | |
| Intervention | 2949 | non-parametric | 0.0 | 353.0 | 58.1 | 40.6 | 1.6 | 2.9 | 10.9 | 22.1 | 40.6 | 78.9 | 131.6 | |
| Procedure time duration vs. intervention type | completed procedures with intervention | 2949 | ||||||||||||
| Remediation | 1749 | non-parametric | 0.0 | 351.0 | 51.2 | 36.3 | 1.9 | 4.1 | 8.2 | 17.7 | 36.3 | 66.0 | 120.7 | |
| Other | 1200 | non-parametric | 0.9 | 353.0 | 68.1 | 49.4 | 1.4 | 1.8 | 17.3 | 27.6 | 49.4 | 95.5 | 146.2 | |
| Procedure time duration vs. procedure type | completed procedures with intervention for most diffuse procedure type | 2359 | ||||||||||||
| DM 471/99 | 836 | non-parametric | 0.1 | 351.0 | 55.2 | 37.1 | 1.8 | 3.7 | 10.1 | 20.3 | 37.1 | 73.0 | 128.9 | |
| DLgs 152/06—ordinary procedure | 1096 | non-parametric | 0.1 | 353.0 | 65.1 | 48.7 | 1.5 | 2.5 | 15.5 | 27.5 | 48.7 | 87.6 | 136.0 | |
| DLgs 152/06—simplified procedure | 427 | lognormal | 1.4 | 184.6 | 36.9 | 23.5 | 1.7 | 2.6 | 6.1 | 12.1 | 23.5 | 49.3 | 93.9 | |
| Procedure time duration vs. competent authority | completed procedures with intervention—most common authority | 2943 | ||||||||||||
| Region | 61 * | gamma and lognormal | 0.9 | 239.7 | 84.6 | 73.0 | 0.5 | −0.9 | 12.4 | 33.5 | 73.0 | 144.0 | 170.4 | |
| Province | 284 | non-parametric | 0.2 | 222.9 | 52.3 | 40.5 | 1.1 | 0.9 | 3.1 | 12.3 | 40.5 | 79.1 | 118.7 | |
| Municipality | 2597 | non-parametric | 0.0 | 353.0 | 57.9 | 40.2 | 1.7 | 3.1 | 12.0 | 22.7 | 40.2 | 77.0 | 130.4 | |
| Procedure time duration vs. environmental media affected | completed procedures with intervention—information about environmental media affected | 1592 | ||||||||||||
| Soil/subsoil | 857 | non-parametric | 0.0 | 340.9 | 43.8 | 32.1 | 2.3 | 7.7 | 8.4 | 17.8 | 32.1 | 56.8 | 92.5 | |
| Soil/subsoil and groundwater | 733 * | gamma | 0.7 | 312.9 | 84.7 | 67.4 | 1.0 | 0.3 | 22.5 | 36.2 | 67.4 | 121.7 | 180.8 | |
| Procedure time duration vs. soil/subsoil target concentration | completed procedures with intervention limited to soil/subsoil—soil/subsoil target CLA/CSC or CSR | 856 | ||||||||||||
| CLA/CSC | 805 | non-parametric | 0.0 | 340.9 | 42.8 | 30.3 | 2.4 | 8.8 | 8.3 | 17.0 | 30.3 | 55.2 | 91.0 | |
| CSR | 51 | gamma and lognormal | 5.3 | 170.4 | 61.3 | 47.4 | 1.0 | -0.1 | 19.8 | 27.9 | 47.4 | 83.9 | 141.9 | |
| Procedure time duration vs. procedure type and soil/subsoil target concentration | completed procedures under ordinary procedures (DM 471/99 or DLgs152/06) with intervention limited to soil/subsoil—soil/subsoil target CLA/CSC or CSR | 423 | ||||||||||||
| Ordinary procedures and CLA/CSC | 383 * | gamma | 0.0 | 214 | 49.5 | 41.9 | 1.6 | 0.7 | 14.4 | 24.4 | 41.9 | 62.9 | 95.3 | |
| Ordinary procedures and CSR | 38 | gamma and lognormal | 5.3 | 170.4 | 68.3 | 50.1 | 0.8 | 0.7 | 25.1 | 36.5 | 50.1 | 99.3 | 142.5 | |
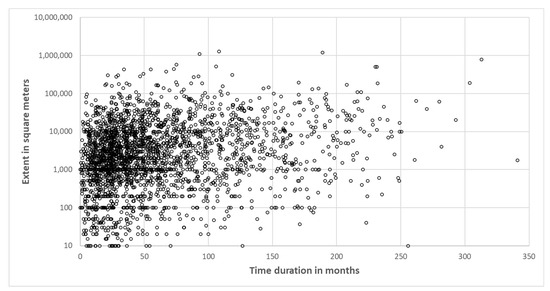
Figure A1.
Correlation between duration of procedures and surface area of sites.
References
- Doula, M.K.; Sarris, A. Soil Environment. In Environment and Development; Elsevier: Amsterdam, The Netherlands, 2016; pp. 213–286. [Google Scholar]
- Li, G.; Sun, G.-X.; Ren, Y.; Luo, X.-S.; Zhu, Y.-G. Urban Soil and Human Health: A Review. Eur. J. Soil Sci. 2018, 69, 196–215. [Google Scholar] [CrossRef]
- Sharma, I. Bioremediation Techniques for Polluted Environment: Concept, Advantages, Limitations, and Prospects. In Trace Metals in the Environment—New Approaches and Recent Advances; IntechOpen: Rijeka, Croatia, 2021. [Google Scholar]
- Lombi, E.; Hamon, R.E. Remediation of Polluted Soils. In Encyclopedia of Soils in the Environment; Elsevier: Amsterdam, The Netherlands, 2005; Volume 3, pp. 379–385. [Google Scholar]
- Venny; Gan, S.; Ng, H.K. Current Status and Prospects of Fenton Oxidation for the Decontamination of Persistent Organic Pollutants (POPs) in Soils. Chem. Eng. J. 2012, 213, 295–317. [Google Scholar] [CrossRef]
- Ajibade, F.O.; Adelodun, B.; Lasisi, K.H.; Fadare, O.O.; Ajibade, T.F.; Nwogwu, N.A.; Sulaymon, I.D.; Ugya, A.Y.; Wang, H.C.; Wang, A. Environmental Pollution and Their Socioeconomic Impacts. In Microbe Mediated Remediation of Environmental Contaminants; Elsevier: Amsterdam, The Netherlands, 2021; pp. 321–354. [Google Scholar]
- Prăvălie, R.; Nita, I.-A.; Patriche, C.; Niculiță, M.; Birsan, M.-V.; Roșca, B.; Bandoc, G. Global Changes in Soil Organic Carbon and Implications for Land Degradation Neutrality and Climate Stability. Environ. Res 2021, 201, 111580. [Google Scholar] [CrossRef] [PubMed]
- Hossain, A.; Krupnik, T.J.; Timsina, J.; Mahboob, M.G.; Chaki, A.K.; Farooq, M.; Bhatt, R.; Fahad, S.; Hasanuzzaman, M. Agricultural Land Degradation: Processes and Problems Undermining Future Food Security. In Environment, Climate, Plant and Vegetation Growth; Springer International Publishing: Cham, Switzerland, 2020; pp. 17–61. [Google Scholar]
- Illankoon, W.A.M.A.N.; Milanese, C.; Karunarathna, A.K.; Liyanage, K.D.H.E.; Alahakoon, A.M.Y.W.; Rathnasiri, P.G.; Collivignarelli, M.C.; Sorlini, S. Evaluating Sustainable Options for Valorization of Rice By-Products in Sri Lanka: An Approach for a Circular Business Model. Agronomy 2023, 13, 803. [Google Scholar] [CrossRef]
- Lal, R. Soil Carbon Sequestration to Mitigate Climate Change. Geoderma 2004, 123, 1–22. [Google Scholar] [CrossRef]
- Lal, R. Restoring Soil Quality to Mitigate Soil Degradation. Sustainability 2015, 7, 5875–5895. [Google Scholar] [CrossRef]
- Gomiero, T. Soil Degradation, Land Scarcity and Food Security: Reviewing a Complex Challenge. Sustainability 2016, 8, 281. [Google Scholar] [CrossRef]
- Istanbuly, M.N.; Krása, J.; Jabbarian Amiri, B. How Socio-Economic Drivers Explain Landscape Soil Erosion Regulation Services in Polish Catchments. Int. J. Environ. Res. Public Health 2022, 19, 2372. [Google Scholar] [CrossRef]
- FAO. Global Assessment of Soil Pollution: Report; FAO: Rome, Italy; UNEP: Nairobi, Kenya, 2021; ISBN 978-92-5-134469-9. [Google Scholar]
- Hammeri, S.; Chaouiii, L.K.; Robertii, A.; Plouin, M. Cities and Green Growth: A Conceptual Framework; OECD Regional Development Working Papers; OECD: Paris, France, 2011. [Google Scholar]
- Cameron, K.C.; Di, H.J.; McLaren, R.G. Is Soil an Appropriate Dumping Ground for Our Wastes? Soil Res. 1997, 35, 995. [Google Scholar] [CrossRef]
- Lubitow, A.; Faber, D. Environmental Justice and Interventions to Prevent Environmental Injustice in the United States. In Encyclopedia of Environmental Health; Elsevier: Amsterdam, The Netherlands, 2011; pp. 433–440. [Google Scholar]
- Ross, I.; McDonough, J.; Miles, J.; Storch, P.; Thelakkat Kochunarayanan, P.; Kalve, E.; Hurst, J.; Dasgupta, S.S.; Burdick, J. A Review of Emerging Technologies for Remediation of PFASs. Remediat. J. 2018, 28, 101–126. [Google Scholar] [CrossRef]
- Hou, D.; O’Connor, D. Green and Sustainable Remediation: Past, Present, and Future Developments. In Sustainable Remediation of Contaminated Soil and Groundwater; Elsevier: Amsterdam, The Netherlands, 2020; pp. 19–42. [Google Scholar]
- Grifoni, M.; Franchi, E.; Fusini, D.; Vocciante, M.; Barbafieri, M.; Pedron, F.; Rosellini, I.; Petruzzelli, G. Soil Remediation: Towards a Resilient and Adaptive Approach to Deal with the Ever-Changing Environmental Challenges. Environments 2022, 9, 18. [Google Scholar] [CrossRef]
- Hadley, P.W.; Harclerode, M. Green Remediation or Sustainable Remediation: Moving From Dialogue to Common Practice. Remediat. J. 2015, 25, 95–115. [Google Scholar] [CrossRef]
- REDDY, K.; KUMAR, G. Green and Sustainable Remediation of Polluted Sites: New Concept, Assessment Tools, and Challenges. Ce/Paper 2018, 2, 83–92. [Google Scholar] [CrossRef]
- Huang, W.-Y.; Hung, W.; Vu, C.T.; Chen, W.-T.; Lai, J.-W.; Lin, C. Green and Sustainable Remediation (GSR) Evaluation: Framework, Standards, and Tool. A Case Study in Taiwan. Environ. Sci. Pollut. Res. 2016, 23, 21712–21725. [Google Scholar] [CrossRef] [PubMed]
- Petruzzi, N.M. A Case Study on the Evaluation and Implementation of Green and Sustainable Remediation Principles and Practices During a RCRA Corrective Action Cleanup. Groundw. Monit. Remediat. 2011, 31, 63–71. [Google Scholar] [CrossRef]
- Leu, J.; Hou, D. Remedial Process Optimization and Sustainability Benefits. In Sustainable Remediation of Contaminated Soil and Groundwater; Elsevier: Amsterdam, The Netherlands, 2020; pp. 279–300. [Google Scholar]
- Armiento, G.; Cremisini, C.; Nardi, E.; Pacifico, R. High Geochemical Background of Potentially Harmful Elements in Soils and Sediments: Implications for the Remediation of Contaminated Sites. Chem. Ecol. 2011, 27, 131–141. [Google Scholar] [CrossRef]
- Mulligan, C.N.; Yong, R.N.; Gibbs, B.F. Remediation Technologies for Metal-Contaminated Soils and Groundwater: An Evaluation. Eng. Geol. 2001, 60, 193–207. [Google Scholar] [CrossRef]
- Ambaye, T.G.; Formicola, F.; Sbaffoni, S.; Prasad, S.; Milanese, C.; Robustelli della Cuna, F.S.; Franzetti, A.; Vaccari, M. Treatment of Petroleum Hydrocarbon Contaminated Soil by Combination of Electro-Fenton and Biosurfactant-Assisted Bioslurry Process. Chemosphere 2023, 319, 138013. [Google Scholar] [CrossRef]
- Pidlisnyuk, V.; Mamirova, A.; Pranaw, K.; Stadnik, V.; Kuráň, P.; Trögl, J.; Shapoval, P. Miscanthus × Giganteus Phytoremediation of Soil Contaminated with Trace Elements as Influenced by the Presence of Plant Growth-Promoting Bacteria. Agronomy 2022, 12, 771. [Google Scholar] [CrossRef]
- Gil-Díaz, M.; Pérez, R.A.; Alonso, J.; Miguel, E.; Diez-Pascual, S.; Lobo, M.C. Iron Nanoparticles to Recover a Co-Contaminated Soil with Cr and PCBs. Sci. Rep. 2022, 12, 3541. [Google Scholar] [CrossRef]
- Ferreira, C.S.S.; Seifollahi-Aghmiuni, S.; Destouni, G.; Ghajarnia, N.; Kalantari, Z. Soil Degradation in the European Mediterranean Region: Processes, Status and Consequences. Sci. Total Environ. 2022, 805, 150106. [Google Scholar] [CrossRef]
- Zhang, S.; Han, Y.; Peng, J.; Chen, Y.; Zhan, L.; Li, J. Human Health Risk Assessment for Contaminated Sites: A Retrospective Review. Environ. Int. 2023, 171, 107700. [Google Scholar] [CrossRef]
- European Environment Agency. Progress in the Management of Contaminated Sites in Europe; European Environment Agency: Copenhagen, Denmark, 2022.
- Sousa, C.D. Contaminated Sites: The Canadian Situation in an International Context. J. Environ. Manag. 2001, 62, 131–154. [Google Scholar] [CrossRef]
- Kuppusamy, S.; Venkateswarlu, K.; Megharaj, M.; Mayilswami, S.; Lee, Y.B. Risk-Based Remediation of Polluted Sites: A Critical Perspective. Chemosphere 2017, 186, 607–615. [Google Scholar] [CrossRef]
- Pollard, S.; Brookes, A.; Earl, N.; Lowe, J.; Kearney, T.; Nathanail, C. Integrating Decision Tools for the Sustainable Management of Land Contamination. Sci. Total Environ. 2004, 325, 15–28. [Google Scholar] [CrossRef][Green Version]
- Stankovics, P.; Montanarella, L.; Kassai, P.; Tóth, G.; Tóth, Z. The Interrelations of Land Ownership, Soil Protection and Privileges of Capital in the Aspect of Land Take. Land Use Policy 2020, 99, 105071. [Google Scholar] [CrossRef]
- Chen, Y. Withdrawal of European Soil Framework Directive: Reasons and Recommendations. J. Sustain Dev. 2019, 13, 1. [Google Scholar] [CrossRef]
- Soil and Land. Available online: https://environment.ec.europa.eu/topics/soil-and-land_en (accessed on 17 January 2024).
- Directorate-General for Environment Proposal for a Directive on Soil Monitoring and Resilience. Available online: https://environment.ec.europa.eu/publications/proposal-directive-soil-monitoring-and-resilience_en (accessed on 24 January 2024).
- Nature Restoration Law. Available online: https://environment.ec.europa.eu/topics/nature-and-biodiversity/nature-restoration-law_en (accessed on 15 June 2023).
- Illankoon, W.A.M.A.N.; Milanese, C.; Collivignarelli, M.C.; Sorlini, S. Value Chain Analysis of Rice Industry by Products in a Circular Economy Context: A Review. Waste 2023, 1, 333–369. [Google Scholar] [CrossRef]
- Spencer, N.; Malinauskaite, J.; Jouhara, H. Waste Prevention and Technologies in the Context of the EU Waste Framework Directive: Lost in Translation? Eur. Energy Environ. Law Rev. 2017, 26, 66–80. [Google Scholar] [CrossRef]
- Conti, M.E.; Ciasullo, R.; Tudino, M.B.; Matta, E.J. The Industrial Emissions Trend and the Problem of the Implementation of the Industrial Emissions Directive (IED). Air Qual. Atmos Health 2015, 8, 151–161. [Google Scholar] [CrossRef]
- Chalaris, M.; Stasinopoulos, N.; Tezari, A. Analysis of the Legal Framework on Hazardous Substances: A Multilevel Correlation between International, European and National Perspective. J. Eng. Sci. Technol. Rev. 2021, 14, 169–175. [Google Scholar] [CrossRef]
- Sikorova, K.; Bernatik, A.; Lunghi, E.; Fabiano, B. Lessons Learned from Environmental Risk Assessment within the Framework of Seveso Directive in Czech Republic and Italy. J. Loss Prev. Process Ind. 2017, 49, 47–60. [Google Scholar] [CrossRef]
- Illankoon, W.A.M.A.N. Fabrizio Passarini Analysis of the Benefits and Limits of Using Solid Waste Instead of Non-Renewable Energy Sources in Industrial Kilns; University of Bologna: Rimini, Italy, 2018. [Google Scholar]
- Cecchi, G.; Marescotti, P.; Di Piazza, S.; Zappatore, S.; Zotti, M. Fungal Richness in the Extreme Environments of the Libiola Mine (Eastern Liguria, Italy): Correlations among Microfungi, Lithology, Mineralogy, and Contaminants. Environ. Earth Sci 2019, 78, 541. [Google Scholar] [CrossRef]
- Ribecco, C.; Hardiman, G.; Šášik, R.; Vittori, S.; Carnevali, O. Teleost Fish (Solea Solea): A Novel Model for Ecotoxicological Assay of Contaminated Sediments. Aquat. Toxicol. 2012, 109, 133–142. [Google Scholar] [CrossRef] [PubMed]
- Araneo, F.; Bartolucci, E.; Congi, M.P.; Vecchio, A. Lo Stato Delle Bonifiche Dei Siti Contaminati in Italia: Secondo Rapporto Sui Dati Regionali; ISPRA: Rome, Italy, 2023. [Google Scholar]
- Ruzzenenti, M. Marianna CDCA Caffaro Industry Contamination in Brescia, Italy. Available online: https://ejatlas.org/conflict/caffaro-contamination-in-brescia (accessed on 14 December 2023).
Disclaimer/Publisher’s Note: The statements, opinions and data contained in all publications are solely those of the individual author(s) and contributor(s) and not of MDPI and/or the editor(s). MDPI and/or the editor(s) disclaim responsibility for any injury to people or property resulting from any ideas, methods, instructions or products referred to in the content. |
© 2024 by the authors. Licensee MDPI, Basel, Switzerland. This article is an open access article distributed under the terms and conditions of the Creative Commons Attribution (CC BY) license (https://creativecommons.org/licenses/by/4.0/).