

Analysis and Simulation of Land Use Changes and Their Impact on Carbon Stocks in the Haihe River Basin by Combining LSTM with the InVEST Model
Abstract
1. Introduction
2. Materials and Methods
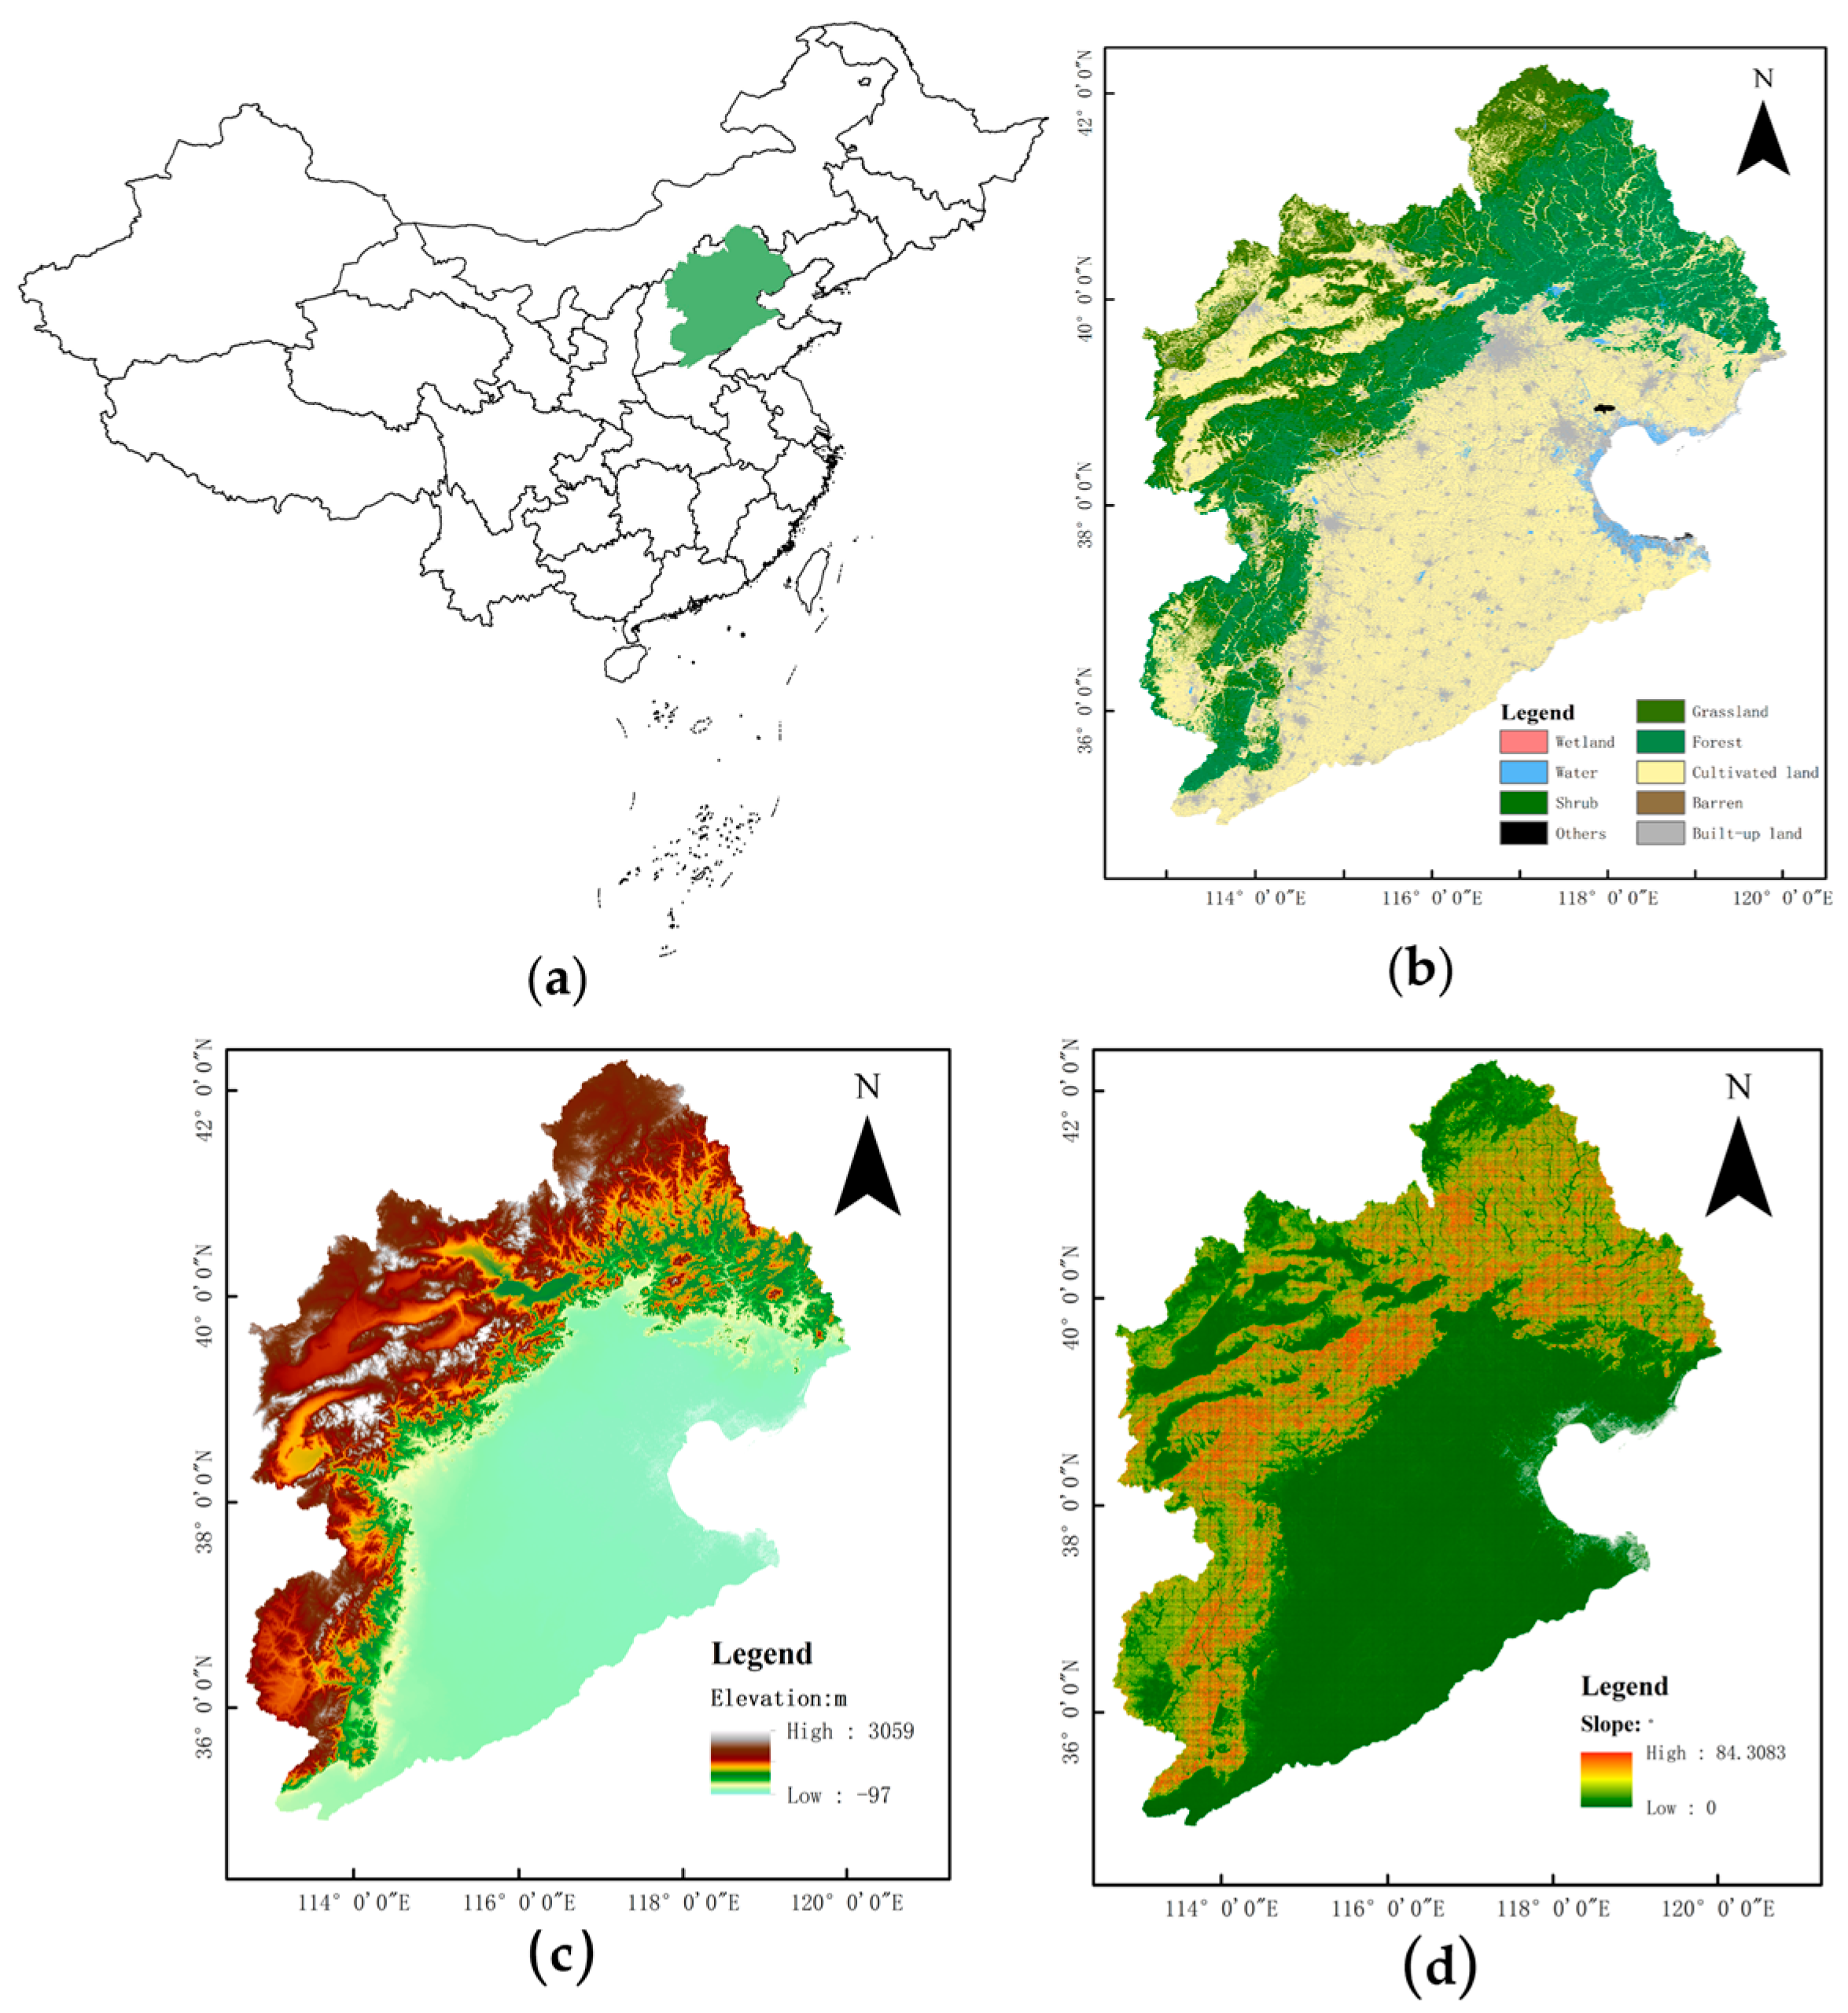
2.1. Study Area and Data Sources
2.2. Methods
2.2.1. Analysis of LULC Dynamics
- (1)
- MK Trend Analysis
- (2)
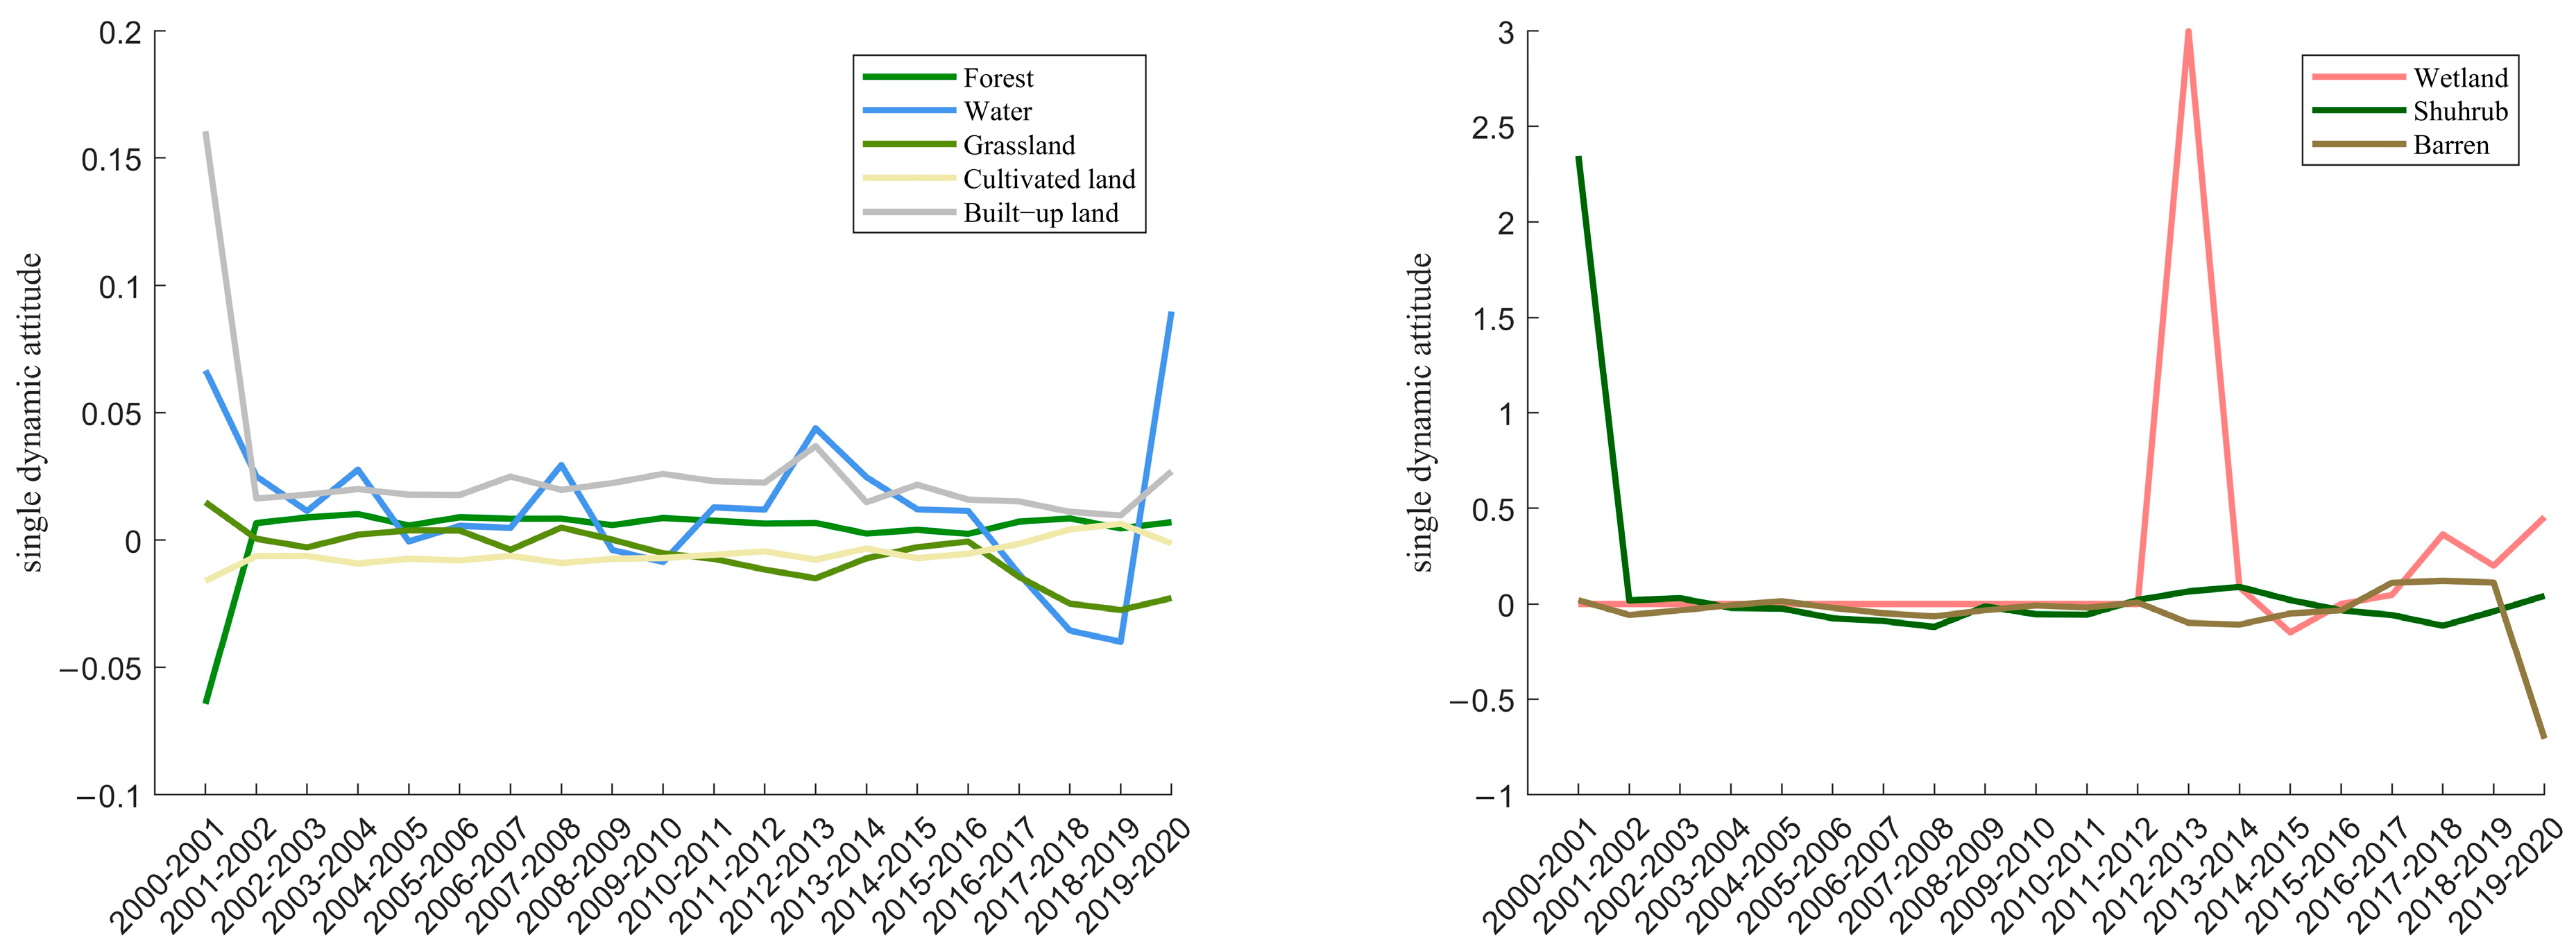
- LULC dynamics attitude
- (3)
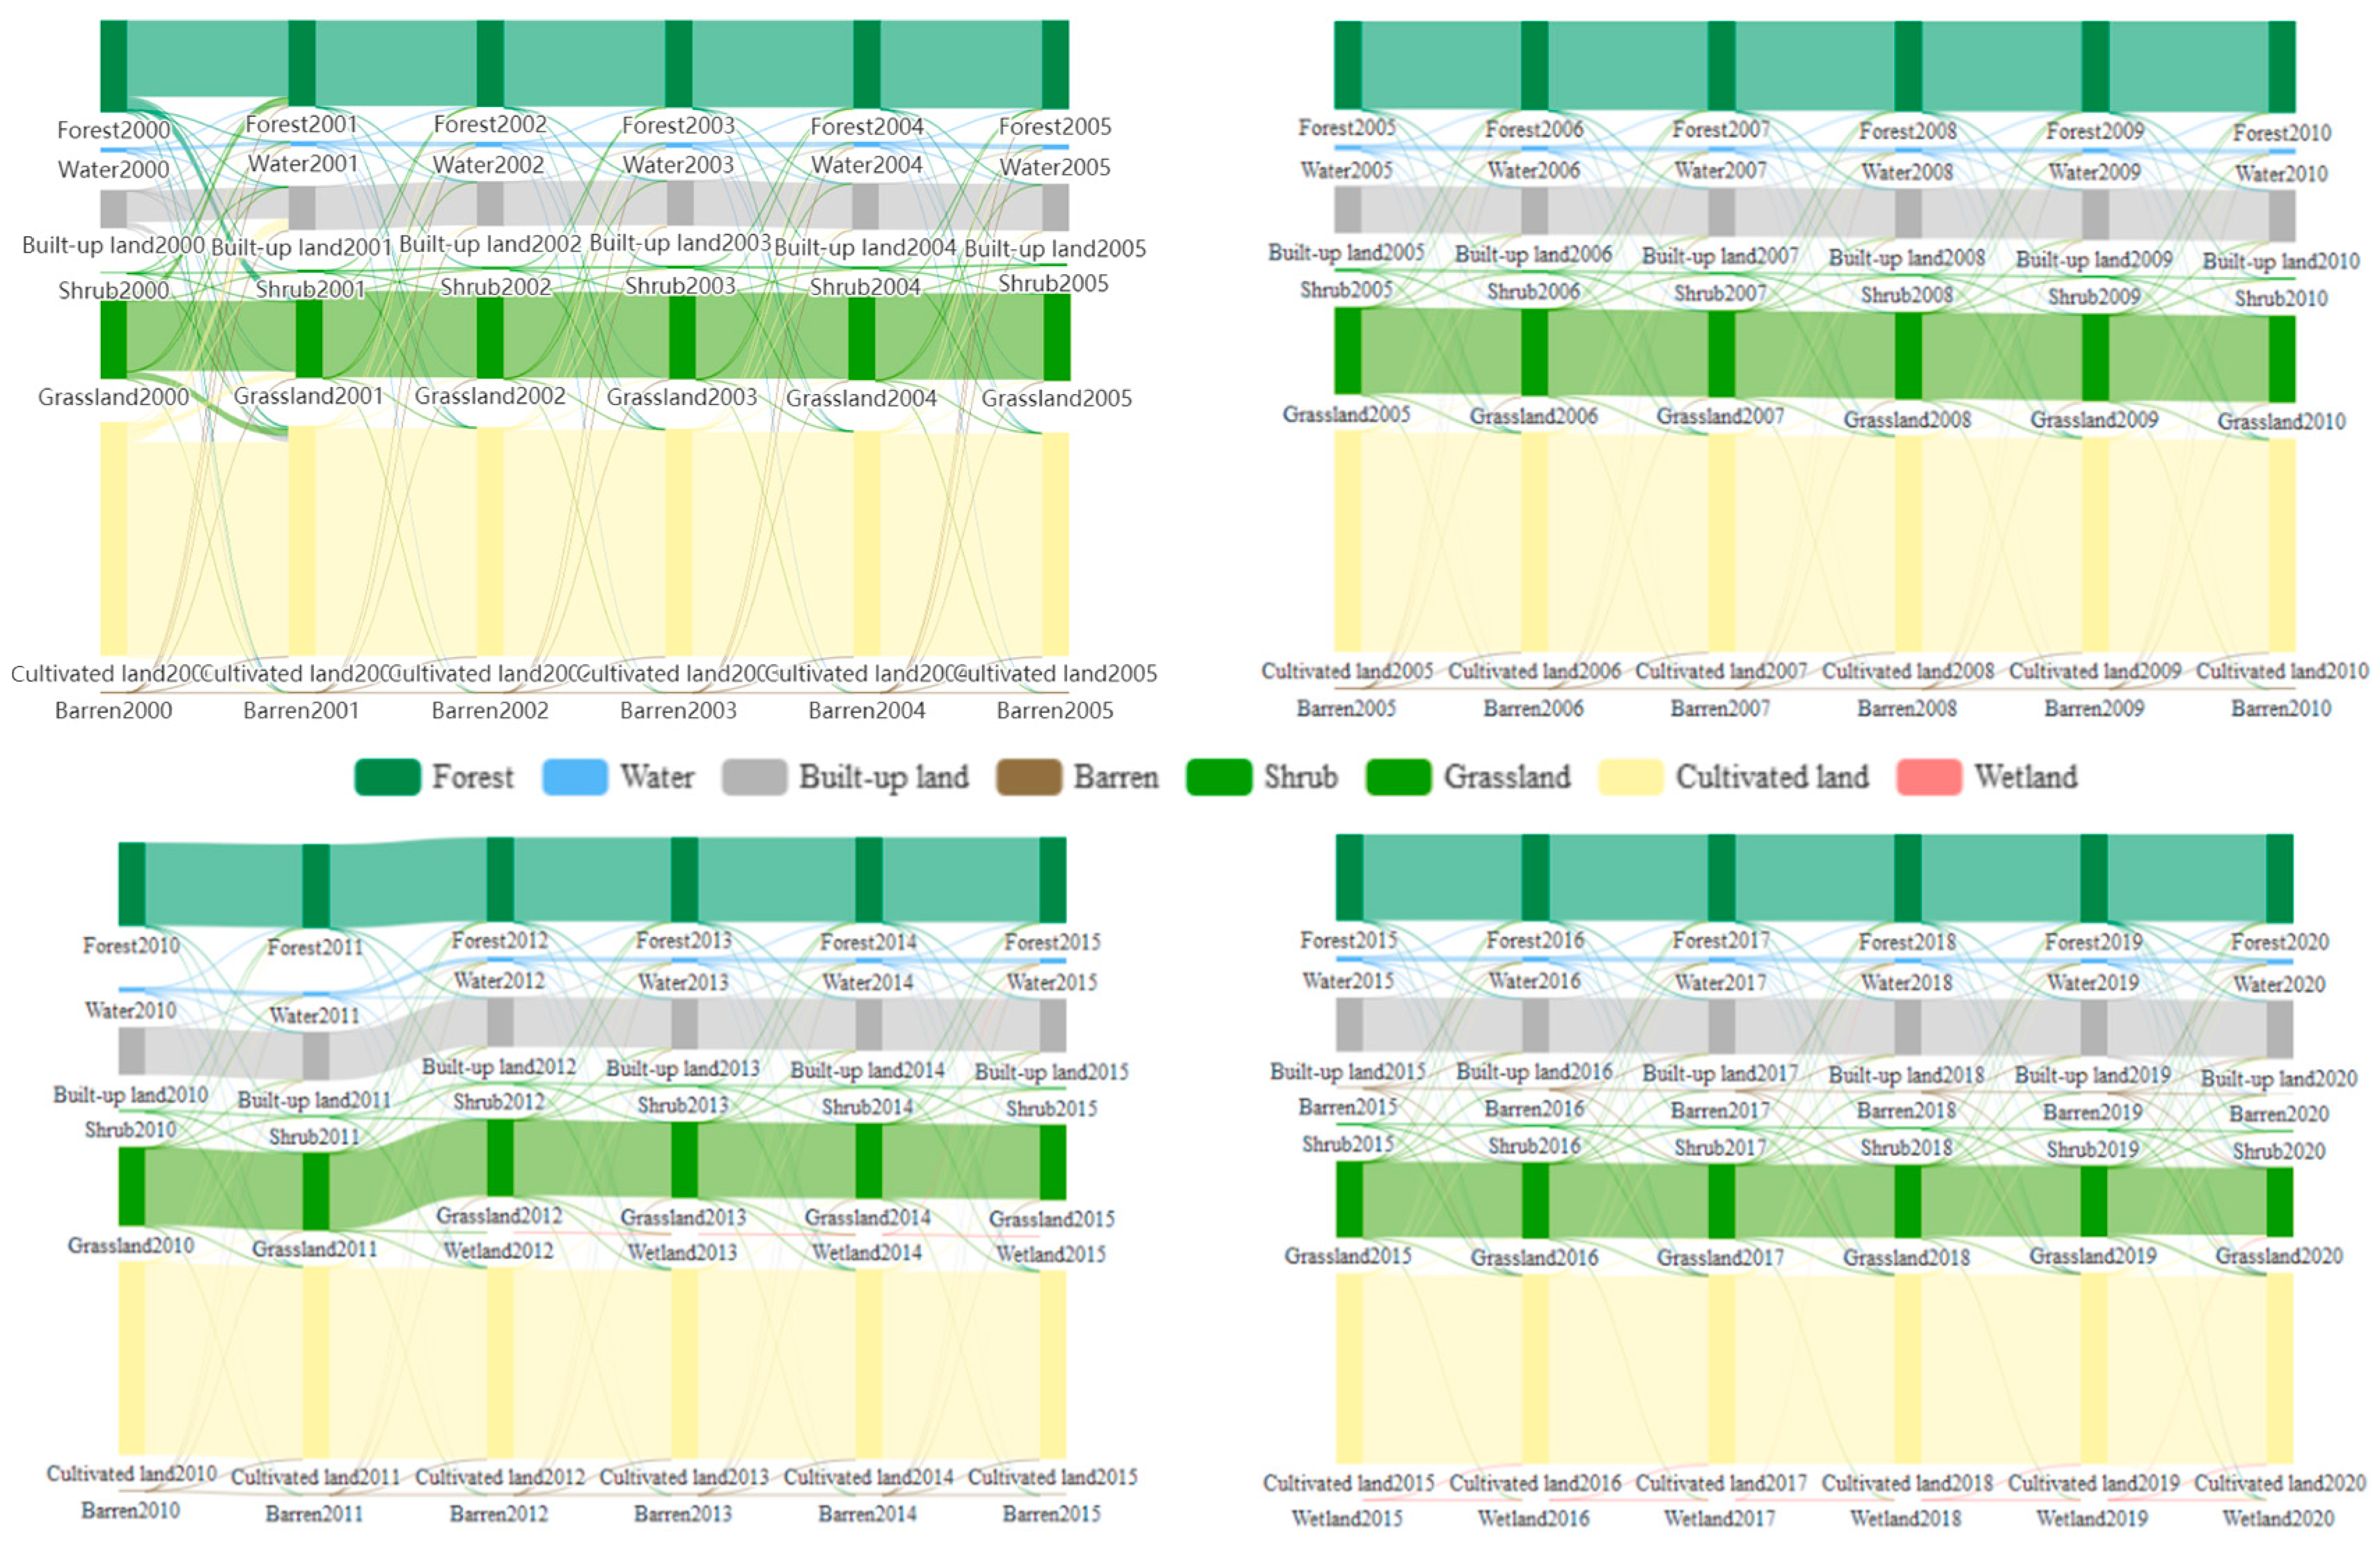
- Transfer matrix
2.2.2. Analysis of Landscape Pattern Dynamics
2.2.3. Carbon Storage Estimation with the InVEST Model
2.2.4. LSTM Spatial Prediction Model
3. Results
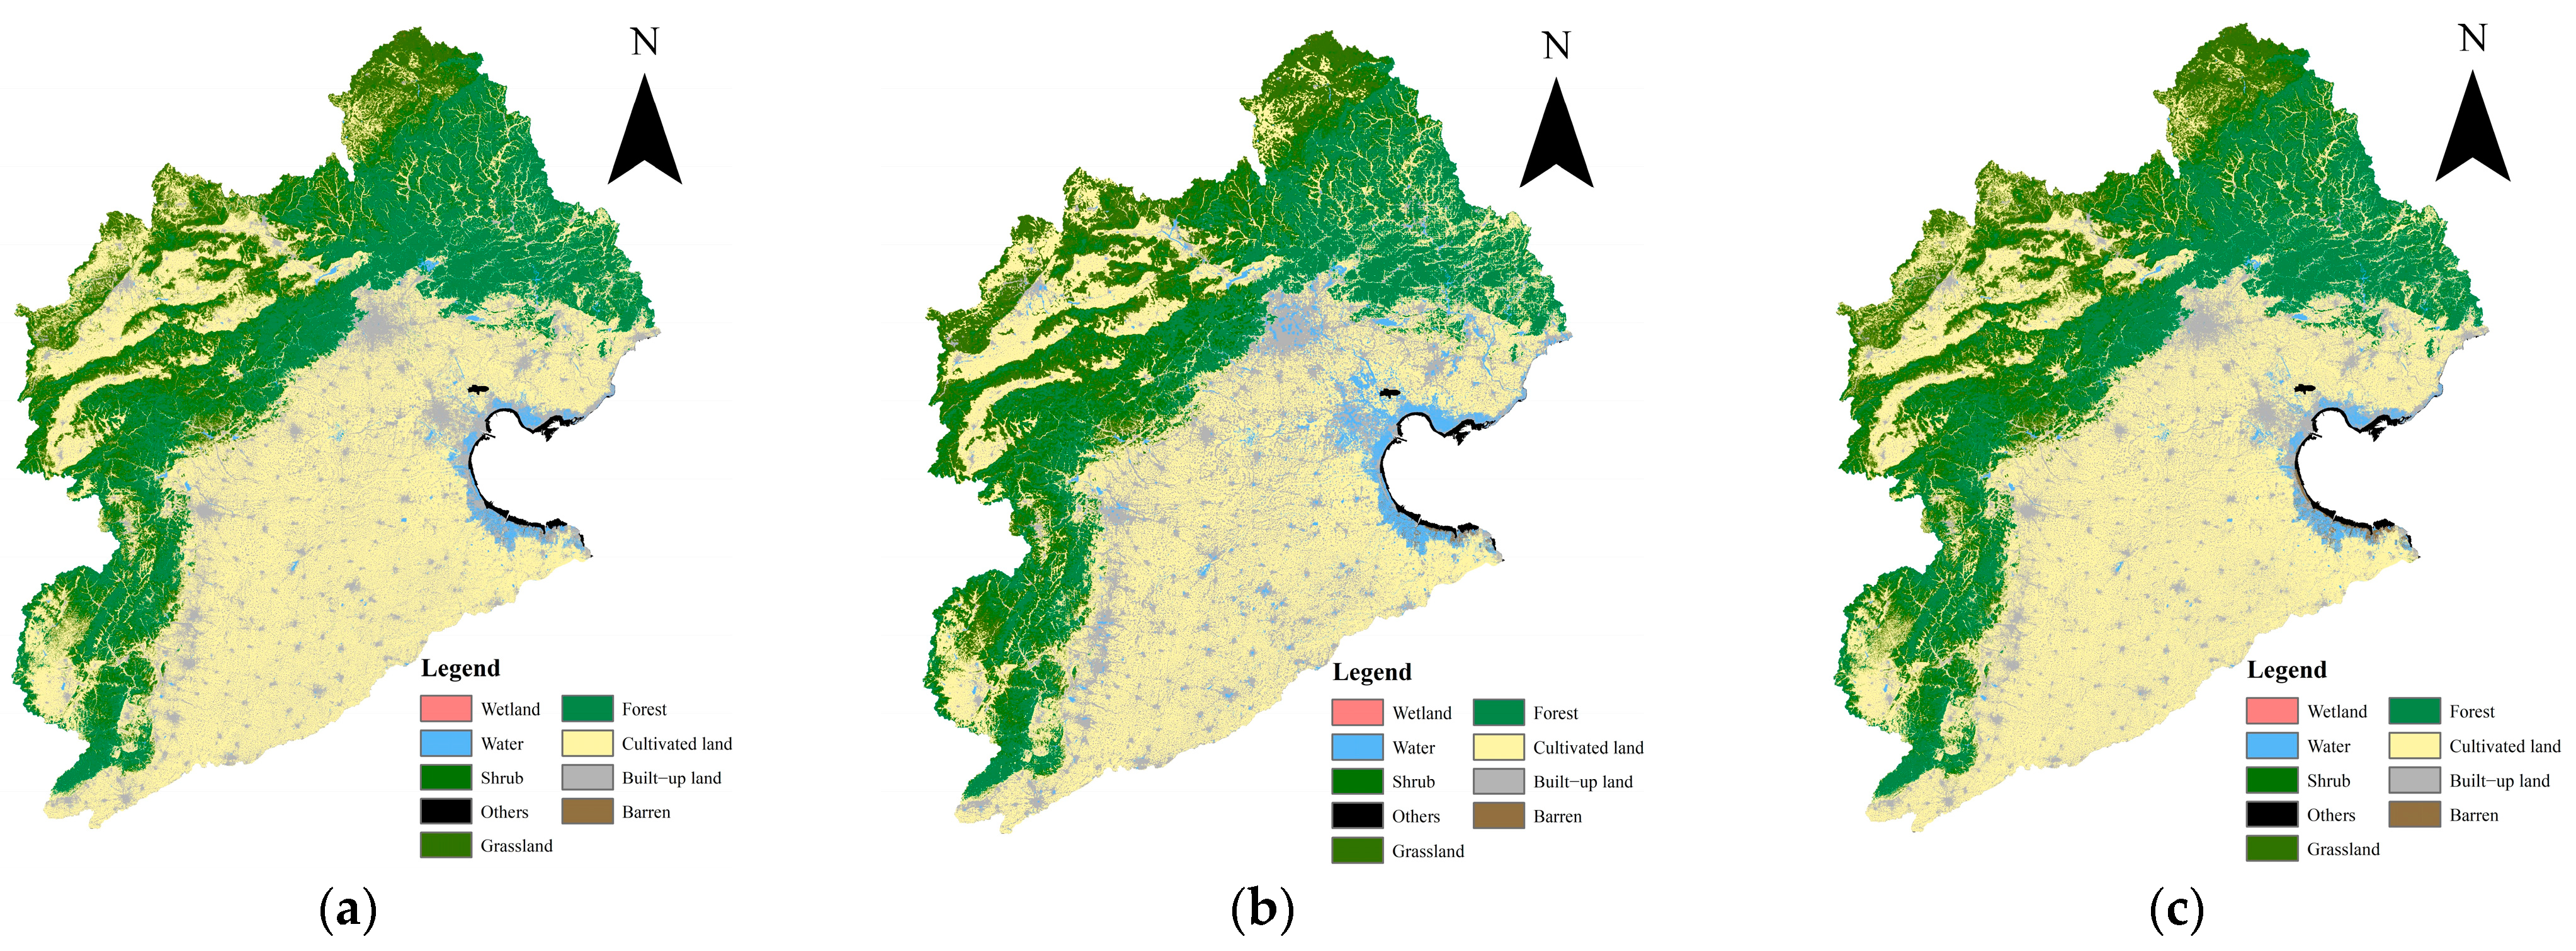
3.1. Dynamic Characteristics of LULC
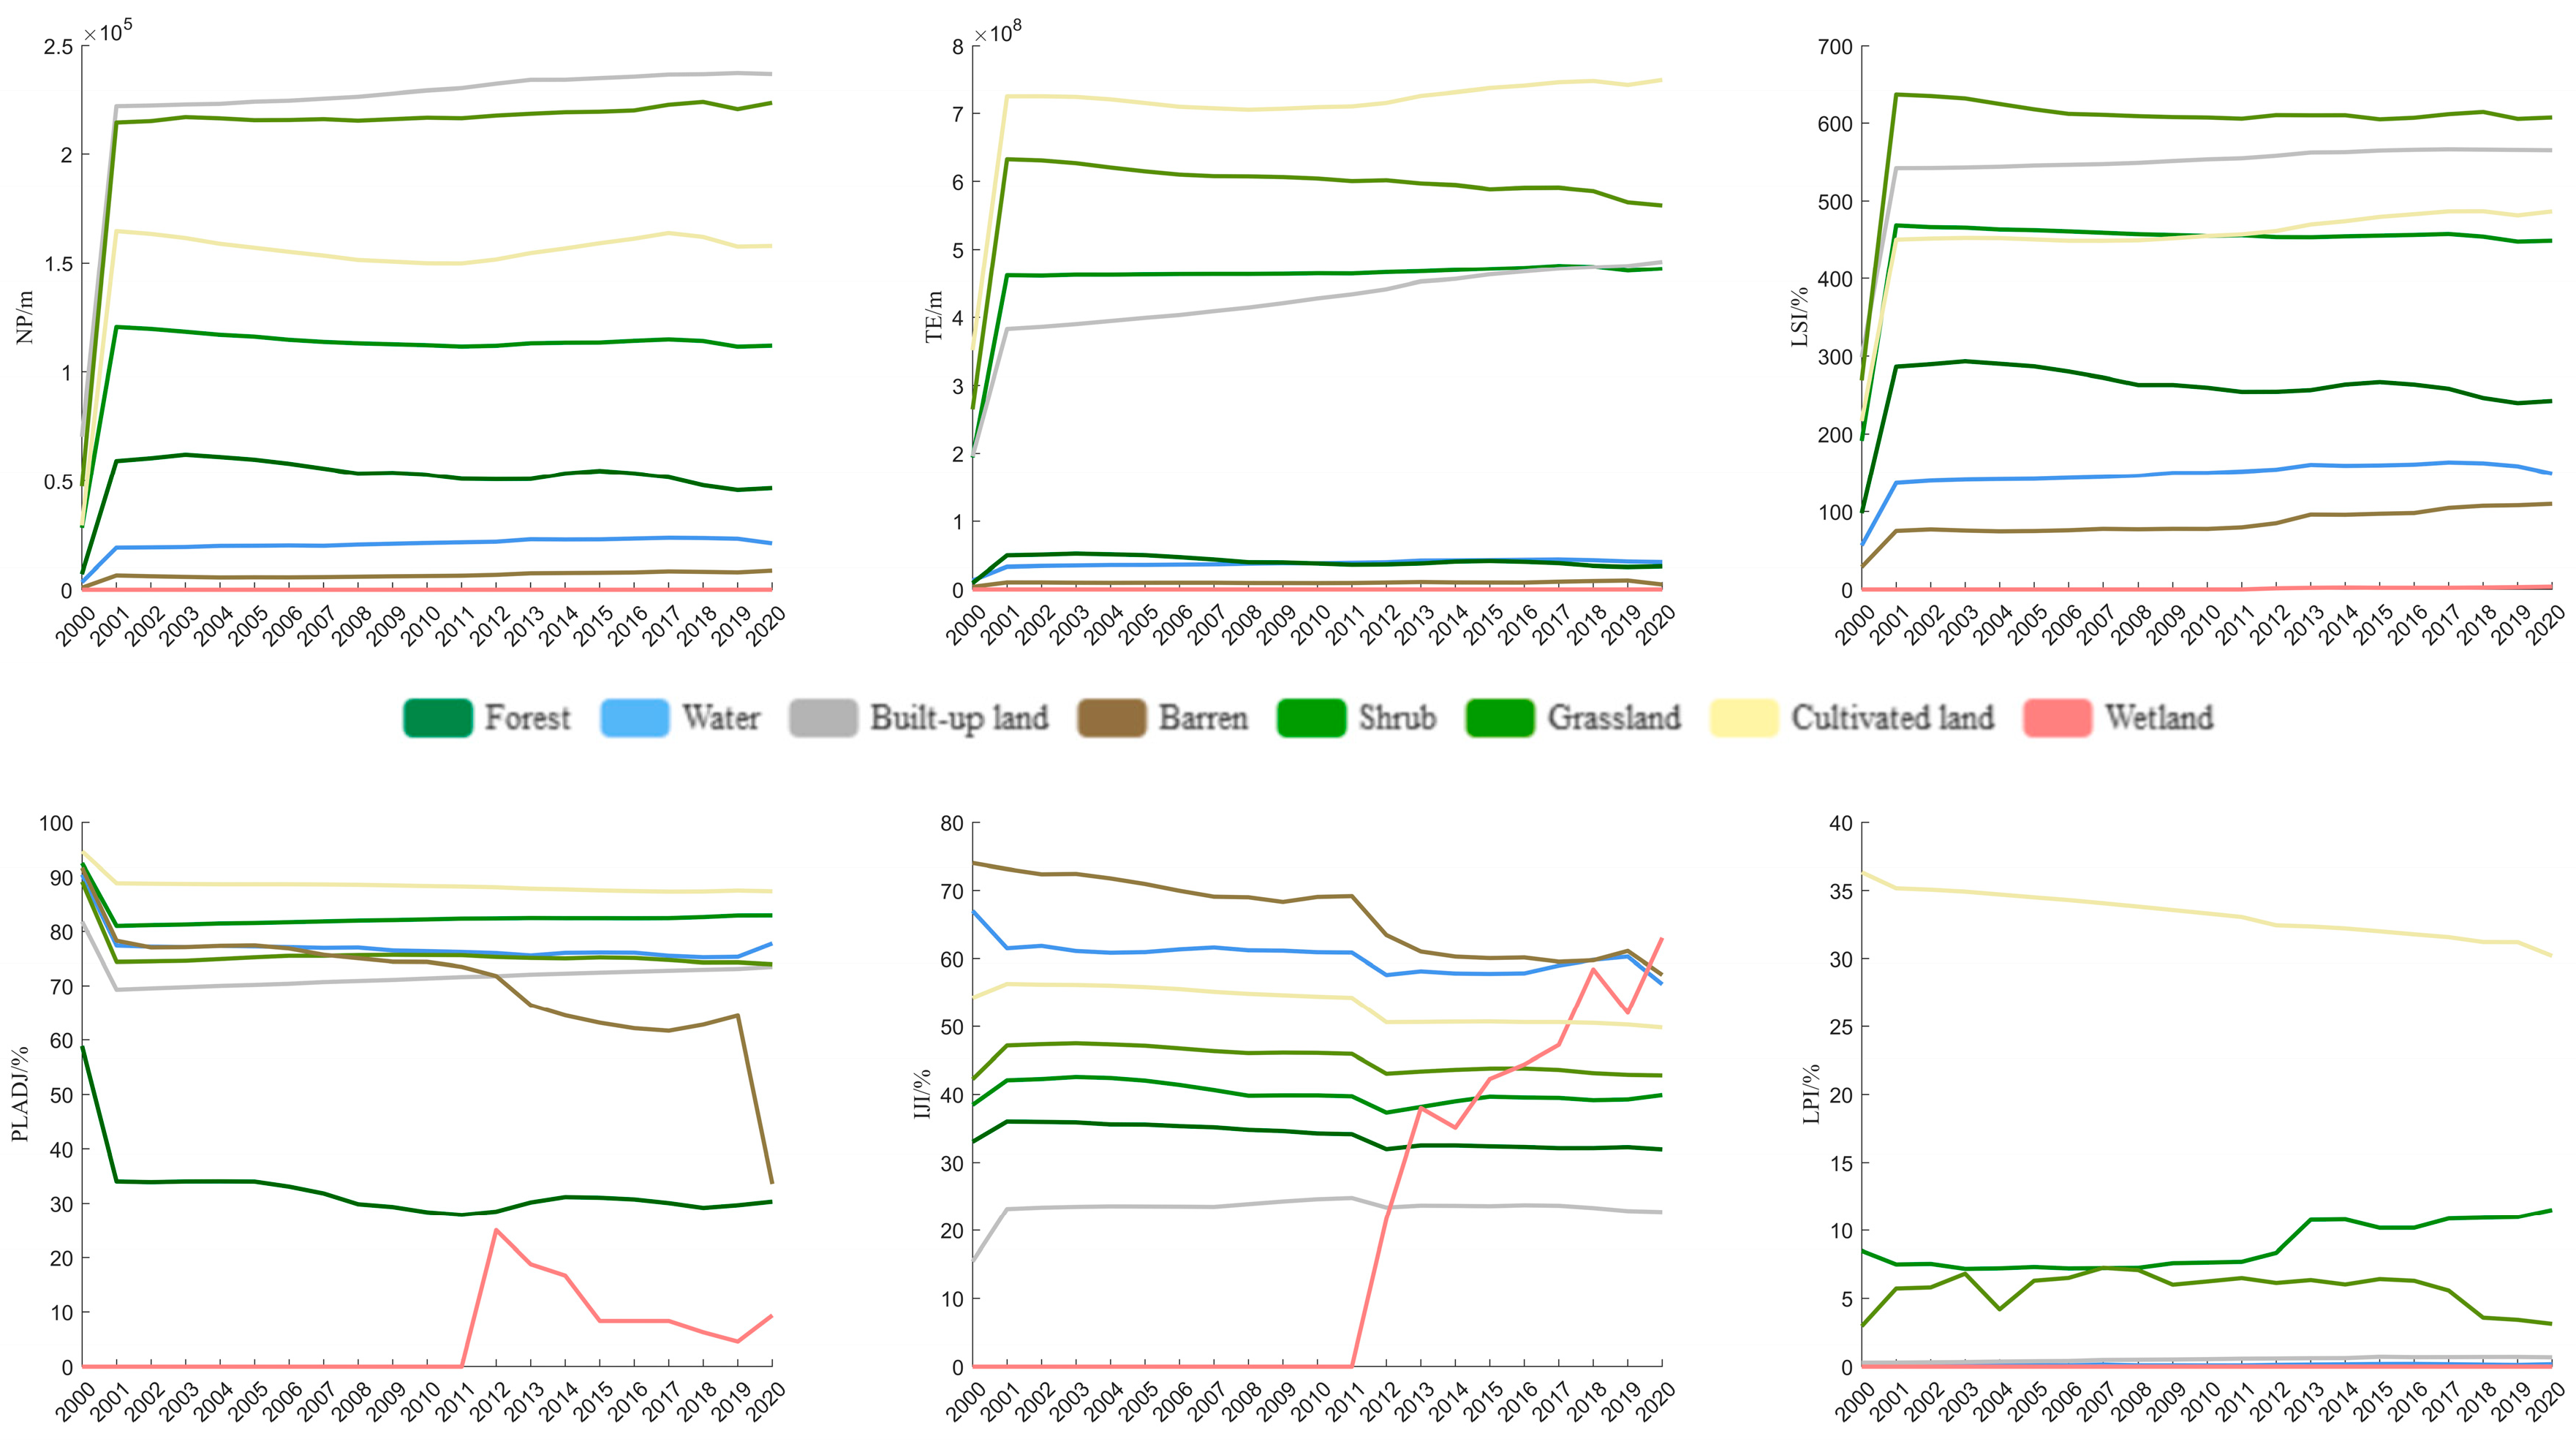
3.2. Pattern Dynamics of Characteristics of LULC
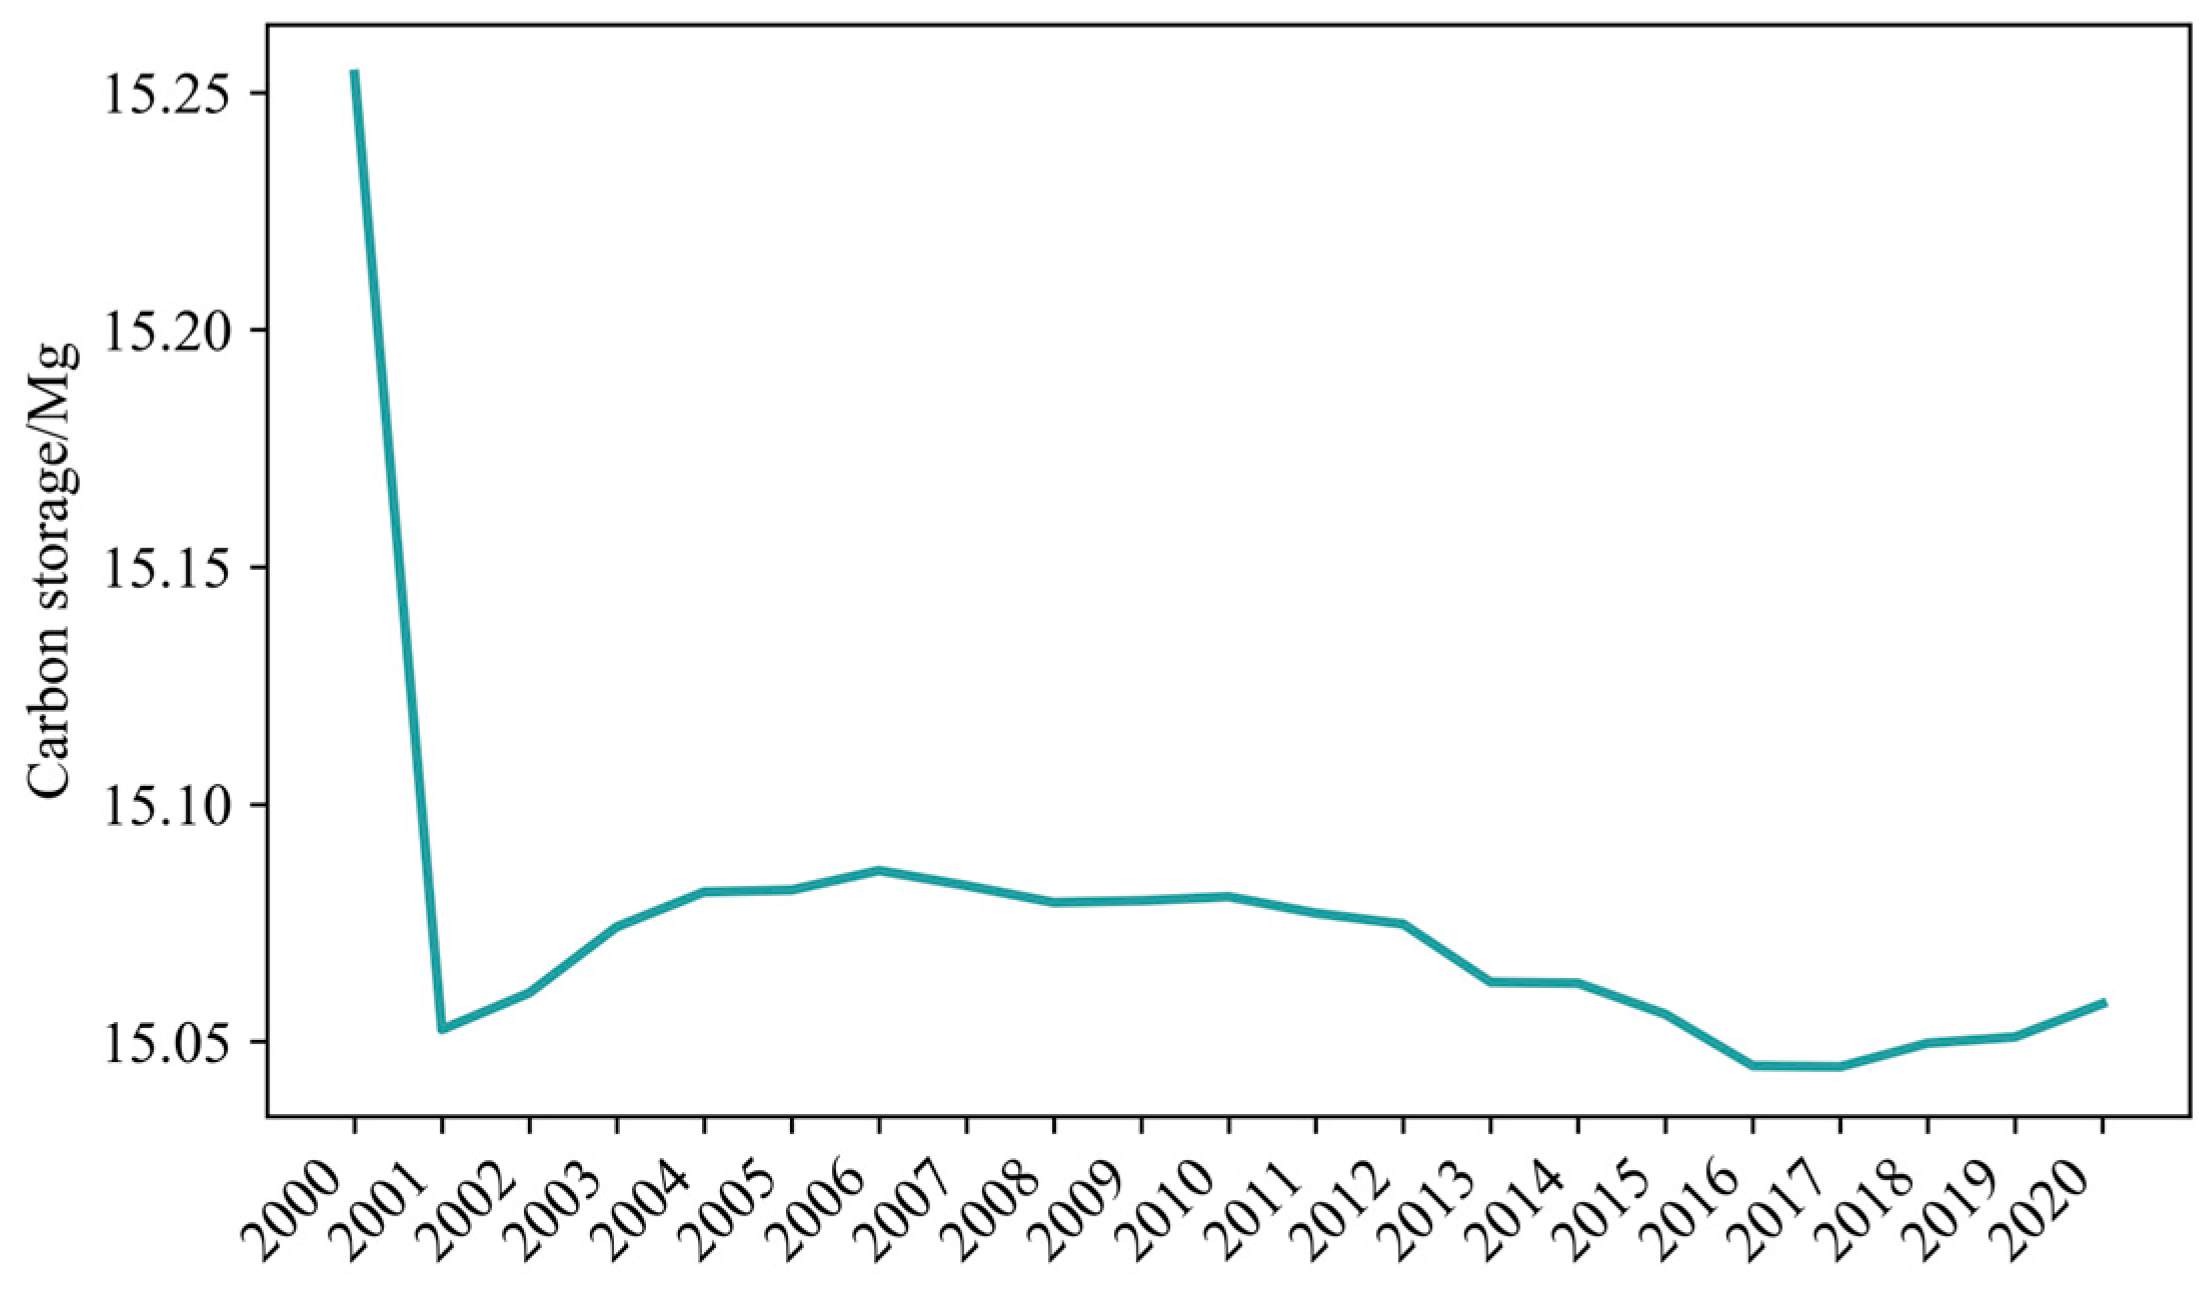
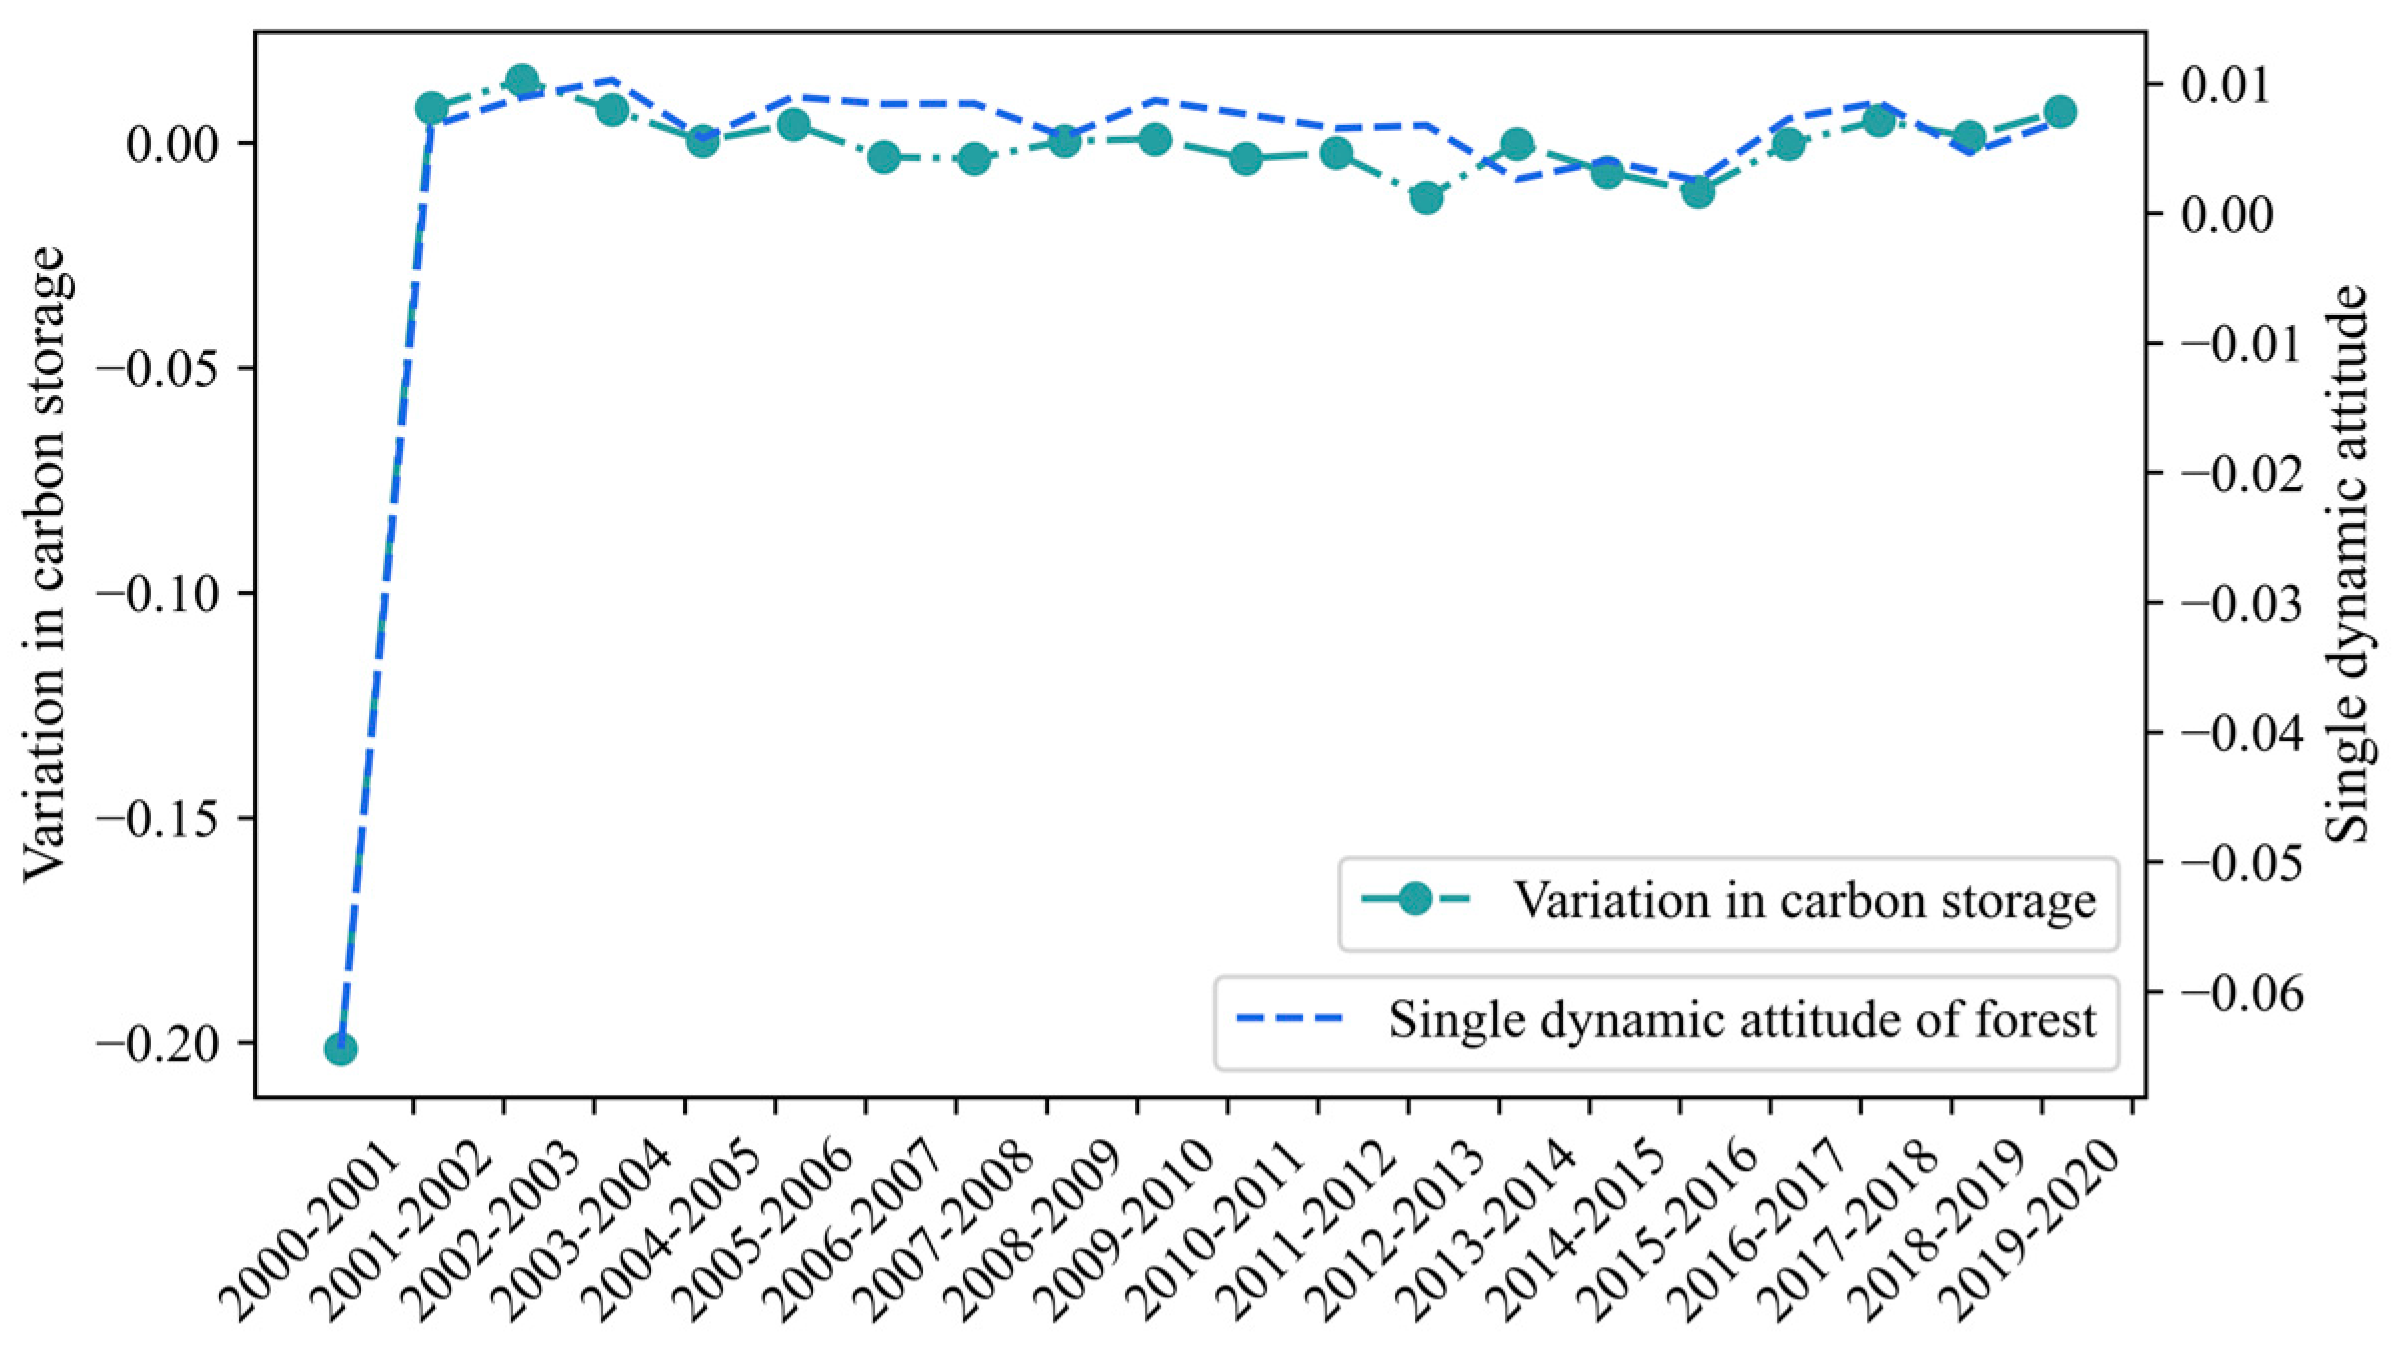
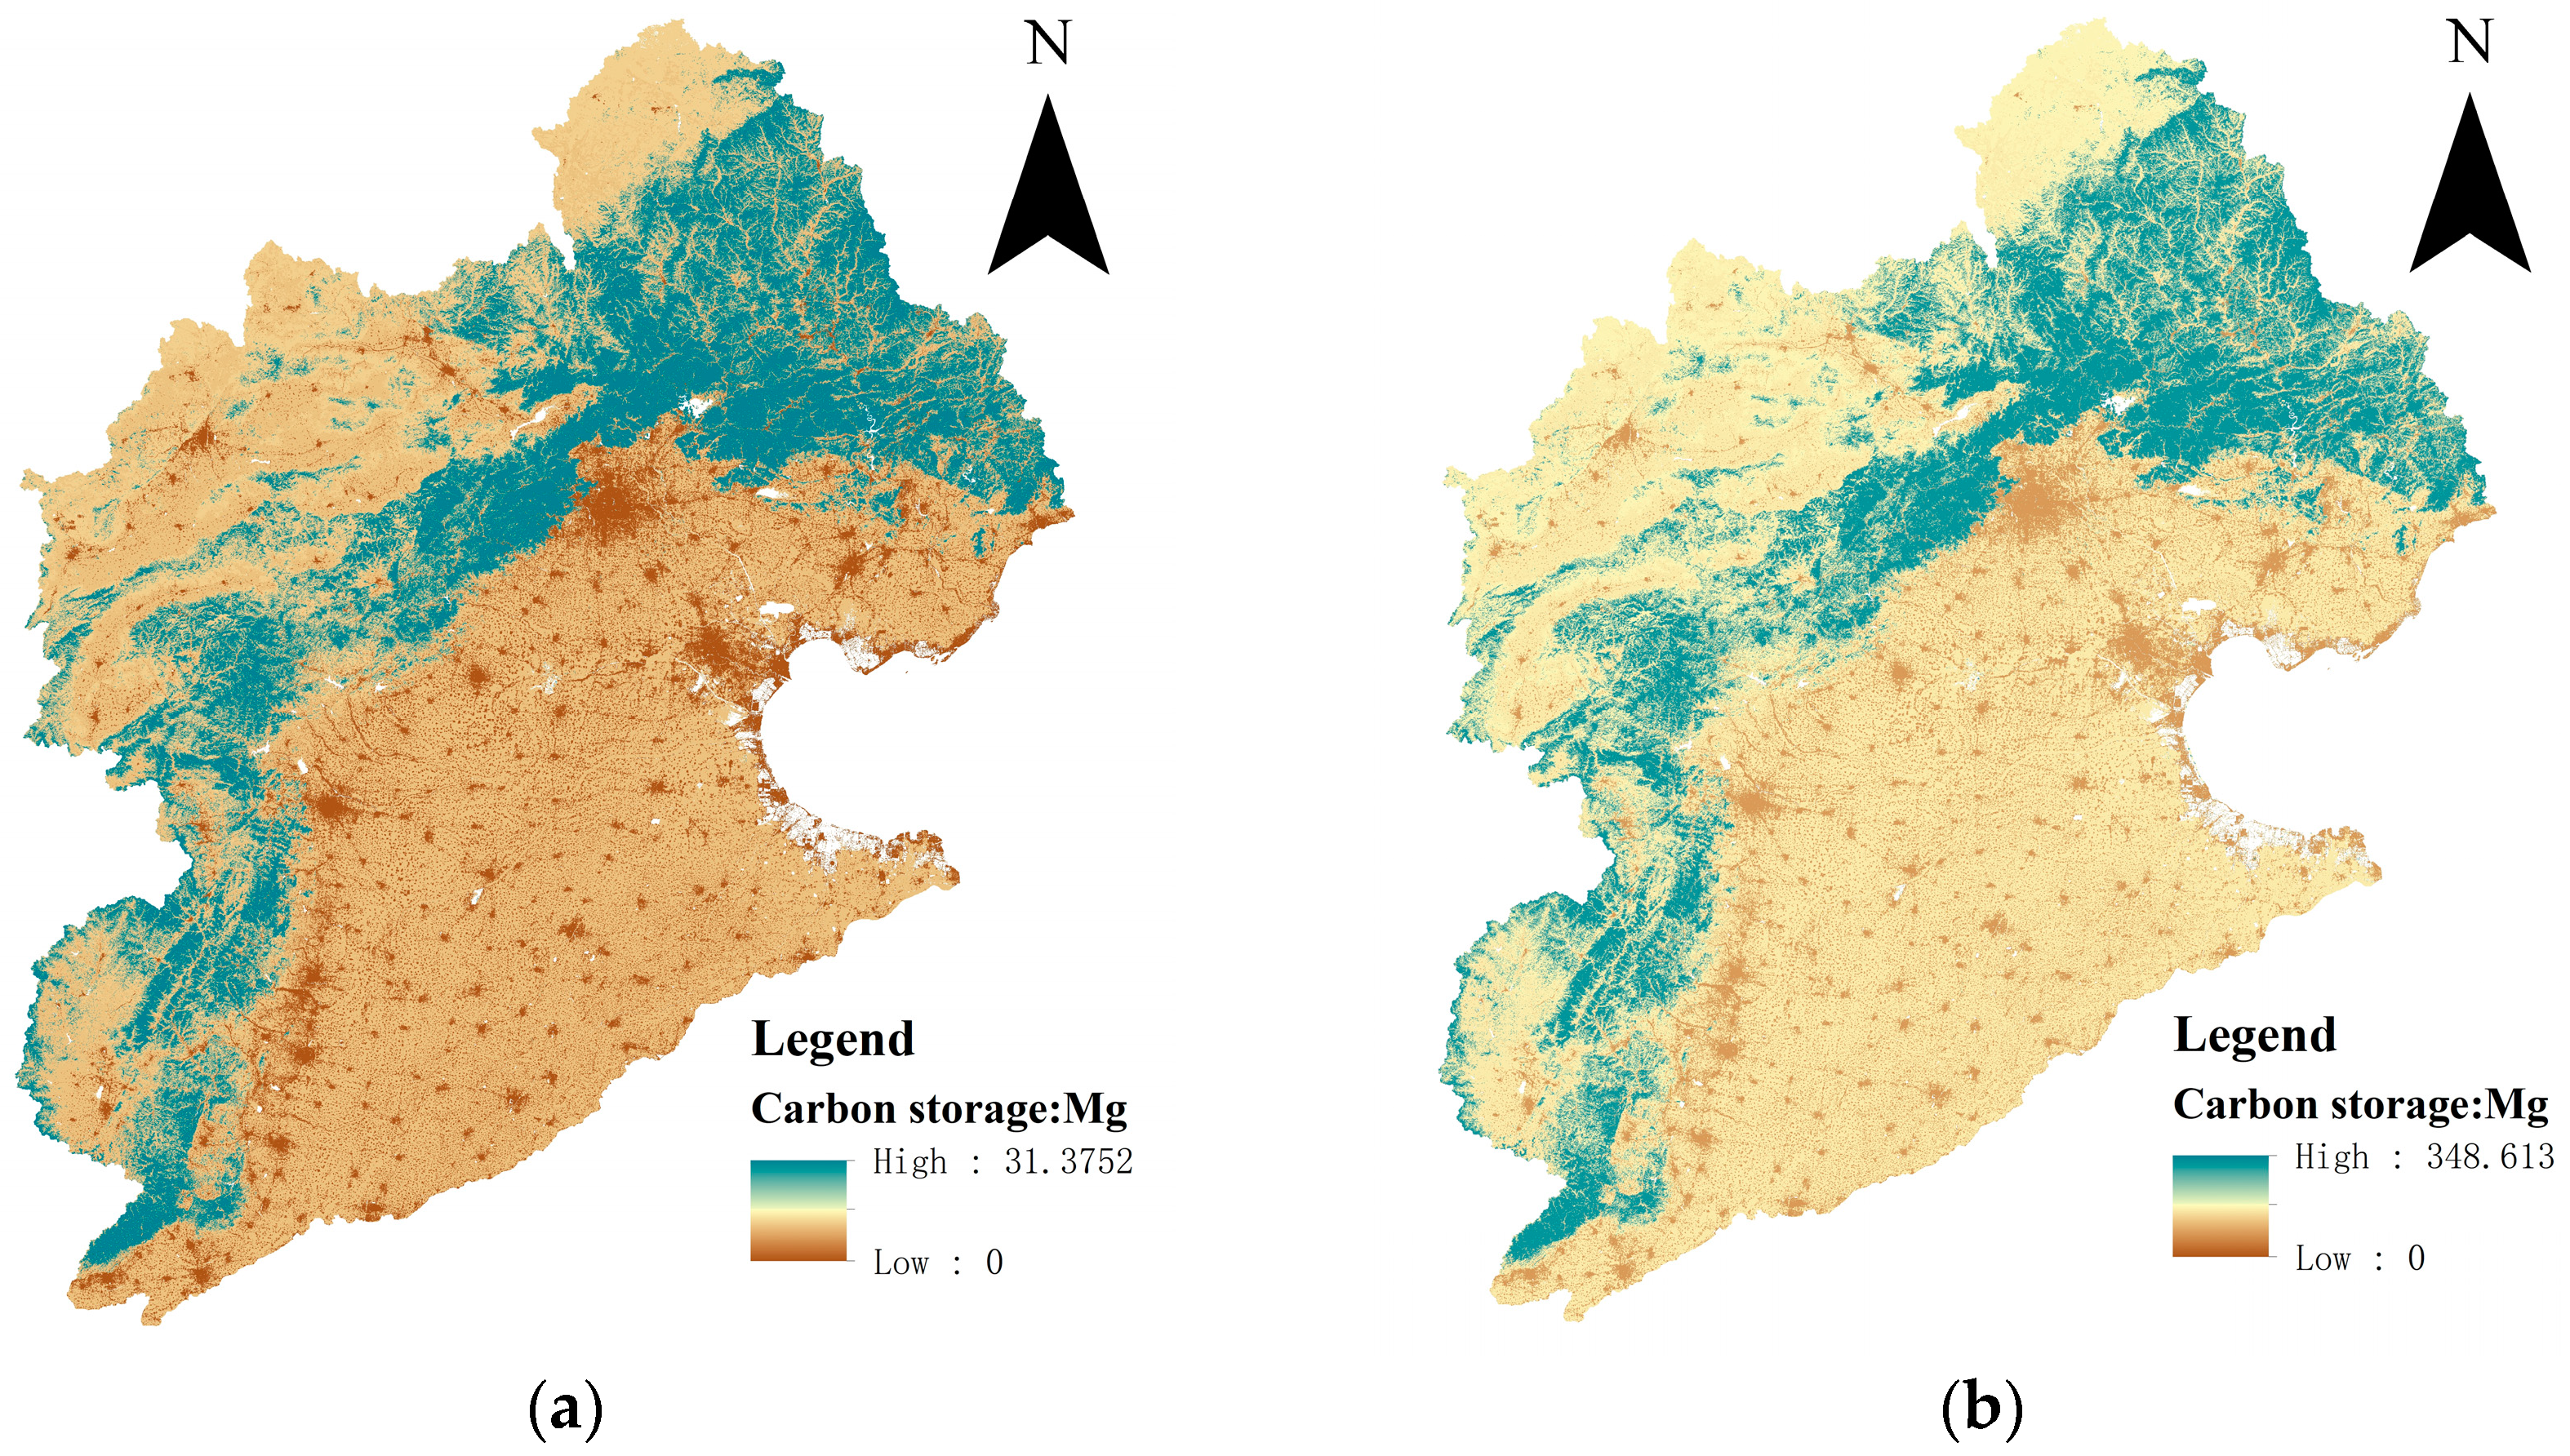
3.3. Response of Carbon Storage to LULC Changes
3.4. Forecast of LULC in 2025
3.5. Forecast of Carbon Storage in 2025
4. Discussion
4.1. The Balance between the Urbanization Process and Sustainable Development in Haihe River Basin
4.2. Water Resource Management in the Haihe River Basin
4.3. Reflection on Study Limitations and Challenges
5. Conclusions
Author Contributions
Funding
Data Availability Statement
Conflicts of Interest
References
- Wang, C.; Li, T.; Guo, X.; Xia, L.; Lu, C.; Wang, C. Plus-InVEST Study of the Chengdu-Chongqing Urban Agglomeration’s Land-Use Change and Carbon Storage. Land 2022, 11, 1617. [Google Scholar] [CrossRef]
- Ren, D.-F.; Cao, A.-H.; Wang, F.-Y. Response and Multi-Scenario Prediction of Carbon Storage and Habitat Quality to Land Use in Liaoning Province, China. Sustainability 2023, 15, 4500. [Google Scholar] [CrossRef]
- Ge, Q.; Dai, J.; He, F.; Pan, Y.; Wang, M. Land use changes and their relations with carbon cycles over the past 300 a in China. Sci. China Ser. D Earth Sci. 2008, 51, 871–884. [Google Scholar] [CrossRef]
- Ansari, A.; Golabi, M.H. Prediction of spatial land use changes based on LCM in a GIS environment for Desert Wetlands—A case study: Meighan Wetland, Iran. Int. Soil Water Conserv. Res. 2019, 7, 64–70. [Google Scholar] [CrossRef]
- Wang, X.; Bao, Y. Study on the methods of landuse dynamic change research. Prog. Geogr. 1999, 18, 83–89. [Google Scholar]
- Li, H.; Wu, J. Use and misuse of landscape indices. Landsc. Ecol. 2004, 19, 389–399. [Google Scholar] [CrossRef]
- Wang, Y.; Cheng, W. Dynamic Change and Trend Prediction of Land Use in Jingtai Country Based on FLUS Model. Territ. Nat. Resour. Study 2023, 05, 11–15. [Google Scholar] [CrossRef]
- Liu, Y. Study on the Evolution and Simulation of Land Use Landscape Pattern in the Lvzhijiang River Basin. Master’s Thesis, Yunnan University of Finance and Economics, Kunming, China, 2024. [Google Scholar] [CrossRef]
- Lian, H.; Qu, Z.; Liu, C.; He, Y. Spatio-temporal variation of landscape pattern and response of windbreak and sand fixation service in Hexi corridor of northern sand fixation belt. Chin. J. Appl. Ecol. 2023, 34, 2518–2526. [Google Scholar] [CrossRef]
- Du, H.; Mao, F.; Zhou, G.; Li, X.; Xu, X.; Ge, H.; Cui, L.; Liu, Y.; Zhu, D.; Li, Y. Estimating and Analyzing the Spatiotemporal Pattern of Aboveground Carbon in Bamboo Forest by Combining Remote Sensing Data and Improved BIOME-BGC Model. IEEE J. Sel. Top. Appl. Earth Obs. Remote Sens. 2018, 11, 2282–2295. [Google Scholar] [CrossRef]
- Zhang, L.; Zhou, G.; Ji, Y.; Bai, Y. Spatiotemporal dynamic simulation of grassland carbon storage in China. Sci. China Earth Sci. 2016, 59, 1946–1958. [Google Scholar] [CrossRef]
- Chu, L.; Zhang, X.; Wang, T.; Li, Z.; Cai, C. Spatial-temporal evolution and prediction of urban landscape pattern and habitat quality based on CA-Markov and InVEST model. Chin. J. Appl. Ecol. 2018, 29, 4106–4118. [Google Scholar] [CrossRef]
- Piyathilake, I.D.; Udayakumara, E.P.; Ranaweera, L.V.; Gunatilake, S.K. Modeling predictive assessment of carbon storage using InVEST model in Uva province, Sri Lanka. Model. Earth Syst. Environ. 2022, 8, 2213–2223. [Google Scholar] [CrossRef]
- Li, M.; Liang, D.; Xia, J.; Song, J.; Cheng, D.; Wu, J.; Cao, Y.; Sun, H.; Li, Q. Evaluation of water conservation function of Danjiang River Basin in Qinling Mountains, China based on InVEST model. J. Environ. Manag. 2021, 286, 112212. [Google Scholar] [CrossRef] [PubMed]
- Huang, W.; Liu, H.; Luan, Q.; Jiang, Q.; Liu, J.; Liu, H. Detection and prediction of land use change in Beijing based on Remote Sensing and GIS. Int. Arch. Photogramm. Remote Sens. Spat. Inf. Sci. 2008, 37, 75–82. [Google Scholar]
- Liu, M.; Hu, Y.; Chang, Y.; He, X.; Zhang, W. Land Use and Land Cover Change Analysis and Prediction in the Upper Reaches of the Minjiang River, China. Environ. Manag. 2009, 43, 899–907. [Google Scholar] [CrossRef]
- Araya, Y.H.; Cabral, P. Analysis and Modeling of Urban Land Cover Change in Setúbal and Sesimbra, Portugal. Remote Sens. 2010, 2, 1549–1563. [Google Scholar] [CrossRef]
- Park, S.; Jeon, S.; Choi, C. Mapping urban growth probability in South Korea: Comparison of frequency ratio, analytic hierarchy process, and logistic regression models and use of the environmental conservation value assessment. Landsc. Ecol. Eng. 2012, 8, 17–31. [Google Scholar] [CrossRef]
- Wang, S.W.; Munkhnasan, L.; Lee, W.-K. Land use and land cover change detection and prediction in Bhutan’s high altitude city of Thimphu, using cellular automata and Markov chain. Environ. Chall. 2021, 2, 100017. [Google Scholar] [CrossRef]
- Li, F.; Han, H.; Yang, S. Analysis of Land Use Change in Gansu Province from 2000 to 2020 and Multi-scenario Simulation of Gansu’s Ecological Space Based on PLUS. Sci. Technol. Eng. 2023, 23, 6316–6326. [Google Scholar]
- Aburas, M.M.; Ahamad, M.S.S.; Omar, N.Q. Spatio-temporal simulation and prediction of land-use change using conventional and machine learning models: A review. Environ. Monit. Assess. 2019, 191, 205. [Google Scholar] [CrossRef]
- Wei, M.; Du, C.; Wang, X. Analysis and Forecast of Land Use and Carbon Sink Changes in Jilin Province, China. Sustainability 2023, 15, 14040. [Google Scholar] [CrossRef]
- Wang, J.; Yin, X.; Liu, S.; Wang, D. Study on the change and prediction of spatiotemporal pattern of land use in Manasi region based on deep learning. Arid Zone Res. 2023, 40, 69–77. [Google Scholar] [CrossRef]
- Xing, W.; Qian, Y.; Guan, X.; Yang, T.; Wu, H. A novel cellular automata model integrated with deep learning for dynamic spatio-temporal land use change simulation. Comput. Geosci. 2020, 137, 104430. [Google Scholar] [CrossRef]
- Zhou, Y.; Huang, C.; Wu, T.; Zhang, M. A novel spatio-temporal cellular automata model coupling partitioning with CNN-LSTM to urban land change simulation. Ecol. Model. 2023, 482, 110394. [Google Scholar] [CrossRef]
- Qian, H.; Zhai, J.; Ma, M.; Zhao, Y.; Ling, M.; Wang, Q. Temporal and Spatial Variation of Vegetation Coverage and Its Driving Forces During the Growing Season in Haihe River Basin. Res. Soil Water Conserv. 2023, 30, 309–317. [Google Scholar] [CrossRef]
- Xu, L.; He, N.; Yu, G. A dataset of carbon density in Chinese terrestrial ecosystems (2010s). China Sci. Data 2019, 4, 21. [Google Scholar] [CrossRef]
- Wang, C.; Zhan, J.; Chu, X.; Liu, W.; Zhang, F. Variation in ecosystem services with rapid urbanization: A study of carbon sequestration in the Beijing–Tianjin–Hebei region, China. Phys. Chem. Earth Parts A/B/C 2019, 110, 195–202. [Google Scholar] [CrossRef]
- Li, J.; Xia, S.; Yu, X.; Li, S.; Xu, C.; Zhao, N.; Wang, S. Evaluation of Carbon Storage on Terrestrial Ecosystem in Hebei Province Based on InVEST Model. J. Ecol. Rural Environ. 2020, 36, 854–861. [Google Scholar] [CrossRef]
- Zheng, H.; Zheng, H. Assessment and prediction of carbon storage based on land use/land cover dynamics in the coastal area of Shandong Province. Ecol. Indic. 2023, 153, 110474. [Google Scholar] [CrossRef]
- Wang, Z.; Wang, B.; Zhang, Y.; Zhang, Q. Dynamic simulation of multi-scenario land use change and carbon storage assessment in Hohhot city based on PLUS-InVEST model. J. Agric. Resour. Environ. 2023, 1–18. [Google Scholar] [CrossRef]
- Zhang, C.; Xiang, Y.; Fang, T.; Chen, Y.; Wang, S. Spatio-Temporal Evolution and Prediction of Carbon Storage in Taiyuan Ecosystem under the Influence of LUCC. Saf. Environ. Eng. 2022, 29, 248–258. [Google Scholar] [CrossRef]
- Fu, J.; Zang, C.; Wu, W. Spatial and Temporal Variability Characteristics and Driving Mechanism of Land use in Haihe River Basin From 1990 to 2015. Chin. J. Agric. Resour. Reg. Plan. 2020, 41, 131–139. [Google Scholar]
- Ji, X.; Cao, Y.; Yao, J.; Zhai, H.; Fan, J. Land use and ecosystem carbon storage change and prediction in the Haihe River basin. South-North Water Transf. Water Sci. Technol. 2023, 21, 985–995. [Google Scholar] [CrossRef]


| Data Type | Sources |
|---|---|
| LULC in Haihe River Basin from 2000 to 2020 | CLCD from 1985 to 2021 (https://doi.org/10.5281/zenodo.5816591, accessed on 13 July 2023) |
| DEM and Slope | Resource and Environmental Science and Data Center of the Chinese Academy of Sciences (https://www.resdc.cn/, accessed on 1 August 2023) |
| Motorway, railway, and primary network | Geographic Information Professional Knowledge Service System |
| Precipitation and temperature | CRU TS (https://crudata.uea.ac.uk/cru/data/hrg/, accessed on 10 August 2023) |
| Carbon density in Chinese terrestrial ecosystems [27] | http://www.cnern.org.cn/data/meta?id=40579 http://www.sciencedb.cn/dataSet/handle/603, (accessed on 13 August 2023) |
| Index Type | Index Significance |
|---|---|
| Total Edge (TE)/m | Used to measure marginal diversity within ecosystems, LSI can be combined to further assess landscape complexity. |
| Largest Patch Index (LPI)/% | Used to assess the impact of human activities on landscape changes and ecosystem integrity. |
| Landscape Shape Index (LSI)/% | Used to describe the shape complexity of patches in ecological landscapes and reveal the degree of fragmentation of habitats |
| Interspersion and Juxtaposition Index (IJI)/% | Used to evaluate the degree of interlace and juxtaposition of different habitat types in the landscape, to reflect the spatial pattern and complexity of the habitat. |
| Proportion of Like Adjacency (PLADJ)/% | Used to comprehensively consider the spatial distribution, proximity, and similarity among habitat types. |
| Numbers of Patch (NP)/n | Used to measure the degree of dispersion and fragmentation of different habitat types in an ecological landscape. |
| Land Use Type | C_Above | C_Below | C_Soil | C_Dead |
|---|---|---|---|---|
| Others | 0 | 0 | 0 | 0 |
| Forest | 18.72 | 51.18 | 215.25 | 13.49 |
| Water | 0 | 0 | 0 | 0 |
| Built-up land | 0 | 0 | 70.87 | 0 |
| Shrub | 23.33 | 15.21 | 288.98 | 21.09 |
| Grassland | 15.59 | 38.2 | 90.77 | 10.09 |
| Barren | 0 | 0 | 0 | 0 |
| Wetland | 0.55 | 1.81 | 23.69 | 0.12 |
| Cultivated land | 2.52 | 35.64 | 98.50 | 9.39 |
| LULC | Others | Forest | Water | Built-Up Land | Shrub | Grassland | Barren | Wetland | Cultivated Land |
|---|---|---|---|---|---|---|---|---|---|
| 2020 | 172,554 | 6,923,916 | 449,089 | 4,547,813 | 121,522 | 5,438,430 | 27,463 | 16 | 14,836,740 |
| 2025 | 172,688 | 6,936,629 | 435,200 | 4,542,484 | 115,783 | 5,565,429 | 23,726 | 16 | 14,725,588 |
| +134 | +12,713 | −13,889 | −5329 | −5739 | +126,999 | −3737 | 0 | −111,152 |
Disclaimer/Publisher’s Note: The statements, opinions and data contained in all publications are solely those of the individual author(s) and contributor(s) and not of MDPI and/or the editor(s). MDPI and/or the editor(s) disclaim responsibility for any injury to people or property resulting from any ideas, methods, instructions or products referred to in the content. |
© 2024 by the authors. Licensee MDPI, Basel, Switzerland. This article is an open access article distributed under the terms and conditions of the Creative Commons Attribution (CC BY) license (https://creativecommons.org/licenses/by/4.0/).
Share and Cite
Lin, Y.; Chen, L.; Ma, Y.; Yang, T. Analysis and Simulation of Land Use Changes and Their Impact on Carbon Stocks in the Haihe River Basin by Combining LSTM with the InVEST Model. Sustainability 2024, 16, 2310. https://doi.org/10.3390/su16062310
Lin Y, Chen L, Ma Y, Yang T. Analysis and Simulation of Land Use Changes and Their Impact on Carbon Stocks in the Haihe River Basin by Combining LSTM with the InVEST Model. Sustainability. 2024; 16(6):2310. https://doi.org/10.3390/su16062310
Chicago/Turabian StyleLin, Yanzhen, Lei Chen, Ying Ma, and Tingting Yang. 2024. "Analysis and Simulation of Land Use Changes and Their Impact on Carbon Stocks in the Haihe River Basin by Combining LSTM with the InVEST Model" Sustainability 16, no. 6: 2310. https://doi.org/10.3390/su16062310
APA StyleLin, Y., Chen, L., Ma, Y., & Yang, T. (2024). Analysis and Simulation of Land Use Changes and Their Impact on Carbon Stocks in the Haihe River Basin by Combining LSTM with the InVEST Model. Sustainability, 16(6), 2310. https://doi.org/10.3390/su16062310