Article

Bark Browsing and Recovery: A Comparative Study between Douglas Fir and Silver Fir Species in the Western Carpathians

1
Forest Research Institute Zvolen, National Forest Centre, 96001 Zvolen, Slovakia
2
Faculty of Forestry and Wood Sciences, Czech University of Life Sciences Prague, 165000 Prague, Czech Republic
*
Author to whom correspondence should be addressed.
Sustainability 2024, 16(6), 2293; https://doi.org/10.3390/su16062293
Submission received: 1 February 2024 / Revised: 28 February 2024 / Accepted: 7 March 2024 / Published: 10 March 2024

Abstract

:
The foraging behavior of ruminating ungulates significantly impacts forest ecosystems due to their nutritional requirements. This study focuses on inter-specific comparisons of bark browsing (stripping) between Douglas fir (Pseudotsuga menziesii (Mirb.) Franco) and silver fir (Abies alba Mill.). Field measurements were conducted at the previously established research demonstration site “Husárik” in the Javorníky Mountains, north-western Slovakia. We measured the sizes of wounds on stems and assessed the dimensions of unrecovered parts of wounds, subsequently calculating areas of recovered bark patches. Then, the total areas of wounds recovered patches, and unrecovered parts were measured. Additionally, the percentages of wound areas, recovered areas, and unrecovered areas were expressed as proportions relative to the total bark surface. Influencing factors such as the position of wounds along the vertical stem profile and stem diameter class were analyzed using two- and three-way ANOVA followed by Fisher’s LSD test. The results demonstrate the susceptibility of both tree species to bark browsing by ruminating ungulates, primarily red deer (Cervus elaphus L.) in our study site. Douglas fir exhibited slightly less intense browsing compared to silver fir, while silver fir had a slightly higher recovery rate. Specifically, 17.0% of the bark surface in Douglas fir and 21.5% in silver fir were browsed. The proportions of recovered areas on wounds were 62.5% and 69.6% in Douglas fir and silver fir, respectively. Regarding the vertical stem profile, the most intense browsing occurred at a height of 101–125 cm from the ground level, with rates of 40.7% in Douglas fir and 47.0% in silver fir. Browsing intensity showed negligible variation among diameter classes, which were classified as up to 35 mm, 35–50 mm, and over 50 mm. Our findings suggest that, as an introduced species, Douglas fir is not a suitable substitute for other commercially significant tree species in supporting sustainable forestry in European countries where ruminating ungulates are overabundant.

1. Introduction

Forests play a crucial role in providing a diverse array of ecosystem services essential for human well-being. The sustainability of forests is paramount in fulfilling this mission, hinging upon the maintenance of continuous forest cover [1] and the prevention of tree damage and stand disturbances [2]. The vitality of forest stands, encompassing aspects such as ecosystem services, biodiversity, and long-term wood yield within the framework of sustainable development at the stand level, relies significantly on effective management during the stages of forest regeneration and young growth. Therefore, these critical stages must be safeguarded against both abiotic and biotic threats (e.g., [3]). Outputs from the Slovak National Forest Inventory highlight ruminating ungulate game as the most prevalent harmful agent in forest stands of the first age class [4], which is related to the overabundance of this game group. Actually, a high population density of ruminating ungulate game is not unique only to Slovakia but is observed in numerous European countries [5,6,7,8]. Consequently, the overabundance of game poses a significant challenge to the sustainable management of forests, both at present and in the foreseeable future across Europe.
The findings from the Slovak National Forest Inventory [4], for instance, revealed that the trees most impacted by game browsing extended beyond softwood broadleaved species, which typically have lower economic contributions, even commercial species like the silver fir (Abies alba Mill.). The silver fir, in particular, often experiences intense damage from ruminating ungulates, especially during its initial growth stages. Seedlings are commonly damaged by the biting off of shoots, while saplings or larger trees face harm mostly through stem bark browsing [9]. Several authors [10,11] have demonstrated that game browsing can lead to a significant decrease in species composition and, in many cases, the complete disappearance of the silver fir. This is a critical concern given the importance of the silver fir as a tree species in many Eurasian regions from both production and ecological perspectives [12]. For example, the silver fir plays a vital role in mixed forest stands by improving soil conditions [13], enhancing species biodiversity [14], and supporting wood productivity [15]. Given these ecological and economic benefits, actively managing silver fir through forest management practices [16] and implementing game management strategies, even if it involves reducing game population density [17], becomes imperative.
While silver fir is an autochthonous species in Europe [12], Douglas fir (Pseudotsuga menziesii (Mirb.) Franco) originates from North America and was introduced to Europe [18]. This species has a rather similar habitus (branching, needle shape, bark surface structure, etc.) but significantly different ecological and production properties compared to silver fir. According to Podrázský et al. [19], Douglas fir is the most commonly utilized introduced tree species in the temperate zone, planted in many European countries. Since both silver fir and Douglas fir are more resistant to drought stress than Norway spruce (Picea abies Karst. L), they might be suitable substitutes for spruce-dominant forests under ongoing climate change [20]. However, for Slovakia, a country with an overabundance of ruminating ungulates, a crucial task might be determining whether Douglas fir is less susceptible to browsing by game compared to other tree species that could serve as substitutes.
In the countries of Central and Western Europe, red deer (Cervus elaphus L.) are the biggest ruminating ungulates and generate the most harm to forests through browsing [6]. In these regions, the second and third most frequent ruminating ungulates are roe deer (Capreolus capreolus L.) and fallow deer (Dama dama L.). However, since the weight of fallow deer and roe deer are about three times and six times lower, respectively, than that of red deer, they have much lower demands for forage quantity. Therefore, they cause much less damage to forest stands [21]. Hence, in Slovakia and other Central European countries, red deer are the primary contributors to bark browsing (stripping) in forest trees. Bark stripping can result in significant economic losses due to wood deformations and/or infections from wood-decaying fungi [22,23]. Beyond these direct consequences, tree stems affected by bark stripping and subsequent rotting are susceptible to snow or wind breakages.
Previous studies have predominantly focused on the evaluation of stem bark browsing, employing simple quantification methods such as the measurement of the area of browsed stem bark at a tree level [24] or the rate of browsed trees at a stand level [25]. Another attempt was made to assess the effects of bark stripping on timber production in Norway spruce [26]. However, we could not find any work related to bark recovery after stripping, much less any findings on inter-specific differences in this recovery process (e.g., time duration of complete recovery and impact on timber quality after recovering) for Douglas fir or silver fir.
The primary objective of our study was to conduct inter-specific comparisons of bark damage intensity caused by game browsing between Douglas fir and silver fir. Additionally, we aimed to extend these comparisons to assess bark recovery after stripping in both tree species. Furthermore, our focus included the analysis of certain tree characteristics, such as stem thickness and position within the stem vertical profile, to understand bark browsing intensity in both Douglas fir and silver fir.

2. Materials and Methods

2.1. Study Site

Our field study took place at the research–demonstration site known as “Husárik” (hereinafter referred to as the Husárik site), situated within the Javorníky Mountains in the Kysuce region of north-western Slovakia. The climatic conditions at the Husárik site are characterized by cold and humid weather, with an average temperature of approximately 16 °C in July and nearly −5 °C in January [27]. The mean annual temperature registers at 6 °C, annual precipitation reaches nearly 1100 mm, and snow cover lasts for around 90 days per year. The bedrock in the Javorníky Mountains is formed predominantly from clay stones and shales with modally acidic, mostly clayey soil. The Husárik site is classified as an Abieto–Fagetum forest type [28]. This classification indicates that the natural forests in this area primarily comprise European beech (Fagus sylvatica L.) with silver fir.
At the Husárik site, akin to numerous locations within the Javorníky Mountains, secondary spruce-dominated monocultures have experienced a notable decline, particularly since the onset of the current century. This decline can be predominantly attributed to climatic extremes, exemplified by the exceptionally dry conditions observed in 2003 and the subsequent outbreaks of bark beetles. Consequently, in 2010, the mature stands at the Husárik site were subjected to “incidental felling,” which involved the removal of trees that had already died, become weakened, or were affected by insect and fungal infestations.
The Husárik site belongs to nearly 3000 hectares of a hunting ground; the area comprises 2/3 of forest and 1/3 of crop fields and grasslands. According to records from the local hunting association, the very early spring (pre-parturition) of 2010 revealed the presence of fifty red deer, sixty roe deer, fifty mouflons, and fifty fallow deer within the hunting ground. In the spring of 2023, the counts increased to thirty-five red deer, fifty roe deer, thirty mouflons, and sixty fallow deer. A study by Červený et al. [9] indicated that roe deer consume approximately a quarter, mouflons a third, and fallow deer half of the forage eaten by red deer. Considering these inter-specific comparisons within the studied hunting ground, it can be estimated that red deer account for 40%, roe deer for 14%, mouflons for 11%, and fallow deer for 35% of the total forage consumed by ruminating ungulates. Although this is a very simplified estimation due to the varied diet composition of each species, it highlights that three-quarters of the consumed forage is attributed to red deer and fallow deer combined. Moreover, the proportion of bark browsing is likely higher for these two species, as roe deer exclusively browse on foliage and shoots. In spite of the fact that mouflons also occasionally browse on stem bark, their forage demands in the studied area are considerably lower than those of red and roe deer, making their contribution to total stem bark browsing negligible (see also [29]).

2.2. Stand Description

At the beginning of 2011, a series of experiments were initiated to evaluate various reforestation and silvicultural strategies. The experiments included exclusive natural regeneration, tree planting, and combinations of both, with varying proportions of natural regeneration and planting. Additionally, different combinations of tree species were explored [30]. In 2011, a protective fence was constructed around a five-hectare section of the Husárik research–demonstration site dedicated to artificial regeneration experiments. This fence, standing at a height of 2.4 m with a mesh size of 45 × 45 mm, effectively restricted, for certain periods, access by ruminating ungulates to the enclosed area. For our measurements, we focused on a portion of the enclosure, representing the plantation of two coniferous species, specifically Douglas fir and silver fir, with an equal distribution of both species (1:1 ratio). The targeted forest complex occupied approximately 0.2 hectares.
The scenario involving the exclusion and subsequent presence of ungulates within the fenced area necessitates a detailed explanation. Approximately seven years after the fence’s construction, some sections of it were damaged. As a result, sporadic sightings of red deer, fallow deer, roe deer, and mouflons occurred within the enclosed space. Despite diligent repairs to the fence in 2019 and 2021, additional damage was sustained between 2019 and 2022. Our assessment suggests that the upper portion of the fence was primarily damaged by red deer, while the lower section bore evidence of wild boar activity (Sus scrofa L.). It appeared that the wild ungulates discerned differences in tree species composition between the stands outside the fence, where less appealing species for nutrition, such as Douglas fir and silver fir, were prevalent. The game, particularly red deer and wild boar, likely “learned” methods to breach the fence and gain access. Consequently, this altered situation provided an opportunity to estimate stem bark browsing on young trees (12 years old) over a brief period spanning three years under heightened population pressure from ungulates. In practice, our initial observations revealed instances of bark browsing during the winter seasons of 2019/2020, 2020/2021, and 2021/2022, but not any in 2022/2023 (no fresh wounds were recorded within the observations performed in autumn 2023).

2.3. Measurements and Analyses
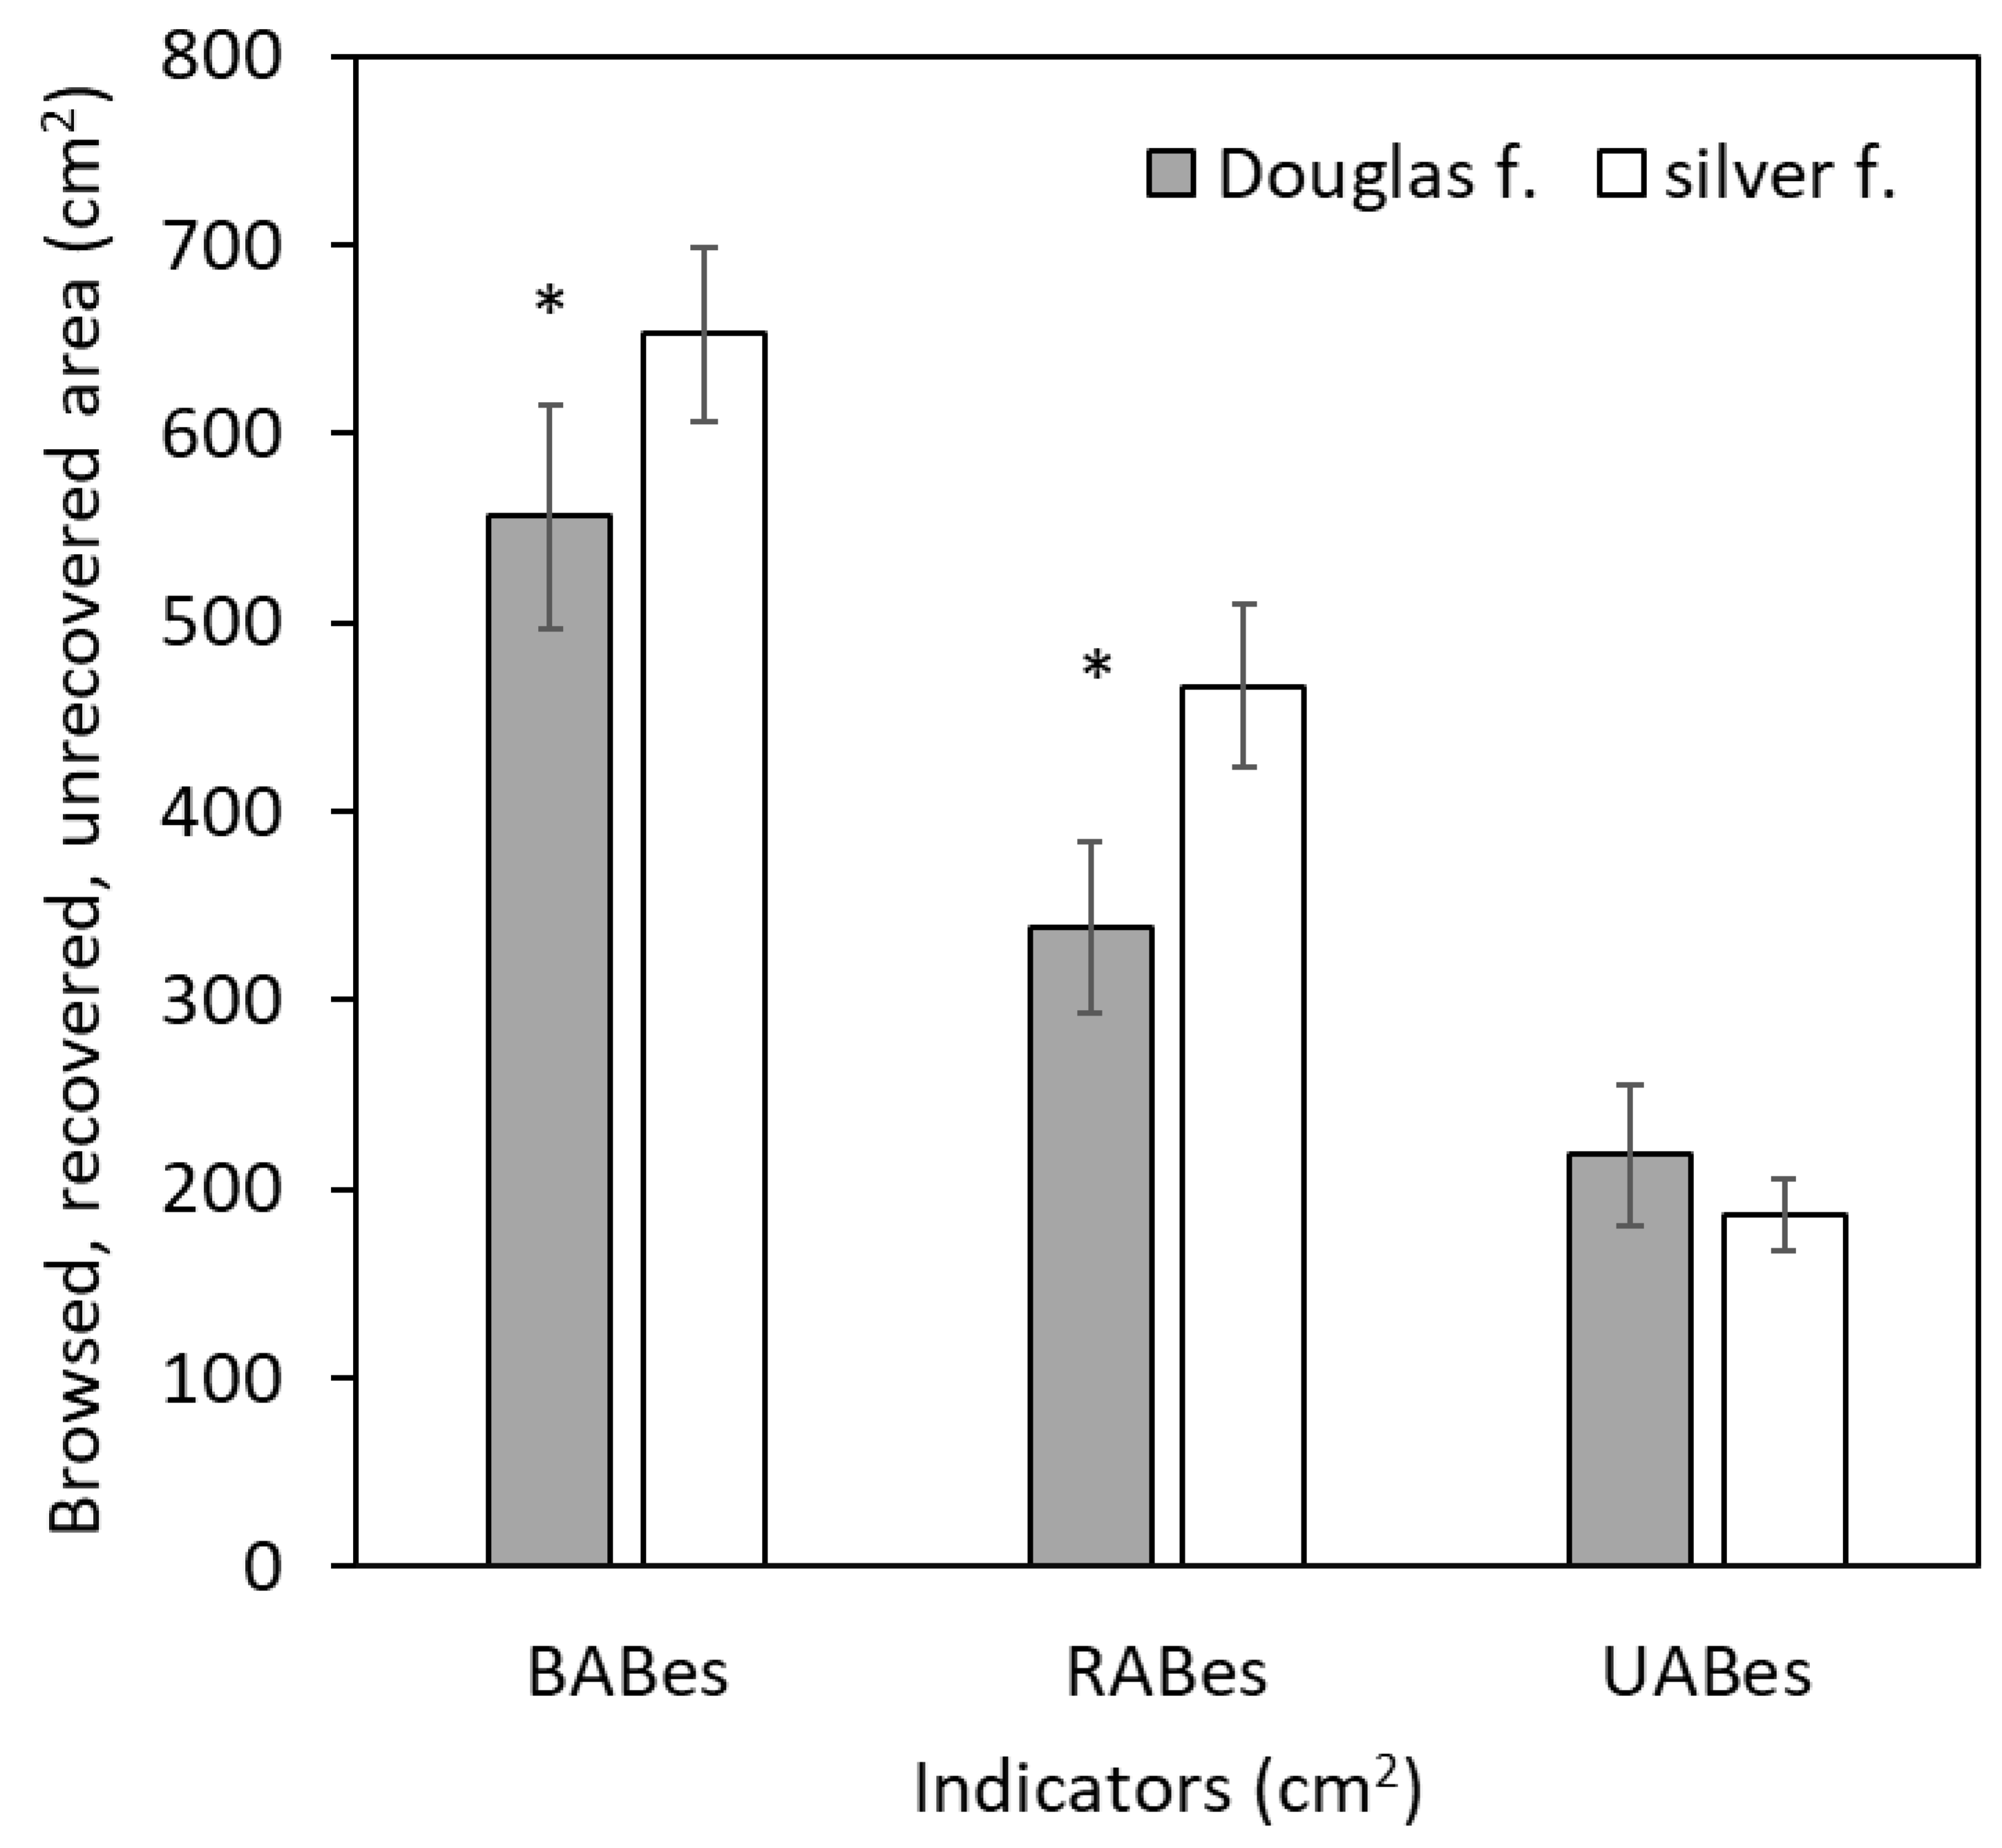
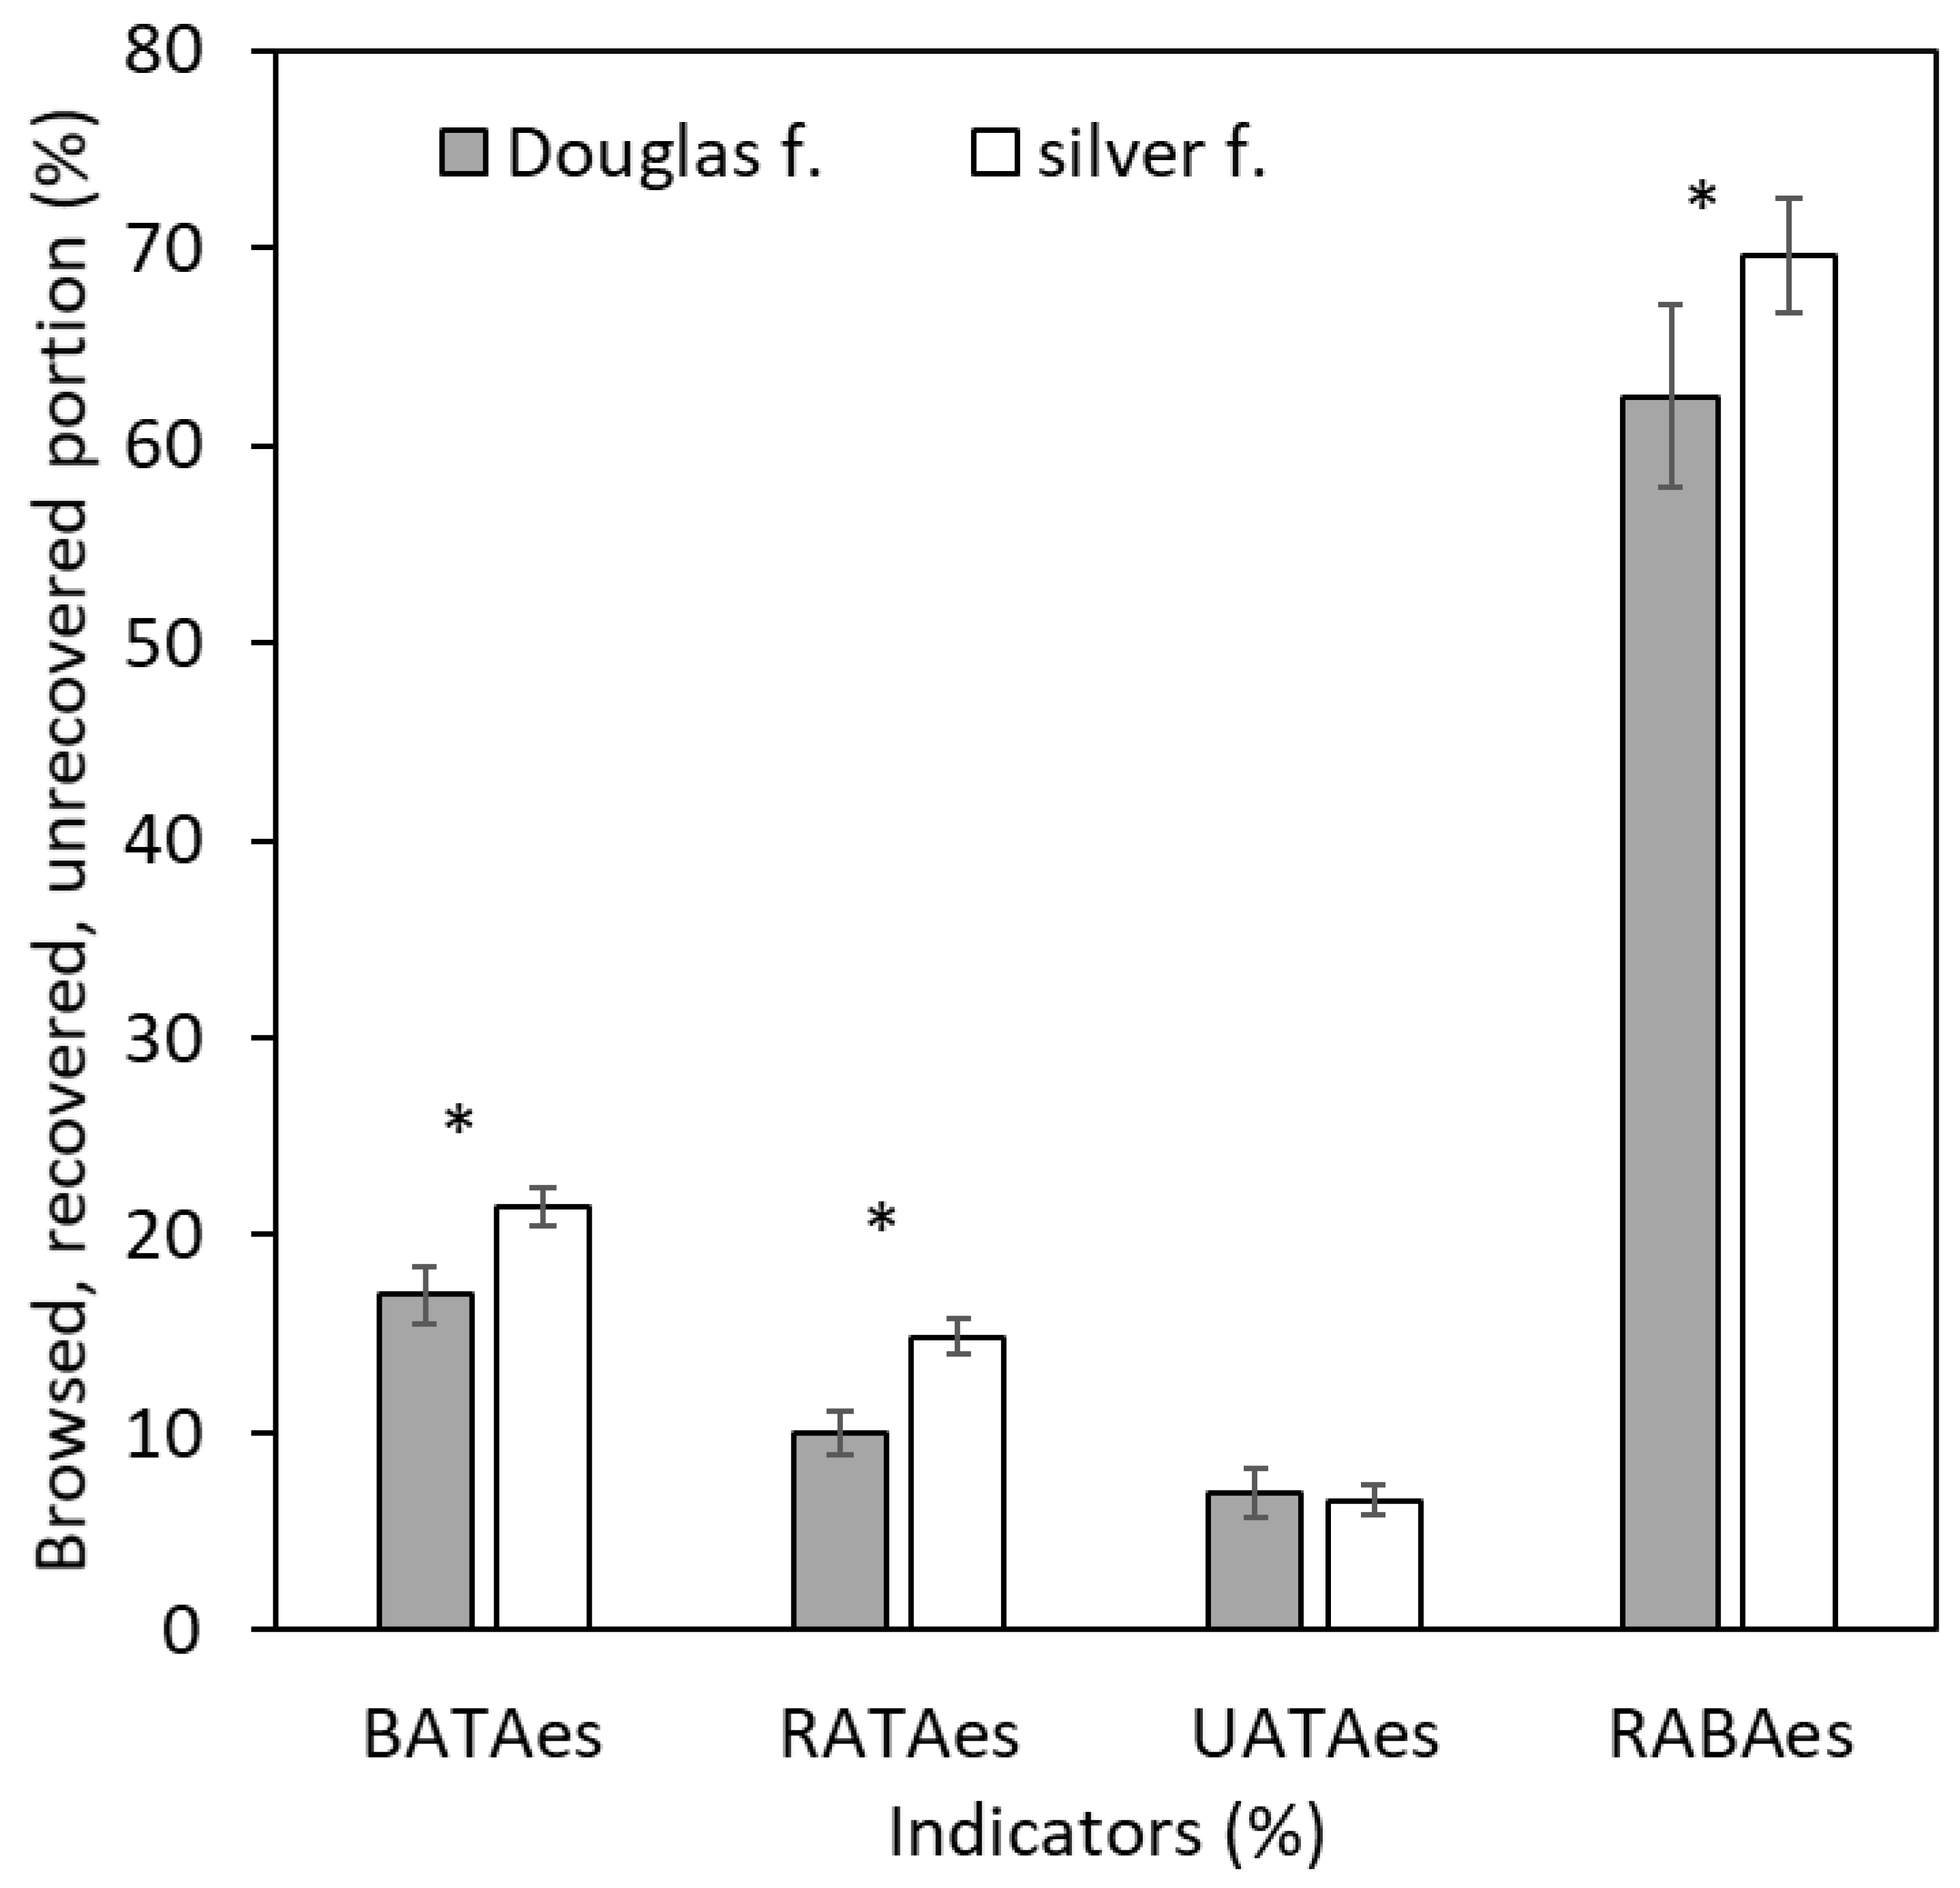
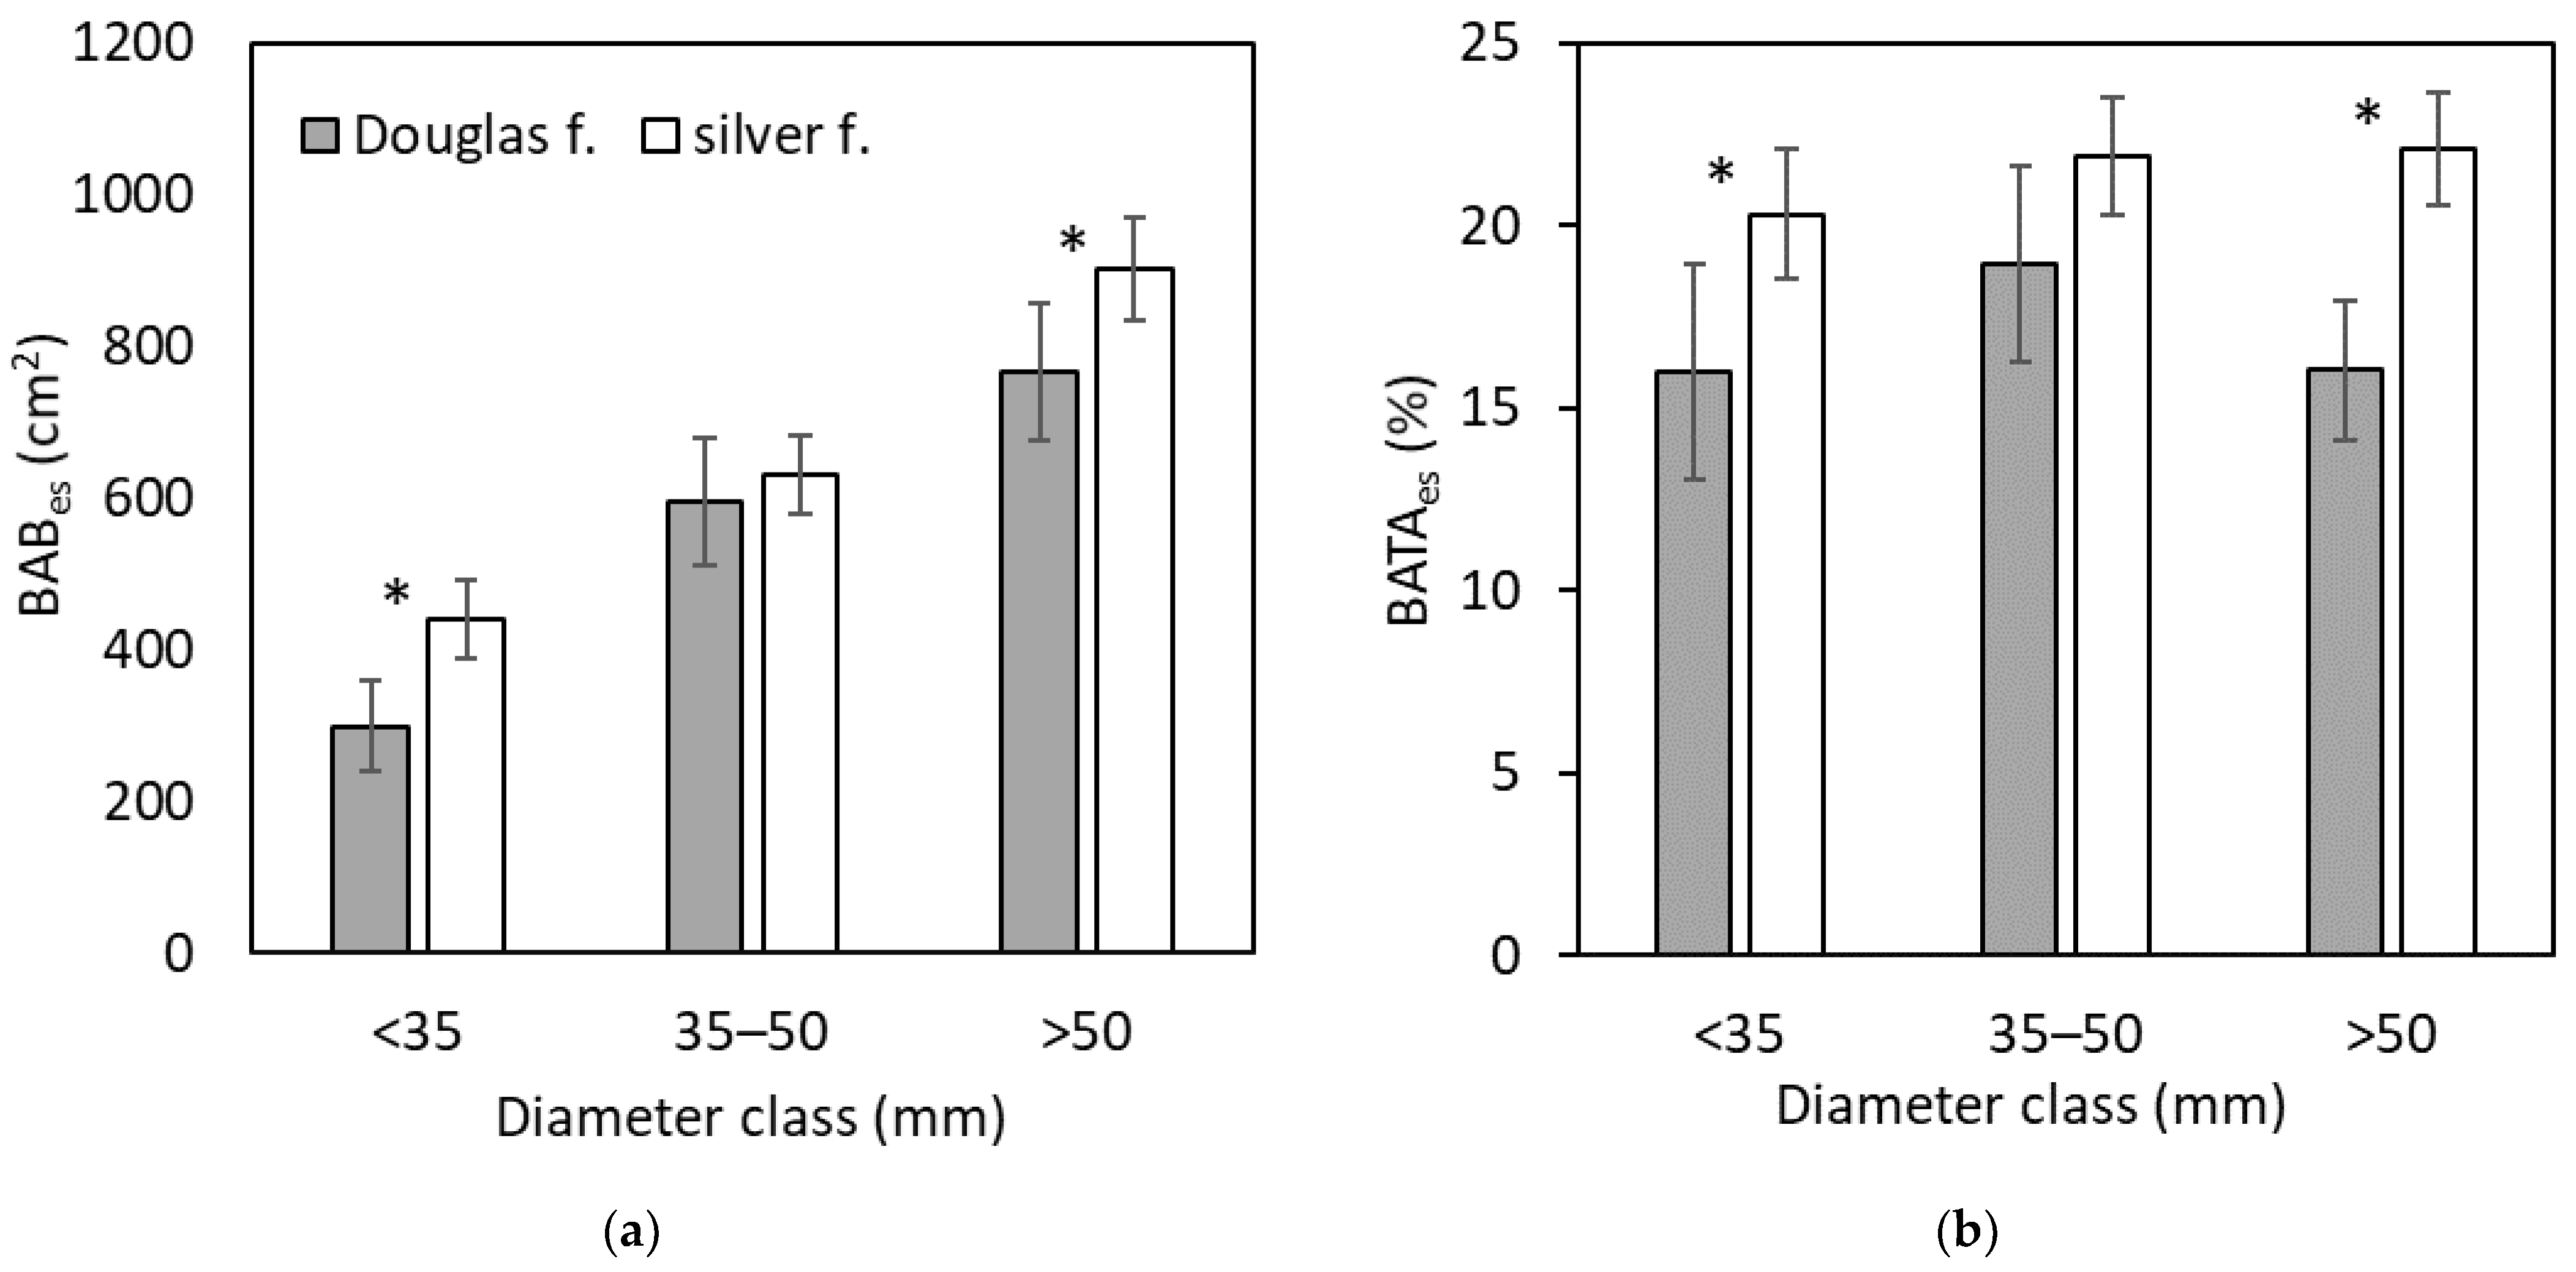
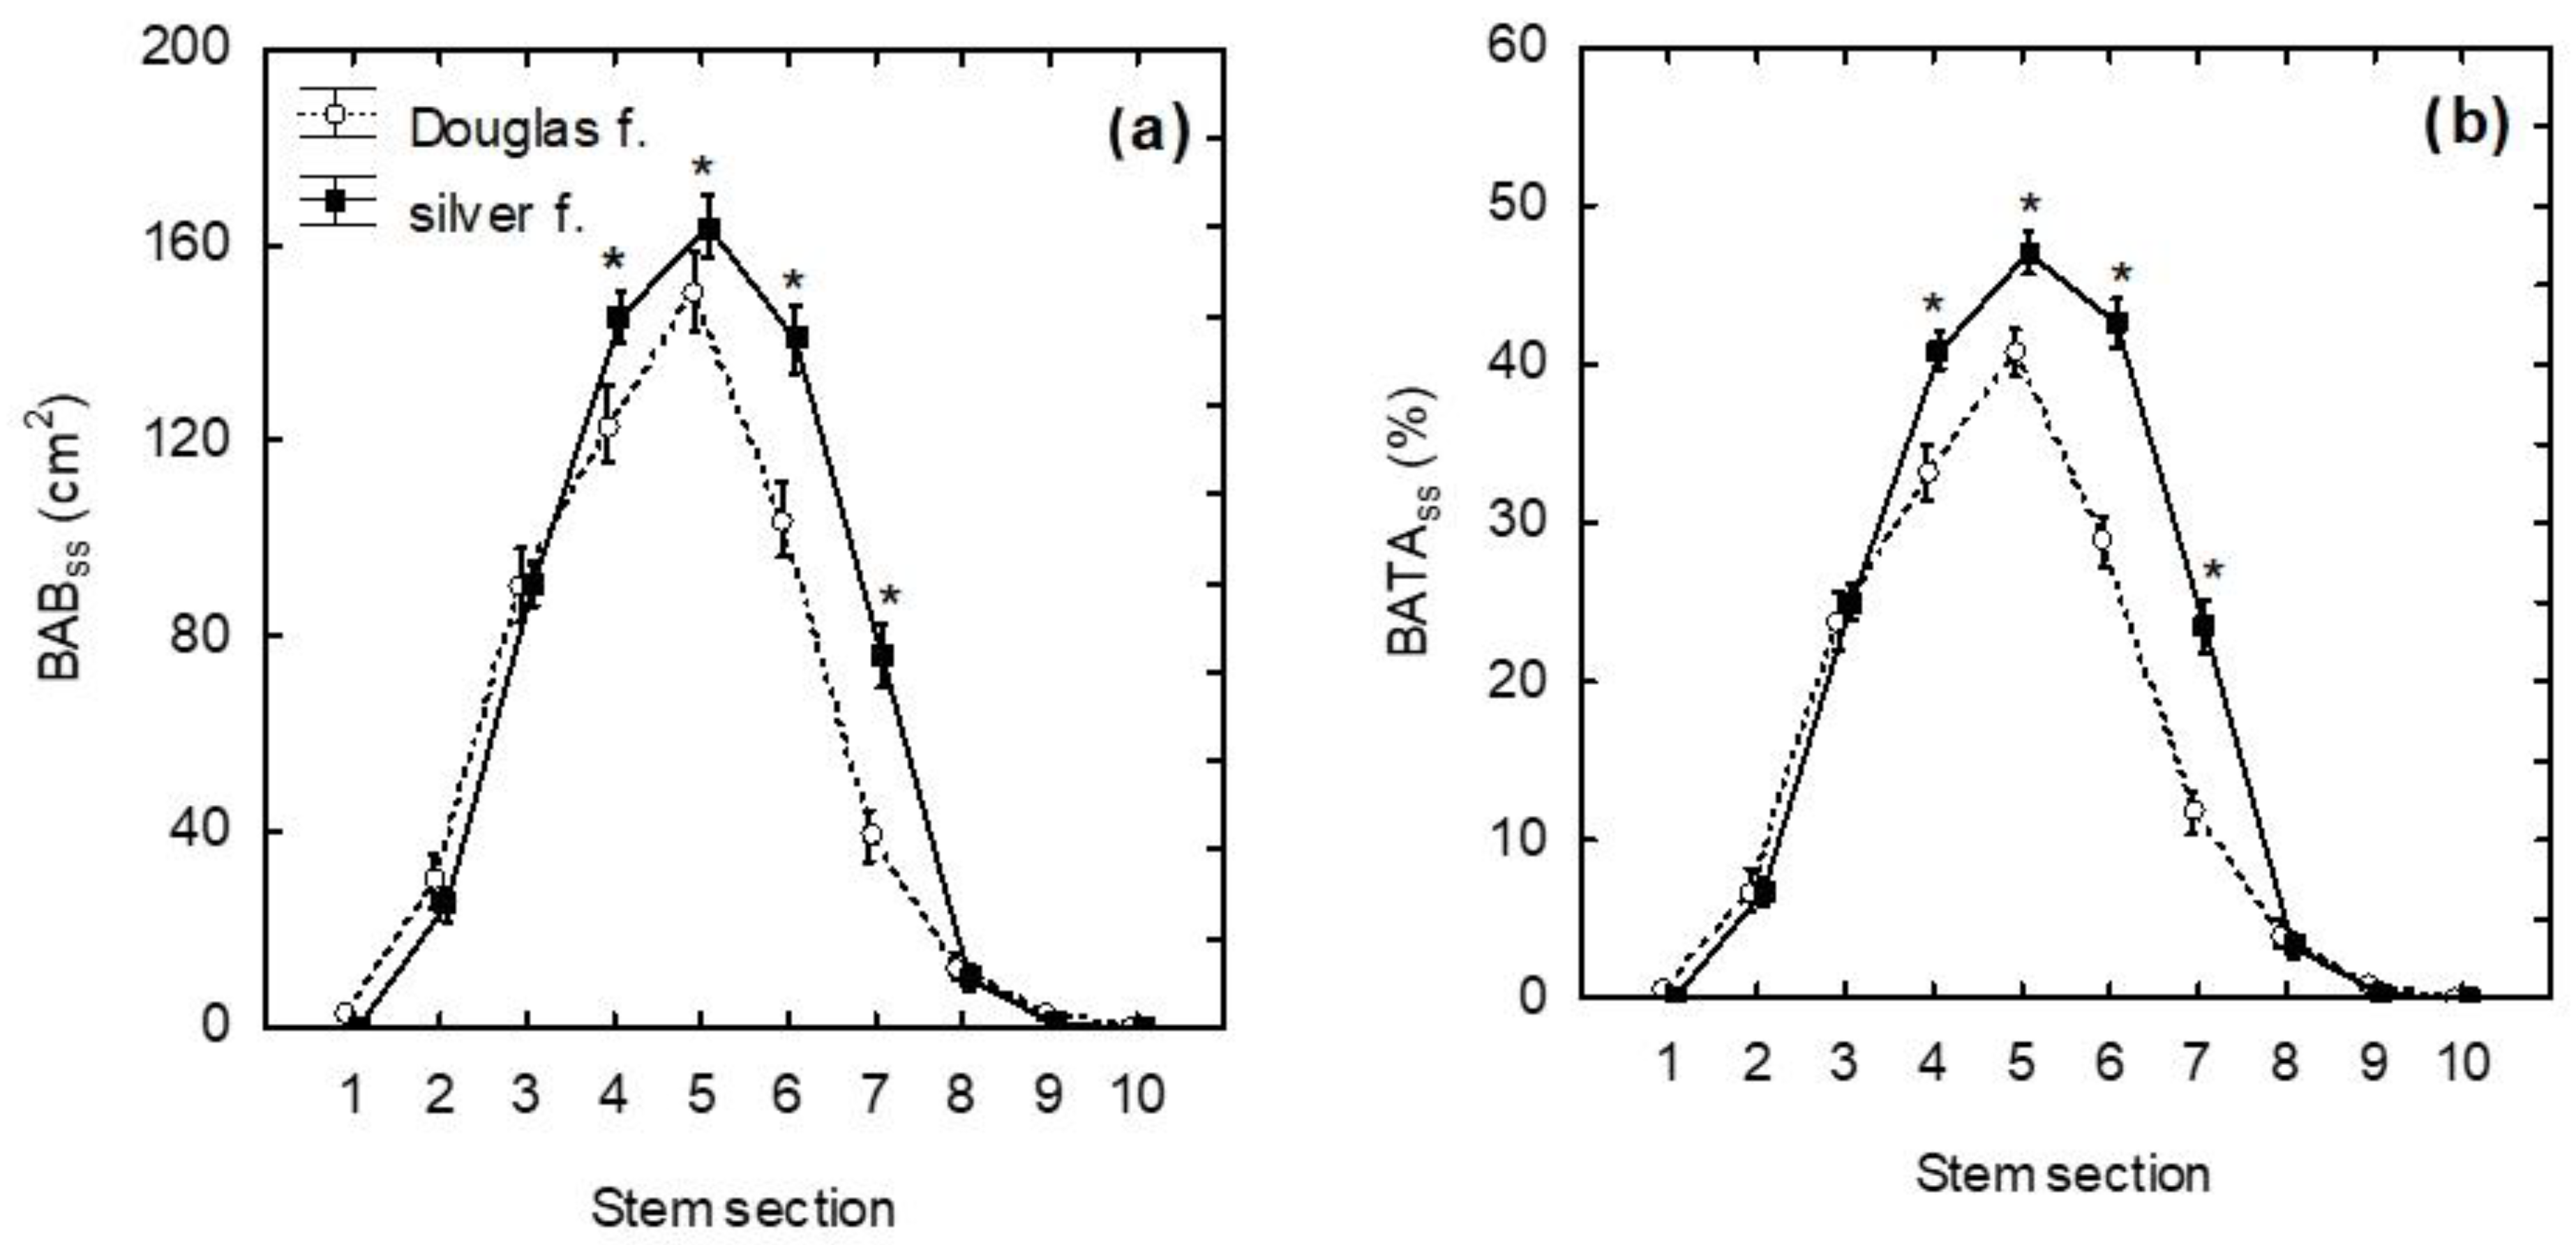
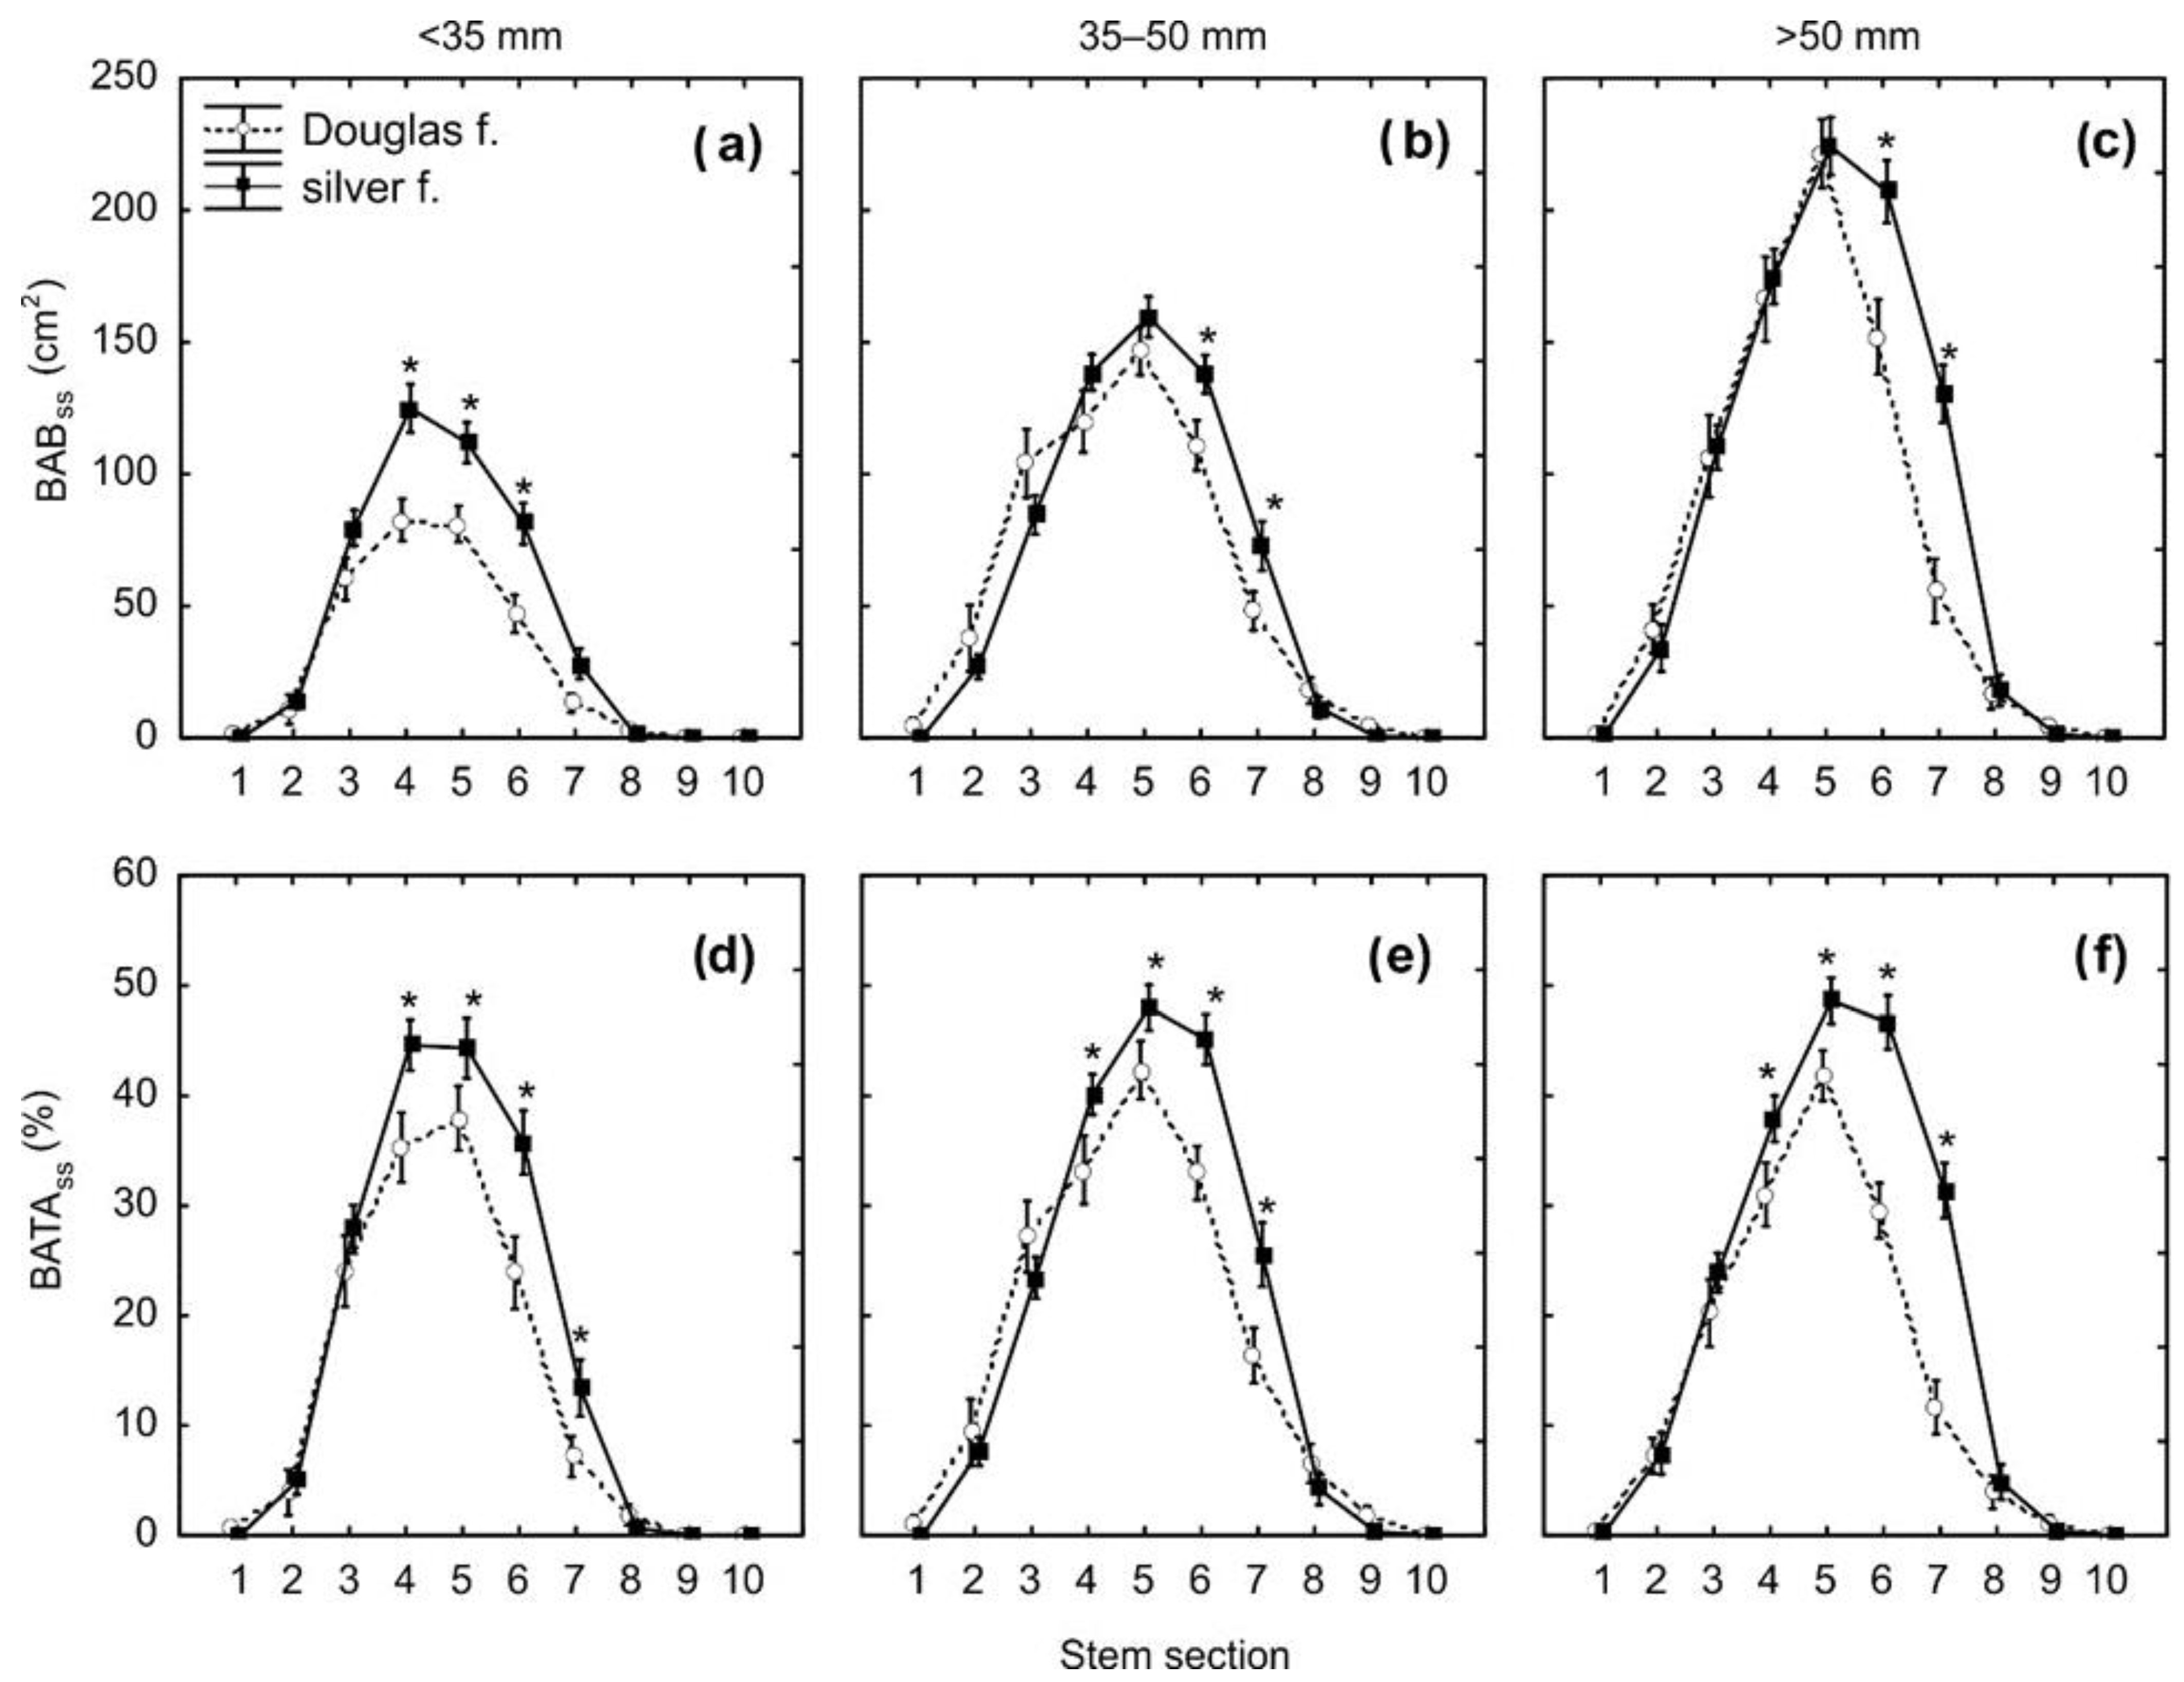
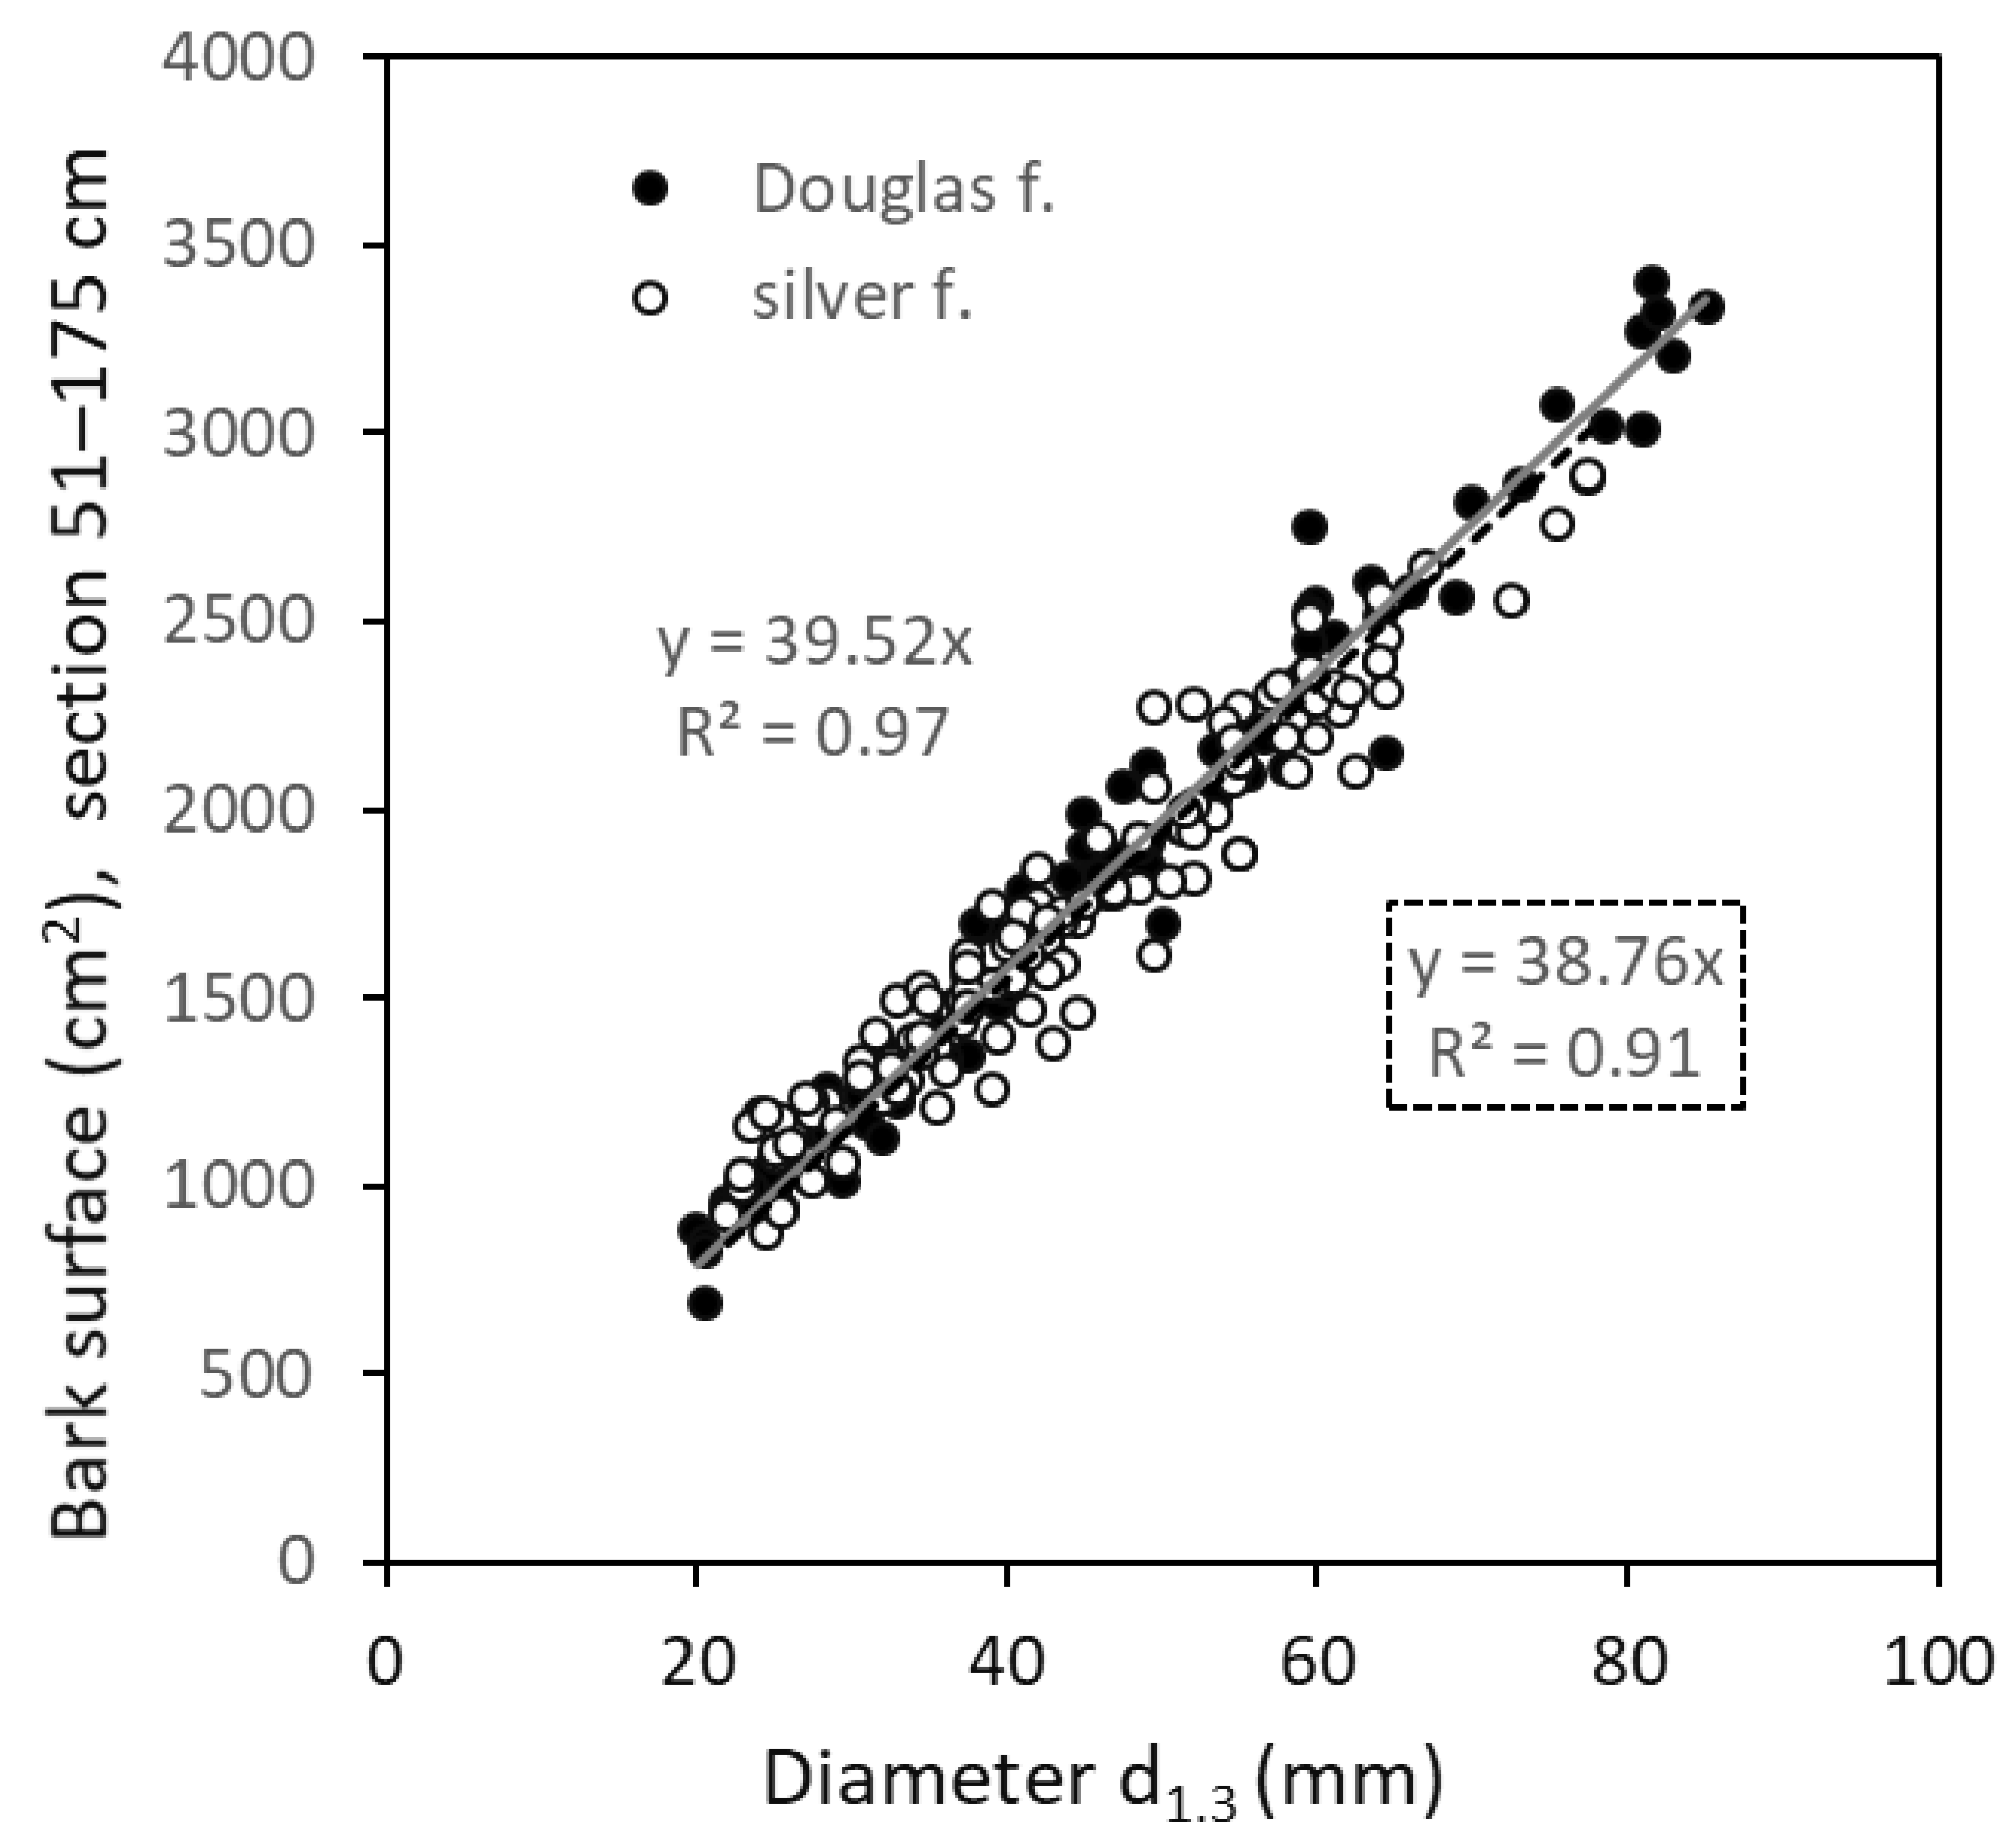
In autumn 2023, we randomly selected 100 Douglas firs and 110 silver firs from the entire stand area, which were then subjected to our measurements. Specifically, tree heights were measured using a hypsometer TruPulse 360° R (Laser Technology, Inc., Centennial, CO, USA) with a precision of ±0.1 m. Simultaneously, stem diameter d1.3 (situated 130 cm from the ground level) was measured with a digital caliper Masser BT (Masser Precision, Rovaniemi, Finland) with a precision of ±0.1 mm.
Subsequently, we divided the vertical profile of each stem into 25 cm-long sections marked by chalk. The diameters at the lower and upper borders of each section were measured with digital calipers at a precision of ±0.1 mm. Each stripped (browsed) area was measured, specifically its vertical dimension with digital calipers (precision of ±0.1 mm) and its horizontal dimension with a rolling measuring tape (±1.0 mm). If the browsed area extended across stem sections, it was proportionally divided between them. Similarly, we measured the area of the unrecovered part of the wound, representing the inner part of the browsed area (see Figure A1 in Appendix A). Subsequently, the recovered (healed) area was calculated for each wound as the difference between the wound area and the area of the unrecovered part.
Then, the total surface of stem bark was calculated for each stem section using the formula for the surface of the truncated cone excluding the areas of bottom and top cross-sections, i.e.,
S b = π   r 1 + r 2   ( r 1 r 2 ) 2 + l s 2  
where:
Sb is the stem bark surface (cm2),
r1 is the radius of the bottom end (cm),
r2 is the radius of the top end (cm),
ls is the length of the section (i.e., 25 cm).
Later, the total surface of the stem bark along the entire targeted profile, up to a height of 250 cm, was calculated as the sum of surfaces in 25 cm-long consecutive sections (i.e., 0–25 cm, 26–50 cm, 51–75 cm, 76–100 cm, 101–125, 126–150 cm, 151–175 cm, 176–200 cm, 201–225 cm, and 226–250 cm from the ground level).
Afterward, seven stem bark browsing metrics were used. These, expressed in square centimeters, included the browsed areas of bark (abbreviated as BAB), recovered areas of bark (RAB), and unrecovered areas of bark (UAB, see also Table 1). The other four indicators were expressed as percentage matrices: browsed area of bark to total bark area (BATA), recovered area of bark to total bark area (RATA), uncovered area to total bark area (UATA), and recovered bark area to browsed area (RABA, summarized in Table 1).
Practically, we calculated all the indicators at the stem section level (marked by the lower index “ss”) and at the entire stem profile (lower index “es”, also shown in Table 1), considering a maximum distance from the ground of 250 cm. Data analyses were performed in Excel and Access programs. Since the Kolmogorov–Smirnov test confirmed the normality of the data, we might consider conducting a two-way ANOVA and a three-way ANOVA, followed by a Fisher’s Least Significant Difference (LSD) test. The tests were performed in STATISTICA 10.0 software. The tested factors included tree species (abbreviated as TS), stem diameter classes (DC), and stem section (SS, see Table 1). Regarding stem diameter classes, they were intentionally categorized to ensure at least 30 individuals in each category, specifically classified as under 35 mm, 35–50 mm, and over 50 mm.

3. Results

The set of Douglas fir represented trees with heights ranging from 2.5 to 7.8 m (with a mean of 4.0 m) and diameters at breast height (d1.3) between 16.5 and 85.0 mm (with a mean of 45.1 mm). At the same time, silver fir trees had heights between 2.4 and 6.0 m (with a mean of 3.6 m) and diameters (d1.3) ranging from 19.5 to 77.5 mm (with a mean of 42.5 mm). This indicates that both species exhibited very similar tree characteristics (Table 2).
Our results showed that the mean values of BABes were 556 cm2 (standard error ±60 cm2) and 652 cm2 (±46 cm2) in Douglas fir and silver fir, respectively (see Figure 1). Although the difference was not large, it was statistically significant (Table 3). Similarly, a significantly larger value in silver fir than in Douglas fir was found for RABes (466 ± 43 cm2 vs. 338 ± 43 cm2). Regarding UABes, the difference between Douglas fir (218 ± 37 cm2) and silver fir (186 ± 19 cm2) was insignificant.
A statistically significantly larger value was recorded in silver fir (21.5 ± 1.0%) than in Douglas fir (17.0 ± 1.5%) in BATAes, as well as in RATAes (14.9 ± 1.1% vs. 10.0 ± 0.9%; see Figure 2; Table 4). At the same time, very small inter-specific differences were found for UATAes, with the value being 7.0% (±1.3%) in Douglas fir and 6.6% (±0.7%) in silver fir. Additionally, a significantly larger value of RABAes was observed in silver fir (69.6 ± 2.5%) than in Douglas fir (62.5 ± 4.6%).
Since BAB and BATA are the most illustrative indicators of bark browsing, we analyzed them in more detail, specifically regarding diameter classes and/or stem sections. The results showed that BABes increased significantly with the rising diameter class (Figure 3a; Table 3). For Douglas fir, the smallest value of BABes was 300 (±59) cm2 in the diameter class up to 35 mm, and the largest one was 767 (±91) cm2 in the diameter class over 50 mm. Similarly, in silver fir, the minimum value of BABes was 300 (±59) cm2 in the diameter class up to 35 mm, and the maximum value of 902 (±68) cm2 was found in the diameter class over 50 mm. It is noteworthy that the increasing values of BABes in both species are logically related to the increasing bark surface with larger tree size (stem diameter). Moreover, considering BABes within each individual diameter class, significant inter-specific differences were found for trees in the diameter class up to 35 mm and those in the diameter class over 50 mm (Figure 3a).
While BABes showed an increasing tendency with diameter classes, rather equal values among the diameter classes were found for BATAes (Figure 3b; Table 4). On the other hand, larger values in silver fir than in Douglas fir were recorded in all diameter classes; the only insignificance was observed in the diameter class of 35–50 mm. The minimum value of BATAes (16.0 ± 3.0%) was found in Douglas fir in the diameter class up to 35 mm, and the maximum value (22.1 ± 1.5%) was in silver fir in the diameter class over 50 mm.
Furthermore, we calculated and analyzed BAB and BATA on a stem section level (see Figure 4a,b; Table 3 and Table 4). We found that the maximum values of both indicators were in stem section no. 5, meaning a distance from the ground of 101–125 cm. The BABss values in this section were 163.9 (±6.5) cm2 for silver fir and 150.5 (±8.2) cm2 for Douglas fir. Similarly, the BATAss reached the maximum values (47.0 ± 1.3% in silver fir and 40.7 ± 1.5% in Douglas fir) in the stem section located 101–125 cm from the ground level. Significant inter-specific differences were found in the stem sections 4–7, i.e., 76–175 cm from the ground.
In addition, we analyzed the combined effect of stem thickness (diameter class) and distance from the ground (stem section) on BABss and BATAss (Figure 5; Table 3 and Table 4). The statistical tests clearly showed that BABss differed between the species and was related to the diameter class as well as the stem section. Moreover, all combinations of these factors (tree species, diameter class, and stem section) influenced the values of BABss (Table 3). The maximum values of BABss were in the diameter class over 50 mm in stem section 5, specifically 221.5 (±13.0) cm2 in Douglas fir and 224.3 (±13.1) cm2 in silver fir. In the case of BATAss, the values differed between the species and were also related to the diameter class as well as the stem section. Moreover, combinations of these factors (i.e., tree species × diameter class × stem section) influenced the values of BATAss, except for the combination of all three factors (i.e., tree species × diameter class × stem section). Here, the maximum values were in the diameter class over 50 mm in stem section 5, specifically 41.8 (±2.3) % in Douglas fir and 48.6 (±2.1) % in silver fir.
Finally, knowing that the stems of both fir species are very intensively browsed on bark stems within the range of 76–175 cm from the ground level, we attempted to create models of bark surface related to diameter d1.3 (see Figure 6). The relationships were linear and very close (r2 = 0.97 and 0.92 in silver fir and Douglas fir, respectively). Moreover, the fitted lines were very close to each other, indicating that the surfaces of the stems within sections positioned 76–175 cm from the ground level were very similar in both species. The models show that the stem surface for a tree with a diameter d1.3 of 40 mm was about 1570 cm2, while for a tree with a diameter of 80 mm, it was nearly double (about 3130 cm2). These areas represent a certain potential that can be consumed by ruminating ungulates, especially red deer, if the entire surface of the stem in the selected section was browsed.

4. Discussion

4.1. Bark Browsing (Stripping)

Our results showed that BATAes were 17.0% and 21.5% in Douglas fir and silver fir, respectively. This implies that approximately 1/5 of all bark within the available space (considering red deer), up to 250 cm from the ground, was browsed. This bark browsing occurred over three winter seasons: 2019/2020, 2020/2021, and 2021/2022. Previously, we conducted a similar study at the same site for common aspen (Populus tremula L.), common rowan (Sorbus aucuparia L.), and goat willow (Salix caprea L.; see Konôpka et al. [31]). We found that the most intensive BATAes was in goat willow (14.5%), and the least intensive was in common rowan (5.1%). BATAes in common aspen was 8.7%. However, these measurements were performed in 2021. Therefore, they did not cover the winter season of 2021/2022. If we assume that bark browsing in the winter season of 2021/2022 for these three tree species was similar to that in 2019/2020 and 2020/2021, we can estimate the total BATAes for the winter seasons of 2019/2020, 2020/2021, and 2021/2022 together. Specifically, the estimated three-winter-season values of BATAes might be about 22% (calculated as [14.4/2] × 3), 13% ([8.7/2] × 3), and 8% ([5.1/2] × 3) for goat willow, common aspen, and common rowan, respectively. These estimates indicate that browsing intensity in goat willow might be comparable to that in Douglas fir and silver fir. On the other hand, BATAes in common poplar might be about 2/3, and in common rowan, only about 1/3 of that in the fir species.
Our results showed that while bark browsing in distances up to 50 cm and over 175 cm was negligible, intensive damage was recorded between 76 and 150 cm from the ground level, with the maximum occurring at a height of 101–125 cm. These findings align with those reported for red deer in other regions and tree species. For instance, in Scotland, the majority of wounds on stems caused by red deer browsing were found between 51 and 150 cm [32]. Similarly, the highest percentage of stem bark browsing on common rowan was observed between 101 and 150 cm, with the upper occurrence at 200 cm [31] in Slovak forests. Another study from Germany [33] demonstrated that red deer typically stripped bark from the tree stem at heights between 80 and 170 cm, with an upper occurrence at 200 cm. Practically, these heights of maximum intensity of bark browsing correspond to the height of a red deer’s shoulder, which may vary slightly across regions [34].
Our further results also showed that stem thickness (expressed in three diameter classes) influenced BAB but not BATA. Logically, the larger the diameter class, the more bark surface, and consequently, a larger potential for browsing. Our previous study [31] conducted at the same site showed that, for rowan and aspen, the most intensively browsed trees were in the diameter class above 6 cm, and the least browsed occurred in the diameter class under 3 cm. However, these differences among the diameter classes were not observed for goat willow, where trees of all sizes were intensively browsed. We observed that because goat willow was the most attractive tree species, ruminating ungulates were willing to browse on very thin stems, which was complicated due to stem properties. Very thin stems are highly flexible, and browsing might be difficult because ruminating ungulates cannot press their teeth sufficiently against the stem surface. As for Douglas fir and silver fir, even trees in the diameter class under 35 mm were intensively browsed. This might indicate that these species are very attractive as forage and/or their stems are more rigid than in the common poplar and common rowan trees.
Our bark surface model, considering the stem sections situated 76–175 cm from the ground level, showed values ranging from 780 cm2 (for a diameter d1.3 of 20 mm) to 3330 cm2 (when d1.3 equals 85 mm). To provide a clearer picture, this represents a bark path in square dimensions of 28 × 28 cm and 58 × 58 cm for diameters of 20 mm and 85 mm, respectively. This represents the maximum bark surface available (forage potential) for red deer in a “comfortable” position. Our previous study [35] provided outputs for bark thickness and biomass (dry mass) in some broadleaves. The models allow the conversion of bark surface to biomass, enabling the calculation of the browsed bark quantity and the quantity of bark biomass available for browsing. Unfortunately, this kind of model is not available for Douglas fir and silver fir.
Our results clearly indicate that both Douglas fir and silver fir are “palatable” species and, therefore, extensively browsed by ruminating ungulates. Although there are some measures that can protect trees from browsing (e.g., fencing, repellents, protective caps placed on terminals, etc.), most of them are rather expensive and not 100% efficient. Therefore, regulating the population density of ruminating ungulates might be the best measure to reduce browsing damage to the palatable species of forest trees.

4.2. Bark Recovery

Regarding bark recovery (some authors use the term “healing”), RABA is a very suitable indicator to describe inter-species differences. In our case, silver fir shows statistically higher values (even though the differences were not very large) than Douglas fir. The RABA after 2–4 vegetation periods (2020, 2021, 2022, and 2023) was 62.5% in Douglas fir and 69.6% in silver fir. We could not find any studies showing the recovery rate (usually expressed in centimeters of recovered bark from the damaged edge of the wound) for Douglas fir and silver fir. However, the available literature focused on a variety of forest tree species (e.g., [36,37]) showed that the recovery rate is usually about 15 mm per year. This means, for instance, that for trees with a stem section diameter of 50 mm (equivalent to a circumference of circa 160 mm) and a stripping extent of 70% (i.e., the width of a wound of 112 mm), bark healing might theoretically take nearly four growing seasons. In fact, this theoretical calculation is not far from our results, as, after approximately three seasons (the average value for 2, 3, and 4 periods), wounds had recovered on about 2/3 of the stripped area.
Bark recovery after stripping is very likely influenced by a number of factors. The basic traits of the wounded trees (e.g., age and species) and the characteristics of wounds, such as severity, size, and location in which wounds occurred, determine the process of recovery [38]. Regarding silver fir, Pusz et al. [39] illustrated a variety of fungi associated with silver fir, noting that their composition changed across different stages of recovery. Moreover, they illustrated that recovered wounds predominantly contain Trichoderma atroviride P. Karst, a fungus antagonistic to many fungal pathogens. Hence, they assumed that this species can support the process of wound regeneration.
Delavaux et al. [40,41] demonstrated that recovery from bark harvesting for twelve medicinal tree species lasted at least two years and differed significantly among the species. Several other experiments have shown that the most important factor for successful recovery is the humidity of the wounded surface [42,43]. Delvaux et al. [40] conducted an experiment that removed bark only partially, leaving a thin bark layer with the cambium attached to the stem. They proved the protective effect of the remaining bark layer in promoting bark recovery. Moreover, Delvaux et al. [40] stated that trees severely attacked by insects or fungi pathogens had to manage their energy budget by compartmentalizing the wounded tissues to avoid the spreading of insects and pathogens within the stem rather than forming new wood tissue. Therefore, infections (fungi, insects, etc.) may considerably reduce the bark recovery rate in trees.
Regarding the physiological aspects of bark stripping, Zwieniecki et al. [44] stated that it interrupts the water relation between the bark and wood, affecting the water conduction between roots and foliage. As trees need large amounts of water, they need to develop mechanisms to protect against disruptions in their water balance and be able to rebuild the water pathway. Some studies have focused on the short-term responses to bark wounding (spanning from a few days up to a couple of months) expressed through compartmentalization, wound callus formation, wound reaction of the parenchyma cells, and lignin distribution in the xylem, among other factors [42,45,46]. Mwange et al. [43] noted that the initial steps in bark recovery are auxin-dependent. However, the first reaction that a tree initiates to protect itself after bark harvesting is the production of a callus directly in contact with the wound. This callus is formed from undifferentiated xylem cells at the stage of primary wall formation and consists of parenchymatous tissue without vessels, fibers, or any ray structures [42].
Nevertheless, knowledge of wound recovery processes in specific tree species concerning tree/stand and environmental conditions is urgently required. This demand is particularly relevant for the long-term perspective of tree survival and vitality, as well as future timber quality. It is essential to note that scientific attention is needed not only for bark stripping caused by ruminating ungulates (typical for young tree growth stages) but also for stem wounds resulting from harvest and skidding activities (frequent in middle- and old-aged forest stands, e.g., [47]). All these damages disrupt the concept of sustainable forest management; therefore, scientific findings can provide approaches for their reduction or mitigation, ultimately benefiting the forestry sector.

5. Conclusions

Our results illustrated the susceptibility of both tree species to bark browsing by ruminating ungulates, in our case, fallow deer, mouflon, and especially red deer. Despite the fact that the trees were exposed to bark browsing only within three winter seasons, all individuals were wounded. While inter-specific differences were significant, they were not large and may not be relevant from a practical forestry perspective. Therefore, we may suggest that Douglas fir (as an introduced species in Europe) is not a suitable substitute for “traditional” tree species under the conditions typical of most European countries. It is very probable that further mass plantation of this species does not support the intentions of sustainable forestry, aiming to fulfill all socio–economic roles of forests in these countries.
We can assume that, even though the recovery rate was rather high in both species (full recovery in young trees may last for approximately four growing seasons), the potential infection of stems by fungal diseases or wood deformations must not be underestimated. However, we did not research these aspects and cannot draw any well-grounded conclusions from them. Very likely, these kinds of harm can be considered as serious, with both ecological and economic consequences. Therefore, measures in both forest management and game management must be taken to ensure the sustainable development of forest stands. These measures, especially the protection of trees from browsing (group protection by fencing and individual protection by chemical or mechanical tools in forestry and the reduction of ruminating ungulate populations in game management), are crucial. Considering a broad perspective, the harmonization of interests among different stakeholder groups (i.e., foresters, hunters, and farmers) is currently an important aspect of sustainable development in the forestry, agroforestry, and agriculture sectors.

Author Contributions

Conceptualization, B.K. and V.Š.; methodology, B.K.; validation, B.K., V.Š. and J.P.; formal analysis, J.P.; resources, B.K.; data curation, V.Š.; writing—original draft preparation, B.K.; writing—review and editing, B.K.; visualization, J.P.; supervision, B.K.; project administration, V.Š.; funding acquisition, B.K. All authors have read and agreed to the published version of the manuscript.

Funding

This research was funded by grant “EVA4.0”, No. Z.02.1.01/0.0/0.0/16_019/0000803, supported by OP RDE, as well as by the projects APVV-18-0086 and APVV-22-0056 from the Slovak Research and Development Agency. Some research activities were also a part of the “Progressive methods of forest protection in changing ecological conditions (PROMOLES)” project, financed by the budget of the Ministry of Agriculture of the Slovak Republic (No. 08V0301), as well as within the LignoSilva project [Grant Agreement #101059552] under the Horizon Europe Teaming for Excellence action, funded by the European Commission.

Institutional Review Board Statement

Not applicable.

Informed Consent Statement

Not applicable.

Data Availability Statement

Data are contained within the article.

Acknowledgments

Ladislav Kulla and his research team are acknowledged for establishing the Husárik site and its long-term maintenance.

Conflicts of Interest

The authors declare no conflicts of interest.

Appendix A

Figure A1. Examples of bark browsing by ruminating ungulates on Douglas fir. Fresh wound without any regeneration (RABA = 0%; photo (A)), wound with an early stage of recovery on the edges (RABA about 15%; photo (B)), the prevailing part of the wound has been recovered (RABA approximately 70%; photo (C)), fully recovered wound (RABA = 100%; photo (D)).
Sustainability 16 02293 g0a1

References

  1. Hertog, I.M.; Brogaard, S.; Krause, T. Barriers to expanding continuous cover forestry in Sweden for delivering multiple ecosystem services. Ecosyst. Serv. 2022, 53, 101392. [Google Scholar] [CrossRef]
  2. Thom, D.; Seidl, R. Natural disturbance impacts on ecosystem services and biodiversity in temperate and boreal forests. Biol. Rev. Camb. Philos. Soc. 2016, 91, 760–781. [Google Scholar] [CrossRef] [PubMed]
  3. Ruba, J.; Miezite, O.; Luguza, S. Abiotic risks of managing young forest stands of Norway spruce (Picea abies (L.) Karst.). Res. Rural Dev. 2013, 2, 27–33. [Google Scholar]
  4. Šebeň, V. Národná Inventarizácia a Monitoring Lesov Slovenskej Republiky 2015–2016; Lesnícke Štúdie 65; Národné Lesnícke Centrum: Zvolen, Slovakia, 2017; 256p. (In Slovak) [Google Scholar]
  5. Carpio, A.; Apollonio, M.; Acevedo, P. Wild ungulate overabundance in Europe: Contexts, causes, monitoring and management recommendations. Mam. Rev. 2020, 51, 95–108. [Google Scholar] [CrossRef]
  6. Valente, A.M.; Acevedo, P.; Figueredo, A.M.; Fonseca, C.; Torres, R.T. Overabundant wild ungulate populations in Europe: Management with consideration of socio-ecological consequences. Mamm. Rev. 2020, 50, 353–366. [Google Scholar] [CrossRef]
  7. Balčiauskas, L.; Kawata, Y. Red deer in Lithuania: History, status and management. Sustainability 2022, 14, 14091. [Google Scholar] [CrossRef]
  8. Kopij, G. Spatial and temporal variation in population densities of roe deer Capreolus capeolus and the red deer Cervus elaphus in SW Poland. Agric. For. 2023, 69, 139–154. [Google Scholar]
  9. Červený, J.; Hell, P.; Slamečka, J. Otto’s Encyclopedia: Game Management; Otto’s Publisher: Praha, Czech Republic, 2010; 591p. [Google Scholar]
  10. Senn, J.; Suter, W. Ungulate browsing on silver fir (Abies alba) in the Swiss Alps: Beliefs in search of supporting data. For. Ecol. Manag. 2003, 181, 151–164. [Google Scholar] [CrossRef]
  11. Häsler, H.; Senn, J. Ungulate browsing on European silver fir (Abies alba): The role of occasions, food shortage and diet preferences. Wildlife Bio. 2012, 18, 67–74. [Google Scholar] [CrossRef] [PubMed]
  12. San-Miguel-Ayanz, J.; De Rigo, D.; Caudulo, G.; Durrant, T.H.; Mauri, A. European Atlas of Forest Tree Species; Publication Office of the European Union: Luxembourg, 2016; 200p. [Google Scholar]
  13. Třeštík, M.; Podrázský, V. Soil improving role of silver fir (Abies alba Mill.): A case study. ZLV 2017, 62, 182–188. (In Czech) [Google Scholar]
  14. Dobrowolska, D.; Boncina, A.; Klumpp, R. Ecology and silviculture of silver fir (Abies alba Mill.): A review. J. For. Res. 2017, 22, 1–10. [Google Scholar] [CrossRef]
  15. Mina, M.; del Río, M.; Huber, M.O.; Thürig, E.; Rohner, B. The symmetry of competitive interactions in mixed Norway spruce, silver fir and European beech forests. J. Veg. Sci. 2018, 29, 775–787. [Google Scholar] [CrossRef]
  16. Vacek, S.; Bulušek, D.; Vacek, Z.; Bílek, L.; Schwarz, O.; Simon, J.; Štícha, V. The role of shelterwood cutting and protection against game browsing for the regeneration of silver fir. Austrian J. For. Sci. 2015, 132, 81–102. [Google Scholar]
  17. Bödeker, K.; Jordan-Fragstein, C.; Vor, T.; Ammer, C.; Knoke, T. Abrupt height growth setbacks show overbrowsing of tree saplings, which can be reduced by raising deer harvest. Sci. Rep. 2023, 13, 12021. [Google Scholar] [CrossRef]
  18. Pagan, J.; Randuška, D. Atlas drevín. 2—Cudzokrajné dreviny; Bratislava: Príroda, Slovakia, 1988; 408p. (In Slovak) [Google Scholar]
  19. Podrázský, V.; Kupka, I.; Prknová, H. Substitution of Norway spruce for Douglas-fir: Changes of soil microbial activities as climate change induced shift in species composition—A case study. Cent. Eur. For. J. 2020, 66, 71–77. [Google Scholar] [CrossRef]
  20. Vitali, V.; Büntgen, U.; Bauhus, J. Silver fir and Douglas fir are more tolerant to extreme droughts than Norway spruce in south-western Germany. Glob. Chang. Biol. 2017, 23, 5108–5119. [Google Scholar] [CrossRef]
  21. Finďo, S.; Petráš, R. Ekologické Základy Ochrany Lesa proti Poškozovaniu Zverou; National Forest Centre: Zvolen, Slovakia, 2007; 186p. (In Slovak) [Google Scholar]
  22. Vacek, Z.; Cukor, J.; Linda, R.; Vacek, S.; Šimůnek, V.; Brichta, J.; Gallo, J.; Prokůpková, A. Bark stripping, the crucial factor affecting stem rot development and timber production of Norway spruce forests in Central Europe. For. Ecol. Manag. 2020, 474, 118360. [Google Scholar] [CrossRef]
  23. Hahn, C.; Vospernik, S.; Gollob, C.; Ritter, T. Bark stripping damage by red deer (Cervus elaphus L.) assessing the spatial distribution on the stand level using generalized additive models. Eur. J. For. Res. 2023, 142, 1–16. [Google Scholar] [CrossRef]
  24. Hahn, C.; Vospernik, S. Position, size, and spatial patterns of bark stripping wounds inflicted by red deer (Cervus elaphus L.) on Norway spruce using generalized additive models in Austria. Ann. For. Sci. 2022, 79, 13. [Google Scholar] [CrossRef]
  25. Wam, H.K.; Solberg, E.J.; Eriksen, R.; Granhus, A. Monitoring deer food and browsing in forests: Coherence and discrepancies between national and local inventories. Ecol. Indic. 2021, 120, 106967. [Google Scholar] [CrossRef]
  26. Cukor, J.; Vacek, Z.; Linda, J.; Vacek, S.; Marada, P.; Šimůnek, V.; Havránek, F. Effects of Bark Stripping on Timber Production and Structure of Norway Spruce Forests in Relation to Climatic Factors. Forests 2019, 10, 320. [Google Scholar] [CrossRef]
  27. Hlásny, T.; Barcza, Z.; Barka, I.; Bucha, T.; Ditmarová, Ľ.; Fabrika, M.; Gömöry, D.; Grodzki, W.; Holuša, J.; Kamenský, M.; et al. Spruce Forests Decline in the Beskids; National Forest Centre—Forest Research Institute: Zvolen, Slovakia, 2010; 182 p. [Google Scholar]
  28. Hančinský, L. Lesné typy Slovenska; Príroda: Bratislava, Slovakia, 1972; 307p. (In Slovak) [Google Scholar]
  29. Konôpka, B.; Šebeň, V.; Pajtík, J.; Shipley, L.A. Excluding Large Wild Herbivores Reduced Norway Spruce Dominance and Supported Tree Species Richness in a Young, Naturally Regenerated Stands. Forests 2021, 12, 737. [Google Scholar] [CrossRef]
  30. Kulla, L.; Sitková, Z. Rekonštrukcie Nepôvodných Smrečín; National Forest Centre—Forest Research Institute: Zvolen, Slovakia, 2010; 208p. (In Slovak) [Google Scholar]
  31. Konôpka, B.; Šebeň, V.; Pajtík, J.; Shipley, L.A. Influence of Tree Species and Size on Bark Browsing by Large Wild Herbivores. Plants 2022, 11, 2925. [Google Scholar] [CrossRef]
  32. Prien, S. Wildschäden im Wald. Ökologische Grundlagen und Integrierte Schutzmaßnahmen; Paul Parey: Berlin, Germany, 1997; 257p. [Google Scholar]
  33. Welch, D.; Staines, B.W.; Scott, D.; Catt, D.C. Bark stripping damage by red deer in Sitka spruce forest in Western Scotland II. Wound size and position. Forestry 1988, 61, 245–254. [Google Scholar] [CrossRef]
  34. Renaud, P.C.; Verheyden-Tixier, H.; Dumont, B. Damage to saplings by red deer (Cervus elaphus): Effect of foliage height and structure. For. Ecol. Manag. 2003, 181, 31–37. [Google Scholar] [CrossRef]
  35. Konôpka, B.; Pajtík, J.; Šebeň, V.; Merganičová, K. Modeling Bark Thickness and Bark Biomass on Stems of Four Broadleaved Tree Species. Plants 2022, 11, 1148. [Google Scholar] [CrossRef]
  36. Vasiliauskas, R.; Stenlid, J. Discoloration following bark stripping wounds on Fraxinus excelsior. Eur. J. For. Pathol. 1998, 28, 383–390. [Google Scholar] [CrossRef]
  37. Tavankar, F.; Ezzati, S.; Latteriny, F.; Lo Monaco, A.; Venazi, R.; Picchio, R. Assessment of Wound Recovery and Radial Growth 10 Years after Forest Operations in Hardwood Stands. Forests 2022, 13, 1393. [Google Scholar] [CrossRef]
  38. Tavankar, F.; Picchio, R.; Nikooy, M.; Lo Monaco, A.; Venanzi, R.; Bodaghi, A.I. Healing rate of logging wounds on broadleaf trees in Hyrcanian forest with some technological implications. Drewno 2017, 60, 199. [Google Scholar] [CrossRef]
  39. Pusz, W.; Baturo-Ciesniewski, A.; Kaczmarek-Pienczewska, A.; Patejuk, K.; Czarnota, P. Is the Survivability of Silver Fir under Condition of Strong Ungulate Pressure Related to Mycobiota of Bark-Stripping Wounds? Forests 2021, 12, 976. [Google Scholar] [CrossRef]
  40. Delvaux, C.; Sinsin, B.; Darchanbeau, F.; Van Damme, P. Recovery from bark harvesting of 12 medicinal tree species in Benin, West Africa. J. App. Ecol. 2009, 46, 703–712. [Google Scholar] [CrossRef]
  41. Delvaux, C.; Sinsin, B.; Van Damme, P.; Beeckman, H. Wound reaction after bark harvesting: Microscopic and macroscopic phenomena in ten medicinal tree species (Benin). Trees 2010, 24, 941–951. [Google Scholar] [CrossRef]
  42. Stobbe, H.; Schmitt, U.; Eckstein, D.; Dujesiefken, D. Developmental stages and fine structure of surface callus formed after debarking of living lime trees (Tilia sp.). Ann. Bot. 2002, 89, 773–782. [Google Scholar] [CrossRef]
  43. Mwange, K.N.; Hou, H.W.; Cui, K.M. Relationship between endogenous indole-3-acetic acid and abscisic acid changes and bark recovery in Eucommia ulmoides Oliv. after girdling. J. Exp. Bot. 2003, 54, 1899–1907. [Google Scholar] [CrossRef] [PubMed]
  44. Zwieniecki, M.A.; Melcher, P.J.; Field, T.S.; Holbrook, N.M. A potential role for xylem–phloem interactions in the hydraulic architecture of trees: Effects of phloem girdling on xylem hydraulic conductance. Tree Physiol. 2004, 24, 911–917. [Google Scholar] [CrossRef]
  45. Schmitt, U.; Liese, W. Wound reaction of the parenchyma in Betula. Iawa Bull. 1990, 11, 413–420. [Google Scholar] [CrossRef]
  46. Frankenstein, C.; Schmitt, U.; Koch, G. Topochemical studies on modified lignin distribution in the xylem of poplar (Populus spp.) after wounding. Ann. Bot. 2006, 97, 195–204. [Google Scholar] [CrossRef] [PubMed]
  47. Nakou, A.; Sauter, U.H.; Kohnle, U. Improved models of harvest-induced bark damage. Ann. For. Sci. 2015, 73, 233–246. [Google Scholar] [CrossRef]
Figure 1. Browsed area of bark (BABes), recovered area of bark (RABes), and unrecovered area of bark (UABes) in Douglas fir and silver fir trees. The error bars denote standard errors; asterisks show significant differences between the species (two-way ANOVA with an alpha level of 0.05).
Sustainability 16 02293 g001
Figure 2. Browsed bark area to total bark area (BATAes), recovered area to total area (RATAes), unrecovered area to total area (UATAes), and recovered area to browsed area (RABAes) in Douglas fir and silver fir trees. The error bars denote standard errors; asterisks show significant differences between the species (two-way ANOVA with an alpha level of 0.05).
Sustainability 16 02293 g002
Figure 3. Browsed area (BABes; graph (a)) and browsed bark area to total bark area (BATAes; graph (b)) in Douglas fir and silver fir trees. The error bars denote standard errors; asterisks show significant differences between the species within the specific diameter classes (three-way ANOVA followed by Fisher’s LSD test with an alpha level of 0.05).
Sustainability 16 02293 g003
Figure 4. Browsed area (BABss; graph (a)) and browsed bark area to total bark area (BATAss; graph (b)) in Douglas fir and silver fir trees. The error bars denote standard errors; asterisks show significant differences between the species within the specific stem sections (three-way ANOVA, followed by Fisher’s LSD test with an alpha level of 0.05). Stem sections are coded as follows: 1: ≤25 cm; 2: 26–50 cm, 3: 51–75 cm, 4: 76–100 cm, 5: 101–125 cm, 6: 126–150 cm, 7: 151–175 m, 8: 176–200 cm, 9: 201–225 cm, and 10: 226–250 cm.
Sustainability 16 02293 g004
Figure 5. Browsed area of bark (BABss; graphs (ac)) and browsed bark area to total bark area (BATAss; graphs (df)) in Douglas fir and silver fir trees in the individual diameter classes (graphs (a,d) denote those up to 35 mm, graphs (b,e) are for 35–50 mm, and graphs (c,f) denote those over 50 mm). The error bars denote standard errors, and the asterisk shows significant differences between the species within the specific stem sections and the individual diameter classes (three-way ANOVA followed by Fisher’s LSD test with an alpha level of 0.05). Stem sections are coded as follows: 1: ≤25 cm; 2: 26–50 cm, 3: 51–75 cm, 4: 76–100 cm, 5: 101–125 cm, 6: 126–150 cm, 7: 151–175 m, 8: 176–200 cm, 9: 201–225 cm, and 10: 226–250 cm.
Sustainability 16 02293 g005
Figure 6. Relationship between diameter d1.3 and bark surface for section 51–175 cm from the ground level (the most browsed sector of the stem) in Douglas fir and silver fir. The gray full line represents the linear fit for Douglas fir, while the black full line represents the linear fit for silver fir.
Sustainability 16 02293 g006
Table 1. The indicators (with abbreviations and units) were measured on the wounds in Douglas fir and silver fir trees in the Husárik site, Kysuce region, Slovakia.
LevelStem SectionsEntire Stem
IndicatorAbbreviationUnitAbbreviationUnit
Browsed area of barkBABsscm2BABescm2
Recovered area of barkRABsscm2RABescm2
Unrecovered area of barkUABsscm2UABescm2
Browsed area to total areaBATAss%BATAes%
Recovered area to total areaRATAss%RATAes%
Unrecovered area to total areaUATAss%UATAes%
Recovered area to browsed areaRABAss%RABAes%
Table 2. Descriptive statistics for the basic characteristics in the measured Douglas fir and silver fir trees in the Husárik site, Kysuce region, Slovakia.
Tree SpeciesCharacteristicsMeanS.D.MinimumMaximum25th
Percentile
75th
Percentile
Douglas firTree height (m)4.011.172.507.803.104.60
(n = 100)Diameter d1.3 (mm)45.1318.0816.5085.0030.5059.00
Silver firTree height (m)3.630.802.406.503.004.30
(n = 110)Diameter d1.3 (mm)42.5313.1119.5077.5032.5052.00
Table 3. Results of two- and three-way ANOVA for indicators (related to an area in cm2, see also Table 1) measured on the wounds for the entire stem level (marked by lower index “es”) and the stem section (marked by lower index “ss”) level in Douglas fir and silver fir trees. TS means tree species, DC is diameter class, and SS is stem section.
Type of
ANOVA
Factor vs.
Indicators
BABesRABesUABes
DfF-Valuep-ValuesDfF-Valuep-ValuesDfF-Valuep-Values
two-way TS 113.611<0.0001134.310<0.000112.5030.115
DC 287.327<0.0001295.967<0.000124.1560.017
TSxDC 21.4420.23923.4190.03523.9370.020
Type of
ANOVA
Factor vs.
indicators
BABssRABssUABss
DfF-valuep-valuesDfF-valuep-valuesDfF-valuep-values
three-way TS 129.436 <0.0001 188.197 <0.0001 15.1380.024
DC 2188.858 <0.0001 2241.102 <0.0001 28.532 <0.0001
SS 9405.010 <0.0001 9300.746 <0.0001 997.346 <0.0001
TSxDC 23.118 0.044 28.590 <0.0001 28.155 <0.0001
TSxSS 98.025 <0.0001 912.288 <0.0001 94.995 <0.0001
DCxSS 1819.675 <0.0001 1823.680 <0.0001 182.423 <0.0001
TSxDCxSS181.841 0.017 182.1160.004183.164 <0.0001
Explanatory note: Numbers in bold indicate all p-values < 0.05.
Table 4. Results of two- and three-way ANOVA for indicators (related to shares in %, see also Table 1) measured on the wounds for the entire stem level (marked by lower index “es”) and the specific stem section level (marked by lower index “ss”) in Douglas fir and silver fir trees. TS means tree species, DC is diameter class, and SS is stem section.
Type of
ANOVA
Factor vs.
Indicators
BATAesRATAesUATAesRABAes
DfF-Valuep-ValuesDfF-Valuep-ValuesDfF-Valuep-ValuesDfF-Valuep-Values
two-way TS 126.469<0.0001154.712<0.000110.3820.53718.0440.005
DC 22.4020.93212.663<0.000125.590.00327.196<0.0001
TSxDC 21.1020.33423.3620.03721.0060.36722.8770.059
Type of
ANOVA
Factor vs.
indicators
BATAssRATAssUATAssRABAss
DfF-valuep-valuesDfF-valuep-valuesDfF-valuep-valuesDfF-valuep-values
three-way TS 156.593<0.00011126.623<0.000110.6880.40717.5870.006
DC 212.052<0.0001246.891<0.0001210.326<0.0001237.289<0.0001
SS 9455.791<0.00019344.52<0.00019102.707<0.00019227.703<0.0001
TSxDC 23.1960.041210.387<0.000123.0020.04921.8550.157
TSxSS 912.120<0.0001916.94<0.000194.330<0.000194.805<0.0001
DCxSS 183.931<0.0001184.832<0.0001183.625<0.0001181.5880.055
TSxDCxSS180.8680.0619182.1370.004181.3950.123181.0890.356
Explanatory note: Numbers in bold indicate all p-values < 0.05.
Disclaimer/Publisher’s Note: The statements, opinions and data contained in all publications are solely those of the individual author(s) and contributor(s) and not of MDPI and/or the editor(s). MDPI and/or the editor(s) disclaim responsibility for any injury to people or property resulting from any ideas, methods, instructions or products referred to in the content.

