1. Introduction
Urbanization, a highly important subject pertaining to human society, has been recognized globally as a significant strategy to improve economic growth [
1]. The rapid migration of people into cities has brought tremendous changes in their structural form and development expectations [
2]. According to data from the United Nations (UN), the average proportion of the urban population was 32.8% in 1990 and is projected to reach 67.5% by 2050, with some low-income developing countries even expected to exceed 80% [
3]. Although the concentration of population has contributed to the economic growth of the city [
4], this phenomenon also results in energy and environmental issues, such as climate warming, resources shortage, air/water pollution, etc. [
5,
6]. For instance, the World Health Organization (WHO) estimates that seven million deaths a year worldwide are attributed to air pollution [
7]. Additionally, the International Energy Agency (IEA) shows that global energy consumption increased by 28% during the 2008–2020 period [
8]. The uncontrollable problems of future cities may lead to serious energy crises, thereby threating human public health. Given the above facts, promoting the urban economic growth and the environmental conditions has been put on the agenda by numerous international scholars [
9,
10]. Actually, the urban economic growth and the built environment are interacting and influencing each other, and the differences between urbanization level and diverse environmental conditions inevitably obtain various coupling characteristics. Therefore, it is essential to probe the coupling relationship between human activities and the built environment, which is deemed as a meaningful reference for formulating efficient strategies to achieve urban sustainable development.
Over the past 40 years of China’s reform and opening up, the urbanization rate increased from 17.92% in 1978 to 59.58% in 2018, with an average annual growth of 1% point [
11]. According to experts’ predictions, this value will be over 70% and enter the mature stage of urbanization by 2040. Although such a reform will inevitably play a positive role in solving the problems of income distribution and expanding domestic demand, the continuous expansion also has caused a series of urban diseases, such as unbalanced urban–rural development [
12], traffic congestion [
13], environmental pollution [
14], etc. These facts query the effectiveness of China’s current rapid urbanization to some extent and raise the question of how to achieve the true sense of urban sustainability? Actually, the economic development is inevitably accompanied by increased environmental loads. It is obviously not logical to solve the reality contradiction from the perspective of the size and number of cities. Therefore, only by improving the quality of urbanization and considering local economic law can we meet the sustainable development requirements in the future.
To address the above issue, this study proposes a comprehensive plan to enhance the urbanization construction and coordinated development. Recently, the Anhui Provincial Development and Reform Commission (China) applied for “national new urbanization pilot province”. Its inner core is to form a trinity of healthy development systems through people, planning and management, with the aim of playing a leading and exemplary role in promoting the process and research of urbanization. Thus, we take Anhui Province as a typical case, which is not only national policies that could be relied upon to fill the regional research gaps, but also to provide reference for the up-to-date urbanization. The main task of this research is to explore the urbanization quality and its coupling coordination degree in Anhui Province through a reasonable index system, so as to put forward reasonable suggestions for local decision-makers. The structure for the rest of this research paper is as follows:
Section 2 presents the related literature review.
Section 3 introduces the basic information of the study site, the research methods and the construction of indicator system.
Section 4 proposes the results and discussion. Lastly,
Section 5 summarizes the main conclusions and carries out the future research intention.
2. Literature Review
Historically, the Brundtland Report first defines urban sustainability as “meets the needs of the present without compromising the ability of descendant to meet their own needs” [
15]. Up to now, various efforts have been made by scholars to explore the quantification of urban sustainability and seek to verify it in practice, such as in Europe as a whole [
16], Iraq [
17], Belgium [
18] and Romania [
19]. By summarizing the previous studies, we observe that the urban sustainability mainly refers to the coupling relationship among three systems (social, economic and environmental). To be specific, the social dimension includes improving the well-being of urban communities and people’s living satisfaction [
20]. The economic dimension emphasizes that, in a long-term and stable developing environment, economic benefits can be equitably distributed among a city’s stakeholders [
21]. And the environmental dimension aims to develop a resource utilization mechanism that does not sacrifice the protection of the natural environment and biodiversity [
22]. Except for the above study fields that are hotly debated by scholars, some cutting-edge scientific institutions and research teams have also incorporated the technological, ecological and cultural aspects into consideration seriously [
23,
24]. Furthermore, to achieve sustainable development, a series of new ideas for developing patterns such as smart cities [
25], low-carbon cities [
26], eco-cities [
27], etc., have been proposed by decision-makers in recent years. These studies can be summarized as a focus on environmental pollution, carbon emissions and health issues. For example, Du et al. [
28], by adopting quantitative research methods, pointed out that the EQT policy can improve carbon efficiency by stimulating green technology innovation, so as to achieve the purpose of environmental protection. Meanwhile, based on the nationally representative individual-level data, Liao et al. [
29] explained why environmental pollution widens the income-related human health inequality and how reducing environmental pollution may contribute to urban sustainability on both an economic and health level.
Due to the fact that urban sustainability involves coupling effects, among various factors, the evaluation measurement is the primary way to solve the quality issues of city development [
30]. This approach, also called the multi-indicator method, is converting all of the impact factors into a composite value to represent the urban sustainable performance [
31]. In general, it can be summarized into two types of realization paths. One is to establish comprehensive rating systems for assessing sustainability among the stage of planning, design, operation and management, such as a life cycle assessment (LCA) [
32], quality of life assessment (QOL) [
33], strategic environmental assessment (SEA) [
34], etc. The other is to set up an integrated sustainability index by following the multi-criteria decision-making (MCDM) process [
35]. The current research adopted the MCDM method to evaluate urban sustainability. In this case, constructing a reasonable indicator system and determining the indicator weights are essential for evaluation measurement.
In recent decades, many indicator systems have been proposed from different perspectives by scholars. For instance, Liang et al. [
36] selected 18 indicators from three dimensions, i.e., social, economic and environmental, to assess the sustainability of 20 cities in Northeastern China. In addition, Khodakarami et al. [
37] explored the spatial distribution of ecosystem service, environmental hazard and urban structure, from which different multi-criteria decision analysis models were adopted to aggregate the 11 index layers. Shen et al. [
38] sets up an indicator system consisting of 19 critical indicators to assess the urban–rural sustainability, and the contribution of infrastructure projects to coordinated urban–rural development was quantified. Actually, the core of these explorations is a comprehensive assessment for given targets based on multiple dimensions and indicators. However, in objective reality, the city is deemed to be an interactive and adaptive system; thus, the coupling coordination of urbanization quality and economic development is important for achieving sustainability [
39].
While the establishment of an indicator system is important, the determination of indicator weights plays a decisive role in the evaluation results [
40]. Up to now, the weighting methods can be summed up according to three aspects: (1) subjective weighting approach, which determines the coefficient assignment according to the preference of decision-makers, such as analytic hierarchy process (AHP) [
41]; (2) objective weighting approach, which is calculated based on the actual data index in referred regions, such as the entropy method [
42] and coefficient of variation (CV) method [
43]; and (3) mixed weighting approach, which combines different measurements, such as AHP-entropy [
44], AHP-CV method, etc. [
45]. As we can observe from previous studies, these methods quantify the effectiveness of urban development to a certain extent. Nevertheless, several limitations should also be considered seriously. Firstly, multiple studies only focus on the independent exploration of a specific location, while ignoring the interaction mechanism of impact factors among different cities. Additionally, few studies take the developing vertical timeline nodes, such as the phased annual growth trend, into account. These dynamic characteristics are particularly significant for extracting the regularity of objective urban sustainability.
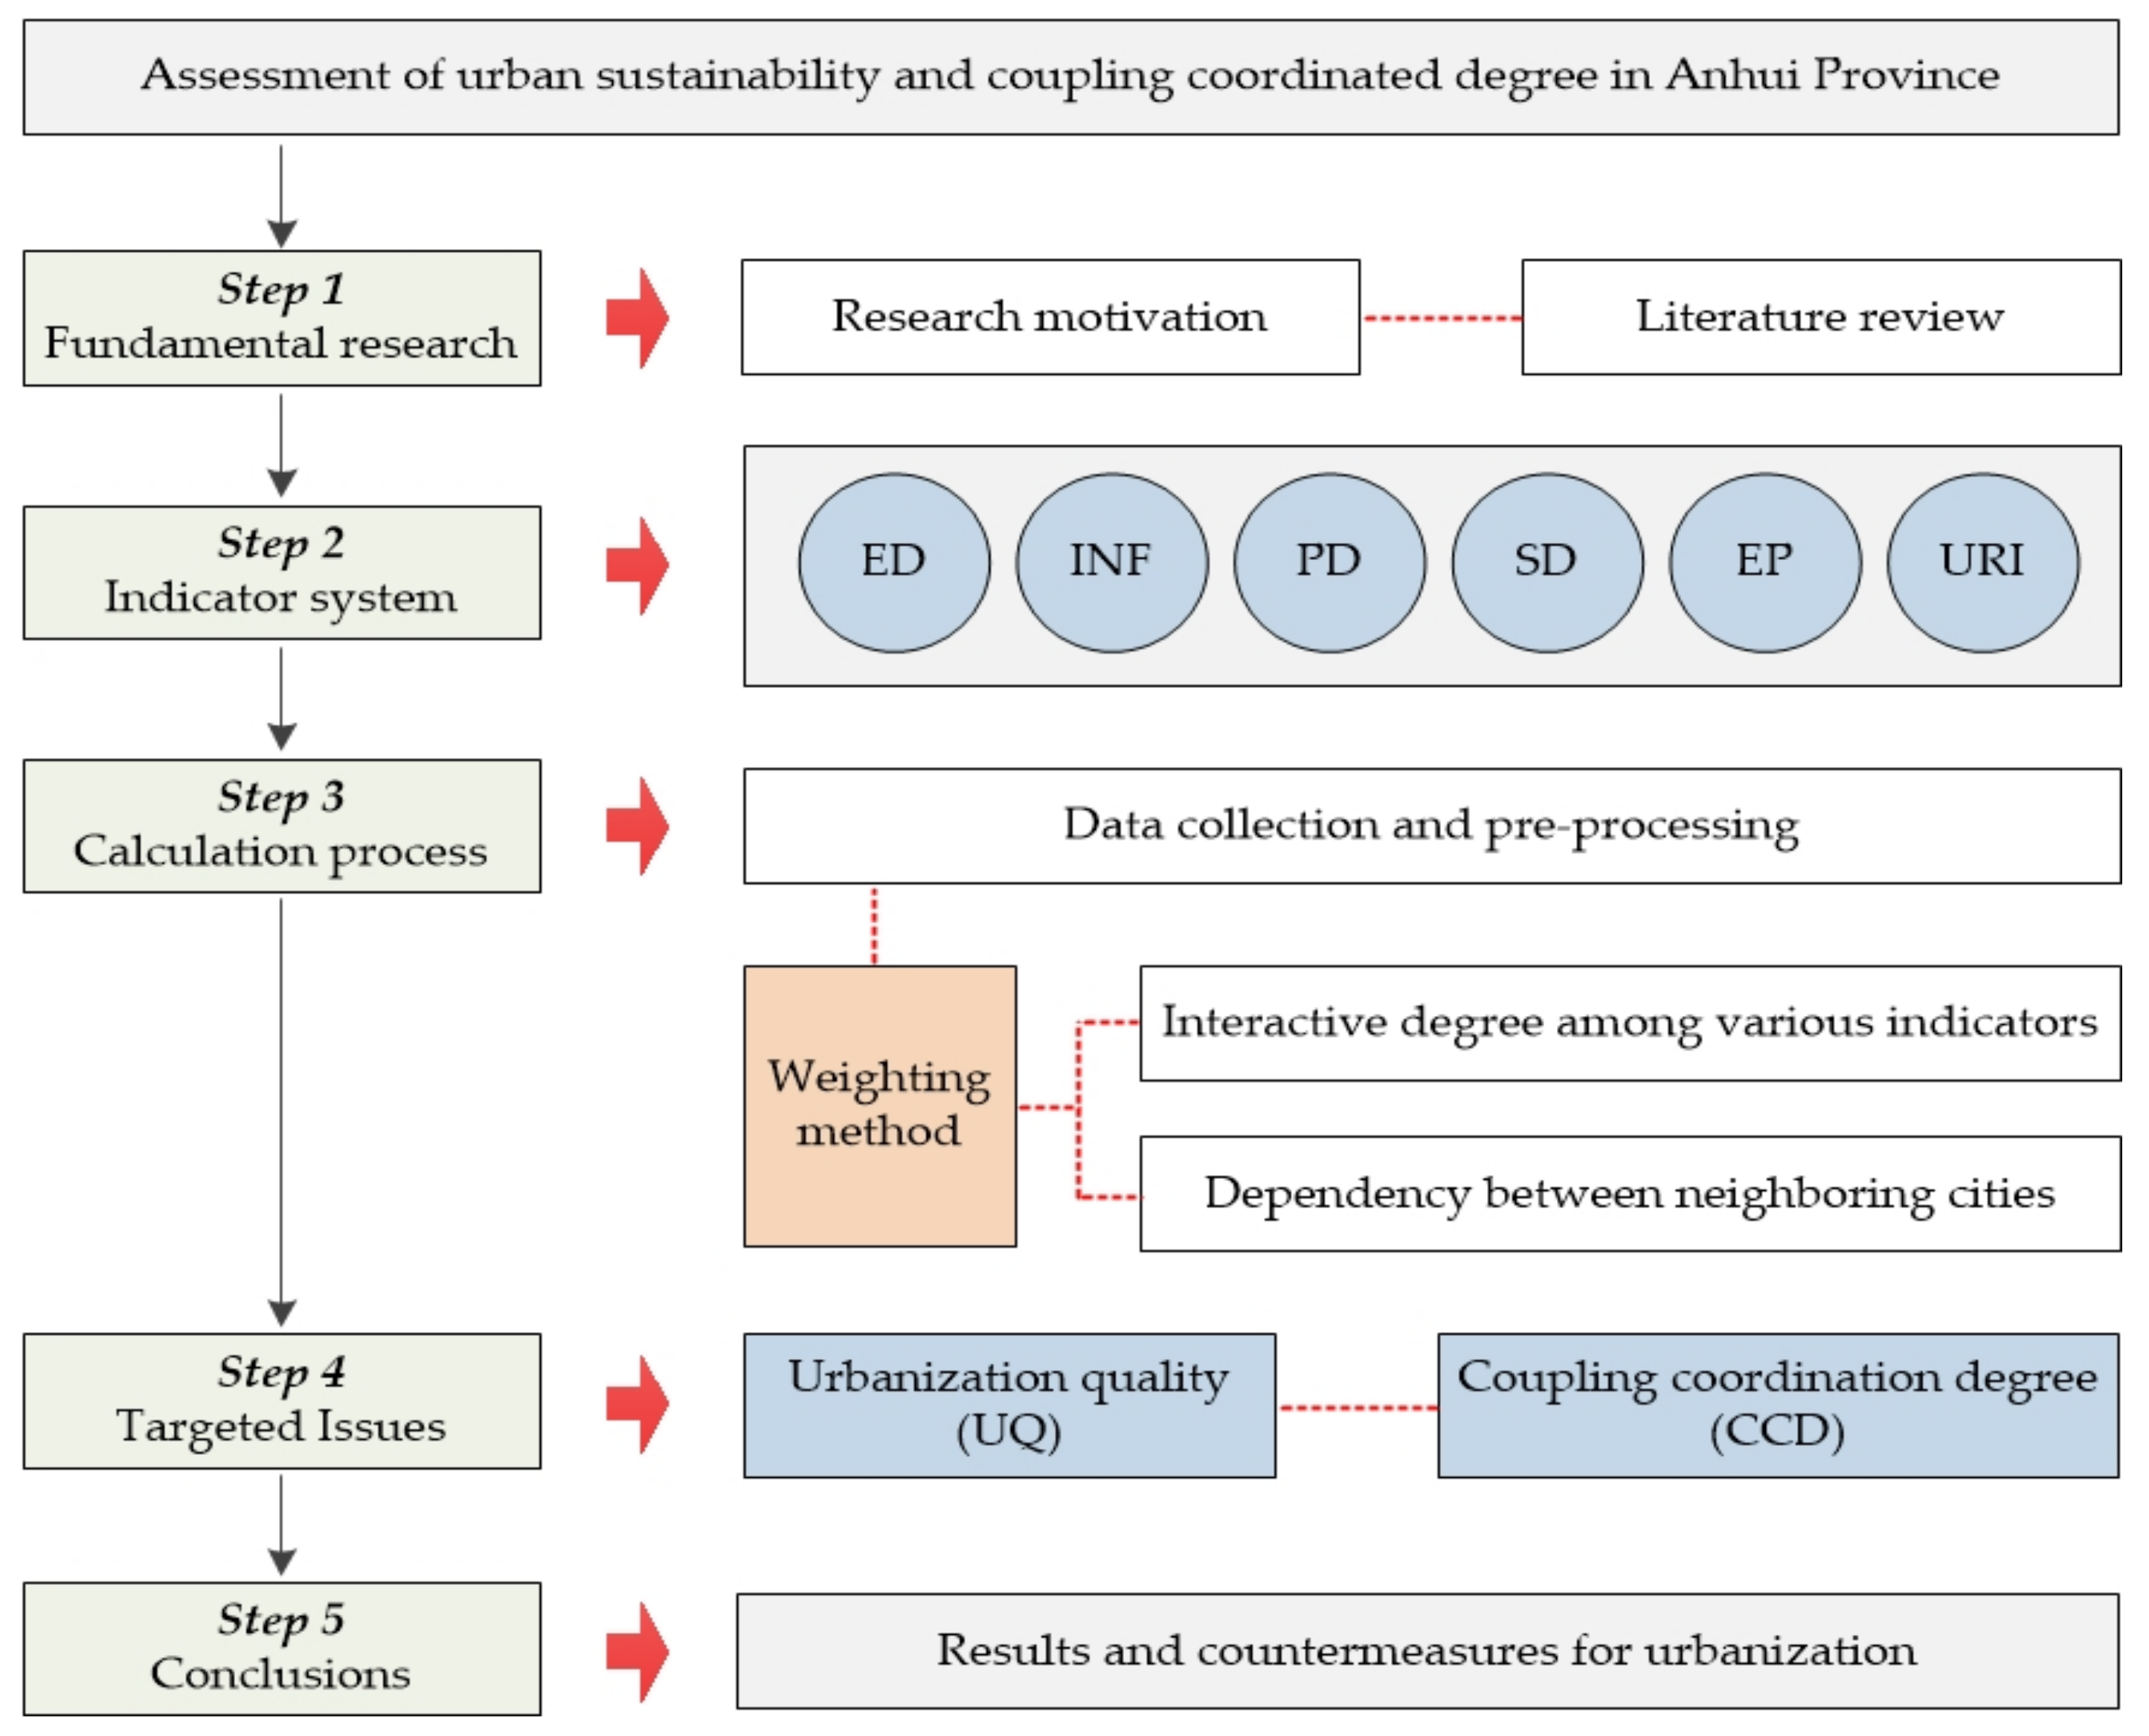
To overcome these deficiencies, this paper proposes a new method of “interaction–change”-oriented sequential relationship analysis to evaluate urban sustainability. Actually, this approach quantifies the indicator weights based on its cross-influence mechanism and dynamic economic development level. It may provide reference for breaking through the traditional static weighting method from the theoretical level. Moreover, it can also provide decision-makers with valuable insights to establish an intercity complementary management system, so as to achieve sustainable development across the entire region. Given the above, we aimed to perform the following: (1) systematically analyze the impact factors of city development and establish the indicator system of urbanization in Anhui Province; (2) explore the quality of urbanization and subsystem scores of its 16 cities by adopting statistical data in 2010, 2015 and 2020, while illustrating the relationship between each subsystem and the level of economic development; and (3) analyze the coupling coordination degree (CCD) of the urbanization quality in Anhui Province and put forward the reasonable suggestions for local decision-makers.
Figure 1 shows the conceptual framework of this research.
3. Materials and Methods
3.1. Study Site
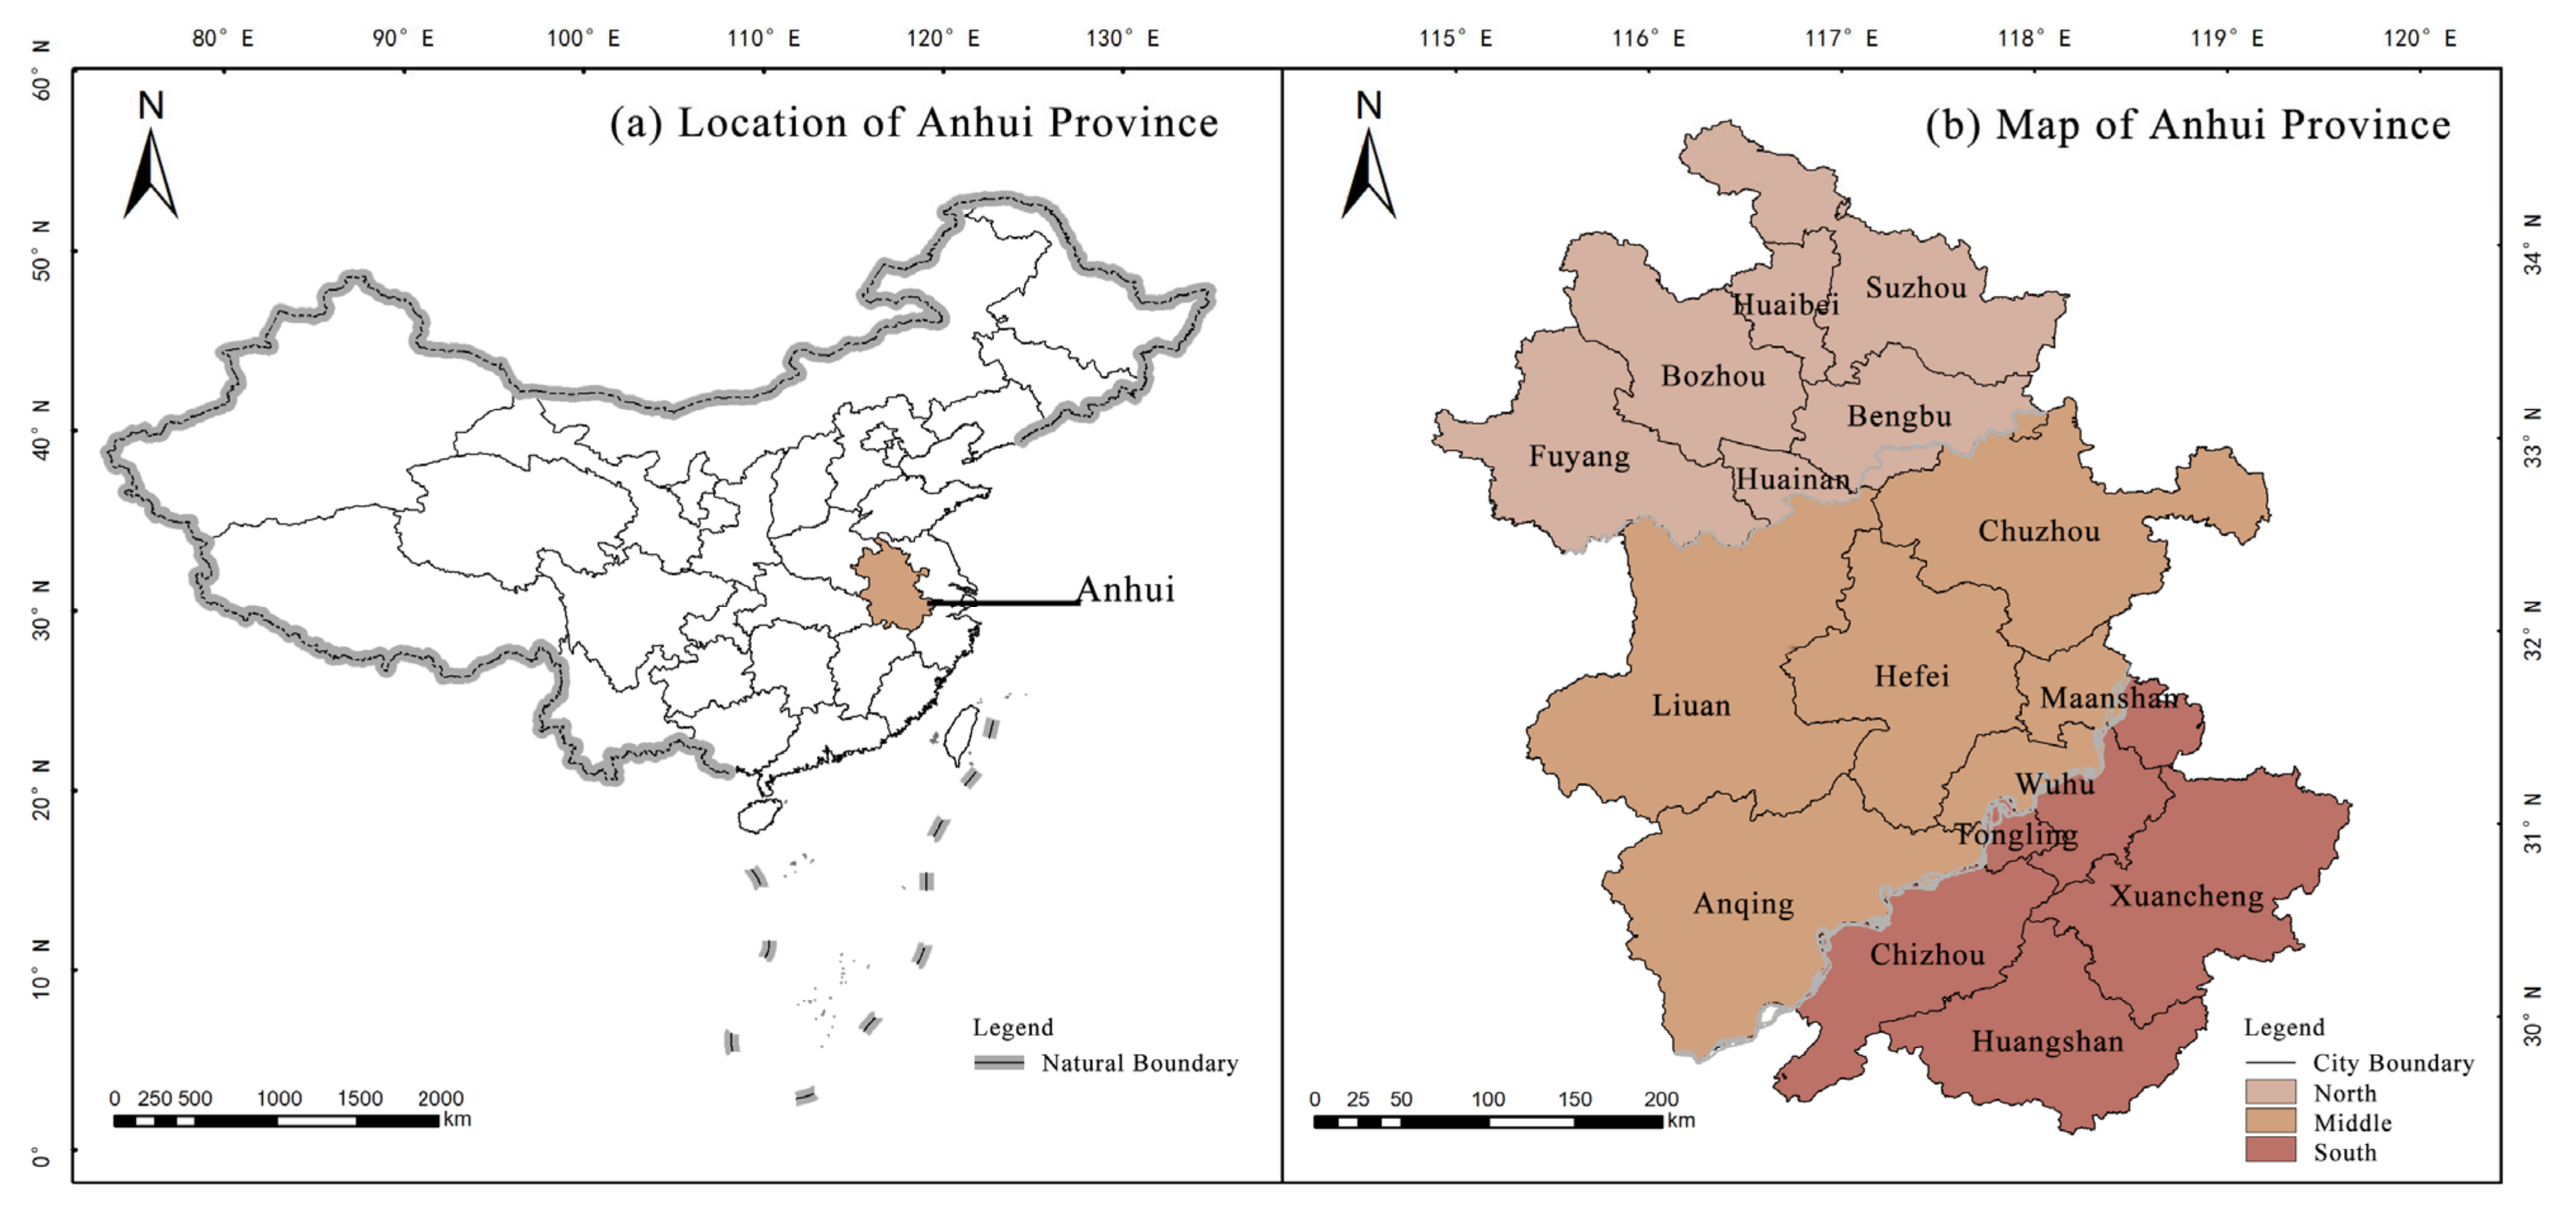
In this study, 16 cities in Anhui Province were selected as the empirical regions to measure the urban sustainability. As a national comprehensive pilot project for new urbanization, Anhui Province is located in East China, with the geographic coordinates of E 114°54′–119°37′ and N 29°41′–34°38′, as shown in
Figure 2. Meanwhile, it is an important part of the Yangtze River Delta and in the connecting zone of several of China’s major economic plates. The total land area is 140,100 square kilometers, accounting for only 1.46% of the national land area. By the end of 2022, the permanent resident population in Anhui Province was 61.27 million, with a growth rate of 0.23% compared to the previous year [
46]. In terms of the 16 prefecture-level cities in Anhui Province, it can be basically divided into the following five categories. (1) Central hub: As a provincial capital, Hefei is a political, economic and cultural center with rich historical and cultural heritage and a complete industrial system. (2) Cities along the river: These regions, including Wuhu, Bengbu, Maanshan and Huainan, have convenient waterway transportation and rich resource advantages. Meanwhile, they are dominated by industries such as automobiles, steel and machinery manufacturing. (3) Tourism–culture-oriented cities: These are Huangshan, Huaibei, Tongling, Xuancheng and Anqing, which are cities that have rich natural and cultural resources. Their economic development is mainly dominated by tourism, culture and education. (4) Agriculture/light-industry-oriented cities: These are Chuzhou, Fuyang and Suzhou, which are important producing areas of grain and agricultural products in Anhui Province. In recent years, these cities have actively promoted economic transformation and strengthened cooperation and exchanges with neighboring cities. (5) Energy industry-oriented cities: These are Liuan, Bozhou and Chizhou, which are led by the petrochemical and clean energy industries; these cities have made important contributions to the development of Anhui’s energy industry. It can be seen that different urban characteristics create various development modes in the sustainable process, and numerous factors will be coupled and jointly affect its development effect.
During the period of China’s 13th Five-Year Plan (2016–2020), Anhui’s economic competitiveness improved steadily. The gross domestic product (GDP) increased from CNY 23,800 billion (Yuan) in 2015 to CNY 38,700 billion in 2020, rising from 14th to 11th in the whole country. This rapid population expansion and economic growth illustrate that the Anhui Province is undergoing an intense process of urbanization, thereby recognized as a suitable area to probe the regional sustainable development. However, the current developing trend has also brought with it excessive energy consumption and heavy environmental burdens simultaneously. Whether it will be an obstacle to the achievement of the 2035 vision goal still remains to be explored.
3.2. Construction of Indicator System
The reasonable selection of indicators is the prerequisite to ensure the accuracy of evaluation results. Li et al. [
47] pointed out that the basic principles for constructing an indicator system are objectivity, measurability and availability, so as to achieve selected indices that are highly relevant to targeted goals and easily compiled. Based on these criteria, we thoroughly considered the actual development situation of 16 cities in Anhui Province and finally extracted 32 indicators from six dimensions, i.e., economic development (ED), infrastructure (INF), population development (PD), social development (SD), environmental protection (EP) and urban–rural integration (URI), as listed in
Table 1. Honestly speaking, due to the fact that some implicit data acquisition is difficult, the indicator system established in this paper cannot cover all aspects of urban sustainability. For instance, the current evaluation methods for urban areas are independent, and there is no index that can quantify the coupling effect among different cities. With the continuous deepening of exploration, this bottleneck is believed to be better solved in the near future.
In terms of ED, it is an important material guarantee for cities to maintain vitality, from which C1~C4 represent the significant macro-index affecting regional economic development. As for INF, it reflects the hardware level conditions of the city construction, and C5~C9 summarize the facilities from basic medical care, water/gas penetration, per capita road and green area. Regarding PD, we chose the urbanization rate (C10), proportion of urban population (C11), illiteracy rate (C12), education background (C13) and outgoing rate (C14) to analyze the population development within an urban region. Focusing on SD, several indices that influence the residents’ health and well-being were extracted, such as urban/rural low-security fund, number of domestic and foreign enterprises, total tourism revenue, per capita expenditure, etc. (C15~C22), to assess the effectiveness of current social development. In view of EP, since the environmental sustainability mainly refers to the control of pollutant discharge and greening construction, the discharge of wastewater, SO2, NO2, inhalable particulate concentration and afforestation area (C23~C28) are considered to be significant in urban assessing process. Concerning URI, the comparison analysis between urban and rural areas is sorted out, including the ratio of electricity demand, consumption expenditure, retail sales and per capita income level (C29~C32).
3.3. Calculation Method
3.3.1. Data Source and Pre-Processing
The raw data involved in this research were mainly collected from the Anhui Statistical Yearbook (2010, 2015 and 2020) [
48]. During this decade, China spanned the 12th-to-13th Five-Year Plan (2011–2020), which was considered to be a period of rapid development for urbanization. Moreover, the above three years’ node is also a connecting link between the preceding and the following; its phased effects will become an important basis for the realization of China’s long-term developing goals. Based on the collected data, a novel method of sequential relationship analysis was adopted to assess the urbanization quality (UQ) and its coupling coordination degree (CCD) among various dimensions in Anhui’s 16 cities, from 2010 to 2020. To ensure the uniform comparison of different data, we eliminate the units of measurement for benefit or cost impact-oriented data. In pre-processing, the dimensionless of the original data is described as Equation (1).
where X
ij′ is the value of the raw data (X
ij) after non-quantitative processing, which is in the range between 0 and 1; and X
j(min) and X
j(max) denote the minimum and maximum value of the jth indicator for ith city (j = 1, 2, …, n).
3.3.2. Calculation of Urbanization Quality
In this study, the linear aggregation model is adopted to obtain the assessment values of ED, INF, PD, SD, EP and URI for each city. Then, we can observe the comprehensive urbanization quality by summing the above six dimensions, as shown in Equations (2) and (3).
where ED
i, INF
i, PD
i, SD
i, EP
i and URI
i represent the six dimensions’ assessment value of the ith city in different studied years; w
j is the weight of the jth indicator (0 ≤ w
j ≤ 1); and UQ
i is the index reflecting the urbanization quality of the ith city.
3.3.3. Determination of Indicator Weights
The aim of the evaluation is to better promote the urbanization-quality level. In this process, the indicator weight is a significant factor that can affect the assessment results. However, as mentioned above, previous studies have ignored the interaction among indicators and the interdependent impact of different cities when determining the weights. Given these shortcomings, we propose a new method to optimize the indicator weight, which focuses on the interaction mechanism among various indices and interdependent relationships between different cities. As for a specific indicator, if there is a large interaction with other indices or a high degree of dependence between neighboring cities, it will be assigned more weight. The detailed steps are outlined as follows.
Step 1: Calculation of the interactive degree among various indicators. In this process, a cosine similarity model is adopted, which evaluates the similarity of the different indicators by calculating the cosine of the angle among them. Actually, the interval of this value ranges from −1 to 1. It is widely used to measure the cohesion and influence interaction within a specific cluster, shown as in Equations (4) and (5).
where II
j,k denotes the interactive degree between the jth and kth indicators; and II
j represents the interactive degree between the jth indicator and remaining indicators, II
j ∈ [−1, 1].
Step 2: Calculation of dependency between neighboring cities. In this step, the concept of the Grey Relation Analysis (GRA) is introduced. Simply stated, in a grey system, we could understand the relative strength of a particular factor affected by other factors. As for the current research, the above method can determine the interdependence between adjacent geographical units, so as to analyze the inner developing mechanism of cities in a more objective way. The calculation model is listed in Equations (6) and (7).
where DC
j is the dependency degree of a specific indicator among the neighboring city; DC
j’ is the dependency degree between neighboring cities, DC
j’∈[−1, 1]; and sgn(o
i, o
p) denotes the sign function of the relationship between ith city and pth city.
Step 3: Determination of indicator weights. By obtaining the calculation results of the interactive degree among various indicators (Step 1) and the dependency between neighboring cities (Step 2), we introduce the exponential function to normalize them. This power operation can more accurately reflect the weight quantization value of a specific indicator, as shown in Equation (8).
where w
j represents the weight of the jth indicator, and w
j ∈ [0, 1].
3.3.4. Coupling Coordination Degree (CCD) Model
The concept of the coupling coordination degree (CCD) originates from physics; it is used to judge whether there is a harmonious relationship between different elements. In fact, the evaluation of the regional developing degree has shifted from the simple level of development to the overall equilibrium evaluation based on coupling coordinated development. Therefore, the CCD method has become an effective tool to assess the urban sustainability. With this motivation, we further established the CCD model of urbanization quality among various indicators and cities. In this model, we assume that ED, INF, PD, SD, EP and URI are equally important in urbanization quality. Then, a relatively reliable minimum deviation CCD value can be observed through weighted calculation. The results can verify the influencing factors of urban development, as well as the coordination degree of harmony and restriction between each factor and geographical location. The formulas for the CCD models are presented as Equations (9)–(11).
where CCD
i is the coupling coordination degree of the urbanization quality for ith city, CCD
i ∈ [0, 1]; UQ
i(mean) represents the average evaluation value of six dimensions for ith city; and CC
i denotes the mean value of the urbanization quality for ith city.
4. Results and Discussion
4.1. Measurement of Urbanization Quality in Anhui Province
According to the above indicator system and evaluation method, the urbanization quality of Anhui Province in 2010, 2015 and 2020 was comprehensively measured, as shown in
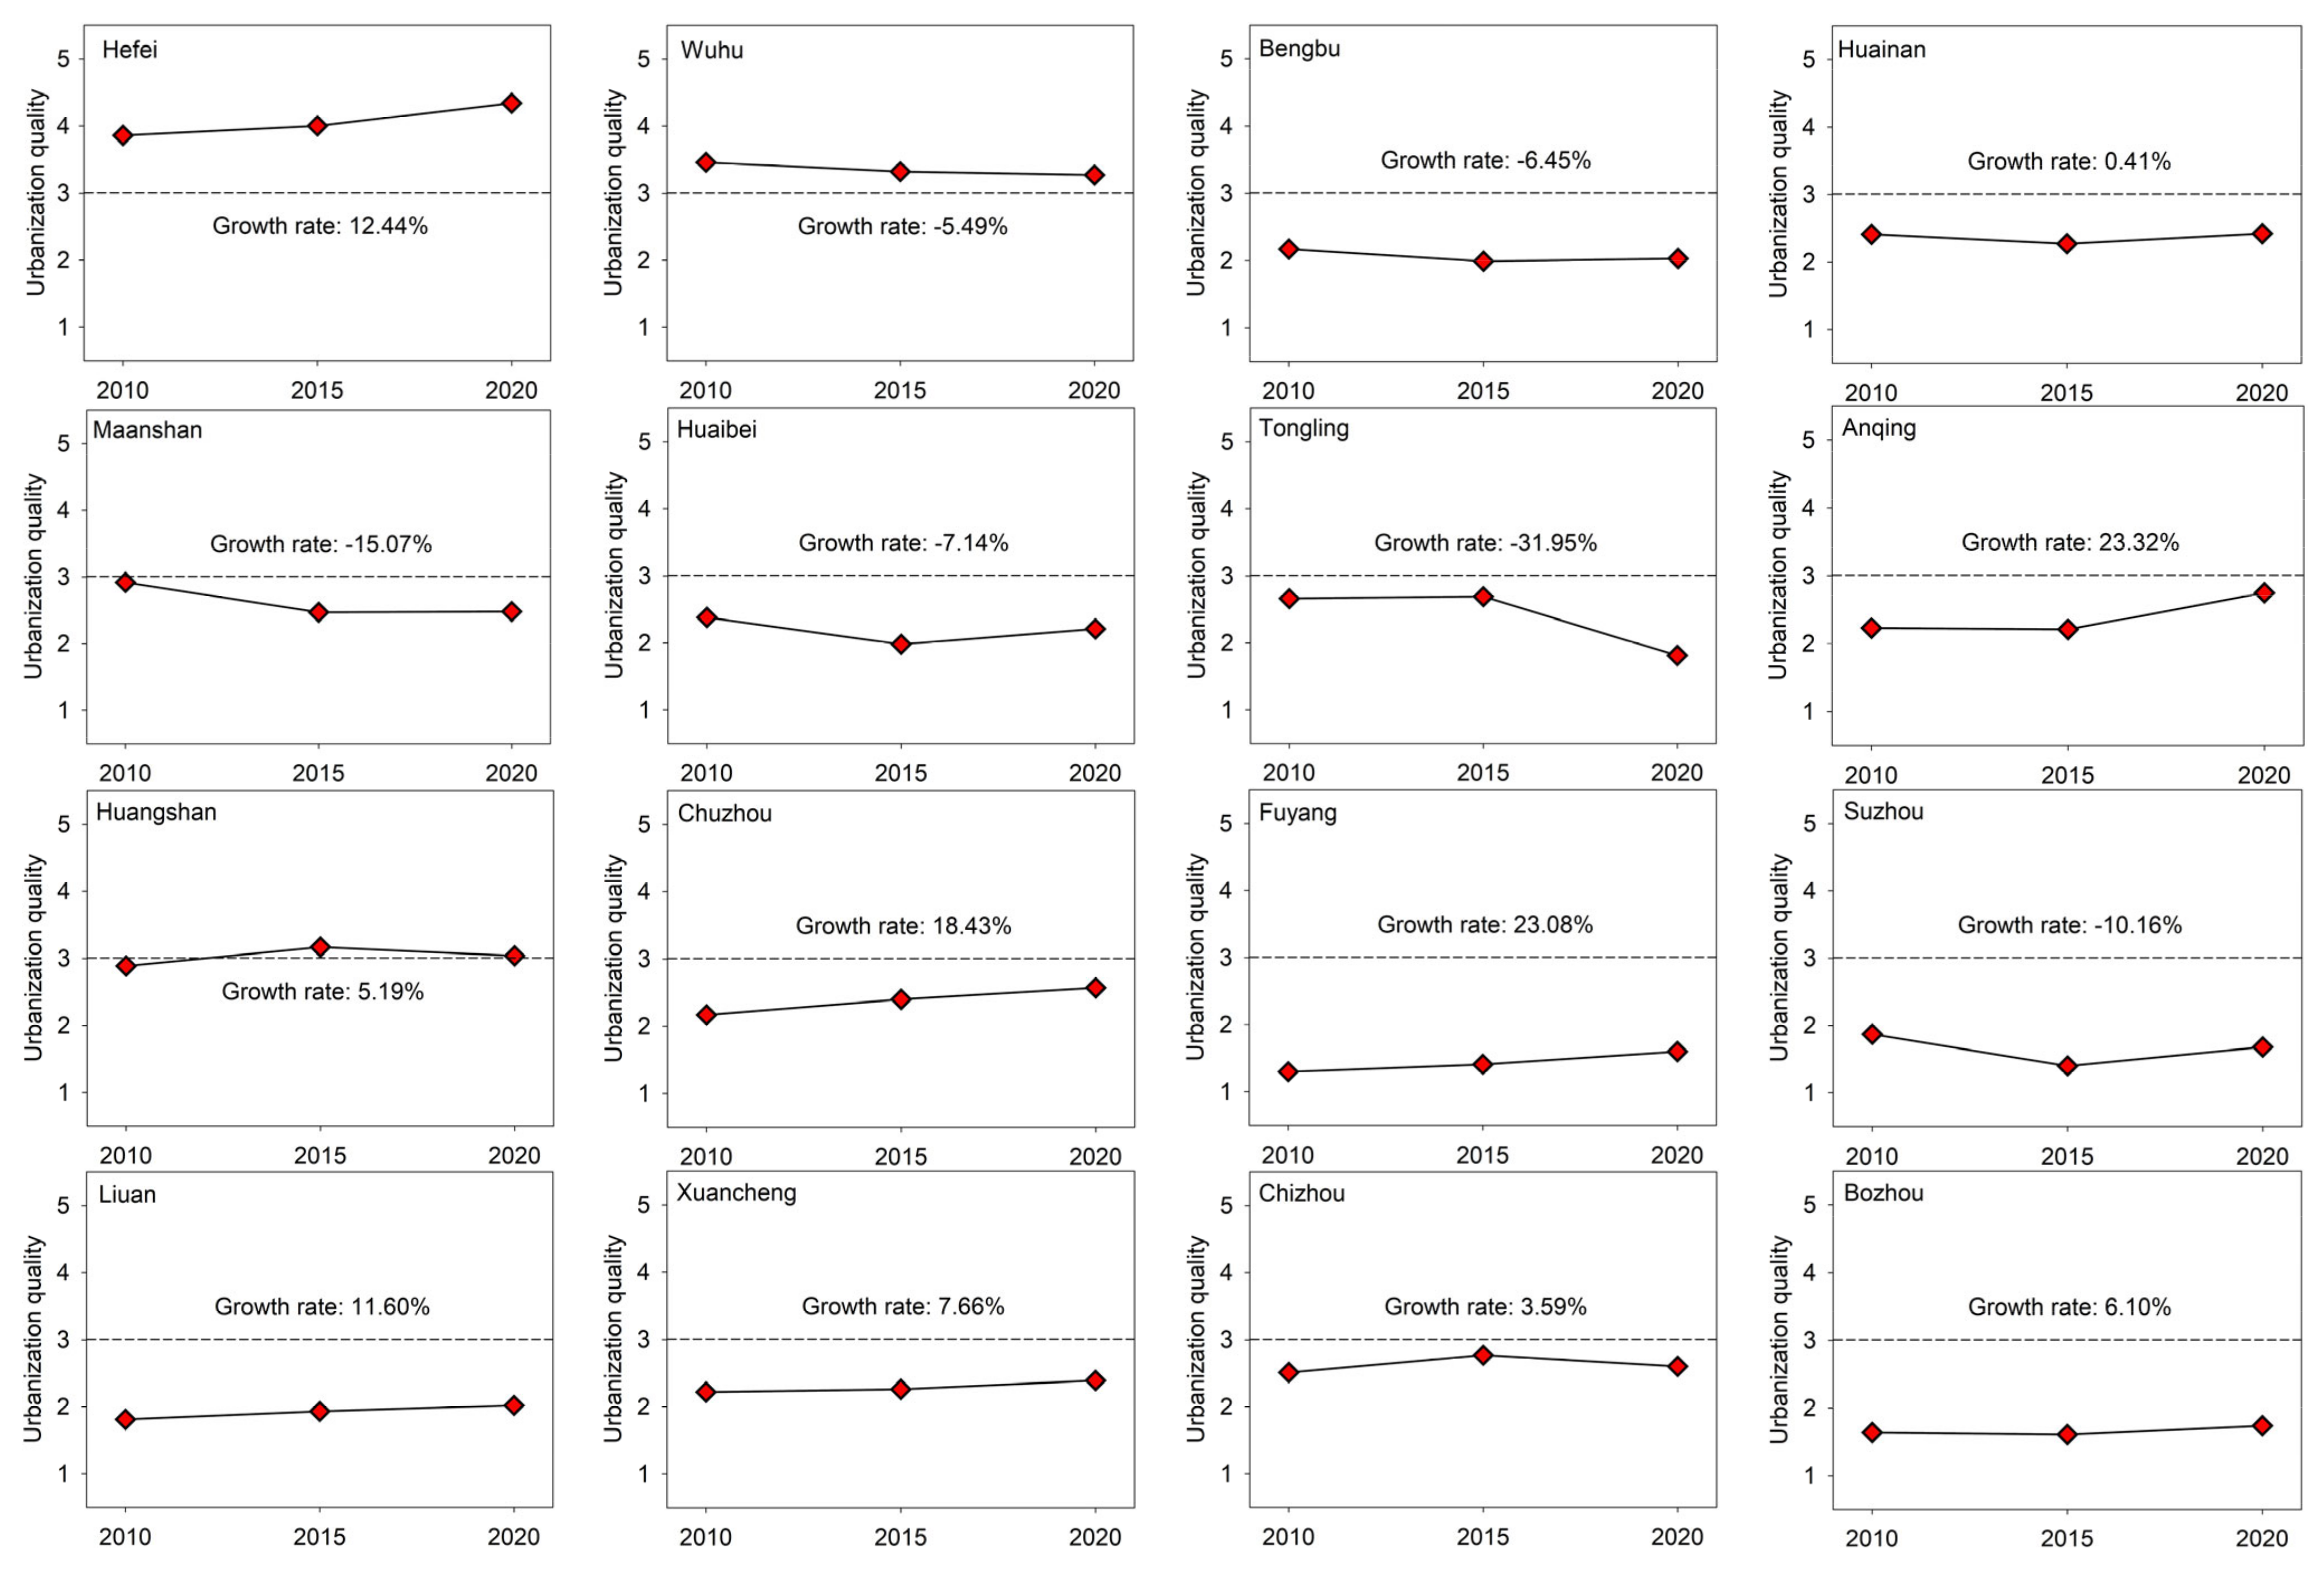
Table 2. Generally, the assessment value of the whole province fluctuates approximately from 2.37 to 2.43, with the average level being 2.40. Among the different cities, Heifei, Wuhu and Huangshan are the top three cities, with an evaluation score of 4.07, 3.35 and 3.03, respectively. On the contrary, Fuyang observed the worst performance, with the lowest value, i.e., 1.44. As for the other cities, the value range of the urbanization quality was basically from 1.65 to 2.63. These results illustrate that the economic vitality would directly affect the quality of urbanization, and the population inflow may promote the economic development in a certain sense. Furthermore, through the changes in different time periods, the growth rates of urbanization among the 16 cities in Anhui Province vary from each other, as shown in
Figure 3. Around two-thirds of the cities experience an upward trend, and the change rate interval is mainly between −31.95% and 23.32%. Focusing on the positive growth rate, despite the fact that the mean value of urbanization quality for Anqing is 2.40 (ranking 6th of all 16 cities), the growth rate tops the list with a value of 23.32%. The phenomenon reveals that such relatively normal and backward cities, such as Chuzhou, Fuyang, Liuan, etc., are showing a better comprehensive development status. In terms of negative growth rates, Tongling and Maanshan present an obviously decreasing trend with the values of −31.95% and −15.07, respectively. This indicates that the development mode based on sacrificing ecosystem protection may have a significant effect on overall urbanization quality, which is highly consistent with the viewpoint by Yu et al. [
49]. As we all know, the economic and social development is inevitably accompanied by human activities, but this process may lead to the imbalance of the ecosystem. It is a wiser strategy to actively consider the balance between ecological protection, energy utilization and policy implementation.
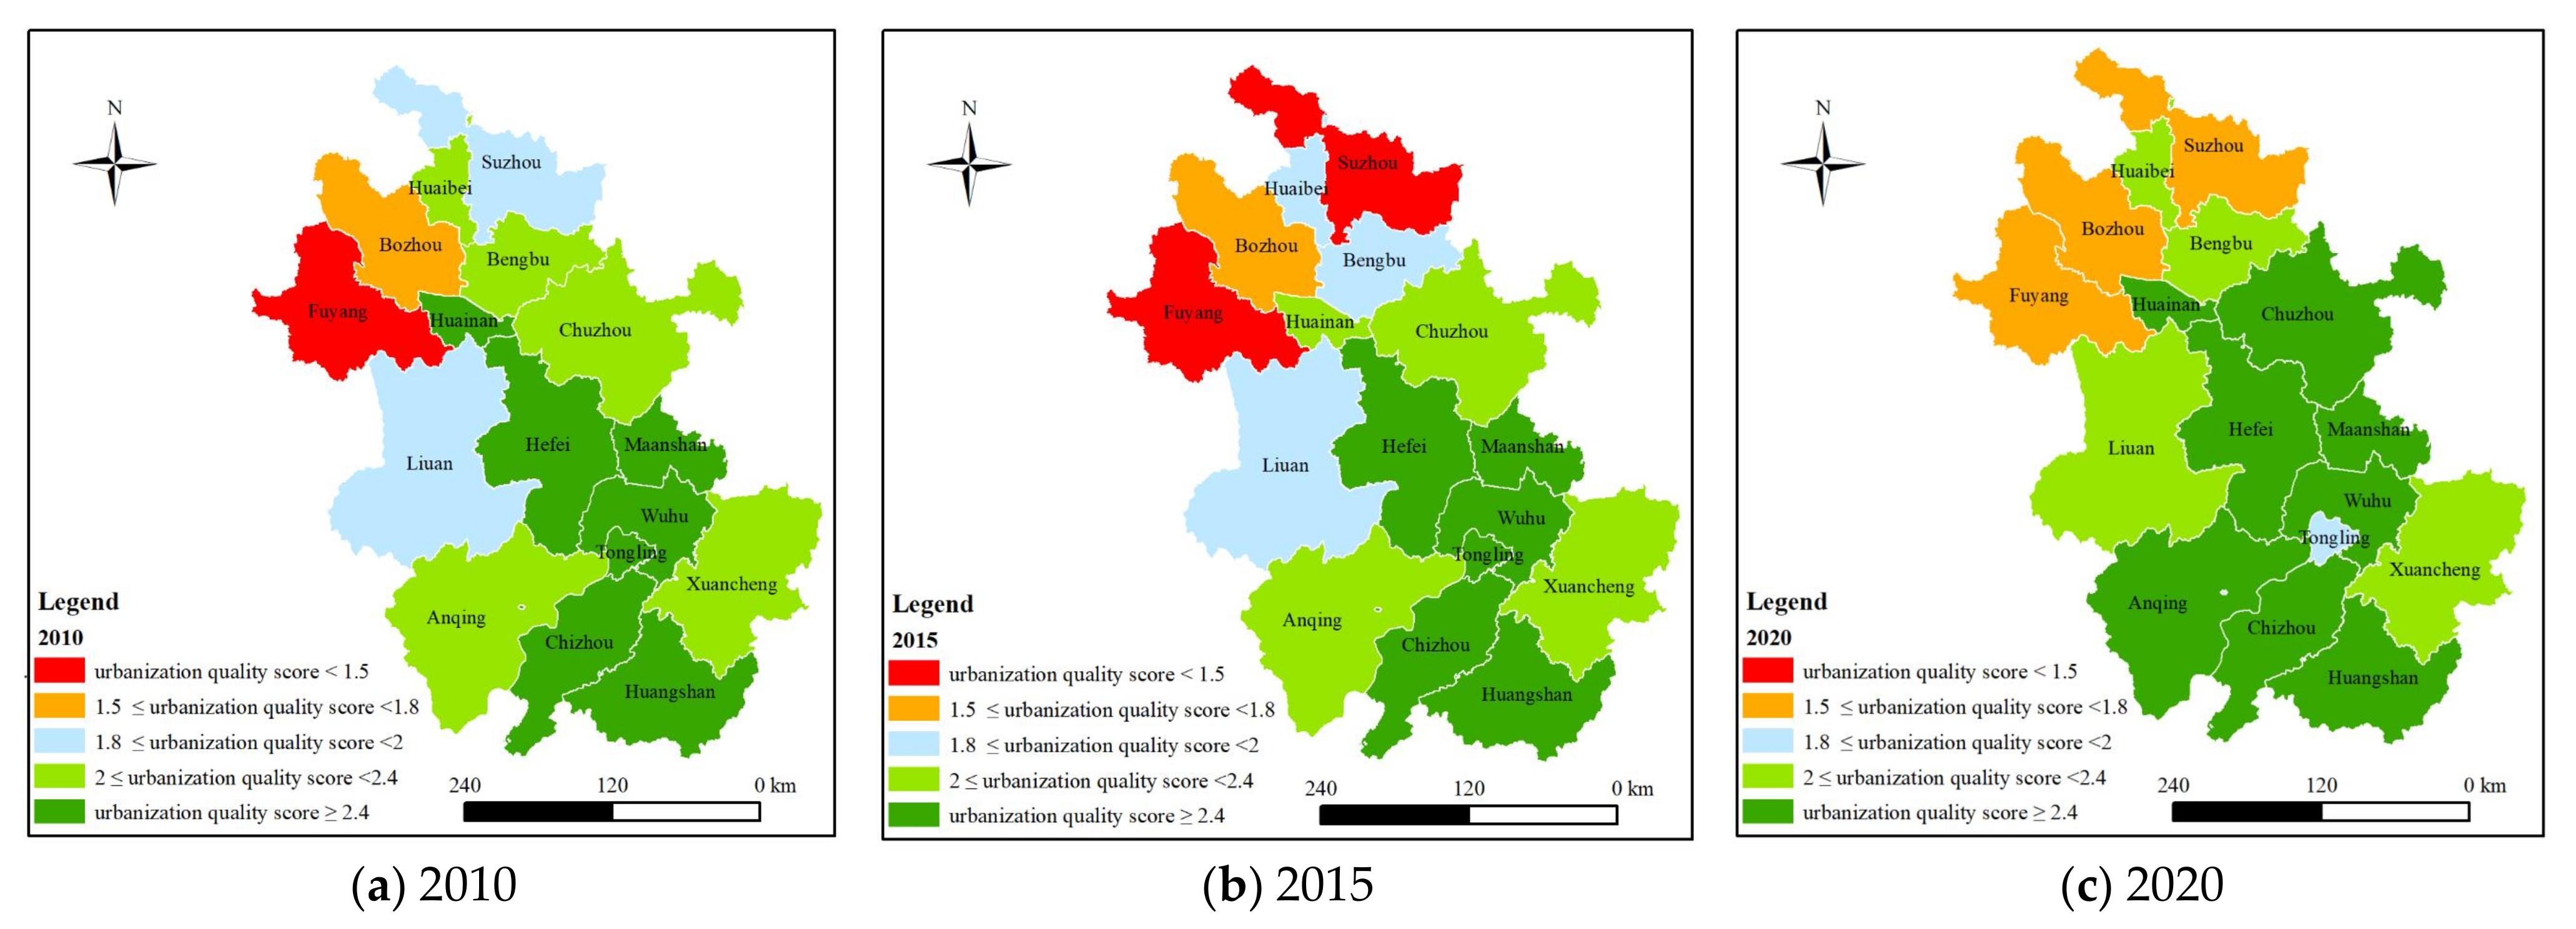
In order to better grasp the spatial–temporal evolution of urbanization quality in Anhui Province, the value interval of 16 cities is divided into five types: (a) less than 1.5, (b) 1.5–1.8, (c) 1.8–2.0, (d) 2.0–2.4 and (e) lager than 2.4.
Figure 4 displays the topographic distribution map of the urbanization quality in 2010, 2015 and 2020. It can be observed that the level of urbanization for most cities shows an increasing trend, which reflects that the six dimensions are in a state of coupling and coordinated development. In detail, during the period from 2010 to 2015, only Fuyang, Bozhou and Suzhou expressed a relatively depressed economic benefit, with the assessment score being less than 1.8. However, this pattern has changed significantly since 2015, and the majority of cities achieved primary coordination by 2020 (mean quality score lager than 2.5). Concerning the provincial scope, the spatial differentiation is better in the south part of the province than in the north part, and the regularity was obvious. For example, Anqing, Chizhou and Huangshan show a good performance, with all the values of comprehensive assessment above 2.0. Nevertheless, Suzhou and Fuyang express poor sustainability on the comprehensive level from 2010 to 2020. The other remaining cities, such as Liuan, Hefei, Maanshan and Wuhu, showed a steady improvement overall.
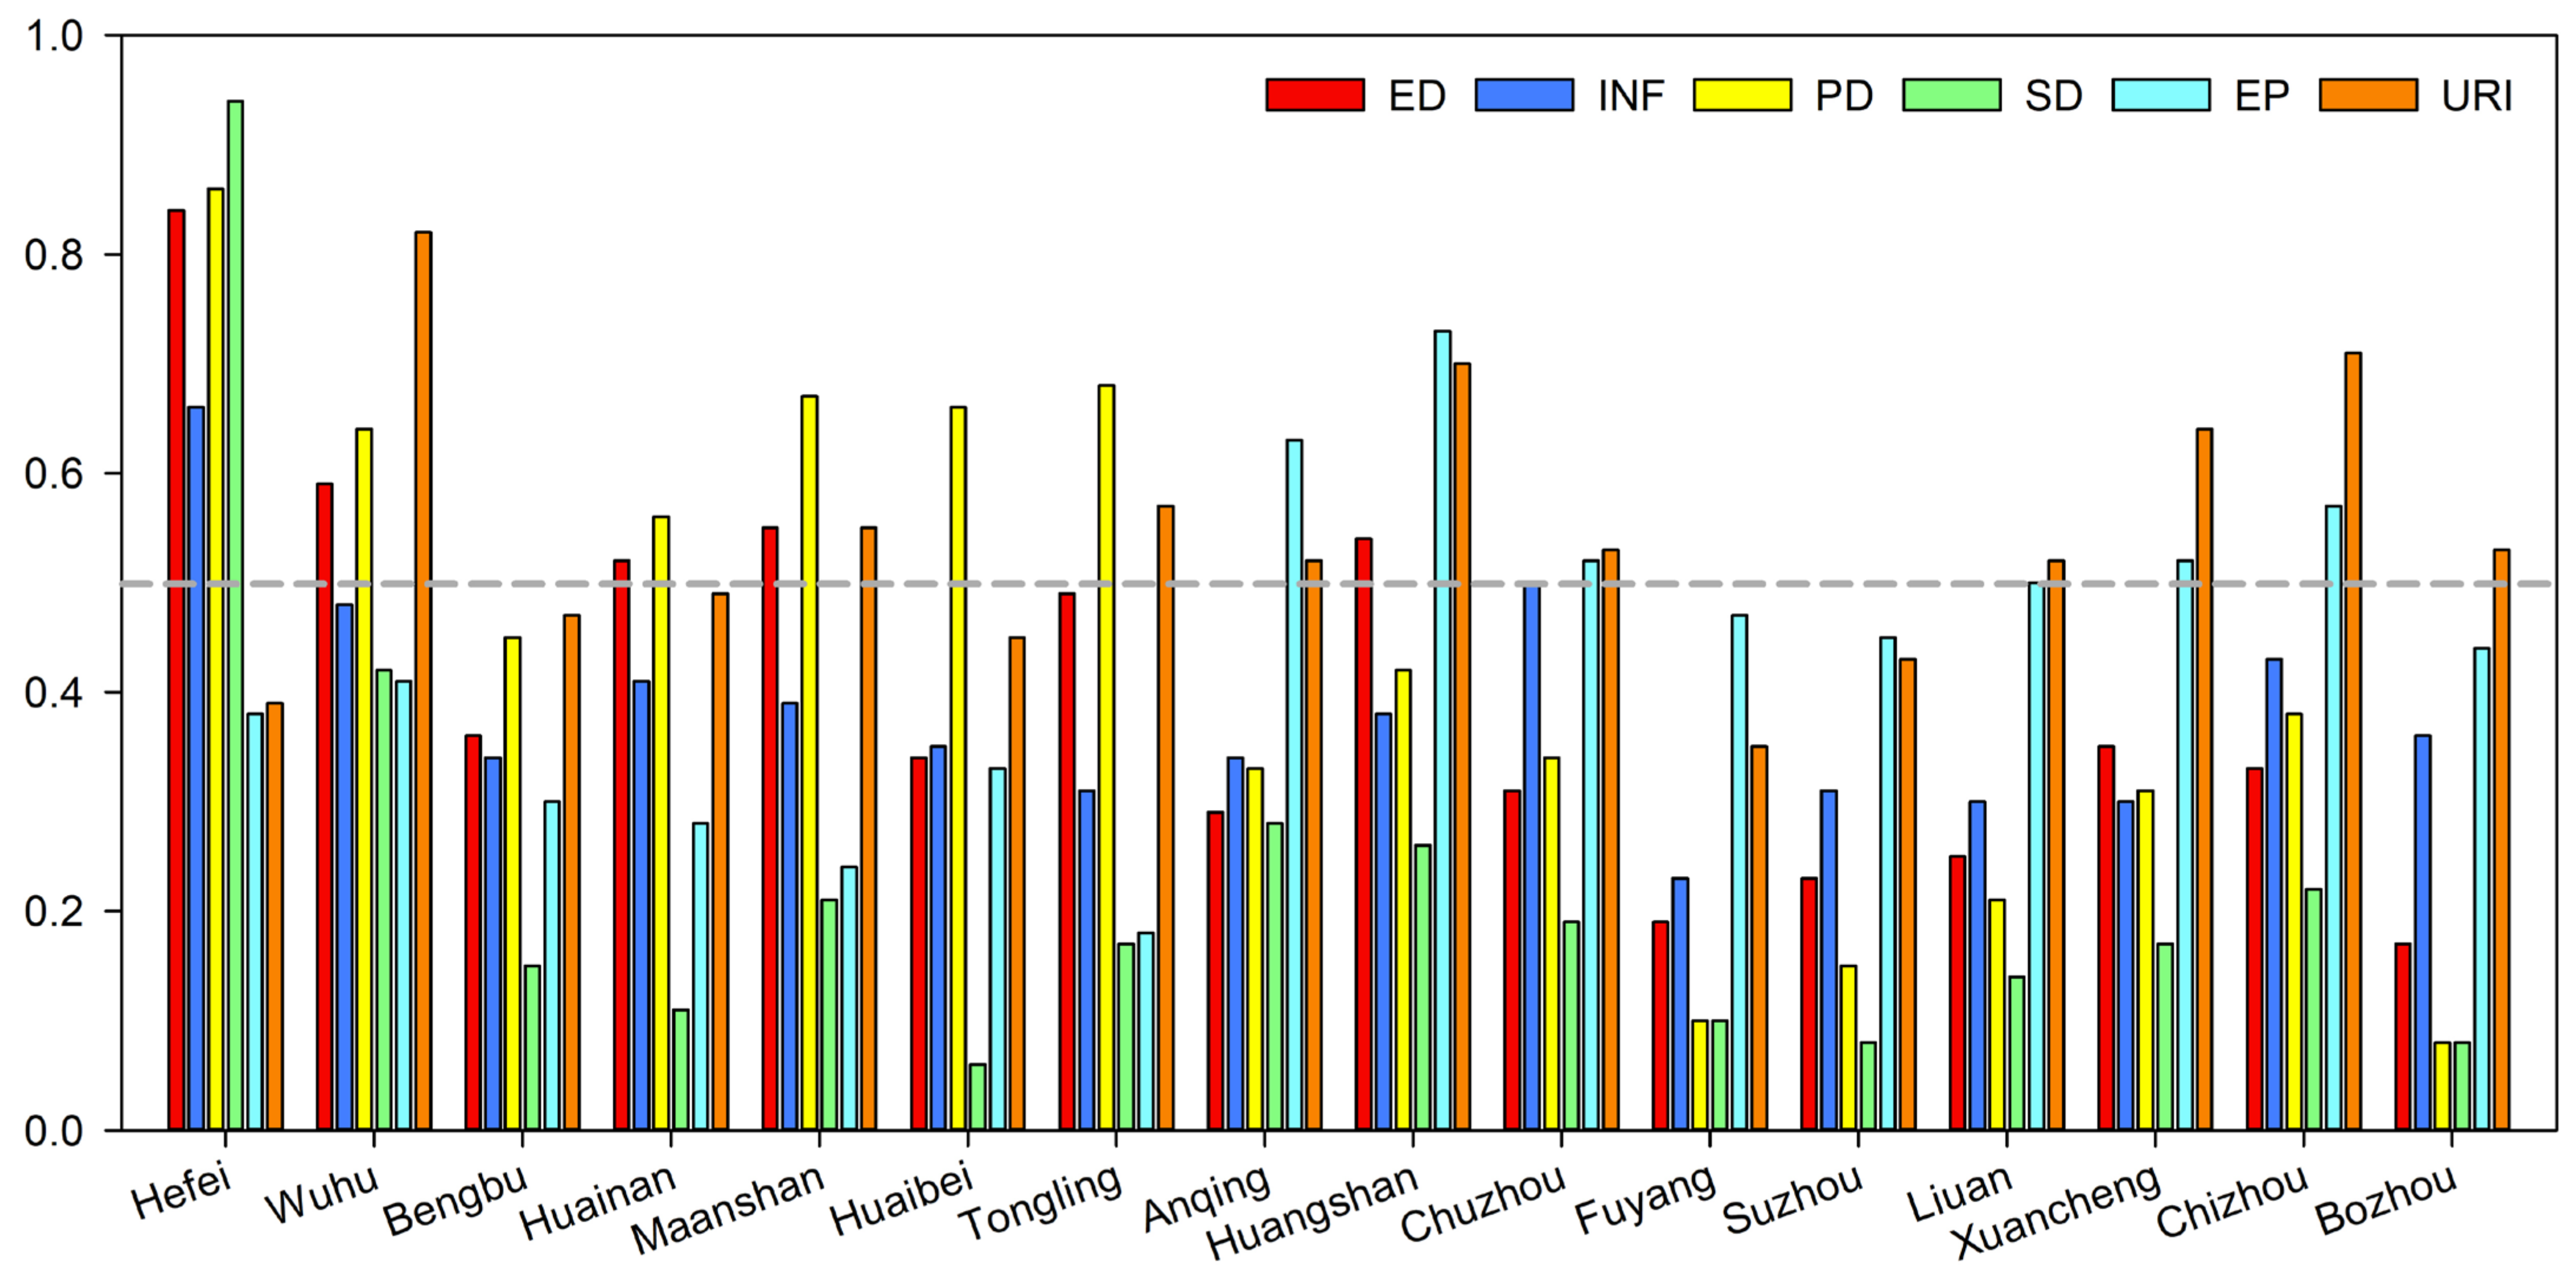
To probe reasons for the inconsistent development among ED, INF, PD, SD, EP and URI, we calculated the mean value and growth rate of each city according to the six dimensions, as shown in
Table 3,
Table 4 and
Table 5 and
Figure 5. The sustainable level of urban–rural integration dimension obtained the best performance, with a mean value of 0.54, followed by the environmental protection, population development, economic development and infrastructure dimensions, for which the assessment values are 0.44, 0.43, 0.40 and 0.38, respectively. However, the performance of social development is not ideal; ranked last, with an average score of 0.22. Focusing on the temporal changes, the population development achieved the highest growth, i.e., 31.00%, within near ten years (increasing from 0.40 to 0.46), while only the subsystems of social development and urban–rural integration had negative growth rates, i.e., −0.03% and −8.29, respectively. This means that, accompanied by the rapid urbanization process, the net inflow of population and the human activity intensification have led to a fierce contradiction between social development and urban–rural integration. From the perspective of economics, only by treating urban and rural areas as a closely linked part and effectively promoting the two-way flow of their production factors can we ensure the healthy development of regional economy. One thing should be pointed out: although Maanshan and Tongling obtained a higher economic development level, there is a negative growth phenomenon with the change rate of −21.54% and −28.00%, respectively. It illustrates that these regions encountered a bottleneck in development and need to be highly valued by local government. As for the infrastructure dimension, the majority of cities increased by a varied degree in 2020 compared to 2010, except for cities ranked as the top four according to the urbanization quality (Heifei, Wuhu, Huangshan and Chizhou). The reason for this is that cities with a stronger comprehensive level improved their urban hardware facility in earlier years, and their development in recent years is mainly based on renewal and transformation. Although the quantization results of population development and environmental protection dimensions are basically identical, the growth rate of the two is significantly varied. The evaluation results show a growth trend in economic (4.10%), infrastructure (30.93%), population (31.00%) and environmental protection (4.45%), but they obtain a −0.03% and −8.29% decline in social development and urban–rural integration, respectively. Actually, economic development should not come at the cost of widening urban and rural gaps; only regional balanced coordination could ensure the sustainable development requirements.
4.2. Relationships between Urbanization Quality and Economic Development
From the perspective of urban and rural development, the overall quality of life in Anhui Province is good, and most of the functional facilities are perfect. However, there is still a long way to go in regional coordination, especially in the coordinated development of large, medium and small cities. Based on the above analysis, it can be observed that the economic development (ED) has greatly promoted the level of urbanization. Thus, in this section, the relationships between ED and urbanization quality are further measured to reveal the internal influencing mechanism.
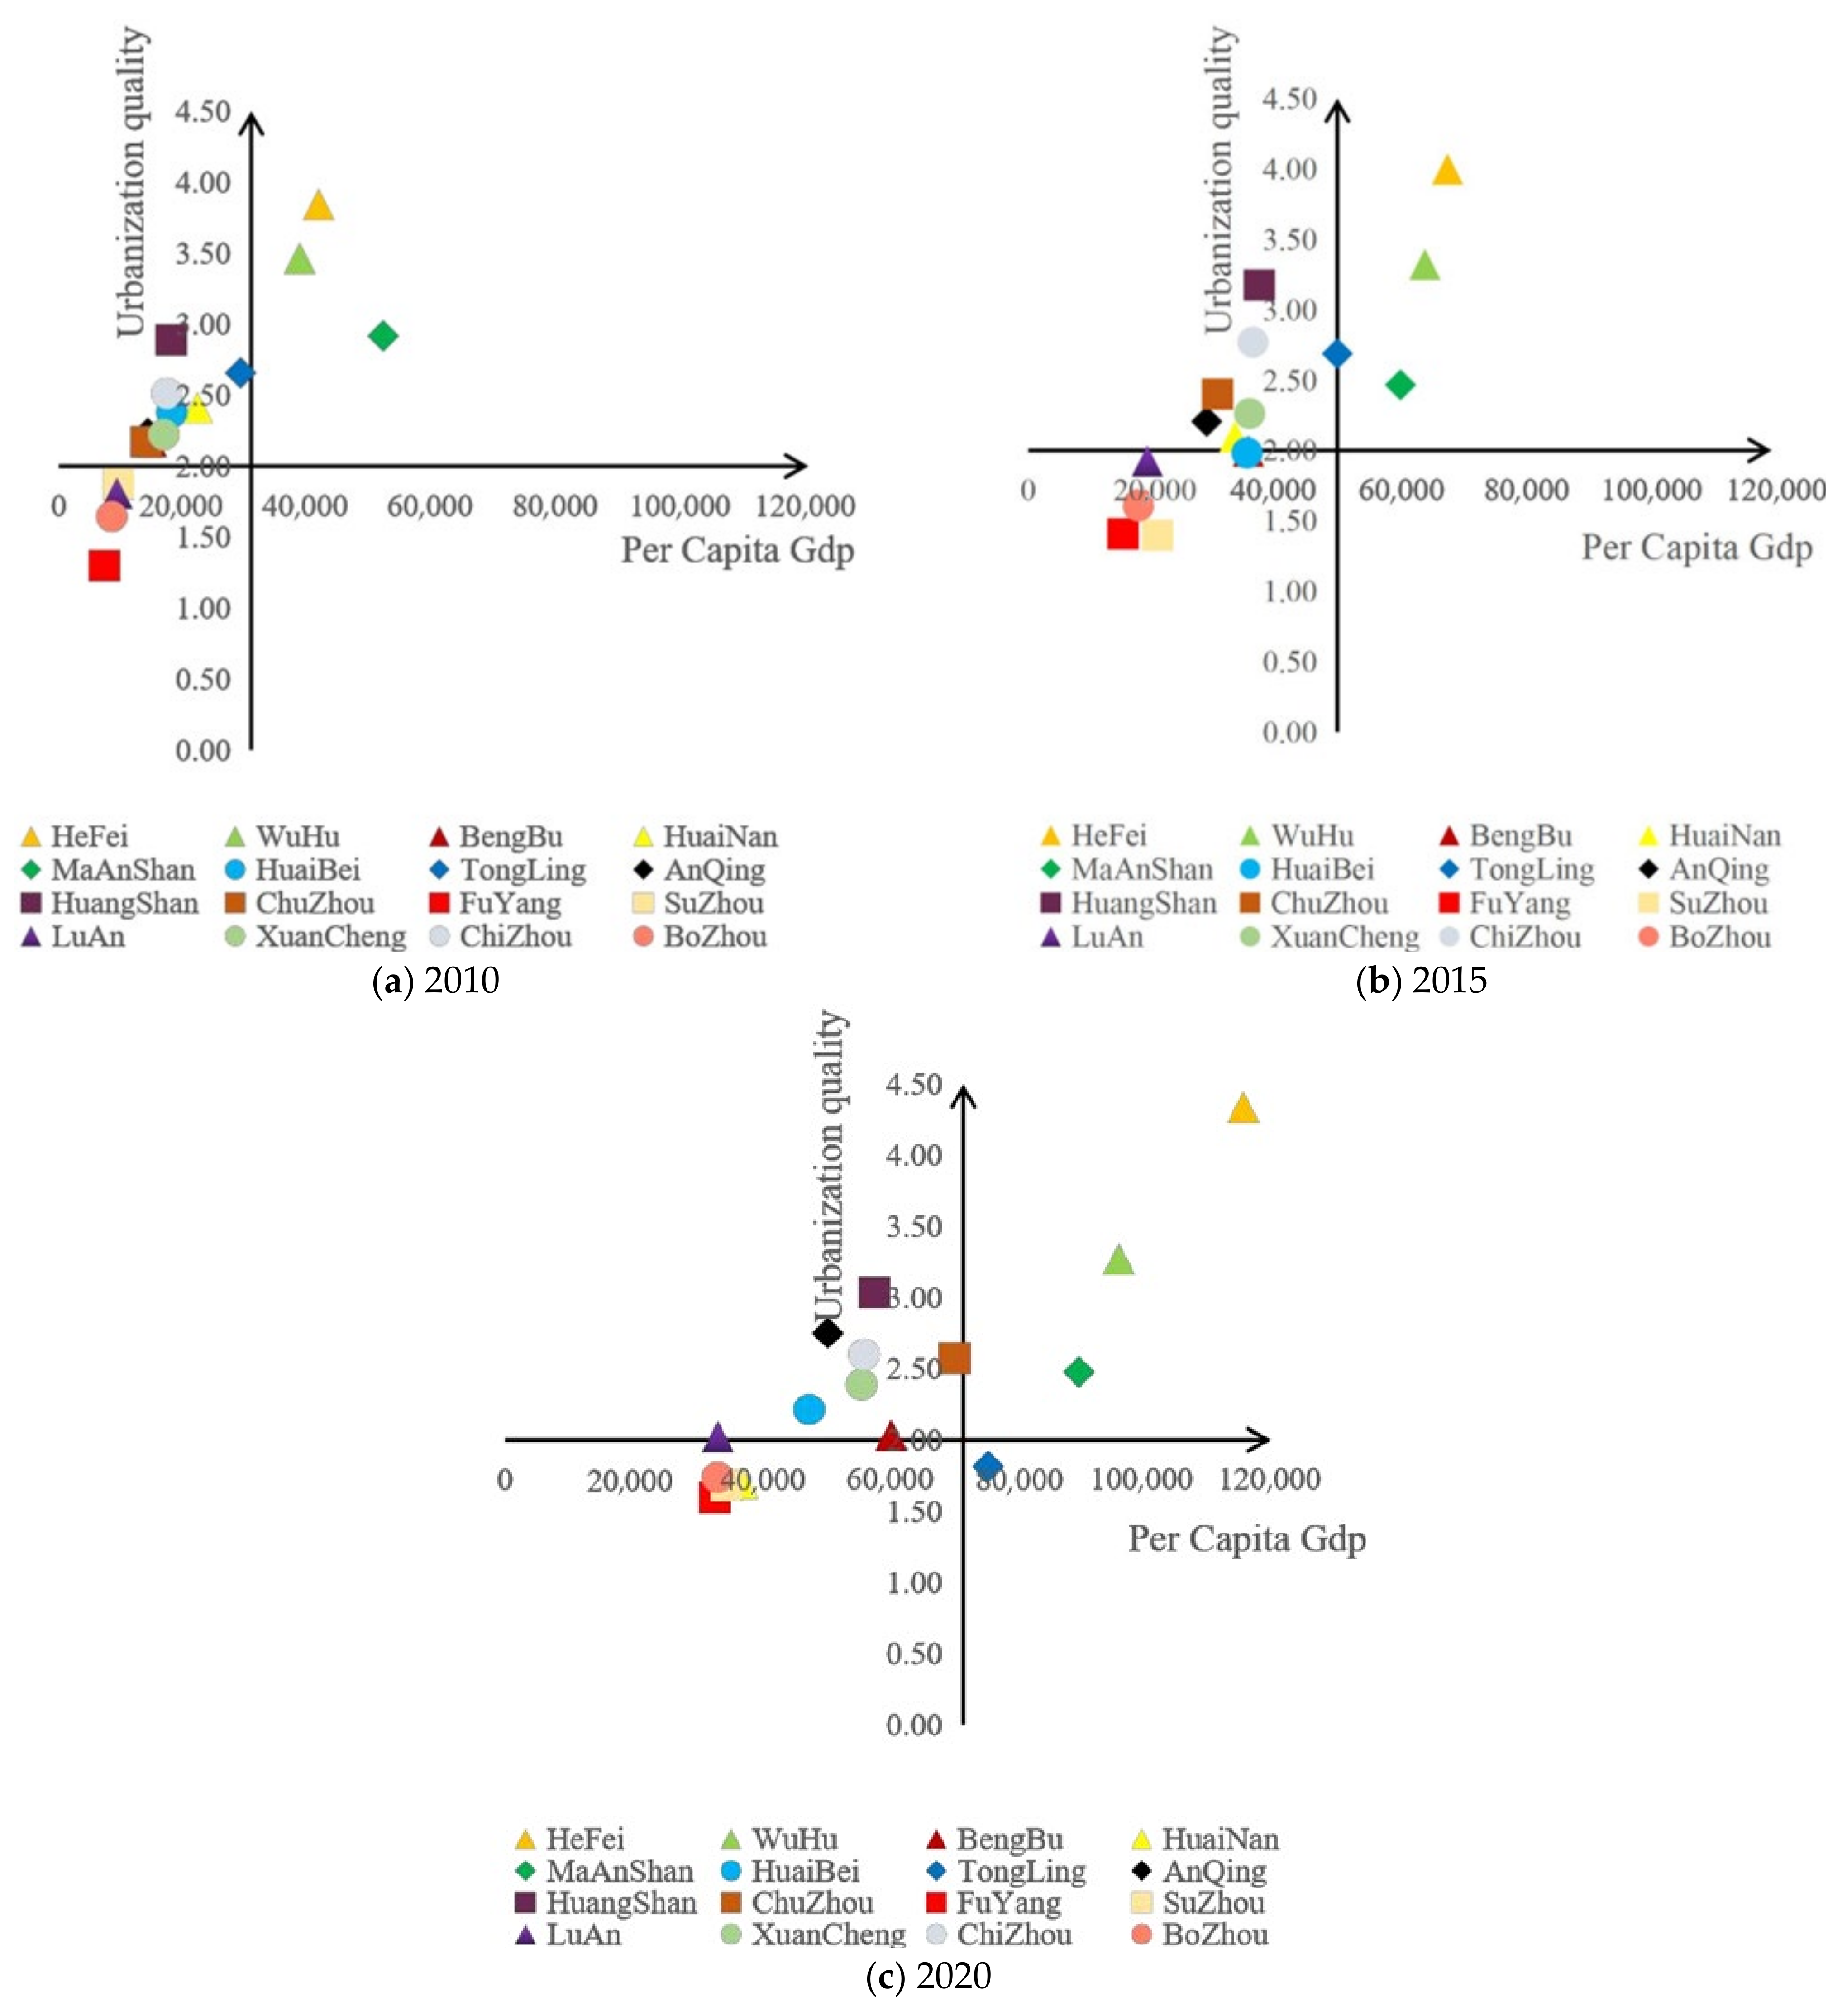
According to the level of economic development, per capita GDP is extracted as a representative indicator to explore its impact on each dimension and the comprehensive score of urbanization quality. In addition, the quadrant diagram method is carried out to visualize the relationship between urbanization quality and per capita GDP in Anhui province. In this way, the comparing results can be presented by the four quadrants in the Cartesian plane rectangular coordinate system; the first-to-fourth quadrants are represent the high (UQ)–high (ED), high (UQ)–low (ED), low (UQ)–low (ED) and low (UQ)–high (ED) level. Based on the relevant statistics, the national per capita GDP was approximately CNY 30,800, CNY 49,900 and CNY 71,800 in 2010, 2015 and 2020, respectively. Thus, in this study, these three values serve as the reference points of the X-axis, and after standardizing the above two measurement indicators, the evolution diagram of the 16 cities in Anhui Province (2010, 2015 and 2020) is obtained, as shown in
Figure 6. It can be seen that, in 2010, most cities in Anhui Province had a low level of economic development, which was mainly concentrated in the second and third quadrants. Meanwhile, Fuyang, Bozhou, Liuan and Suzhou were relatively poor, which not only reflected the level of economic development but also reflected in the quality of comprehensive urbanization. Actually, Anhui Province focused on the development of several key cities before 2010. Nevertheless, due to the fact that the advantages of these cities were not obvious by comparing with the national level, there was no significant improvement in the overall situation. The economic development of most cities in Anhui Province in 2015 developed greatly compared with that in 2010. The overall points have shifted to the right, and there was development from the third quadrant to the second quadrant. One thing that should be mentioned is that Tongling is located in the second quadrant in 2010 and 2015, but it belongs to the fourth quadrant in 2020 (low (UQ)–high (ED) level). The reason is that the score of the urban–rural integration subsystem dropped too much (from 0.86 in 2015 to 0.22 in 2020); this also proves that the development of a city cannot ignore its impact on the surrounding rural areas.
Generally speaking, Hefei, Wuhu and Maanshan in Anhui Province are relatively developed areas, for which the long-term stability belongs to the high (UQ)–high (ED) type. However, the remaining prefecture-level cities are still backward by comparing with the current standards. Furthermore, we observed that the regions with a high level of economic development generally have ideal urbanization quality, while the low economic level does not necessarily mean low urbanization quality, such as Chizhou, Xuancheng, Chuzhou, etc. (belong to high (UQ)–low (ED) level). A reasonable reason is that economic development itself plays a significant role in urban development, but the coupling influence of other factors, such as culture, tradition and intangible cultural heritage, would also effectively improve the comprehensive level of a city. During the period from 2010 to 2020, most cities move from the third quadrant to the second or first quadrant, indicating that the relationship between UQ and ED has been optimized and improved. It is also expected to remain in the stage of rapid urbanization in the next 10~15 years.
4.3. Analysis of Coupling Coordination Degree (CCD)
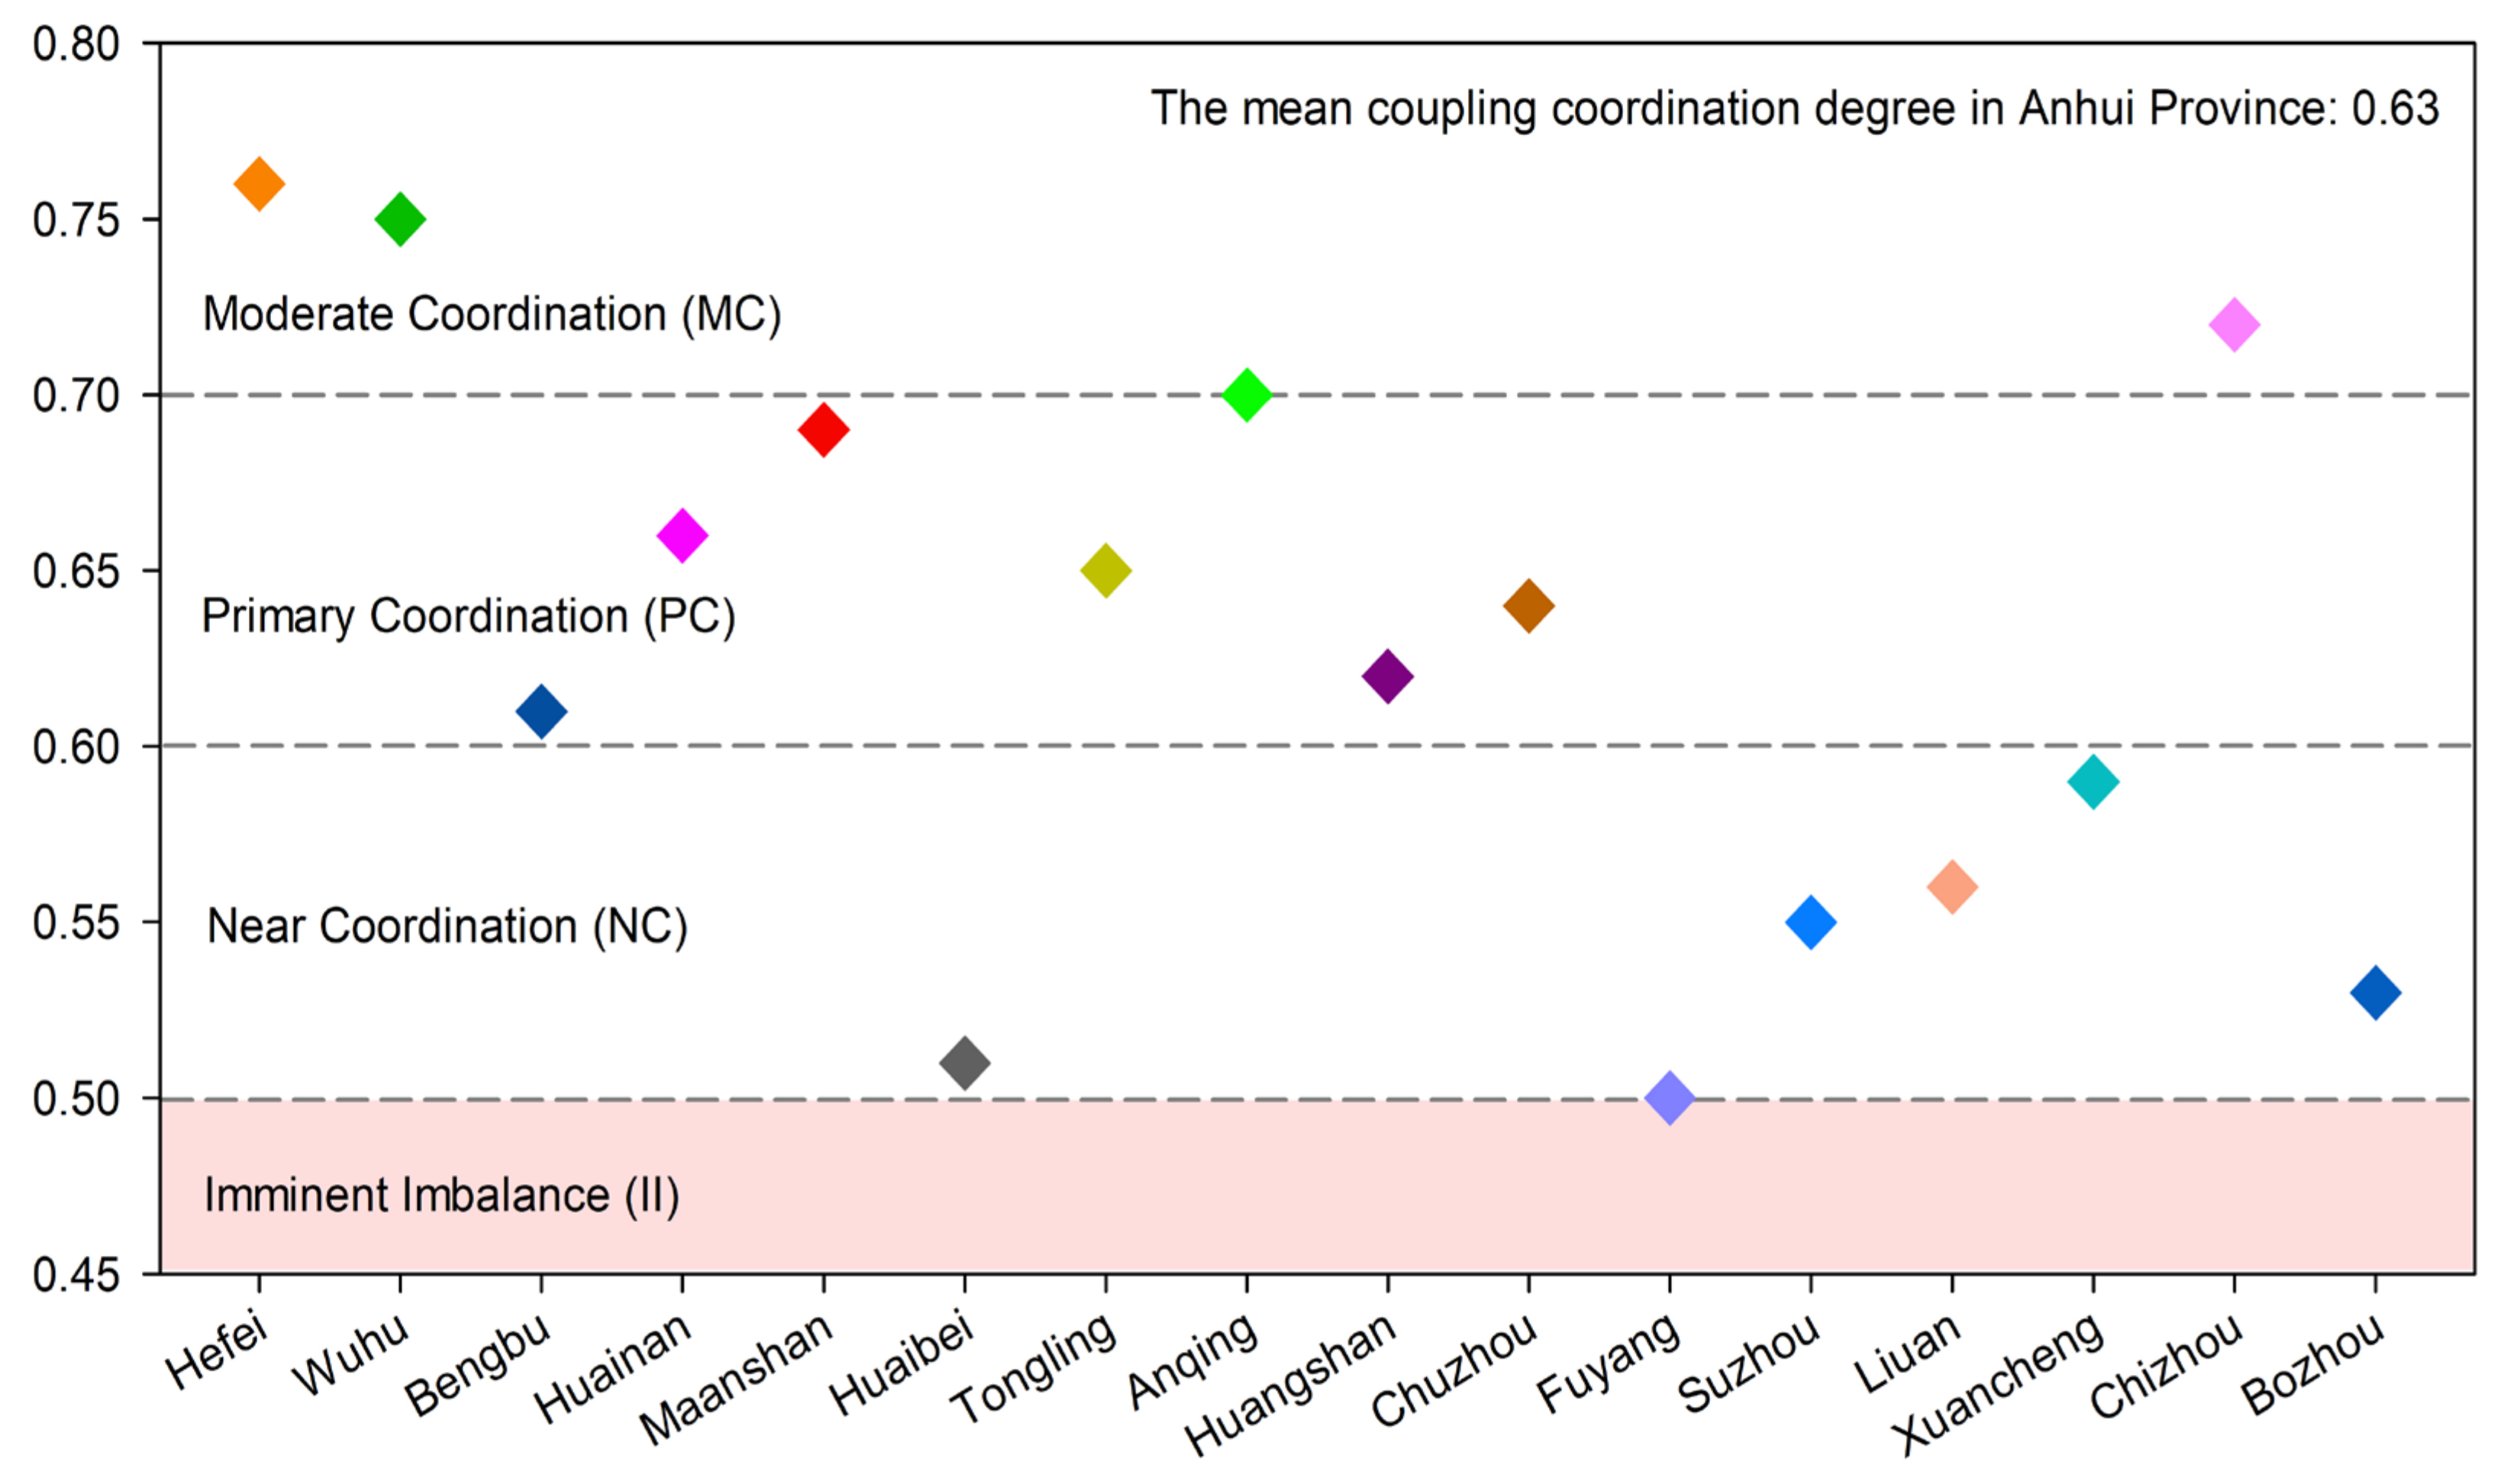
Table 6 lists the assessment values of the coupling coordination degree (CCD) for urbanization quality in 16 cities of Anhui Province. During the investigation period from 2010 to 2020, the CCD of urbanization quality in most cities experienced a fluctuated increase on a different scale, except for Tongling, Suzhou and Chizhou. For instance, Suzhou shows a trend of initial increase and then a decline, with the CCD value increasing from 0.55 in 2010 to 0.56 in 2015 but decreasing to 0.54 in 2020. It is mainly owing to the fact that the adjustment of the industrial structure was not completed in the short term, and the coordination between economic development and environmental protection is relatively low. Meanwhile, the other cities show a unidirectional upward trend regarding the CCD, indicating that most cities in Anhui Province have moved from unbalanced to coordinated development in the past ten years. Among them, the CCD of Hefei’s (0.76) urbanization quality is the highest in all cities, followed by Wuhu (0.75) and Chizhou (0.72). In the actual situation, these cities show a better coupling coordination mainly because the variation in urbanization quality among its dimensions is not significant, and they positively influence the surrounding regions through their own development. Unfortunately, Bozhou, Huaibei and Fuyang rank as the last three cities, with their CCD value being around 0.53, 0.51 and 0.50, respectively. Actually, the unbalanced development among subsystems depends on multiple factors, such as the contradiction between tourism industry and environmental protection, the non-equivalence between human concentration and urban–rural integration, etc. Meanwhile, these cities are located in the north of Anhui Province, proving that the future policy orientation needs to be adjusted appropriately. As a whole, the CCD in Anhui Province has experienced a positive growth process, increasing by 4.06% from 0.61 in 2010 to 0.64 in 2020. It revealed that the current urbanization process among ED, INF, PD, SD, EP and URI obtained a relatively good synergy and should be continually optimized in the future.
Considering the quantitative evaluation criteria of coupling coordination degree, this study adopted the results of Li et al. [
50] as a reference, dividing the CCD of urbanization quality into 10 levels (containing two types, namely imbalance and coordination), as shown in
Table 7. Based on the mean value of CCD, all cities in Anhui Province could reach the near coordination (NC) level and above (2010–2020), except for Fuyang, which once obtained lower than 0.50 before 2015. However, Fuyang’s growth rate (10.42%) ranks the first among all cities, indicating that this region has experienced the process from imminent imbalance (II) to near coordination (NC). Meanwhile, Hefei, Wuhu, Chizhou and Anqing can be classified as the moderate coordination (MC). Bengbu, Huainan, Maanshan, Tongling, Huangshan and Chuzhou belong to primary coordination (PC). And the remaining cities are at the level of near coordination (NC), as displayed in
Figure 7. As we can see, although the urbanization quality can affect the CCD value (among six dimensions) to a large extent, it is not the decisive factor. For example, high levels of urbanization may also mean subsystems’ imbalance (i.e., the mismatching between economic development and environmental protection in the early stages of rapid transformation).
4.4. Issues and Countermeasures
In recent years, with greater economic-level development and the improvement of social productivity, cities in Anhui province have made great progress and achieved remarkable results. However, there are still some issues in the urbanization process. Firstly, the spatial development at the urbanization level in Anhui Province is unbalanced, with significant grade variation and serious polarization. The urbanization quality in the southeastern region, which has a higher degree of human and industrial agglomeration, is better than that in the northwestern area. Secondly, due to the fact that the industry has developed rapidly within the period of China’s 13th Five-Year Plan (2016–2020), there is a tendency to excessively pursue economic growth. Nevertheless, a large number of industrial “three wastes” are directly discharged during this process, and the urban ecological environment is not well protected. Thirdly, the per capita GDP of most cities in Anhui Province is lower than the national average level. The economy is relatively backward and lacks material support conditions for urbanization. As the provincial capital, although Hefei is far ahead of other cities in terms of per capita GDP and urbanization quality, the phenomenon of environmental pollution is still significant.
Considering these shortcomings, improving the sustainability of cities in Anhui Province is a significant task to promote the comprehensive development in the new era. Therefore, we can make the following suggestions with the intention of providing some references for local decision-makers. As for economic development, due to the fact that Anhui Province is an important part of the Yangtze River Delta, each city should implement the principles of innovation, coordination, green living and sharing, so as to provide sufficient material guarantee for urbanization and achieve positive interactions. Moreover, the provincial government should also pay attention to the polarization of economic development and focus on the backward cities, such as Fuyang and Bozhou. Actually, expanding domestic demand and stimulating consumption are effective ways to achieve sustainable economic development. In terms of infrastructure, although most cities have improved their infrastructure level in recent years, some of them are still showing a lack of supporting strength. It is essential for decision-makers to propose phased, high-quality infrastructural plans for their specific needs and make full use of financial allocations. With regard to population development, we should accelerate the optimization and upgrading of the industrial structure to provide more jobs for the growing population. Meanwhile, it is also suggested to provide the people with more complete production, life and study support. Only in this way can we resolve the contradictions brought by the increased population. In view of social development, the government should promote the technological upgrading of traditional industries through independent innovation and transformation via scientific achievements. The relevant research proves that there is no correspondence between the social development and city size; thus, each city should avoid the unlimited expansion of its scale. Concerning the environmental aspect, the environmental pollution of the city cannot be ignored, as it directly limits the improvement of the quality of urbanization construction. In order to improve this situation, regions should adhere to the principles of applicability, economy, green living and beauty to carry out the urban design in an all-round way. Meanwhile, speeding up the construction of new types such as green cities, smart cities and cultural cities to improve the internal developing quality. Focusing on urban–rural integration, the priority is to strengthen the development of cities and towns in the province and coordinate with the surrounding areas. Anhui should make an overall plan for the quality development of urbanization. Meanwhile, to establish a regional coordinated development mechanism through various policies and measures.
5. Conclusions
Focusing on China’s 12th-to-13th Five-Year Plan (2011–2015 and 2016–2020) strategy, this study evaluated the urban sustainability of 16 cities in Anhui Province by adopting the statistical data of 2010, 2015 and 2020. Firstly, we set up an objective indicator system (including 32 indices from six dimensions, namely ED, INF, PD, SD, EP and URI) that conforms to the local development law. Additionally, a novel weighting method was proposed, which considers the interaction among various indicators and the dependency between neighboring cities. Then, the overall urbanization quality (UQ), the coupling coordinated development (CCD) level and the corresponding suggestions for 16 cities were carried out in detail. The main conclusions are as follows:
The urbanization quality in 16 cities of Anhui Province shows a significant difference and unbalanced phenomenon in which the eastern area (with a high degree of human and industrial agglomeration) is better than that in western region. Meanwhile, the sustainability of the 16 cities was not ideal, but the level of urbanization for most cities showed an increasing trend from 2010 to 2020.
Compared with different dimensions, although the URI subsystem obtains the best performance with a mean value of 0.54, it experienced a negative growth rate (approximately of −8.29%) during the investigated period. This illustrates that the population loss of small- and medium-sized cities is leading to the widening of the urban–rural gap.
The relationship between urbanization quality (UQ) and economic development (ED) in Anhui Province is mostly in the second and third quadrants, which belong to the high (UQ)–low (ED) and low (UQ)–low (ED) level type. Moreover, the quality of urbanization is basically positive correlated with the level of local economic development, especially for medium and large cities.
From 2010 to 2020, the coupling coordination degree (CCD) of urbanization quality in most cities experienced a fluctuated increase on a different scale. It is actually a better coupling coordination mainly because the variation in urbanization quality among its dimensions is not significant, and it positively influences the surrounding regions through their developing process.
From the perspective of regional sustainability, it is necessary for decision-makers to strengthen the top-level design of urbanization construction. Meanwhile, through the various policies and measures to establish a regional coordinated development mechanism, they must narrow the quality development gap of urbanization among different regions.
Although this study proposed a relatively reasonable indicator system and a new method of “interaction–change”-oriented sequential relationship analysis to assess the urban sustainability, there are still some limitations. On the one hand, the interval of time series selected in this research is small. Meanwhile, the analysis of the yearly data is insufficient, which may lead to errors in the change law between time nodes. On the other hand, the analysis of coupling coordination degree (CCD) involved in this research refers to the result of the joint action of six dimensions. Nevertheless, the specific CCD value of each subdimension in different years is not explored in detail, so it needs to be further optimized and improved. Regarding the directions for further research, the following points can be used as suggestions and references. Firstly, a targeted evaluation indicator system that changes over time could be established, which may break the traditional static evaluation method and be more flexible and effective for assessing urban sustainability. Secondly, the statistical data from wider time spans and narrower time intervals should be collected for comprehensive evaluation from a spatiotemporal perspective. Thirdly, the exploration of the geographical, economic and demographic situation surrounding the target location should be expanded, thereby elevating the sustainability dimension of the city into a dynamic interaction mechanism.
The urban sustainability is restricted by various conditions, such as history vs. reality, resources vs. environment, income vs. consumption, etc.; a healthy development mechanism needs to consider the coupling effects of all aspects comprehensively. Although this paper focuses on the urban sustainability of Anhui Province, the research method and countermeasures proposed can provide reference for other provinces of China to a certain extent.


