Article

Distinguishing between Low- and High-Cost Pro-Environmental Behavior: Empirical Evidence from Two Complementary Studies

by
Henriette Rau
1,
Susanne Nicolai
1,*,
Philipp Franikowski
2 and
Susanne Stoll-Kleemann
1
1
Chair of Sustainability Science and Applied Geography, University of Greifswald, 17489 Greifswald, Germany
2
Institute for Educational Quality Improvement, 10117 Berlin, Germany
*
Author to whom correspondence should be addressed.
Sustainability 2024, 16(5), 2206; https://doi.org/10.3390/su16052206
Submission received: 30 January 2024 / Revised: 1 March 2024 / Accepted: 4 March 2024 / Published: 6 March 2024
(This article belongs to the Special Issue Transformation to Sustainability and Behavior Change)

Abstract

:
To reach sustainability goals, researchers and policymakers must focus on addressing changes toward more pro-environmental behavior (PEB). Therefore, this study shows evidence-based perceptions of low- and high-cost behaviors and deduces recommendations for PEB interventions. We applied a multi-step mixed-method approach: First, a representative online survey was conducted to collect a general quantitative overview and classify low- and high-cost behavior based on past behavior and behavioral intentions. Second, a gamification intervention that aimed to gain quantitative data about certain behaviors and perceived low- and high-costs was conducted with university students. The results of the two studies showed that PEB can easily be categorized into high-, rather-high-, rather-low-, and low-cost behavior. However, this classification is not based on emission sectors, e.g., mobility, but on the specific behavior. Interventions can be recommended according to subjective costs: For example, low-cost behavior does not need additional interventions in most cases but must be maintained as is. According to the empirical findings, high-cost behavior needs top-down interventions, while rather-high- and rather-low-cost behavior requires bottom-up interventions to achieve behavior changes. In summary, managing interventions using this classification and focusing on high-impact behavior can lead to successful behavior changes and emission reductions.

1. Introduction

To reach the Sustainable Development Goals [1] and fulfill national Sustainable Development Strategies, e.g., the German Sustainable Development Strategy [2], climate-friendly transformations are necessary. These global common goals need to involve every emitting sector and every individual to change potentially harmful behavior into pro-environmental behavior. Pro-environmental behavior (PEB) means “[…] behavior that consciously seeks to minimize the negative impact of one’s actions on the natural and built world […]” [3] (p. 240).
Within sustainability research, emissions (mainly CO2 equivalents) are used to indicate harmful behavior. According to recent data (as of 2018), the average German citizen produces CO2 equivalents that are distributed as follows: 38% through consumption, including clothes and leisure, 22% through housing (7% electricity, 15% heating), 19% through mobility (14% surface travel, 5% air travel), 15% through food/diet, and 6% through public emissions, including waste and water management [4] (p. 60).
To decrease emissions, individual PEB needs to be fostered, while harmful activities should be reduced. Many studies [5,6,7,8] consistently described the willingness of individuals to change their behavior but with limited success in changing their actual behavior, which led to potential gaps, such as the so-called “value–action gap” [3] or the slightly different but similar “attitude–behavior gap”.
Successful interventions must be designed to overcome this value–action gap. Therefore, environmental psychologists developed and tested behavior models to explain and avoid this gap. For example, Klöckner (2013) integrated successful environmental psychological theories into a meta-theory. According to his meta-theory, intentions, habits, and perceived control are direct predictors of behavior and, therefore, should be targeted by interventions [9].
Another aspect to consider in developing and implementing interventions is the impact of a behavior change. For example, high-impact behaviors regarding sustainability are living without a car and avoiding air travel. However, changing those action patterns is still a global challenge. Furthermore, evidence shows that PEB interventions are not very successful in achieving long-term behavior change towards sustainable activities, especially for high-impact behavior [10,11,12].
Those findings could be justified using the low-cost hypothesis: Every behavior is linked with behavioral ‘costs’ in a broad sense, which an individual can perceive as being either high or low [13,14,15]. Thus, the “[…] low-cost hypothesis predicts that the strength of effects of environmental concern on environmental behavior diminishes with increasing behavioral costs” [13] (p. 441). The individual perception of those costs is the key variable to “[…] explain the variation in the correlations between attitudes and behavior” [13] (p. 443). If the perceived costs of a behavior are high, e.g., intolerably prolonged travel time or reduction of comfort, the behavior will not change. However, low-cost behaviors, such as one-time investments (e.g., resetting the default of a thermostat), as well as simple everyday tasks, such as switching off lights when leaving a room, are more easily implemented and maintained than high-cost behaviors are but mainly have only a small impact on emissions [16].
Diekmann and Preisendörfer [13] classified behaviors related to recycling and consumerism as low-cost behaviors, while behaviors related to mobility were considered high-cost behaviors based on their plausibility and survey data. However, a definition of low- and high-cost behaviors for guiding interventions is missing.
For researchers and policymakers, it is useful to know which behavior they can address more easily and which behavior needs more effort to be changed. This contribution attempts to close this research gap by showing evidence-based perceptions of low- and high-cost behaviors using statistical analyses, visual management tools, and qualitative data in order to deduce recommendations for interventions.

2. Materials and Methods

To gain insights into low- and high-cost behavior, a multi-step mixed-method approach was used: First, a representative online survey was conducted to provide a general quantitative overview of specific behaviors. To obtain the first classification of low- and high-cost behavior, we combined past behavior and behavioral intentions. Second, a gamification intervention was conducted with university students to gain quantitative data about why certain behaviors were shown, tried out, or not even considered worth trying. The overall aim of the gamification intervention was to raise awareness, promote pro-environmental behavior, and deduce evidence-based low- and high-cost behavior using a ‘sustainability challenge’ [17].
In both studies, data were collected without person-identifying data and aggregated as soon as possible.

2.1. Survey Design, Procedure, and Sample

The survey sub-dataset was from a representative online survey that was conducted in Germany and in the German language in July 2020 [18]. The survey included questions on socio-demographics, aspects of morals, emotions, and justice, and past behavior and intentions to show certain pro-environmental behaviors in the future.
For the current research question, only answers regarding past and intended pro-environmental behavior were analyzed. Specifically, this involved questions aiming at behavior shown in 2019 (past behavior) and willingness to show a specific behavior in 2021 (intended behavior). Ten items each (past and intended behavior) covered different forms of high-carbon behavior, such as taking a plane, eating a vegetarian diet, or using heating (see Appendix A). An example of one of these items is “In 2019, I traveled by airplane” (past behavior) and “In 2021, I will (continue to) travel by airplane” (intended behavior). Participants could answer questions on past behavior by using defined categories only: “no”, “yes”, and “I don’t know”. Items regarding intended behavior were answered on a 6-point Likert scale ranging from “I don’t agree at all” to “I totally agree”. Ten sustainable behaviors were used to portray the aforementioned emission sectors of the distribution of individual CO2 equivalents: buying food regionally, waste reduction, and choosing products due to their longevity (consumption); turning off electronic devices instead of using standby mode, choosing low washing temperatures for clothes, keeping the temperature in rooms below 20 °C, and using green electricity (housing); having a vegetarian diet, (diet); not flying and taking a bike instead of a car for short distances (mobility). For the analyses, we accounted for socio-demographic variables. For this purpose, χ2 tests and an ANOVA were conducted.
The survey was answered by 220 German participants who were recruited via the platform meinungsplatz.de. Participants received compensation for their expenses according to the panel service’s policy.
As exclusion criteria, we checked for the relative speed index (RSI; [19]) and the social desirability score according to Satow (2012) [20]. The RSI was computed by dividing the median page completion time of the whole sample by the page completion time of the respective individual. A relative speed index of 2 indicated that an individual was twice as fast as the median of the total respondents. Following the recommendation of Leiner (2019), we removed 34 panelists with RSI > 2 as we assumed that they did not work conscientiously. Additionally, we excluded 12 participants who showed an increased social desirability score (7 or higher) on the social desirability scale [20]. Consequently, the final sample comprised 174 participants for this study, with 91 women and 83 men (age: M = 49.9, SD = 17.5, range = 16–80 years).

2.2. Design, Procedure, and Samples of the Gamification Intervention

After reviewing the literature to assess the success factors of interventions [21], a “sustainability challenge” was developed using different behavior change methods while focusing on possible high-impact action patterns (e.g., reducing household energy consumption and emissions related to food). This gamification intervention combined weekly challenges to take on a certain PEB task while making a commitment and reflecting on the results in peer groups to enable social influence [21,22,23].
The baseline assessment for the gamification intervention was a 6 × 6 matrix with a total of 36 selected (sustainable) activities. Each participant was asked to reflect and color-code which of these activities they (a) already performed regularly (color: green), (b) would try out or practice (color: yellow), or (c) did not perform regularly and did not want to try out (color: red), as well as why. The color coding provided direct visual feedback on the baseline status of the 36 selected activities covering all areas of the intervention. In the case of the ‘sustainability challenge’, these were sustainable activities related to the emission sectors of consumption (n = 8), energy (n = 14), mobility (n = 1), and food/diet (n = 10).
For the gamification intervention, another aspect was added: pro-environmental activities (n = 3). These are active measures taken to improve the environment, e.g., by cleaning up litter in nature or making donations to sustainable projects.
The intervention was conducted as part of a one-semester university seminar. Participants were asked to choose an activity from three suggestions or the yellow-coded activities of their baseline assessment. Having a pool of suggested activities allowed the participants to choose tasks that suited them. In this way, participants were able to choose a commitment that was realistically achievable for them and not too ambitious to facilitate a short-term sense of achievement. The self-committed activity needed to be observed and, if possible, carried out over a period of at least one week, e.g., until the next lecture.
All self-reported outcomes used a defined 4-digit scale—(1) “I do not wish to engage in this behavior”, (2) “I was willing to change this behavior but did not maintain it after this try-out”, (3) “I was willing to change this behavior and maintained it”, and (4) “I already show this behavior”.
Smaller peer-evaluation sessions during the seminar and a final feedback workshop with participants allowed for more specific insights into the drivers and barriers of PEB.
The intervention was carried out during the winter and summer semesters of 2020/2021 with three courses and a total of N = 58 students (two groups with n = 19 and one group with n = 20 students). Each semester had a duration of six months (summer semester: April–September, winter semester: October–March). The gender ratio was not fairly distributed among the intervention groups, with a total of 34 females and 24 males.

3. Results

3.1. Representative Survey

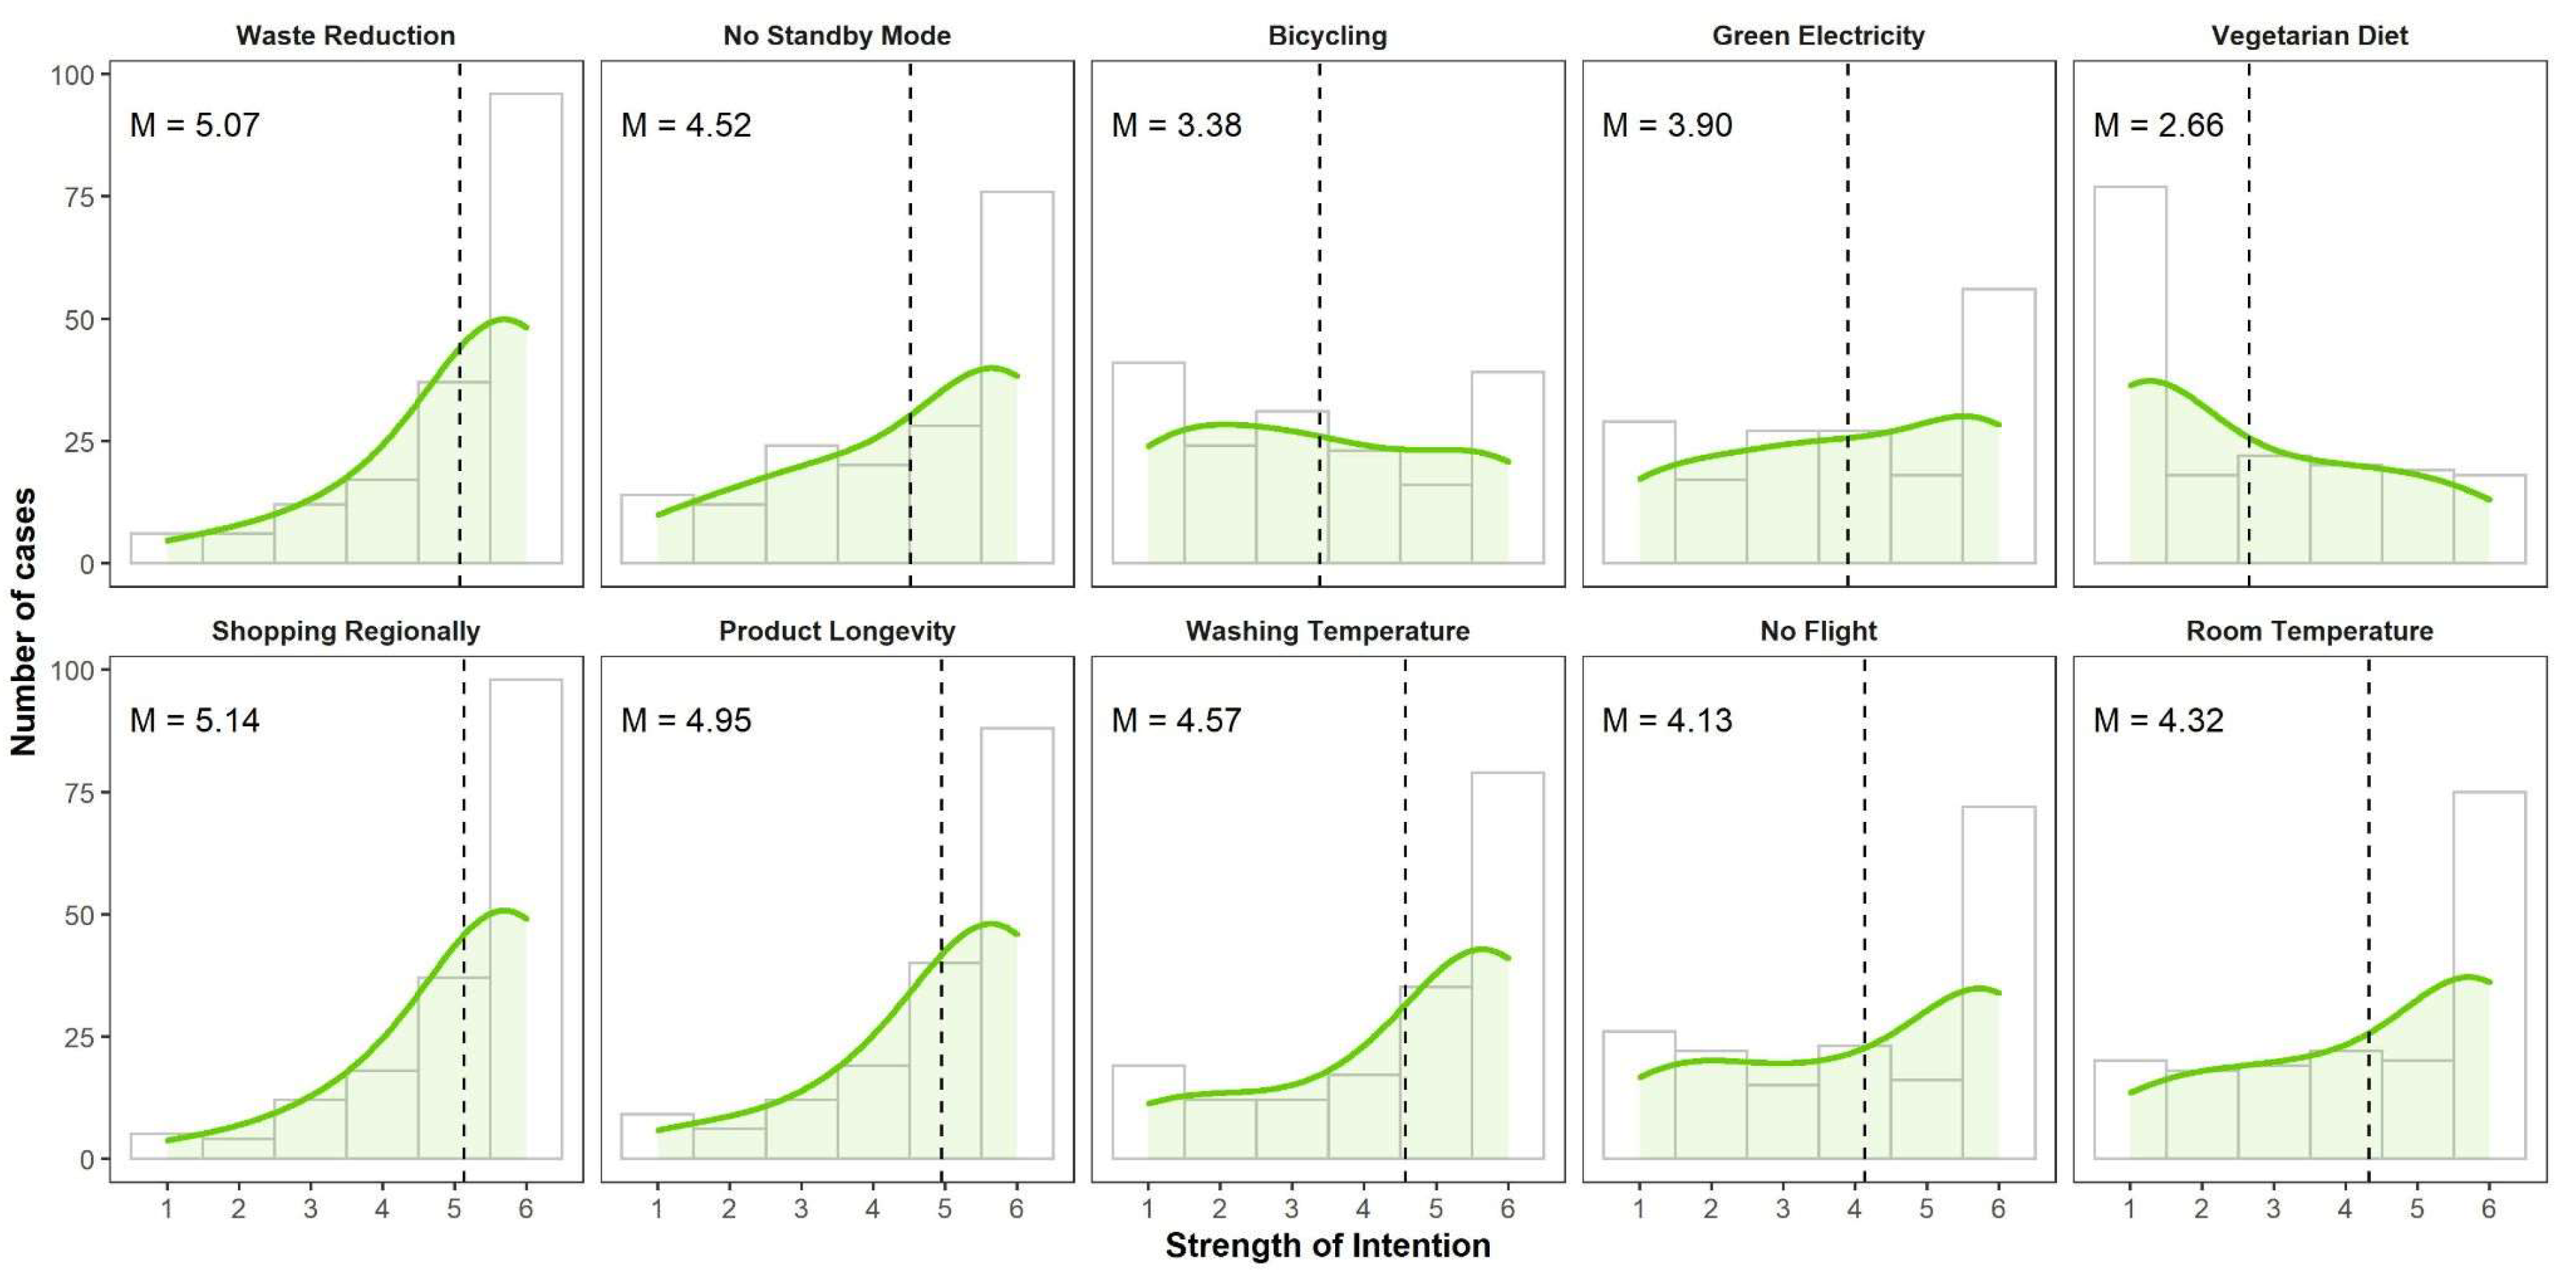
Based on past and intended behavior, typical behavioral ‘costs’ can be deduced. Practically, high-cost behavior is behavior that shows high elasticity in response to changes, e.g., increased knowledge and awareness of climate change. Consequently, the respective PEB was only shown or intended to be implemented by a few participants, whereas low-cost behavior should have been performed or intended by many participants. Preliminary findings about the distributions of past PEB (Figure 1) and intentions to engage in PEB (Figure 2) as suggested by the survey data are highlighted in Figure 1 and Figure 2.
The representative survey data suggested that the least likely behavior was a vegetarian diet. Only 12.6% (N = 22) of the participants ate a vegetarian diet. Buying products due to their longevity (72.9%, N = 127), having a room temperature beneath 20 °C (71.3%, N = 124), and washing at less than 60 °C (73.6%, N = 128) were the most popular behaviors.
The answers about the participants’ intentions to engage in PEB varied slightly. Most participants intended to reduce waste (55.2% strongly agreed to do so, N = 96), buy regional food (56.3%, N = 98), and buy products due to their longevity (50.6%, N = 88). By far the most unpopular behavior was, again, to eat a vegetarian diet. Only 10.3% (N = 18) of the participants were willing to give up meat consumption.
As there was no ‘natural gap’ in the continuum of the popularity of high-carbon behavior, a threshold between high- and low-cost behavior had to be defined. To implement criteria for this threshold, responses about both past and intended behavior were merged. Figure 3 shows how the mean values were used to create four quadrants.
This matrix could be used to deduce recommendations for intervention planning. PEBs with low values for past and intended behavior (see quadrant III) could be considered ‘high cost’ with little expectable success of behavior change interventions aimed at individuals or at least requiring greater effort to make interventions concerning such behaviors successful. PEBs with high values for past and intended behavior (quadrant I) could be easily targeted by interventions for individuals to lead to behavior changes. Quadrant IV highlighted PEBs with high values for past behavior but low values for intended behavior. This could be an indication that these behaviors were tried in the past but not maintained. The only PEB that fell into this quadrant was ‘no flying’. Here, qualitative analyses would be profitable.
Quadrant II included PEBs that were intended to be adopted by many people but had not been conducted in the past. Two reasons can be postulated here: On the one hand, there could be a trend that motivated people to commit to a behavior in the future—for example, the growing sensibility regarding avoiding plastic, which was not there in the past. On the other hand, this could be a behavior that was intended, but there were barriers that were present. Such a barrier could be simply forgetting a plan or opting for an easier alternative. Only one behavior fell into this quadrant: turning off electronic devices instead of using standby mode. One may assume that this is a low-cost behavior, which explains the high intention to engage. However, there must be a barrier, e.g., convenience. Qualitative research could find the answer here.
As a further step, we looked at differences in subgroups, for which we had no hypotheses. Thus, all of the following analyses were explorative.
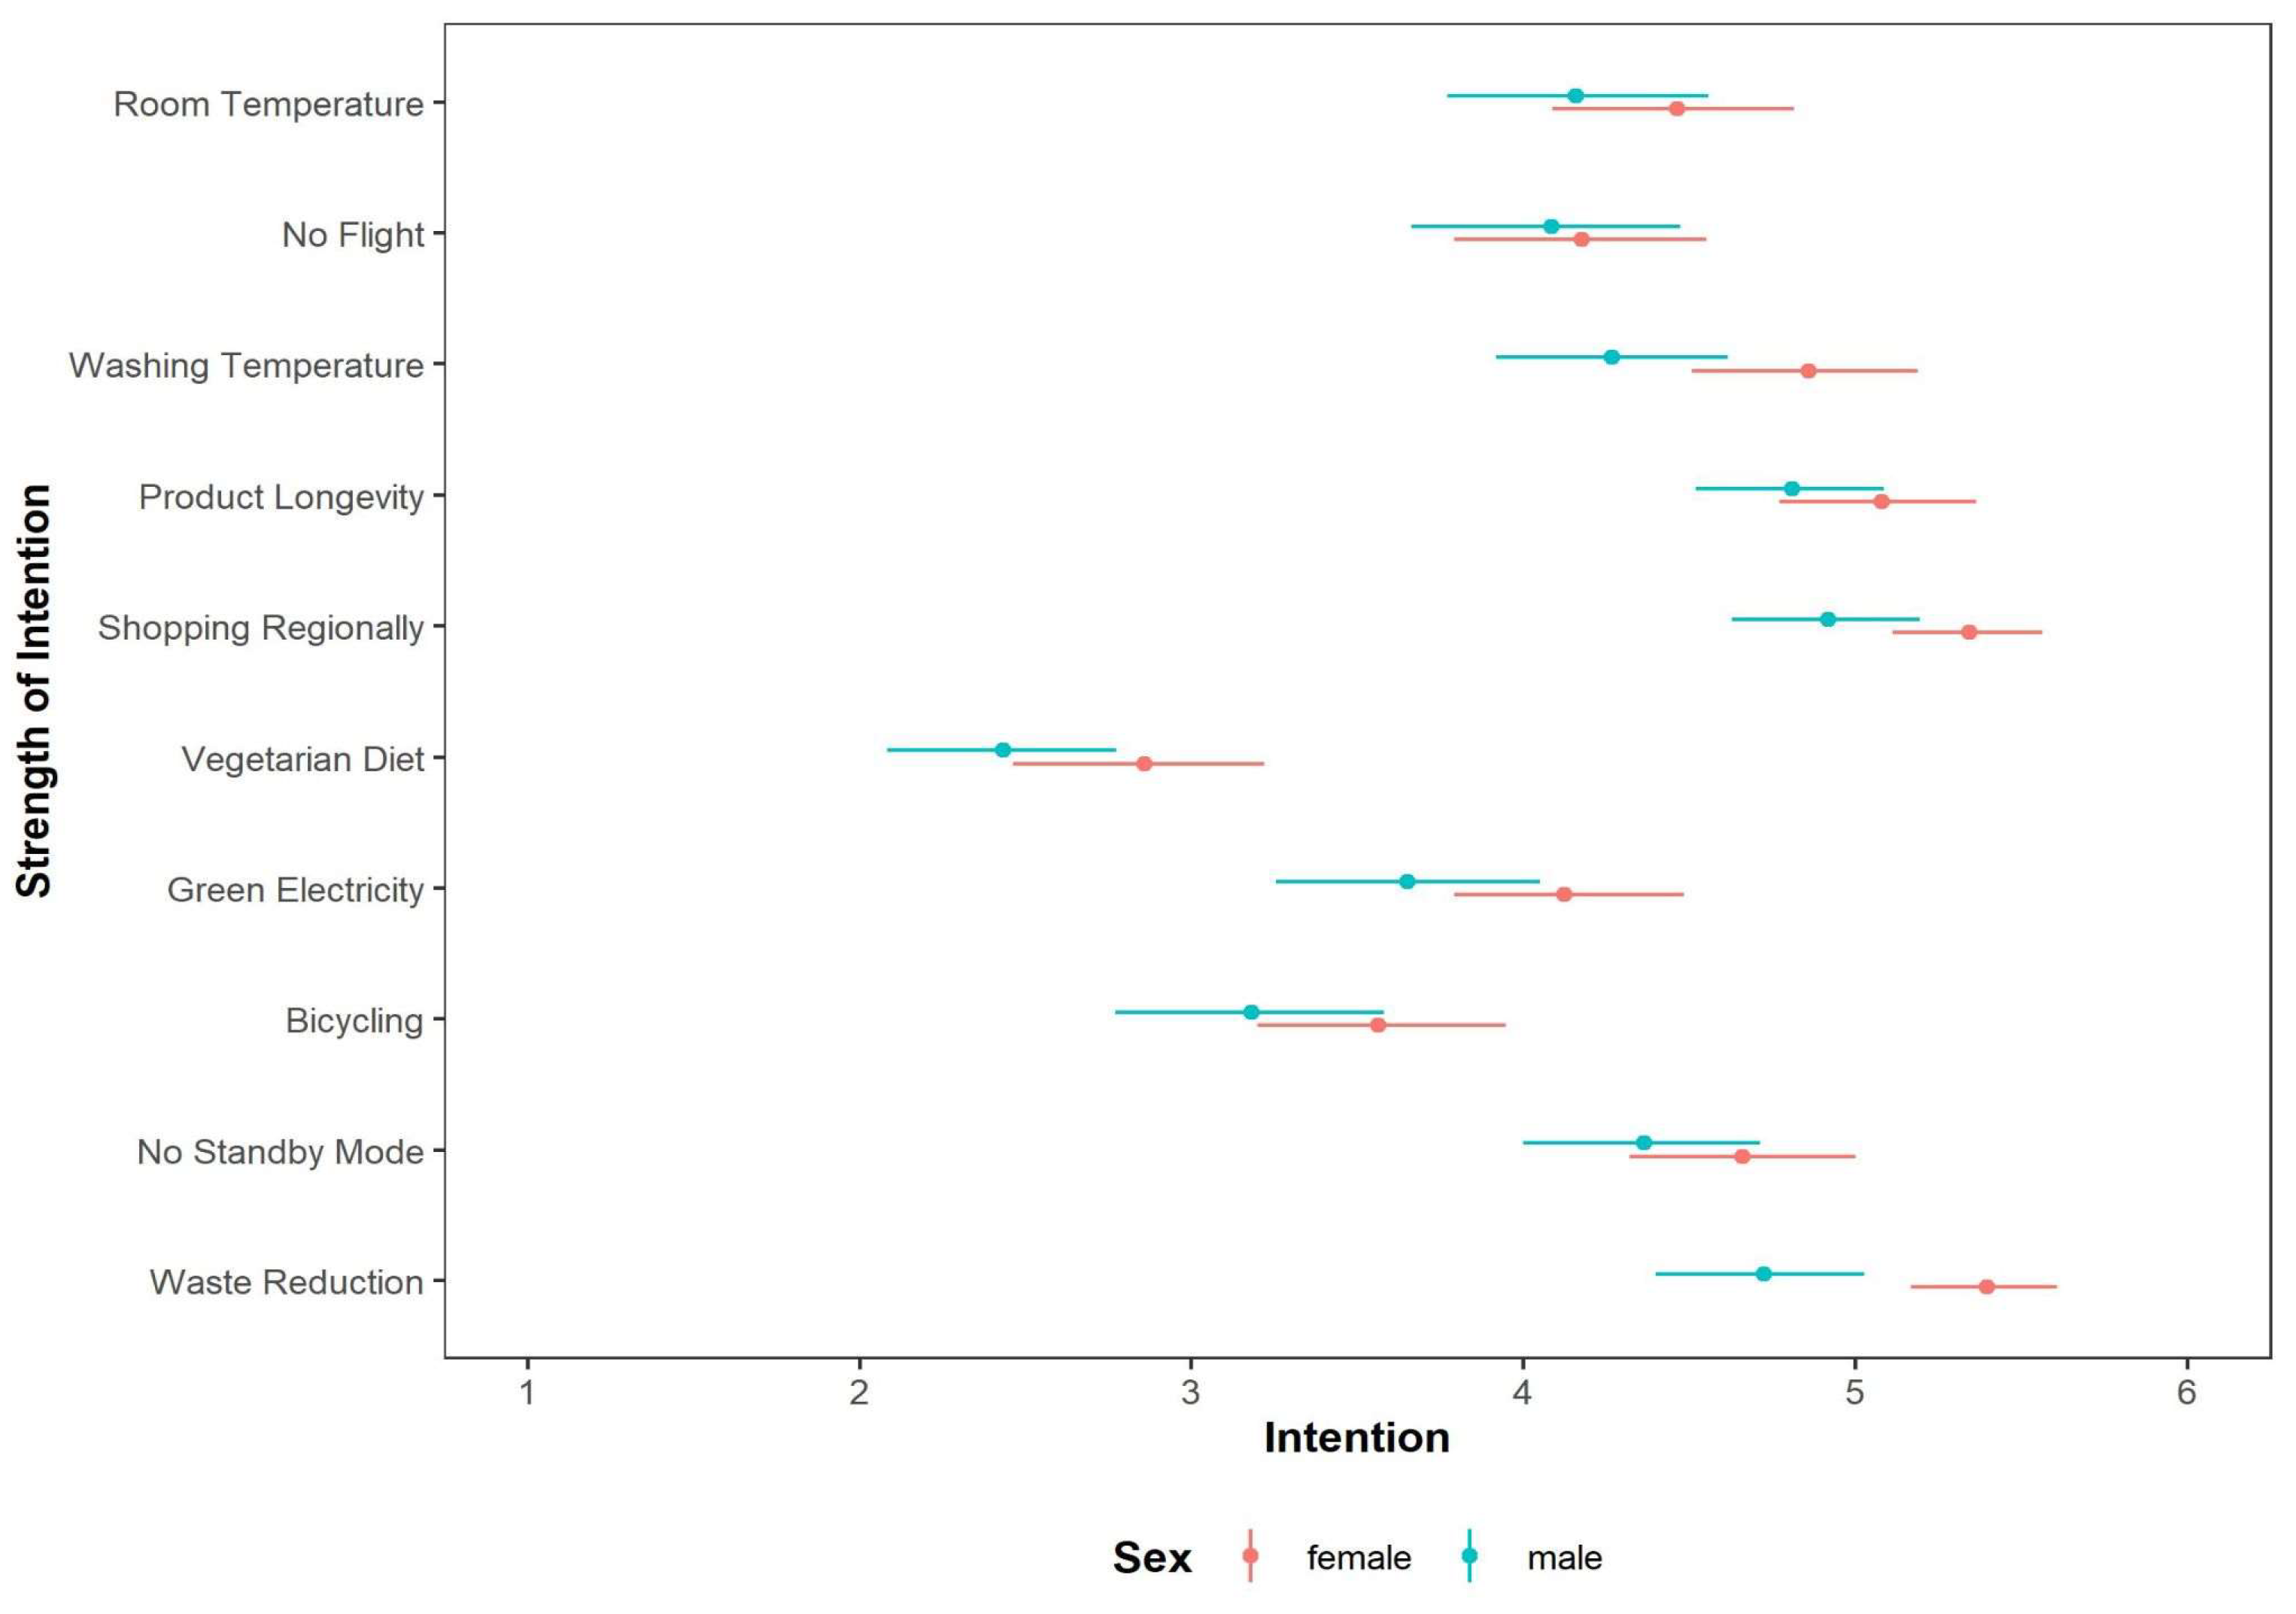
We found significant differences in sex in the willingness to reduce waste (Mfemale = 5.40, Mmale = 4.72, t(150.7) = 3.37, p = 0.001), to wash laundry beneath 60 °C regularly (Mfemale = 4.86, Mmale = 4.27, t(170.4) = 2.27, p = 0.025), and to buy food regionally (Mfemale = 5.34, Mmale = 4.92, t(160.3) = 2.22, p = 0.028). The sex differences can also be seen in Figure 4. In general, women were more willing to behave pro-environmentally than men were; t(163.3) = 3.17, p = 0.002 (Mfemale = 4.45, Mmale = 4.06).
For past behavior, we found sex differences only for waste reduction (χ2(1) = 6.30, p = 0.013). Therefore, sex differences mostly occurred in intended behavior, not actual behavior.
In part, it may be useful to specifically target certain groups to seek behavior changes among them, as they appear more willing to implement such behavior changes. More effort seems to be needed to convince people who do not yet show intentions toward behavior changes.

3.2. Gamification Intervention

During the baseline assessment, the majority of the participants stated that climate change exists and that action should be taken. None of the participants rejected scientific facts.
Using the four-point scoring system ((1) “I do not wish to engage in this behavior”, (2) “I was willing to change this behavior but did not maintain it after this try-out”, (3) “I was willing to change this behavior and maintained it”, and (4) “I already show this behavior”), all activities, including the baseline assessments, were analyzed. The group averages for sustainable behavior were similar for two groups (2.79 and 2.71), while one group seemed to be more environmentally friendly with an average score of 3.15.
Based on the ‘low-cost hypothesis’ described by Diekmann and Preisendörfer [13], the gamification intervention included both low- and high-cost activities. Consequently, the activities of the challenge were ranked according to their cost intensity. It could be assumed that the aggregated frequency of an intended and shown behavior indicated its cost intensity, which led to a ratio of high- and low-cost activities of 1:6. Most participants were willing to at least try the suggested activities, except for five of them.
In more detail, all three pro-environmental activities (donating, building an insect hotel, and cleaning up litter in nature) showed the lowest rates of intended and shown behavior (average scores ranging from 1.66 to 1.91). Only the activity “using streaming services for a maximum of 8 h per week” (energy) received a lower average rate of 1.57. Interestingly, the activity “changing to ‘green’ electricity tariffs” (energy) only received the scores of 4 (“I already show this behavior”) or 1 (“I do not wish to engage in this behavior”), leading to an average score of 2.09, with most participants not wishing to change their tariffs. Consequently, these PEBs could be considered ‘high-cost’ behaviors.
Almost every participant regularly engaged in the following seven activities (average scores: 3.62–3.84), indicating that those PEBs were perceived as ‘low-cost’ behaviors: using cloth bags (consumption), utilizing leftover food (food/diet), saving food after its expiration date by using one’s senses (food/diet), using clotheslines instead of electronic dryers (energy), turning off lights when leaving a room (energy), running dishwashers and washing machines only when fully loaded (energy), and combining errands with walks/biking instead of using a car (mobility).

3.2.1. Consumption

Participants stated that their reasons for showing certain consumption behaviors were motivated by convenience, saving money, or being raised in that way. Additionally, when it came to shopping, reducing (plastic) trash was a major motivator—e.g., using only solid soaps instead of liquid ones in plastic packages or using cloth bags/rucksacks instead of plastic bags. However, when asked to change body care products to ones without plastic, most participants’ main reason for not changing was that “it didn’t feel good” or that “it’s more convenient to use my standard products”. Not all products had convincing alternatives according to the participants. Therefore, emotions, routines, and tactile perceptions were leading arguments for the purchase of body care products.
One group was specifically asked what their main incentive/reason for consumption was. A scale ranging from “comfort shopping” to releasing negative emotions via “I need this item” to “I want to reward myself” was used to answer this question. A total of 15% stated that they mostly consumed when frustrated, and 10% used shopping to reward themselves. The remaining 75% mostly needed a specific item with a tendency toward the ‘reward’ side.
In this intervention, reuse of items was a major topic. The participants were active in selling items (electronics, appliances, or clothing) that they no longer used on the Internet. Additionally, they mostly bought used or refurbed electronics due to financial limitations.

3.2.2. Housing (Energy/Heating)

Participants were asked to change their lighting to LED, and 60.35% of the participants declared that their household was completely or at least partially equipped with energy-saving bulbs (LED).
Furthermore, the frequency of the activities showed that switching off lights was a less demanding activity than the non-recurring change to a ‘green’ electricity tariff. When asked about this discrepancy, the participants replied that it was a financial issue because ‘green’ electricity tariffs were mostly more expensive. Additionally, some stated that their accommodation (e.g., a flatshare, student housing, or living with their parents) did not give them the opportunity to decide about or change their electricity tariff. Interestingly, some participants stated that the intervention made them more aware of energy-saving measures (e.g., “I occasionally caught myself forgetting to switch off the light” or “Although I was taught to boil water with a lid or to use the kettle, I always forgot to do this when cooking. This task has made me more aware of this and I really pay more attention to it.”).
Since most students did not have an electronic dryer, almost all of the participants stated that they always used clotheslines because they did not own a dryer, never did, and/or dried clothes using clotheslines only since they were a child. Only one participant explained that “clothes have a significantly better and more pleasant quality when [using] the electronic dryer” when referring to their own preferences.
The task of reducing their consumption of streaming services to no more than 8 h per week was declined by 74.13% of the participants. Only 8% stated that they were already within this limit because they were mostly outdoors. The reasons for declining the task right away were personal comfort (e.g., “I need my music or movies to switch off”, “I personally don’t want to limit myself here”, or “it’s an important part of my life and an outlet that I don’t want to miss out on”), mental health reasons (e.g., “As I live alone, it’s good for me and my mind”, “[I need] access to streaming services so that I don’t feel lonely”, or “music puts me in a good mood”), and educational reasons (e.g., “I listen to radio via Internet. Local radio stations are not an alternative because these stations don’t help me learn a language.”).
To reduce television consumption and save energy in this way, the gamification intervention challenged participants to “Have a game night or read books instead of watching TV”. This social task was easily implemented by most participants, with a few establishing regular game nights and stating that “game nights are much more fun in a group than if you just watch TV together”, “social skills are strengthened through such joint activities”, and “I told my friends about [this challenge] and we’ve been meeting up every other evening for about three weeks now to play cards and board games”. Some participants rediscovered reading when performing this task and were looking forward to all of their unread books. However, personal habits and convenience were still a barrier for some participants (e.g., “I would not allow myself to be restricted in my free time as to which activity I would like to do.”).
When it came to not using standby mode, only three participants’ feedback showed that convenience and habits influenced the implementation of this (e.g., “[the appliance] is the only clock in that room” or “[this device] has a timer and fulfills a task automatically, e.g., making coffee, cleaning processes—a convenience I don’t want to miss.”).

3.2.3. Mobility

When asked to combine errands with walks/bike rides instead of using a car, more than half of the participants stated that they did not own a car and, thus, this task was no problem. However, participants also defined mobility as mostly an infrastructural problem—for example, “short distances in a small town allow for shopping by bike. In a big city the next supermarket is too far away, so I use my car a lot”.
During the final feedback workshop, the participants expanded the mobility activity—mainly pertaining to private car use—to flying: “I find it important to travel longer distances by train instead of by car or plane” and “never fly on vacation, explore the local area, take day trips and enjoy the options in Europe”.

3.2.4. Food/Diet

According to the final feedback workshops, a huge number of participants in the groups stated that they had already adopted a vegetarian diet or were willing to change their diet and eat less meat. Interestingly, two participants stated that due to training/sportive activities and/or health issues, a specific diet was already established that did not allow any changes at all, e.g., reduced meat consumption.
Food-related activities showed the most responses for “I learned this behavior as a child”, with frequently asked questions such as “it’s normal behavior for me, is it not for others?”.
One task was to have two meat-free days per week, while another was to reduce dairy consumption. Most participants without a vegan/vegetarian diet used this opportunity to “try out alternative products”. It also helped in reviewing everyday habits: “It made me think more intensively about how many dishes, even those that are quick to prepare, contain meat and that these are easy to replace or can be dispensed with”. However, some participants stated that they could not purchase alternative products due to financial limitations or that they disliked the taste of alternatives and had to try out a few products to replace their normal ones, e.g., dairy products. In living situations where participants were not living alone, “convincing housemates of the benefits of substitute products wasn’t successful”, and, thus, they did not change their dietary habits in the long term. Additionally, the participants debated about whether alternative products with high energy demands during production and long transportation routes were sustainable.

3.2.5. Pro-Environmental Activities

Feedback revealed that, regarding pro-environmental activities, it was more convenient and time-efficient to refuse such tasks.
For example, only a few participants stated that they already cleaned up litter at least once. Interestingly, before the intervention, cleaning up litter was only conducted as part of a job or an activity with kids to raise their awareness of litter. Ten participants tried it out during the intervention and described it as a mostly fun activity when done with friends or family. They even received thanks from passers-by and perceived it as rewarding and “doing something good while being outdoors”. Two participants reported that they received “strange looks” and more attention from passers-by, and they felt uncomfortable while collecting trash. Most participants stated that they did not have time for such an activity, even when they had pledged to do it during the last lecture. Moreover, some named fears (e.g., “it feels like you are being watched by all passers-by and are constantly wondering what they think about you”) and discomfort (e.g., “I would be very uncomfortable if someone were to watch me collecting garbage”), as well as responsibility (e.g., “the polluter should clean up their mess, not me”) as reasons not to engage in this activity.
Three participants donated money to animal/tree projects or sponsorships, with only one donating because of the gamification intervention. The main reason for not donating money was that students did not have the financial means and/or were not willing to spend money like this (e.g., “I like to spend my meager income on my personal things”). Additionally, some participants were reluctant to donate money since they did not trust that donations were always used for the intended purpose.
When asked to build an insect hotel, most participants refused, stating that their living conditions did not allow for the placement of an insect hotel (e.g., student housing, high floors in apartment houses) or that they did not have the tools or skills to build something like that. Additionally, aversion to insects (e.g., “I respect small creatures, but I don’t want to […] deal with them in my everyday life in general” or “I have an aversion to insects, I don’t want to deal with this”) was also given as a reason.

3.2.6. Additional Aspects from Feedback

During the feedback workshop, the participants of one group were asked whether a competition-based challenge would have been more motivating. All participants agreed that a competition-based challenge including prizes would not increase their motivation. On the contrary, since self-reported outcomes are hardly verifiable, it would add a level of unfairness and demotivate real behavior changes.
Furthermore, participants stated that the intervention suggested many activities and made them try out a few. One participant explained that “small changes in habits can lead to acquaintances becoming aware of them and adopting them. In my eyes, that’s the success: small changes in our everyday lives to protect the environment”. Additionally, it enhanced self-efficacy by showing participants that they already showed PEBs: “With the help of the tasks I gradually expanded my own PEB” and “I realized that I already do many sustainable activities, but the challenge made me realize that I can do even more”. Participants found the intervention stimulating because it offered different tasks as a challenge every week, and they were motivated to change towards more PEBs: “I will try to incorporate even more activities into my daily life”.
Surprisingly, reflecting on one’s own behavior also helped participants change their perspectives regarding perceived normality: “Most of the boxes I have colored green were taught to me as a child. […] The thought that such activities are not common for everyone did not occur to me until then. At the same time, it made me proud that I had already been taught as a child how to use food and other resources consciously”.
When asked why participants changed their behavior, the main answer was “all these things were easy and simple to integrate into my everyday life”.

3.3. Cross-Design Synthesis

Remembering the four quadrants of intended and shown behavior (see Figure 3), based on a management tool for visualizing a portfolio [24], picturing PEBs in the quadrants showed the cost of a behavior. It also enables researchers and policymakers to identify the possible need for an intervention and to deduce its type (see Table 1).
For Germany, by combining the representative quantitative survey with the qualitative gamification intervention described in this work, the following empirical evidence regarding high- and low-cost PEBs was derived. Please note that due to the biases introduced by the sampling methods used, these findings are preliminary and limited (for a discussion of the limitations, please see the Section 4).
Both aggregated results showed high means regarding intentions and past behavior related to reducing waste, shopping consciously (regional, seasonal, considering product longevity), reducing room/washing temperature, and only using washing machines/dishwashers when fully loaded. These behaviors need to be maintained as ‘normal’ in society but did not need an additional intervention (quadrant I). In quadrant II, the intentions were high, but the actual behavior was lacking. This calls for bottom-up interventions to make PEBs more convenient or to establish habits.
In particular, quadrants III and IV seemed to be most promising for intervention planning, since the PEBs that were mentioned were high-impact ones. However, since both quadrants showed low intentions, top-down interventions are needed to overcome this intentional gap. For quadrant IV, top-down interventions should be combined with bottom-up interventions, since the participants already showed the behaviors to a certain degree but did not maintain them.
Not mentioned in Table 1 are pro-environmental activities. Since such activities are based on taking voluntary action, only bottom-up social means should be used to introduce such activities to citizens. Although these would belong to quadrant III (low intentions and low past behavior) according to the classification in Table 1, they should not be enforced with top-down interventions. Therefore, such activities remain as honorable mentions and will not be included in the classification.
As shown by the empirical evidence, the categories of low- and high-cost PEBs should not be based on the emission sector (e.g., mobility or consumption) but on the specific PEB. For example, most energy-saving measures are categorized as low-cost PEBs, but changing to a ‘green’ electricity tariff is perceived as a high-cost PEB. As shown in Table 1, the ‘energy’ emission sector was part of three different quadrants and, thus, categories of PEB costs.

4. Discussion

The costs of a particular behavior are perceived differently by individuals. Sometimes, they conflict with the objectively measurable costs of that behavior and, thus, with rational choice theory. For example, using a car for short trips and shopping objectively imposes a higher cost than using a bicycle due to gasoline consumption. However, the convenience of a car is perceived as more beneficial than financial savings. In this study, we wanted to find out which behaviors had high perceived costs for people. Since a clear, sharp separation was not statistically possible, we used a combination of behavior and intentions to obtain the first classification. The differentiation between recycling/shopping on the one hand and energy/mobility on the other as a categorization for high- and low-cost behaviors according to Diekmann and Preisendörfer was rough [13]. This study’s data showed that a finer approach is needed to categorize the perceived cost of a behavior. Combining intended and shown behavior and the possible combinations that are visualizable in a 2 × 2 matrix enables completely new insights into perceived costs and possibilities for interventions. Therefore, this tool and classification can guide the planning, implementation, and management of interventions on the bottom-up and top-down levels. Additionally, when another dimension, “impact on greenhouse gas emissions”, is added, this can also help researchers and policymakers prioritize projects and interventions to successfully promote high-impact behavior change interventions.
Analyzing the results using visual management tools such as a 2 × 2 table facilitated the discovery of possible barriers and agents of change. For example, in quadrant II, the intention was increased, but the actual behavior was low. This could be based on barriers to the implementation of actual behavior changes, e.g., missing skills, opportunities, or financial means.
In the case of green electricity, it was most likely that budgetary constraints were the main reason for the lower implementation rates. Green electricity is often more expensive than conventional electricity. This is in line with the feedback from the intervention’s participants. To change behavior in this respect, policymakers and energy suppliers should make the sustainable option the default. Wynes et al. (2018) showed the positive effect of such an approach with the possibility of opting out [25].
Also, experiencing problems and lacking infrastructure—for example, insufficient cycle paths and stands in (German) cities or countryside areas—can reduce the intentions and actual behavior related to sustainable activities, such as using bicycles for short distances. The PEBs in quadrant III can most likely only be achieved using political or infrastructural measures.
The clearest finding from the survey data was that vegetarianism must be associated with very high costs, since this behavior is very rarely undertaken and, at the same time, is intended by very few people. This is in concordance with literature since dietary behavior is highly influenced by emotions, customs, traditions, and social factors [26,27,28].
However, reducing meat and dairy consumption is of particular interest, and there have been many interventions that have attempted to change this behavior [25,27,29,30]. Considering the high emissions of greenhouse gases [30], this seems appropriate in this case. Interestingly, among university students and, thus, the participants in the gamification intervention, there are already many vegetarians.
It must be noted that in contrast to the original management tool used to visualize portfolios [24], the quadrants related to sustainable behavior were not used to identify possibilities to liquidate interventions. On the contrary, the literature has shown that “[…] every intervention is better than none” [21] (p. 21). Therefore, all quadrants and their activities are worth investing in with corresponding interventions. However, this 2 × 2 matrix—as intended for its original use case—is useful in transparently presenting behavioral costs, reducing their complexity, and, thus, making derivations of activities and strategies based on evidence possible.
Remarkably, when behaviors are picked up during childhood, they are perceived as ‘normal’ and, thus, low-cost. One participant stated, “I was surprised that many of those activities are already integrated into my everyday life and are normal to me”. This is in line with the literature showing that social and cultural factors, as well as existing routines, can highly influence PEBs [31]. Such influences can be used by interventions to produce positive emotions: “The thought that such activities are not common for everyone did not occur to me until then. At the same time, it made me proud that I had already been taught as a child how to use food and other resources consciously”.
However, inconvenience, impracticality, and personal preferences/habits were the most commonly mentioned barriers in the intervention groups, which was in line with the literature [32,33,34,35]. Therefore, behavior changes were only successful for PEBs that “were simple to integrate into my everyday life”.
Regarding the methodology, most biases in surveys are due to non-probability sampling, answers corresponding to social desirability, or answers given without reading the questions. Countermeasures to reduce such biases were taken, e.g., with the survey being representative and excluding participants with increased social desirability scores [20] and those who completed the survey too quickly [19].
Surveying in 2020 about behaviors exhibited in 2019 minimized the risk of biases, such as recall error, because the time frame used was very limited and was as recent as possible. Assessing readiness to change one’s behavior with questions about the nearest possible future—in this case, the year 2021—also reduced the risk of overconfidence because the gap between current and future conditions was minimal. However, the sampling method of compensating participants and using the Internet to conduct the survey introduced a selection bias, which could not be counteracted. For example, using an online survey excludes people who do not use the Internet or who are not registered on the survey’s platform.
Although the three intervention groups were heterogenous to a certain degree, the intervention sample built a cohort from persons from the same socioeconomic group. The intervention participants would normally congregate and speak to one another in the regular course of their everyday lives. Therefore, social interaction did not need to be established in the intervention groups. Additionally, students are a group of special interest, since they are in a phase of transition from being dependent members of their parents’ homes to independent individuals with new living conditions, which enables behavior changes [36].
Using a university seminar to actively reflect on their experiences with peers after trying out new activities or even lifestyles, the participants could “learn through engagement” [37].
The main source of bias identified within the gamification intervention was the fact that it was based on self-reported outcomes rather than observed behavior (change). The major problem is that self-reported outcomes are hardly verifiable and might be biased, e.g., regarding social desirability.
Interestingly, the participants were against competition or incentives as motivation schemes, which followed the research literature showing that incentives do not encourage long-term behavior changes and/or might even weaken intrinsic motivation [38,39].
It must be noted that the findings of the representative quantitative survey and the qualitative gamification intervention, as well as their combination described in this work, are limited in scale and scope. To upscale the results and make them applicable to other contexts, various social structures, as well as different countries, more extensive national and global research is needed.
In concordance with the literature, the participants in the gamification intervention initially lacked clarity and understanding regarding the causes of climate change, emerging potential threats, and possible solutions [5]. The participants also stated that they wished for additional information on why and how each task enhanced PEBs and/or reduced harmful emissions.
According to Lorenzoni et al. [40], pro-environmental engagement is possible when knowledge and the will to act meet with the ability to act. Participants stated that some tasks were beyond their ability to engage in, e.g., donations because of their limited financial means or building insect hotels due to their lack of skills. Consequently, interventions should also include measures to increase the ability to act pro-environmentally.

5. Conclusions

As behavior is individual and complex, interventions for changing a specific behavior should also be individualized and account for this complexity. This means that a ‘one-size-fits-all’ intervention approach is not promising in changing behavior in the long term. People need to be enabled to adapt to a certain behavior, to make it convenient, and to integrate it in their everyday lives [41].
However, our contribution showed that even individual behavior and perceived subjective costs can be grouped and categorized. Based on this categorization, interventions can be deduced. Pro-environmental behaviors, which are more popular than others and are already implemented in most everyday lives, are perceived as ‘low-cost’. Such behaviors, in most cases, need to be maintained, e.g., as ‘normal’ behavior in a society (cultural and societal factors) but do not need additional interventions. However, PEBs that are perceived as high-cost with people having no intention to change their behavior will need top-down interventions to be changed because, in most cases, the barriers are due to infrastructure or resources. PEBs that were categorized as rather-high- or rather-low-cost behaviors need bottom-up interventions to increase the actually shown behavior, since most participants showed at least limited intentions to change their behavior.
The developed categorization showed that behaviors of all cost types can be addressed directly and successfully. However, it is worth combining subjective costs of changing a specific behavior with data on greenhouse gas emissions to identify behavior changes with a large impact on reducing emissions [30]. Consequently, interventions and further research should focus on the combination of high-impact and cost-efficient behavior changes to be the most beneficial. Based on our data, interventions can motivate individuals to change their behavior and promise to be successful in reaching the Global Sustainable Development Goals.

Author Contributions

H.R. and S.N. drafted the manuscript. S.N., P.F. and S.S.-K. were involved in the conception and implementation of the survey. H.R., S.N. and S.S.-K. were involved in the conception and implementation of the gamification intervention. S.N., H.R. and P.F. discussed and defined the outcomes to be analyzed in this study. S.N. and P.F. analyzed and visualized the survey data. H.R. analyzed the intervention data. S.S.-K. critically revised the manuscript. All authors have read and agreed to the published version of the manuscript.

Funding

This research received no external funding.

Institutional Review Board Statement

Not applicable.

Informed Consent Statement

Informed consent was obtained from all subjects involved in the study.

Data Availability Statement

The raw data supporting the conclusions of this article will be made available by the authors on request.

Conflicts of Interest

The authors declare no conflicts of interest.

Appendix A

Survey Questions (authors’ own translation):
Past Behavior:
In 2019, I generally used a car for short distances (up to 20 km).
In 2019, I traveled by airplane.
In 2019, I ate a vegetarian diet.
In 2019, I purchased green electricity (green tariff).
In 2019, I usually switched off my electrical appliances completely (instead of using standby mode).
In 2019, I usually washed my laundry at 60 °C or higher.
In 2019, I paid more attention to longevity than price when purchasing new things (e.g., electrical appliances, clothing).
In 2019, I bought regional products rather than products transported over long distances.
In 2019, I generally shopped in a waste-avoiding manner (e.g., not using plastic bags to transport fruit and vegetables).
In 2019, I heated my home to more than 22 °C during the winter months.
Intended Behavior:
In 2019, I will (continue to) generally use a car for short distances (up to 20 km).
In 2021, I will (continue to) travel by airplane.
In 2019, I will (continue to) eat a vegetarian diet.
In 2019, I will (continue to) purchase green electricity (green tariff).
In 2019, I will (continue to) usually switch off my electrical appliances completely (instead of using standby mode).
In 2019, I will (continue to) usually wash my laundry at 60 °C or higher.
In 2019, I will (continue to) pay more attention to longevity than price when purchasing new things (e.g., electrical appliances, clothing).
In 2019, I will (continue to) buy regional products rather than products transported over long distances.
In 2019, I will (continue to) generally shop in a waste-avoiding manner (e.g., not using plastic bags to transport fruit and vegetables).
In 2019, I will (continue to) heat my home to more than 22 °C during the winter months.

References

  1. United Nations. General Assembly Resolution A/RES/70/1: Transforming Our World, the 2030 Agenda for Sustainable Development; United Nations: New York, NY, USA, 2015. [Google Scholar]
  2. German Federal Government. German Sustainable Development Strategy; Update 2021; Bundesregierung: Berlin, Germany, 2021.
  3. Kollmuss, A.; Agyeman, J. Mind the Gap: Why do people act environmentally and what are the barriers to pro-environmental behavior? Environ. Educ. Res. 2002, 8, 239–260. [Google Scholar] [CrossRef]
  4. Bundesministerium für Umwelt, Naturschutz und Nukleare Sicherheit. Klimaschutz in Zahlen—Fakten, Trends und Impulse Deutscher Klimapolitik; Ausgabe 2018; Bundesministerium für Umwelt, Naturschutz und Nukleare Sicherheit (BMU): Bonn, Germany, 2018.
  5. Happer, C.; Philo, G. New approaches to understanding the role of the news media in the formation of public attitudes and behaviours on climate change. Eur. J. Commun. 2016, 31, 136–151. [Google Scholar] [CrossRef]
  6. Malan, H.; Amsler Challamel, G.; Silverstein, D.; Hoffs, C.; Spang, E.; Pace, S.A.; Malagueño, B.L.R.; Gardner, C.D.; Wang, M.C.; Slusser, W.; et al. Impact of a Scalable, Multi-Campus “Foodprint” Seminar on College Students’ Dietary Intake and Dietary Carbon Footprint. Nutrients 2020, 12, 2890. [Google Scholar] [CrossRef] [PubMed]
  7. Matsui, K.; Ochiai, H.; Yamagata, Y. Feedback on electricity usage for home energy management: A social experiment in a local village of cold region. Appl. Energy 2014, 120, 159–168. [Google Scholar] [CrossRef]
  8. West, S.; van Kerkhoff, L.; Wagenaar, H. Beyond “linking knowledge and action”: Towards a practice-based approach to transdisciplinary sustainability interventions. Policy Stud. 2019, 40, 534–555. [Google Scholar] [CrossRef]
  9. Klöckner, C.A. A comprehensive model of the psychology of environmental behaviour—A meta-analysis. Glob. Environ. Chang. 2013, 23, 1028–1038. [Google Scholar] [CrossRef]
  10. Ivanova, D.; Barrett, J.; Wiedenhofer, D.; Macura, B.; Callaghan, M.; Creutzig, F. Quantifying the potential for climate change mitigation of consumption options. Environ. Res. Lett. 2020, 15, 93001. [Google Scholar] [CrossRef]
  11. Nisa, C.F.; Bélanger, J.J.; Schumpe, B.M.; Faller, D.G. Meta-analysis of randomised controlled trials testing behavioural interventions to promote household action on climate change. Nat. Commun. 2019, 10, 4545. [Google Scholar] [CrossRef] [PubMed]
  12. Osbaldiston, R.; Schott, J.P. Environmental Sustainability and Behavioral Science:Meta-Analysis of Proenvironmental Behavior Experiments. Environ. Behav. 2012, 44, 257–299. [Google Scholar] [CrossRef]
  13. Diekmann, A.; Preisendörfer, P. Green and Greenback:The Behavioral Effects of Environmental Attitudes in Low-Cost and High-Cost Situations. Ration. Soc. 2003, 15, 441–472. [Google Scholar] [CrossRef]
  14. Steg, L.; de Groot, J.I.M.; Dreijerink, L.; Abrahamse, W.; Siero, F. General Antecedents of Personal Norms, Policy Acceptability, and Intentions: The Role of Values, Worldviews, and Environmental Concern. Soc. Nat. Resour. 2011, 24, 349–367. [Google Scholar] [CrossRef]
  15. Stern, P.C.; Dietz, T.; Abel, T.; Guagnano, G.A.; Kalof, L. A value-belief-norm theory of support for social movements: The case of environmentalism. Hum. Ecol. Rev. 1999, 6, 81–97. [Google Scholar]
  16. Lundberg, D.C.; Tang, J.A.; Attari, S.Z. Easy but not effective: Why “turning off the lights” remains a salient energy conserving behaviour in the United States. Energy Res. Soc. Sci. 2019, 58, 101257. [Google Scholar] [CrossRef]
  17. Rau, H.; Nicolai, S.; Stoll-Kleemann, S. Die Nachhaltigkeitschallenge. LBzM 2022, 22, 1–11. [Google Scholar] [CrossRef]
  18. Stoll-Kleemann, S.; Franikowski, P.; Nicolai, S. Development and Validation of a Scale to Assess Moral Disengagement in High-Carbon Behavior. Sustainability 2023, 15, 2054. [Google Scholar] [CrossRef]
  19. Leiner, D.J. Too Fast, too Straight, too Weird: Non-Reactive Indicators for Meaningless Data in Internet Surveys. Surv. Res. Methods 2019, 13, 229–248. [Google Scholar] [CrossRef]
  20. Satow, L. Skala zur Erfassung von Testverfälschung durch Positive Selbstdarstellung und Sozialerwünschte Antworttendenzen (SEA); Elektronisches Testarchiv; Leibniz-Zentrum für Psychologische Information und Dokumentation (ZPID): Trier, Germany, 2012. [Google Scholar] [CrossRef]
  21. Rau, H.; Nicolai, S.; Stoll-Kleemann, S. A systematic review to assess the evidence-based effectiveness, content, and success factors of behavior change interventions for enhancing pro-environmental behavior in individuals. Front. Psychol. 2022, 13, 901927. [Google Scholar] [CrossRef] [PubMed]
  22. Abrahamse, W. Encouraging Pro-Environmental Behaviour: What Works, What Doesn’t, and Why; Academic Press: Cambridge, MA, USA, 2019; ISBN 978-0128113592. [Google Scholar]
  23. Cellina, F.; Bucher, D.; Mangili, F.; Veiga Simão, J.; Rudel, R.; Raubal, M. A Large Scale, App-Based Behaviour Change Experiment Persuading Sustainable Mobility Patterns: Methods, Results and Lessons Learnt. Sustainability 2019, 11, 2674. [Google Scholar] [CrossRef]
  24. Schawel, C.; Billing, F. BCG-Matrix. In Top 100 Management Tools; Schawel, C., Billing, F., Eds.; Gabler Verlag: Wiesbaden, Germany, 2012; pp. 32–34. ISBN 978-3-8349-4104-6. [Google Scholar]
  25. Wynes, S.; Nicholas, K.A.; Zhao, J.; Donner, S.D. Measuring what works: Quantifying greenhouse gas emission reductions of behavioural interventions to reduce driving, meat consumption, and household energy use. Environ. Res. Lett. 2018, 13, 113002. [Google Scholar] [CrossRef]
  26. Stoll-Kleemann, S.; Schmidt, U.J. Reducing meat consumption in developed and transition countries to counter climate change and biodiversity loss: A review of influence factors. Reg. Environ. Chang. 2017, 17, 1261–1277. [Google Scholar] [CrossRef]
  27. Kurz, V. Nudging to reduce meat consumption: Immediate and persistent effects of an intervention at a university restaurant. J. Environ. Econ. Manag. 2018, 90, 317–341. [Google Scholar] [CrossRef]
  28. Kelly, N.R.; Mazzeo, S.E.; Bean, M.K. Systematic Review of Dietary Interventions with College Students: Directions for Future Research and Practice. J. Nutr. Educ. Behav. 2013, 45, 304–313. [Google Scholar] [CrossRef]
  29. Klöckner, C.A.; Ofstad, S.P. Tailored information helps people progress towards reducing their beef consumption. J. Environ. Psychol. 2017, 50, 24–36. [Google Scholar] [CrossRef]
  30. Williamson, K.; Satre-Meloy, A.; Velasco, K.; Green, K. Climate Change Needs Behavior Change: Making the Case for Behavioral Solutions to Reduce Global Warming; Rare: Arlington, VA, USA, 2018. [Google Scholar]
  31. Marchand, R.D.; Koh, S.C.L.; Morris, J.C. Delivering energy efficiency and carbon reduction schemes in England: Lessons from Green Deal Pioneer Places. Energy Policy 2015, 84, 96–106. [Google Scholar] [CrossRef]
  32. Benka-Coker, M.L.; Tadele, W.; Milano, A.; Getaneh, D.; Stokes, H. A case study of the ethanol CleanCook stove intervention and potential scale-up in Ethiopia. Energy Sustain. Dev. 2018, 46, 53–64. [Google Scholar] [CrossRef]
  33. Büchs, M.; Bahaj, A.S.; Blunden, L.; Bourikas, L.; Falkingham, J.; James, P.; Kamanda, M.; Wu, Y. Promoting low carbon behaviours through personalised information? Long-term evaluation of a carbon calculator interview. Energy Policy 2018, 120, 284–293. [Google Scholar] [CrossRef]
  34. Carrico, A.R.; Riemer, M. Motivating energy conservation in the workplace: An evaluation of the use of group-level feedback and peer education. J. Environ. Psychol. 2011, 31, 1–13. [Google Scholar] [CrossRef]
  35. Revell, K. Estimating the environmental impact of home energy visits and extent of behaviour change. Energy Policy 2014, 73, 461–470. [Google Scholar] [CrossRef]
  36. Schäfer, M.; Jaeger-Erben, M.; Bamberg, S. Life Events as Windows of Opportunity for Changing Towards Sustainable Consumption Patterns? J. Consum. Policy 2012, 35, 65–84. [Google Scholar] [CrossRef]
  37. Pröpsting, S.; Both, J. Nachhaltige Schülerfirmen als Reallabore für Lernen durch Engagement und die Potenziale neuer Medien. In Nachhaltigkeit Erfahren—Engagement als Schlüssel Einer Bildung für Nachhaltige Entwicklung; Bittner, A., Pyhel, T., Bischoff, V., Eds.; Oekom Verlag: Munich, Germany, 2016; ISBN 978-3-86581-819-5. [Google Scholar]
  38. Iweka, O.; Liu, S.; Shukla, A.; Yan, D. Energy and behaviour at home: A review of intervention methods and practices. Energy Res. Soc. Sci. 2019, 57, 101238. [Google Scholar] [CrossRef]
  39. Gardner, G.T.; Stern, P.C. Environmental Problems and Human Behavior; Pearson Learning Solution: Needham Heights, MA, USA, 1996. [Google Scholar]
  40. Lorenzoni, I.; Nicholson-Cole, S.; Whitmarsh, L. Barriers perceived to engaging with climate change among the UK public and their policy implications. Glob. Environ. Chang. 2007, 17, 445–459. [Google Scholar] [CrossRef]
  41. Andersson, A.; Winslott Hiselius, L.; Adell, E. Promoting sustainable travel behaviour through the use of smartphone applications: A review and development of a conceptual model. Travel Behav. Soc. 2018, 11, 52–61. [Google Scholar] [CrossRef]
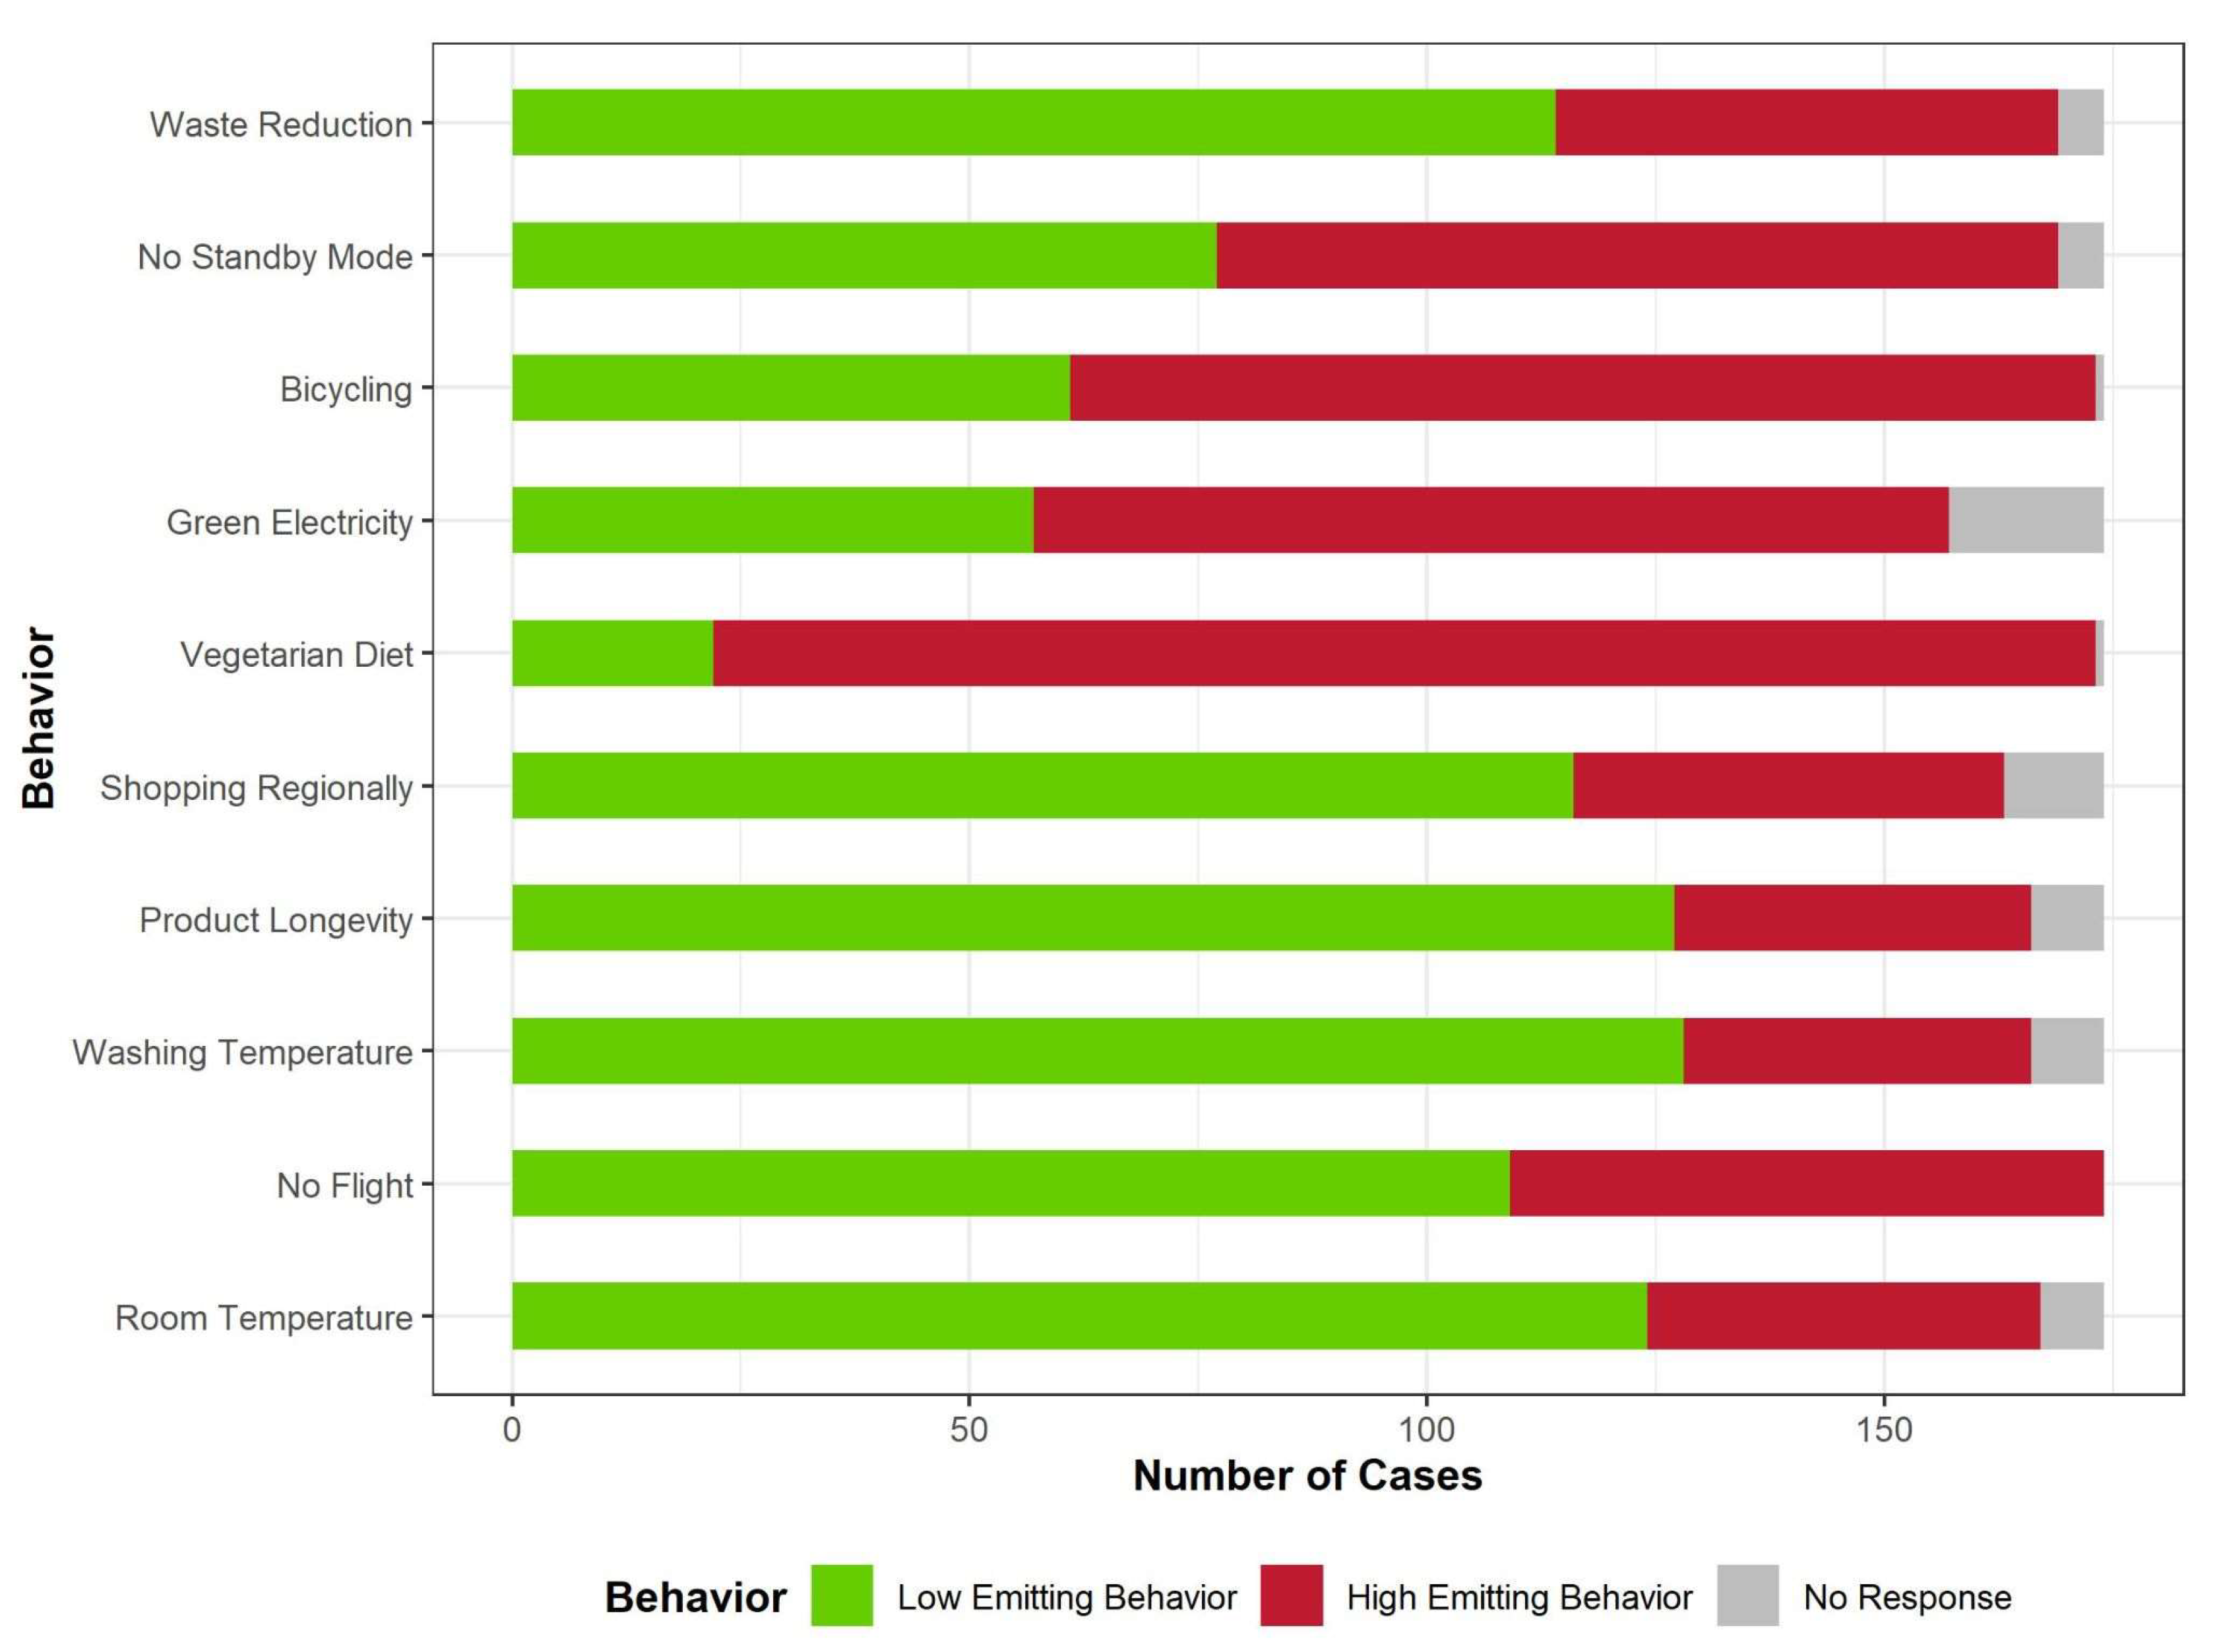
Figure 1. Distribution of ten pro-environmental behaviors (PEBs) conducted in the past year according to the survey data. The green bar shows the low-emitting version and the red bar shows the high-emitting version of each behavior (N = 174).
Sustainability 16 02206 g001
Figure 2. Distribution of the intention of pro-environmental behaviors (PEBs) according to the survey data. The vertical dashed lines indicate the means of each behavioral intention (N = 174).
Sustainability 16 02206 g002
Figure 3. The mean intentions and behavior are plotted in the diagram. Using the means of the intentions and behavior, four quadrants were separated. Low-cost behavior is shown in quadrant I (high past and high intended behavior), and high-cost behavior is shown in quadrant III (low past and low intended behavior).
Sustainability 16 02206 g003
Figure 4. Differences in intentions to adopt a specific pro-environmental behavior.
Sustainability 16 02206 g004
Table 1. Depicting the costs according to intended and shown behaviors, as well as the need for interventions and possible intervention types.
Quadrant II—high intention, low shown behavior (rather-low-cost PEB)
-
bottom-up interventions are needed
-
making the behavior more convenient, nudging, or establishing habits
Examples:
-
having at least two meat-free days
-
not using standby mode
-
having a game night or reading a book instead of watching TV
Quadrant I—high intention, high shown behavior (low-cost PEB)
-
no interventions needed
-
PEB must be maintained as ‘normal’ in society
Examples:
-
reducing waste
-
shopping consciously (regional, seasonal, considering product longevity)
-
reducing room temperature
-
only use washing machines/dishwashers when fully loaded
-
using clothes lines instead of electric dryers
Quadrant III—low intention, low shown behavior (high-cost PEB)
-
top-down interventions are needed, e.g., making the sustainable option the default, improving infrastructure, or making meat-free products the cheaper option
-
making the behavior more convenient or giving incentives to show a certain behavior
Examples:
-
changing to a ‘green’ electricity tariff
-
going by bike or foot for short distances instead of using the car
-
implementing a more vegetarian diet
Quadrant IV—low intention, high shown behavior (rather-high-cost PEB)
-
bottom-up in combination with top-down interventions are needed, e.g., reducing short-haul flights, demanding greenhouse gas compensations and taxes for flights, improving train infrastructure, making people explore regional and country-specific sights
Examples:
-
no flying
-
reducing time with streaming services
Disclaimer/Publisher’s Note: The statements, opinions and data contained in all publications are solely those of the individual author(s) and contributor(s) and not of MDPI and/or the editor(s). MDPI and/or the editor(s) disclaim responsibility for any injury to people or property resulting from any ideas, methods, instructions or products referred to in the content.