1. Introduction
Both energy demand and the price of electricity over the globe are increasing, and conventional sources of energy are being exhausted at higher rates, raising environmental concerns like global warming and temperature surges. The Paris Agreement of 2015 and COP 28 have set out to hamper the emission of CO
2 caused by fossil fuels and to deploy renewable energy sources for power generation [
1,
2,
3,
4,
5,
6]. Moreover, conventional grids equipped with conventional energy sources (fossil fuels) also face lots of problems like peak load management, frequent blackouts, and failures along the unidirectional flow of energy [
7,
8,
9,
10,
11]. These problems have given rise to the concept of smart grids or microgrids and renewable energy sources. Smart grids are equipped with smart meters, control systems, and decentralized energy sources that are capable of the intelligent generation, transmission, and distribution of energy, which is known as the property of self-healing. In smart grids, loads can communicate with each other and there is a bidirectional flow of electricity [
12,
13,
14,
15,
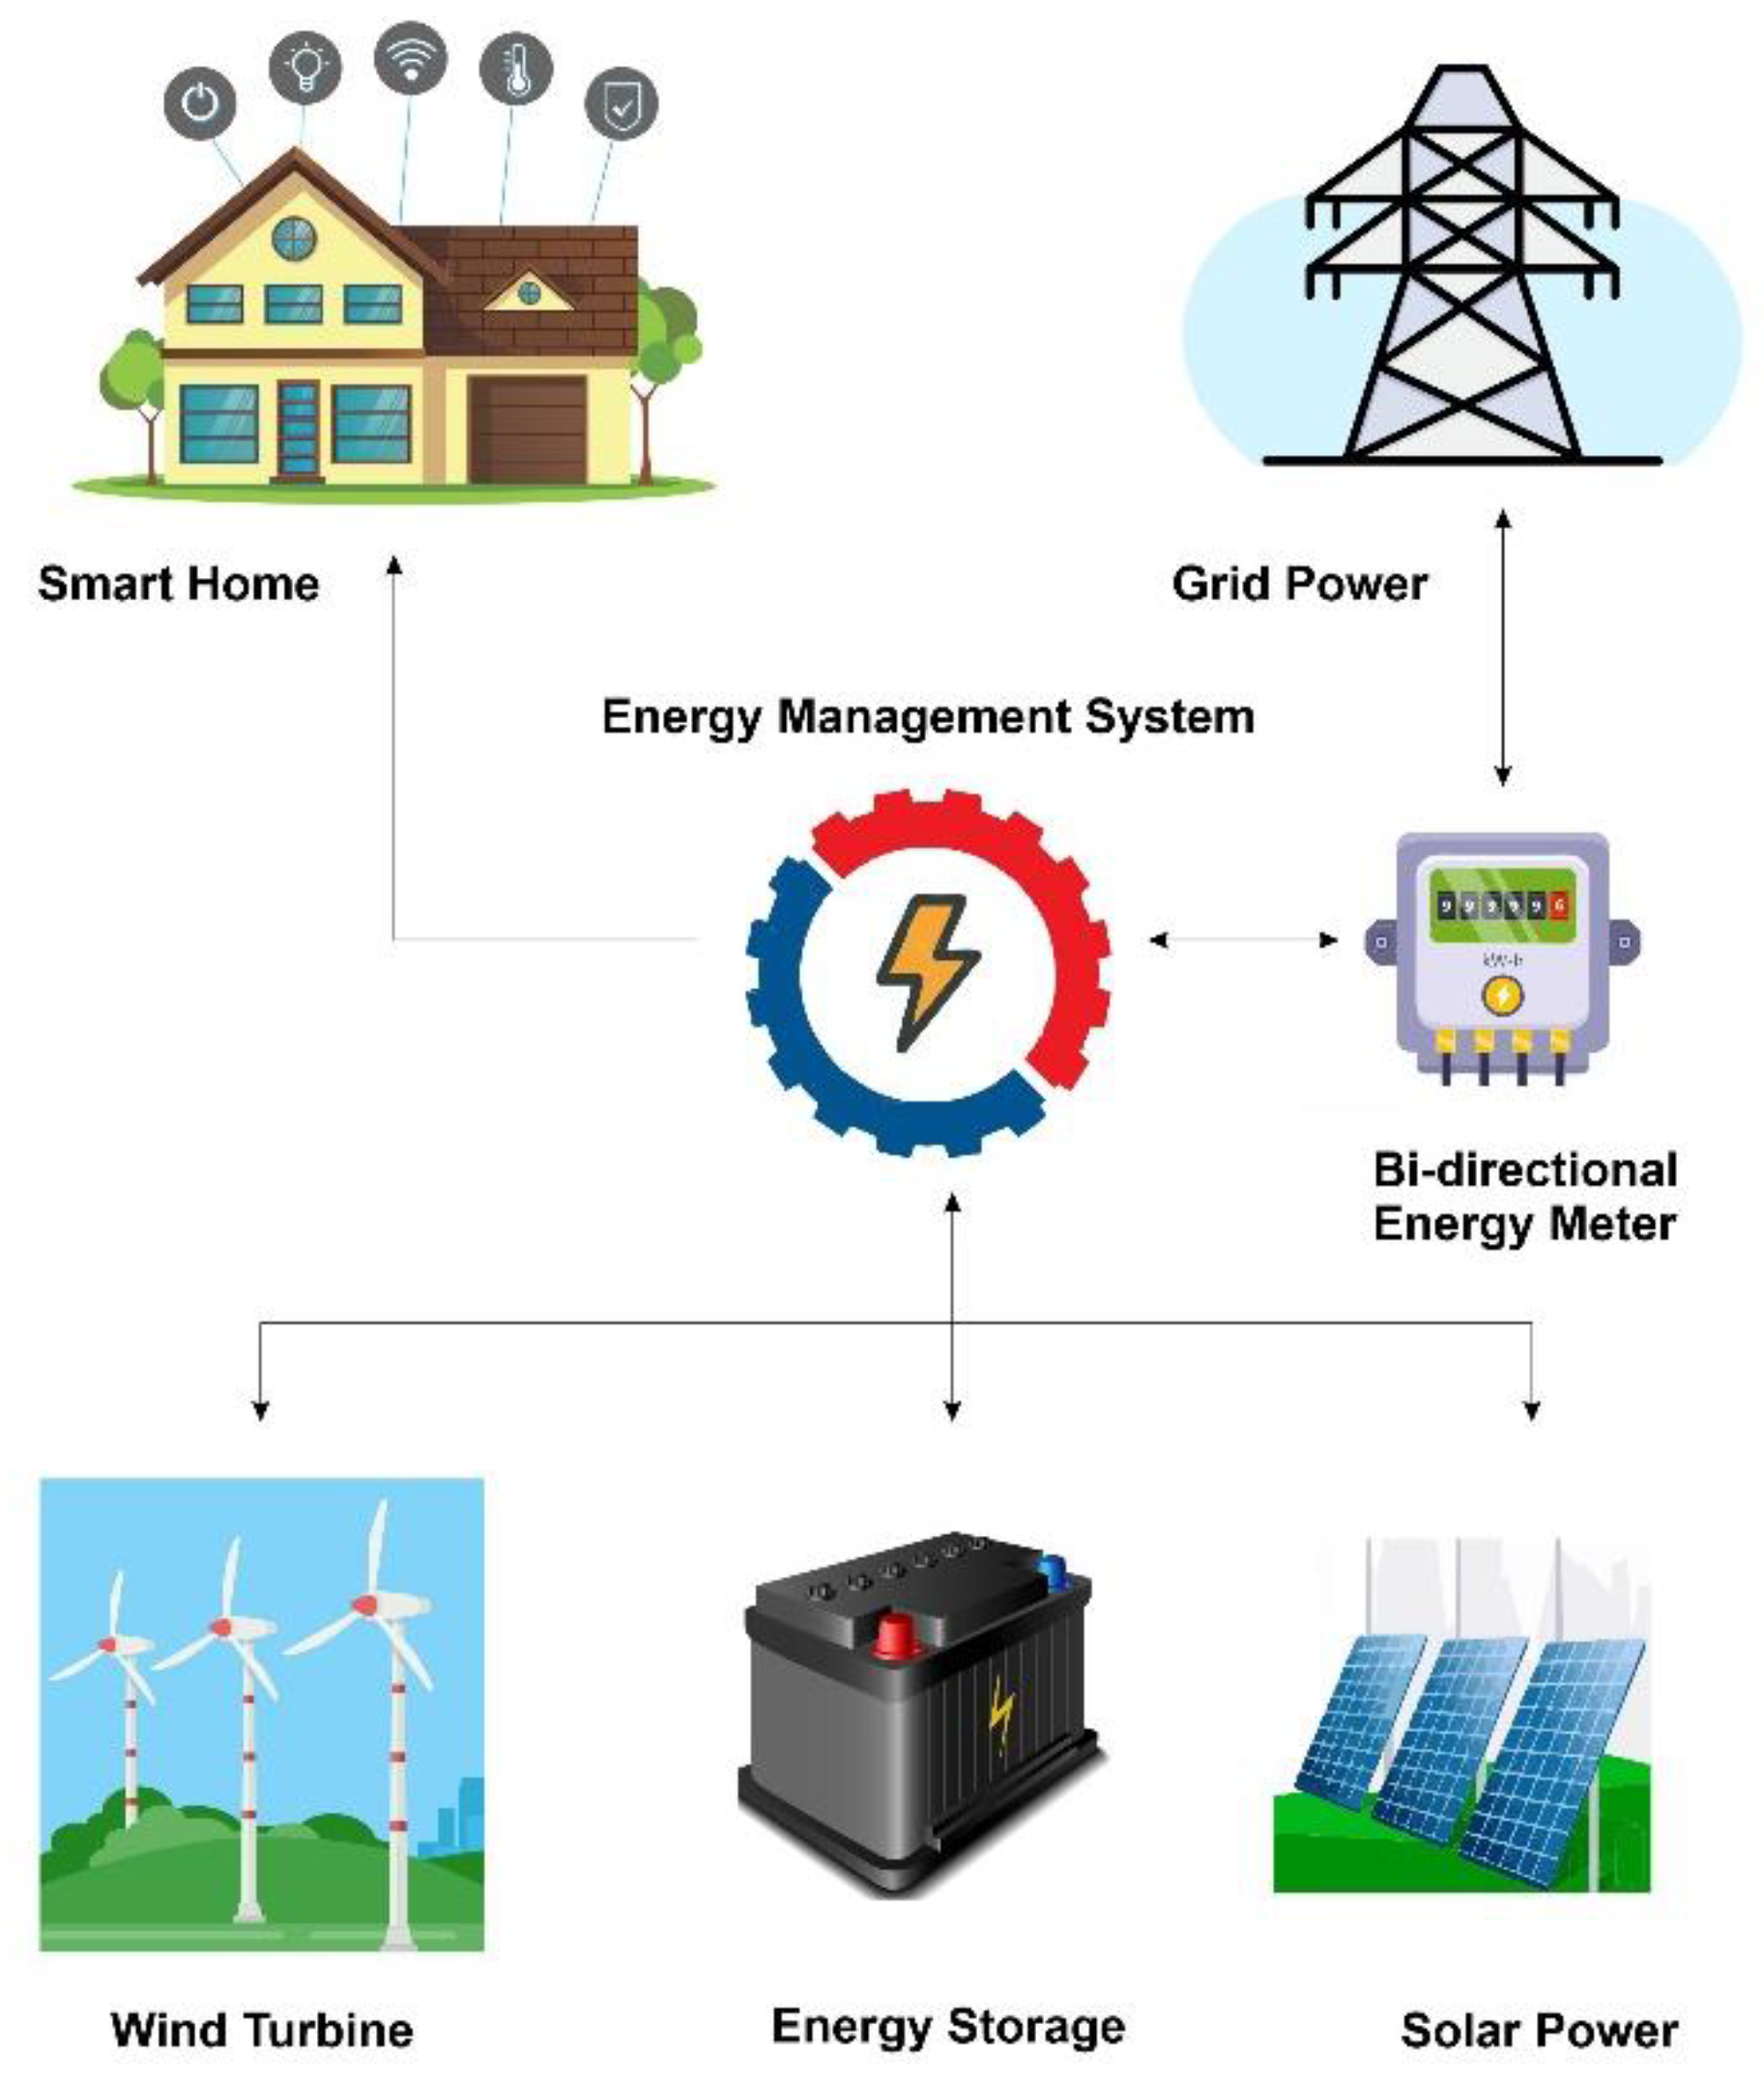
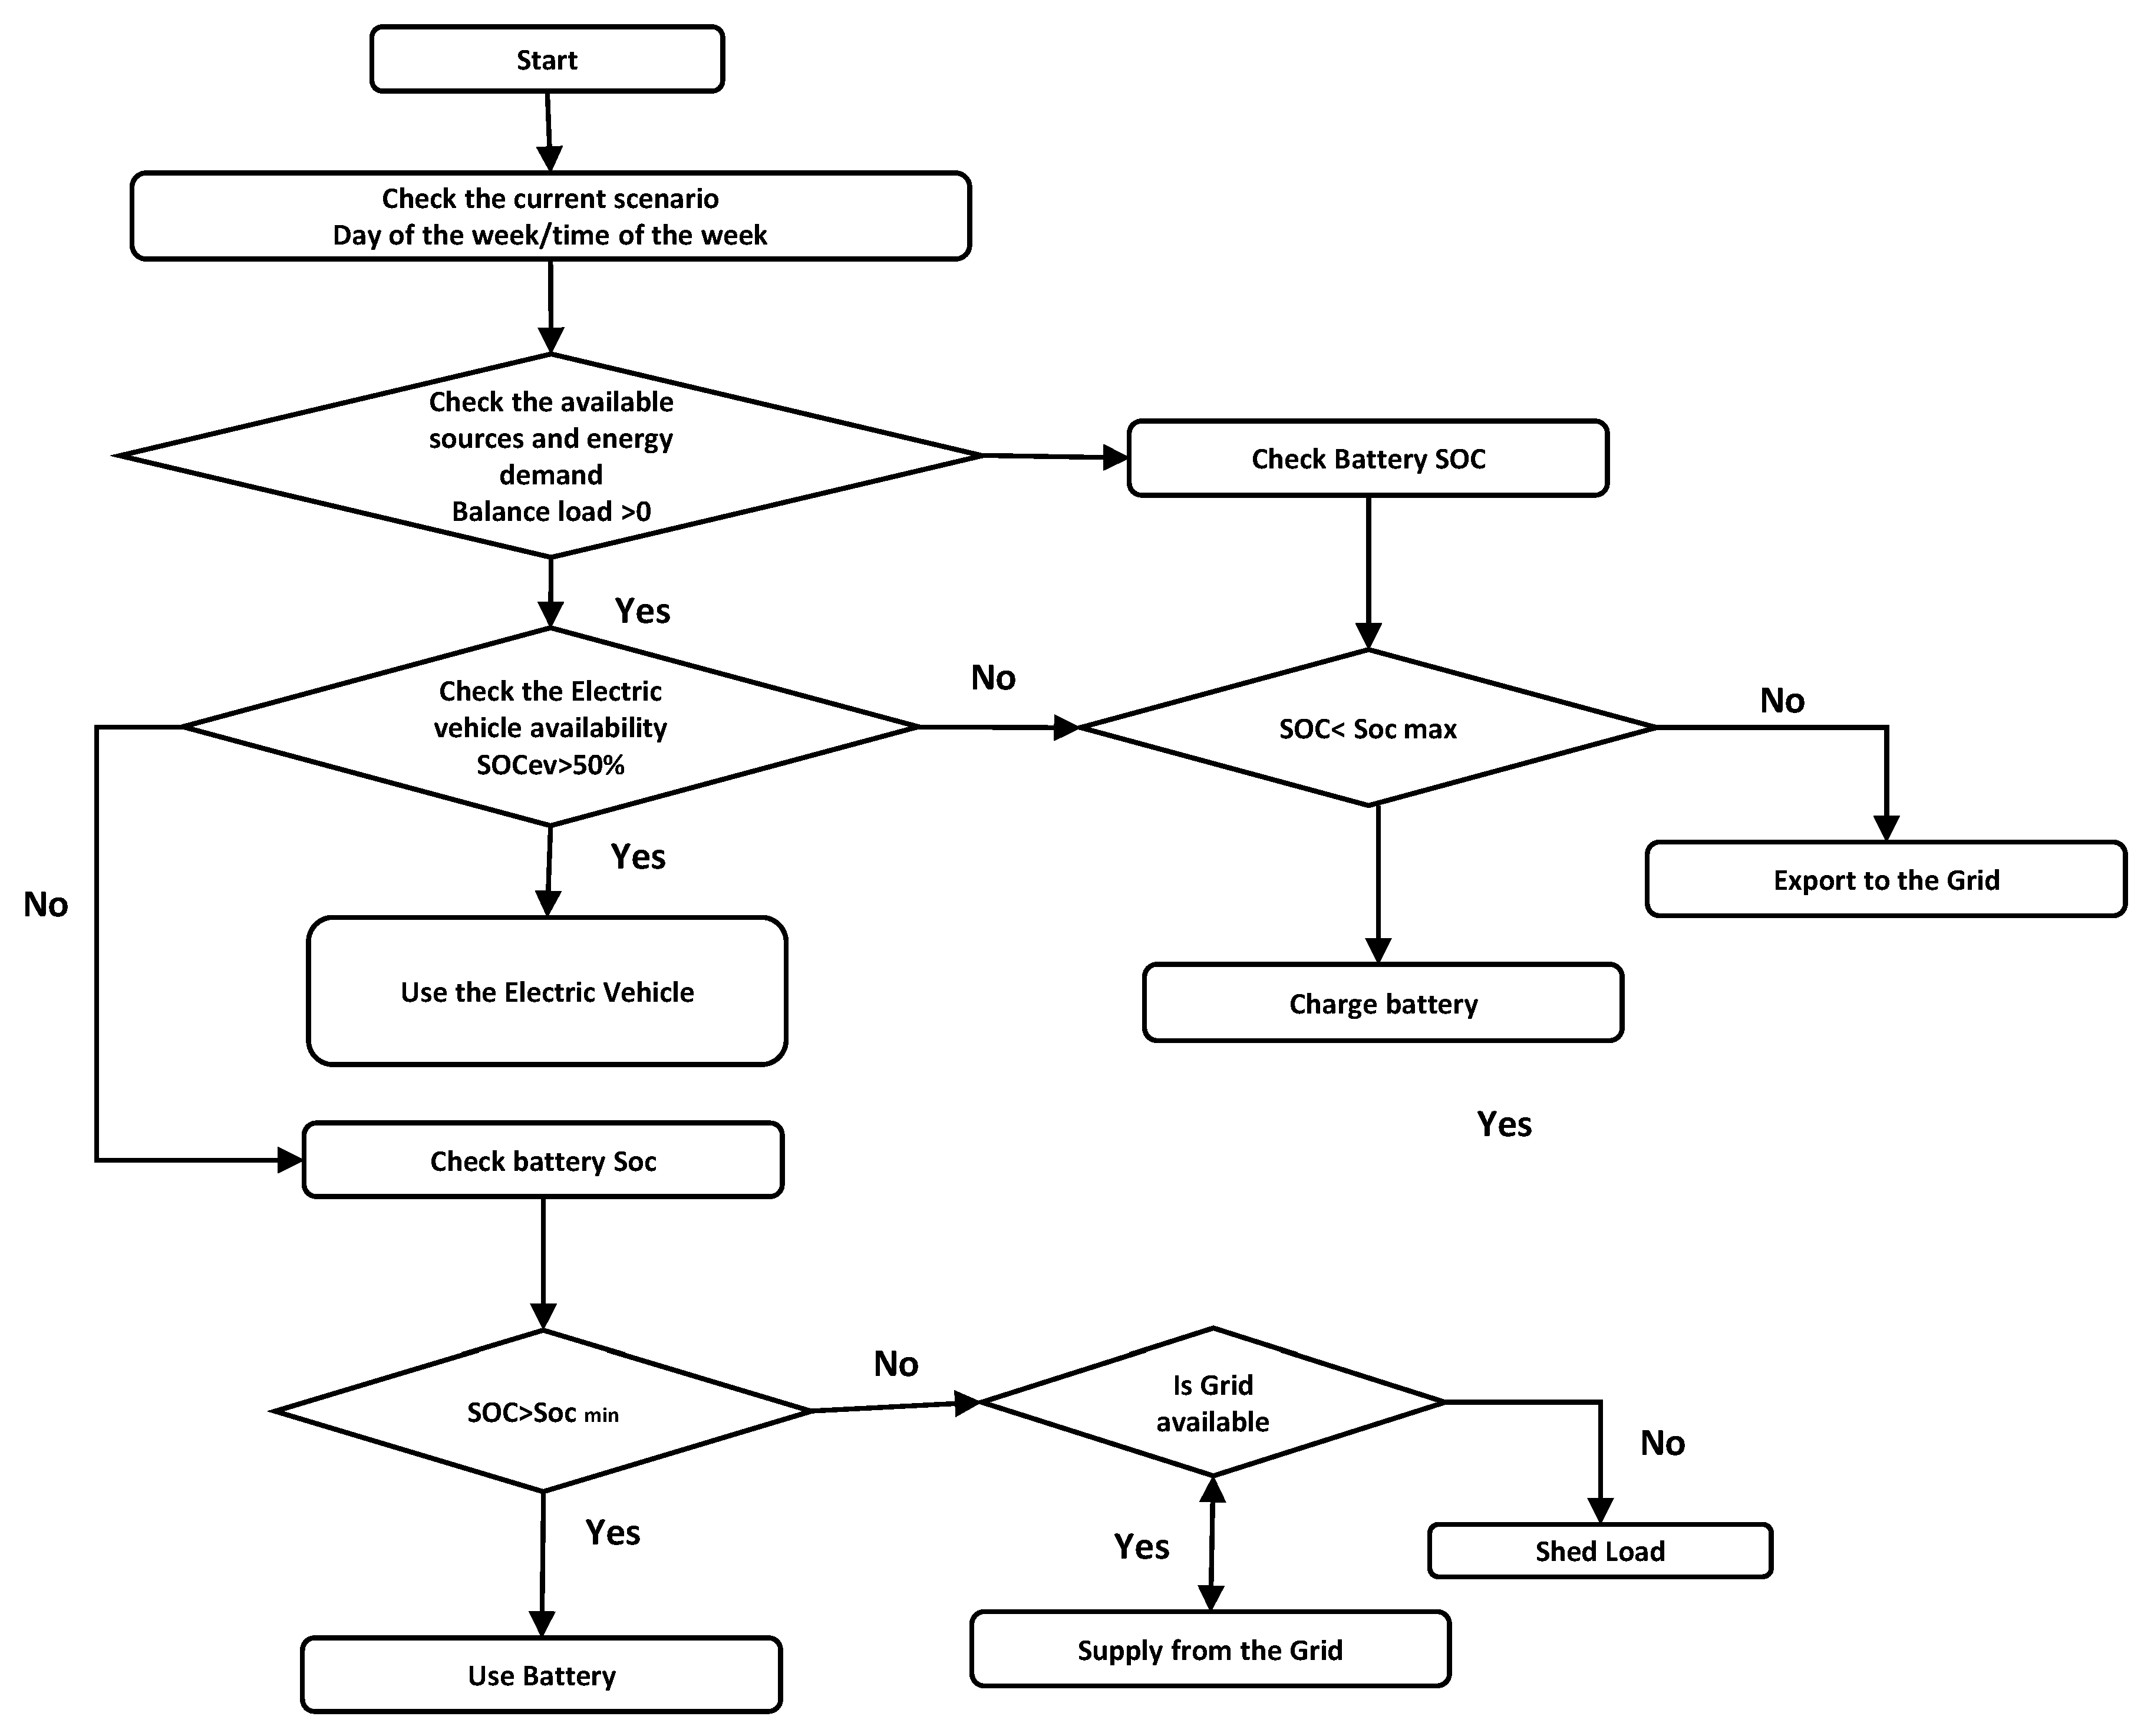
16]. Consumers play important role in smart grids by employing an efficient energy management system as shown in
Figure 1 by reducing stress on grid and decreasing their electricity cost. In ref. [
17], the authors have discussed the architecture of microgrids and different techniques and software with which to optimize these microgrids to reduce costs. Smart microgrids consist of power electronics modules, controllers, renewable energy sources, loads (residential and in some cases loads related to electrical vehicles), and storage systems. The authors also emphasized that by using IoT/AI, smart grids can be operated and observed more efficiently. The authors also determined that energy management systems (EMS) are crucial from an economic perspective. The structure of microgrids (both on and off grid) entails centralized DC bus configuration, centralized AC bus configuration, and hybrid AC/DC bus configuration. Storage systems also play a crucial role as they provide power during outages and other supportive services such as peak shaving, balancing load, and reliability of system.
Storage systems usually have three configurations, i.e., single, multiple, and swappable configurations. They consist of Li-ion batteries and supercapacitors. A lot of research has shown that by employing storage systems, a hefty amount of the cost (up to 10–50%) can be reduced. Among renewable energy sources, the most important sources are wind and solar PV cells, and they are also feasible for installation in residential and commercial usage. The homes equipped with solar PV cells or small wind turbines in the vicinity of smart grids can use their energy during peak hours and sell their surplus energy to utilities. These homes are termed smart homes. Smart homes have schedulable loads, DG, EVs, and a home energy management system (HEMS) controller. The HEMS controller provides access to real-time information about electricity consumption, rate of electricity, weather conditions, and supportive or enabling technology such as artificial intelligence (AI) or the Internet of things (IOT) [
18,
19,
20]. If a greater number of consumers support the grid, it will have a significant impact on the grid, which will enhance the reliability of the micro grid, especially at peak loads. Furthermore, the intelligent use of energy by consumers would reduce their electricity bills considerably [
20,
21,
22].
Smart meters are also installed in these homes for net metering, and they respond to demand response (DR) programs or demand-side management (DSM). In DR programs, the end user’s load curve is improved as per the external signal (i.e., price or incentives), which is usually received from the utility, while in DSM, the overall efficiency of electricity consumption is improved in the domain of customer [
23]. The authors in ref. [
24] have presented a control system based on IEEE 802.15.4 and ZigBee. Both hardware and software designs were presented. The authors devised a control system to turn off the lights for energy saving, and a significant cost reduction was observed in the system. In ref. [
25], an optimization method was proposed for the real-time management of energy in smart homes with rooftop solar panels, lighting loads, air conditioners, and other smart appliances. The results depicted a considerable reduction in cost without disturbing customer satisfaction.
2. Literature Review
In ref. [
26], the model for smart household scheduling is presented by the authors. The approach bases the scheduling of all sorts of loads on optimal cost planning and mixed linear integer programming. When necessary, the intelligent system can buy and sell power to the power grid utilizing a bi-directional energy meter. The systems guarantee the effective use of energy resources, which leads to greater cost savings. In this study, despite conducting a thorough analysis, the electric vehicle is only charged using one method from the grid, and a sole battery storage system is employed. In ref. [
27], the authors proposed a home energy management system that includes predictive modeling and control. This technology has the potential to optimize the home energy management system at any time. It chooses model predictive control concepts that make use of MILP to circumnavigate the issue of updating new variables with fresh forecasts. In this study, the authors did not incorporate the investigation of a wind energy system and electric vehicle (EV) in their research study. Microgrids and smart grids containing green energy sources and storage systems have the prowess to resolve these issues by properly scheduling the resources according to demand to benefit both consumers and utility [
28,
29,
30,
31,
32].
In ref. [
33], the authors considered a campus-based micro-grid containing both dispatchable and non-dispatchable energy sources in China and devised a system using linear programming techniques in MATLAB with various system constraints. The grid comprised secured advanced communication, control, protection, monitoring, and bidirectional controllers for system operation.
In ref. [
34], the authors used chaotic salp swarm algorithms (CISSA) to contemplate the impacts of the integration of renewable energy sources (RES) in smart grids on the cost of fuel, CO
2 emission, and the overall cost of the system. Data were taken from already-conducted research, different scenarios were considered, and the results obtained from CISSA were compared with other optimization methods. It was observed that results acquired from CISSA were more efficient, and the overall cost of generation was increased through the improper integration and utilization of RES. In ref. [
35], the authors elaborated on three mechanisms that can be adopted for charging electrical vehicles (EVs). The authors have also considered different renewable energy sources (RES) and storage materials that can be utilized to attain maximum efficiency. The authors have concluded that a hybrid system is most suitable for charging EVs, but there remain many areas regarding storage types where exuberant research is needed to improve the efficiency of these systems.
In ref. [
36], the authors presented a comprehensive review of load frequency control (LFC) in power systems that contain renewable energy sources. The authors discussed the utilization of LFC in different power system configurations. The types of different controllers and the optimization techniques employed to operate these controllers more precisely were also expounded. The authors conclude that LFC is an indispensable part of contemporary power systems, and that more research is required on the development of robust controllers and efficient optimization techniques.
The authors in ref. [
37] presented a reprogramming scheme for consumer loads during peak demand. The home appliances were reprogrammed using the demand response (DR) program. The simulations were run to study the benefits for both consumer and utility. The authors observed that on average, reprogramming the appliances aided in reducing the peak demands.
In ref. [
38], the authors proposed a technique by which to reduce the cost of electricity and carbon emissions by blending natural gas with hydrogen. The applied planning model is stochastic and consists of two steps. In the first step, blended hydrogen with natural gas is supplied to the gas unit, and a stepped carbon trading mechanism with a variable incentive mechanism is employed. In the second step, uncertainties regarding energy sources and loads are considered through the interaction of cost between both the distribution network and MMG. Different cases of scheduling are observed by using ADMM, and the results showed a considerable declination in costs and carbon emissions, while the utilization of energy sources was augmented. In this reference, neither the EV nor other RESs are taken into account. In ref. [
39], the authors proposed a new algorithm called the CSAJAYA algorithm by amalgamating CSA and JAYA algorithms for the energy management of small microgrids considering the demand response program. The proposed algorithm outperformed already-existing algorithms in terms of speed and robustness. Both peak demand and cost of electricity were reduced significantly by employing the CSAJAYA algorithm compared to already-existing algorithms. The stochastic nature of various components involved in microgrids is a complex and fundamental problem to be considered.
The authors in ref. [
40] considered the stochastic response of microgrid uncertainties in day-ahead optimal dispatch and employed SRSM and SOCP to optimize the dispatching problem by taking into account the highly fluctuant nature of RESs and load demands. By using SRSM theory, random distribution is converted to normal distribution. Nataf transformation is employed, and a hermetic chaotic matrix finally establishes the linear constraint functions for probability distribution characteristics. To ensure the convergence of the optimization model, SOCP is utilized, and a robust stochastic optimization (SO) model is obtained that is solved using the Yalmip–Gurobi solver. Monte Carlo simulation is used to show the effectiveness of the proposed model. The results displayed a remarkable reduction in both carbon emission and cost reduction after employing the proposed model. The multiple commercial buildings with RESs, electric vehicles, and battery energy storage systems are considered to be commercial microgrids. However, these microgrids present problems like network instability due to variations in loads and the intermittent nature of RESs. The detailed analysis and impacts of RESs are ignored in this paper. The authors in ref. [
41] developed a linear bi-level macro energy hub (MEH) control for several microgrids that can take part in demand response and reduce both cost and carbon emission. The optimization problem is solved via a flower pollination algorithm (FPA) considering both deterministic and uncertain variables. A multi-regression analysis technique is employed to establish the relationship between customer and utility. Simulations showed a great decrement in cost, GHG emission, and load deviation in best case scenario. This paper covers comprehensive aspects of RESs, but the impact of wind energy is not considered in this research. The authors in ref. [
42] proposed a low-carbon economic dispatching strategy for integrated energy systems (IES) with wind power prediction and electric hydrogen production. Utilizing advanced forecasting and refined operation models, the model achieved significant carbon emission reductions of 12.90% with hydrogen production and of 1.543% with demand response. The costs were reduced by 5.24% by balancing low-carbon and economic objectives in IES operation. In this study, the authors only considered wind power but ignored solar energy and EV. The authors in ref. [
43] utilized a hybrid GSA-PSO algorithm to optimize microgrid load dispatch with electric vehicle charging but did not include wind, solar, or BESS. Their results showed that an ordered charging-discharging strategy reduced the total cost by 13.38%. It was also observed that by scheduling distributed power output, costs were cut by 14.06%. The study in ref. [
44] proposed an energy optimal schedule method for distribution networks with distributed generation (DG) using source–load–storage aggregation groups (SAGs). It introduced a system model, load forecasting approach, and optimized algorithms (ISSA and MOSSA) within a two-layer framework (ISSA-MOSSA). Simulation results validated its effectiveness in addressing energy imbalance with DG access. The research in ref. [
45] presented a planning framework for islanded micro-grids, incorporating diesel generators, renewable energy, and battery storage. Stochastic load and renewable energy variations were modeled probabilistically.
Table 1 shows the disparate factors considered in the literature review and provides a comparison with proposed system.
To the best of the authors’ knowledge, from the literature to date, no contemporary economic analysis has been conducted comprehensively using multiple energy storage systems. So, the main contributions of this research are as follows:
A real-time load has been taken under observation to perform analysis.
A multi-energy storage system has been employed and an economic analysis has been performed to find out the most economical battery energy storage system.
Electric vehicles (EVs) have been charged in different schemes (BESS and Grid) to find out the operational cost and cheapest scheme to charge EVs in different cases.
Different types of BESS are analyzed considering the economic aspects.
3. Mathematical Modeling
In this section of the paper, the mathematical modeling of the various components is described in the following subsections. The major focus of all the literature is to devise an optimal means of minimizing the cost, and the objective function for the operational cost (OC), which serves as the foundation for constraints, is presented below.
The price of electricity is different during different hours of the day, and the energy demand also varies during the entire day.
3.1. Power Balance Equation
Equation (2) represents the power balance equation, and Equation (3) consists of inequality constraints that show the import and export of power from the grid station. Import and export of power cannot exceed the limits of Equations (2) and (3). Both required power from the prosumer and surplus power, which is sold by the prosumer, are bounded by the two equations shown below [
52].
3.2. Modeling of Solar PV
In this subsection, the mathematical model for photovoltaics is presented. Power spawned from solar cells greatly depends upon the solar irradiance, as given in the equation below.
Here, ƞ
PV denotes the efficiency of solar panels, A denotes the area of the rooftop covered by solar panels, and Irr denotes the irradiance of the sun. The irradiance of the sun is calculated via stochastic modeling. The probability density function is used to determine the intermittent nature of solar irradiance. Beta PDF is used to determine the value of irradiance, and the equation for the function is given below. Over 24 h, around 6561 scenarios are considered by employing the Latin hypercube technique. To decrease the computational burden, only 10 scenarios are considered via the k-means method as shown in
Figure 2. The normal probability density function is given below.
Irr (kW/m
2) is the value of solar irradiance in an hour on a specific day.
and
are the deviation and mean of normal distribution. The equation below enforces the fact that the power produced from solar PV can either be used for household purposes or it can be sold back to the grid [
53].
3.3. Modeling of EV
An electric vehicle also acts as an energy storage system or battery. This reserve energy can be utilized during peak hours or in case of any contingency situation. The energy stored in the battery cannot exceed the maximum power of the battery storage system used in electric vehicles. Equations (7) and (8) represent the maximum and minimum state of energy of the battery. Both the energy states are bound to a fixed value, and the energy of the batteries used in the EV cannot go beyond these values.
The term
represents the energy level (kWh) of an electric vehicle when it is connected for charging at any specified time
,
symbolizes the maximum energy level (kWh) of an electric vehicle which is a fixed value, and
represents the internal energy lost (%).
In Equation (8) above,
is the minimum state of energy of the battery. Equation (9) below expounds the state of energy of the battery at any instant of time t. The state of energy of a battery depends upon its previous energy state [
54].
The charging and discharging constraints of the EV at any time t are defined by the equations below.
Here,
is the maximum energy that is stored in the EV. Equation (12) below shows that
are binary numbers and their sum is 1.
The operation and maintenance cost of the EV binds its charging- and discharging-related degradation cost , capacity cost, which is paid by the utility to the EV owner, , selling cost , and buying price .
Both charging and discharging cycles are modeled as follows.
The operation and maintenance cost are defined by the equation below.
3.4. Modeling of the BESS
The battery energy storage system (BESS) assumes a pivotal role within an energy management system, providing essential support by supplying power to loads during grid failures and peak hours when the rate of electricity is high. The modeling of battery energy storage systems is provided in the equations below.
Given the inherent limitation of the BESS, which cannot instantly charge or discharge, power constraints are explicitly outlined in Equations (16) and (17).
To forestall scenarios of overcharging and complete discharging, stringent upper and lower limits are imposed on BSOC, designated as
and
, respectively, as articulated in Expression (18).
An underlying assumption is made that the battery state of charge at the close of the day is
, identical to its initial state
.
The limits on the upper- and lower-value battery charging and discharging are given below.
and
are binary operational variables of charging and discharging, respectively. When the charging operation is on, it is 1, and the discharging operation is 0 and off.
The equation below shows the state of charge of the battery.
The battery state of charge (
BSOC) at any time interval “
t”, denoted as
, is intricately linked to its preceding state
, as elucidated in Equation (22). The inception flags for charging or discharging modes are represented by the equations below.
In the equations above, is an inception flag for charging mode, and is an inception flag for discharging mode, while and are binary variables for charging and discharging, respectively.
In the model, operation and maintenance costs have also been considered [
41].
In the equation above,
is the degradation cost of batteries and
is the maintenance cost of batteries. The degradation cost of batteries depends upon many factors including temperature, no. of cycles, etc. The degradation of batteries depends upon the temperature and the equation for that is given below.
If the battery is charged and discharged more frequently, the temperature of batteries usually escalates, and they degrade quite swiftly. The degradation rate is analyzed by using the Zhurkov model, as given in the equation below.
represents a coefficient of temperature in the thermal aging model,
is the actual temperature, and
is a normal temperature taken at 25 °C.
is reference temperature and is measured in kelvin by adding 273 in
.
is the absolute temperature in kelvin, which is
[
55]. The degradation cost of the battery is given by Equation (28).
3.5. Modeling of Wind
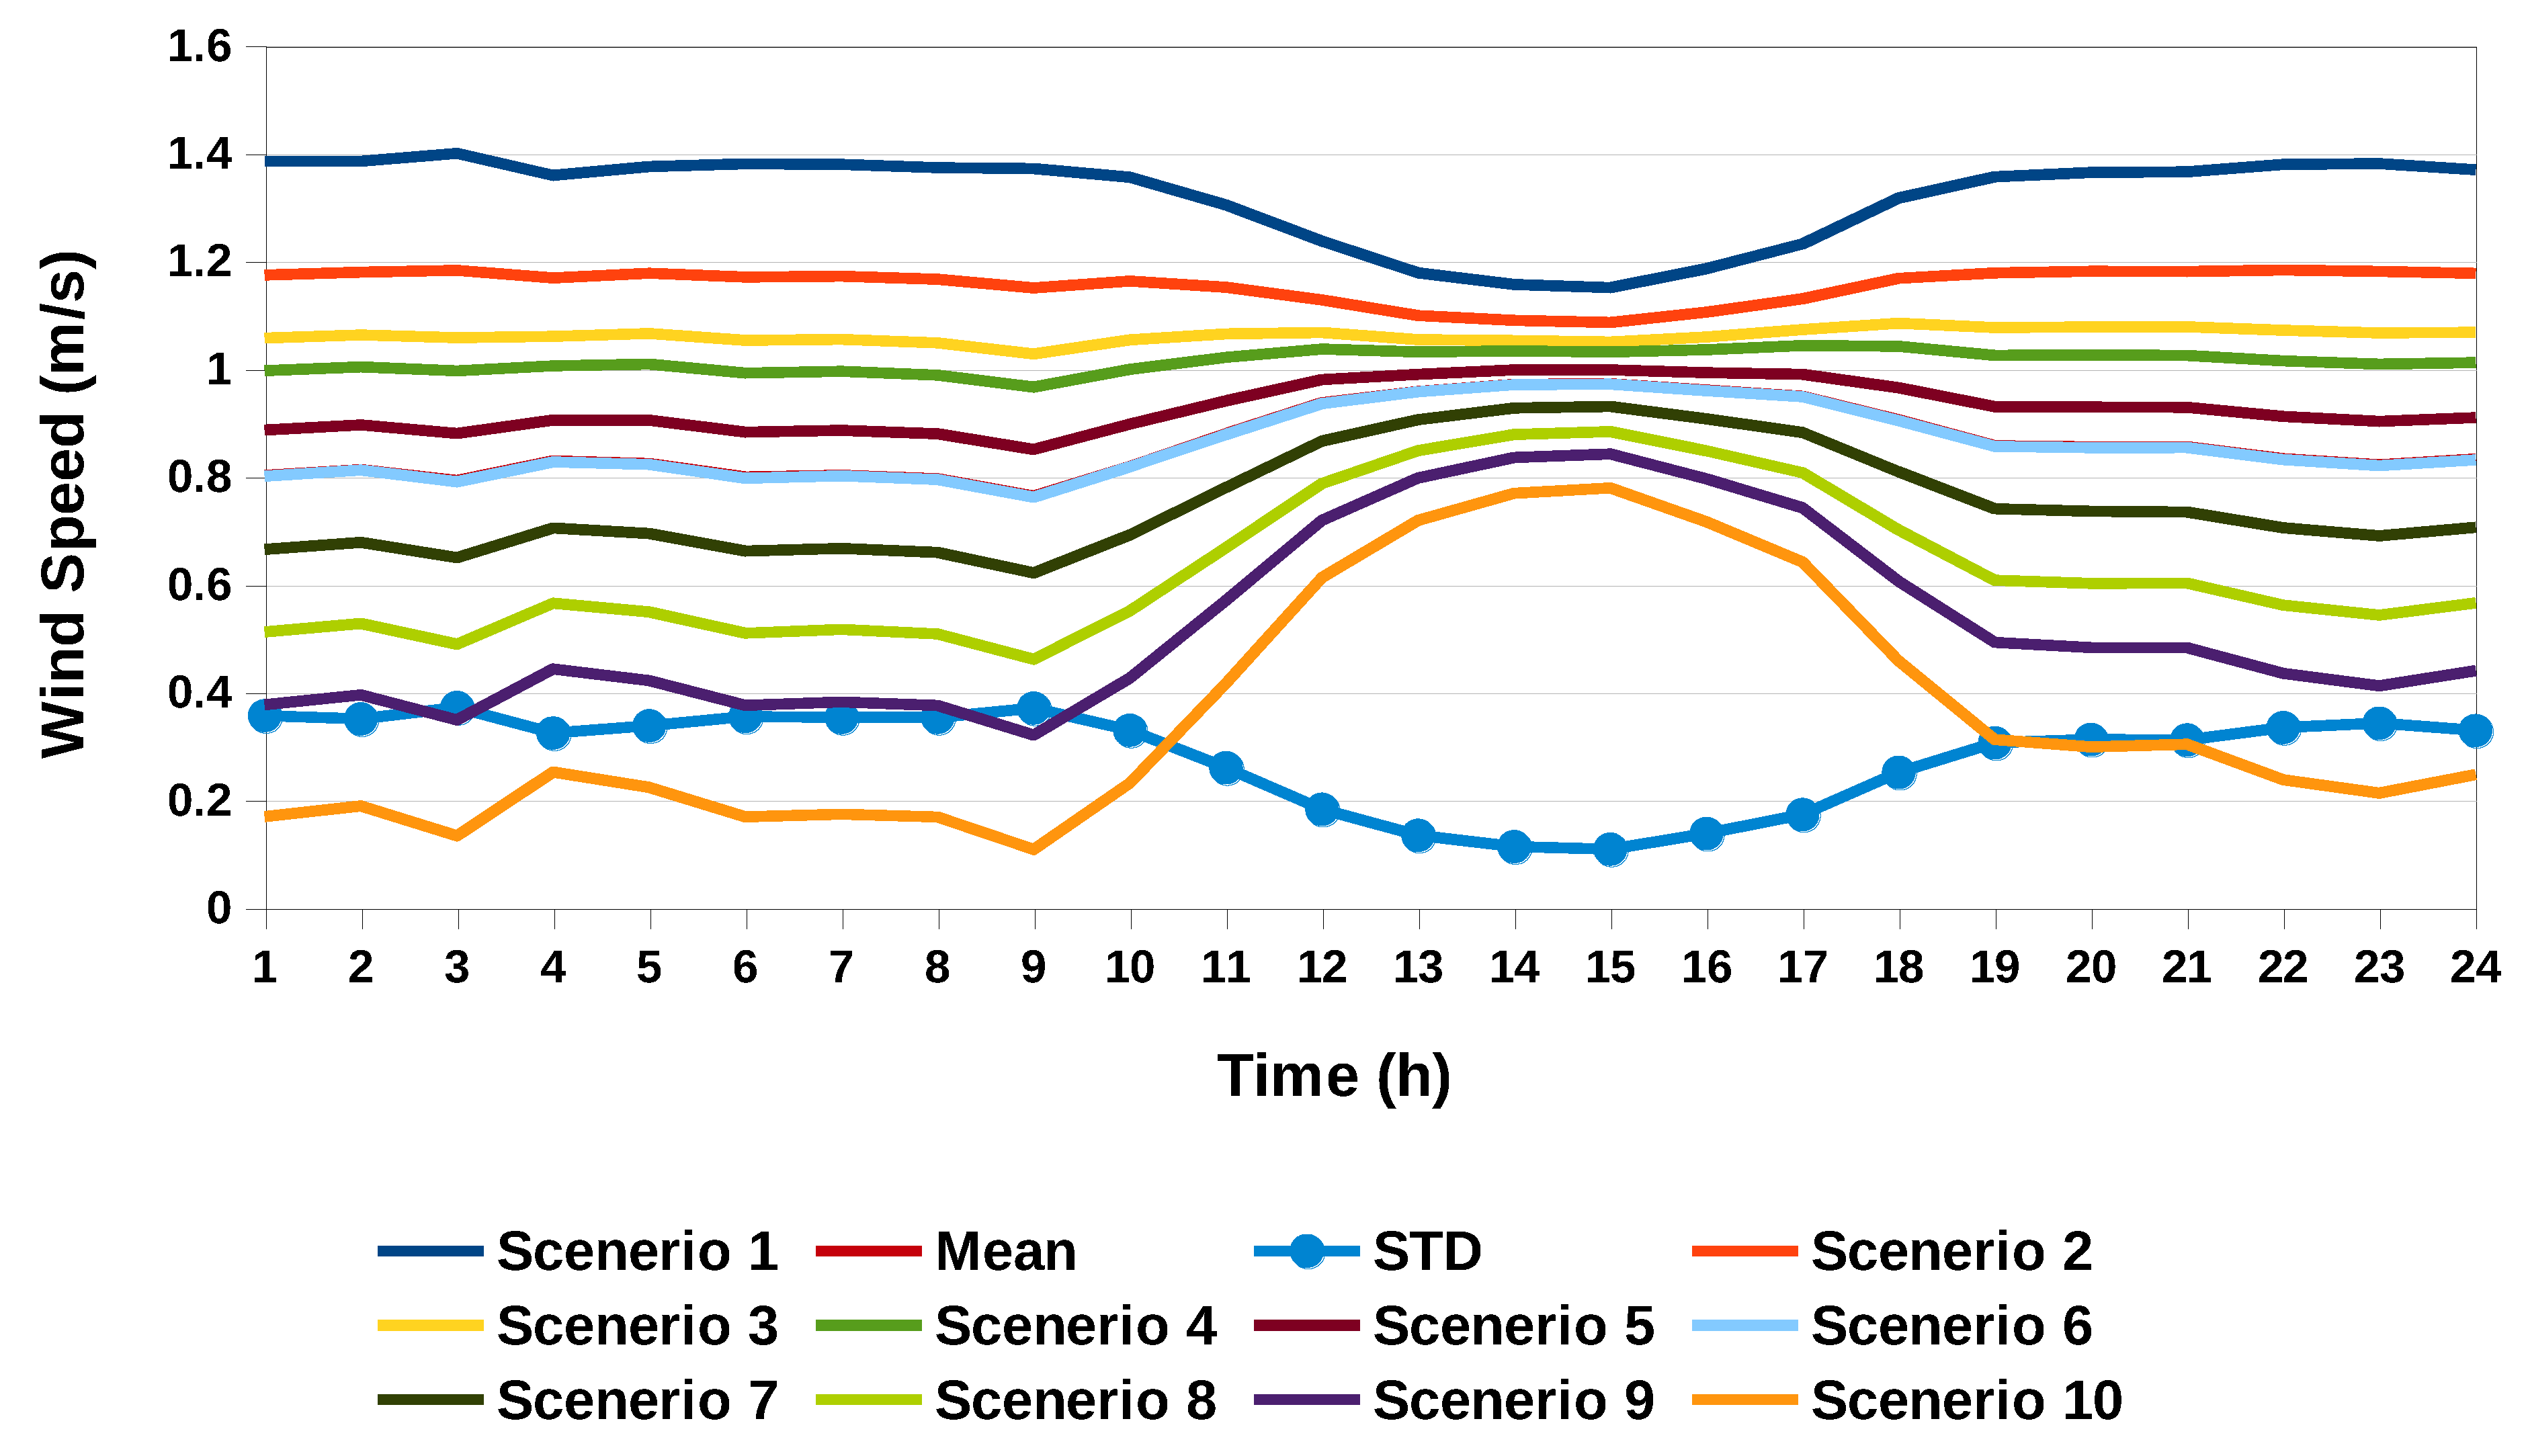
The unpredictable and non-continuous nature of wind speed is modeled using Weibull PDF. The equation for Weibull PDF is given below.
Here, c is the scale of Weibull PDF, and k signifies the shape which is obtained from the historical data of random wind speed variation (
in a particular area. Around 6561 different scenarios were created and 10 were taken for observation to reduce computational burden as shown in
Figure 3. The output of wind energy depends upon the speed of wind in a specific area, as given below.
3.6. Modeling of Demand Response
Demand response (DR) is one of the imperative features of smart grids as it allows consumers to schedule their loads at will by participating in different demand response programs. In this section, demand response constraints are formulated to establish a factor for the flexibility of DR. The energy profile in any specified horizon of time should be the same before and after applying the demand response program. This allows for the shifting of the load from peak or expensive hours to non-peak or economical hours [
56].
In the equation above,
represents load without applying
DR, and
is the flexibility of
DR.
3.7. Calculation of Carbon
To calculate the emission of carbon, the following formula is used:
where Bey is the baseline emission, Pey is the project emission, and Ley is the leakage emission [
57].
Table 2 below provides the values of different parameters used in equations for mathematical modeling.
4. System Description
This system consists of a consumer load of 25 kW and the price of electricity varies in different hours. Rooftop solar panels of 10 kW capacity are also installed along with a 600 W wind turbine commissioned at the roof. A bidirectional EV operation containing both V2G (meaning energy stored in the vehicle can be sold back to the grid) and V2H (meaning energy of vehicle can be used to cover household loads) is also taken into account. The EV has a total capacity of 16 kW. Charging efficiency and discharging efficiencies of EVs are kept at 90%. Electric vehicles are not available at home from 8 AM to 4 PM. A 20-kW battery energy storage system (BESS) is also included in the system. The BESS is charged from PV, wind, and the grid. The electricity tariff is taken from NEPRA Pakistan [
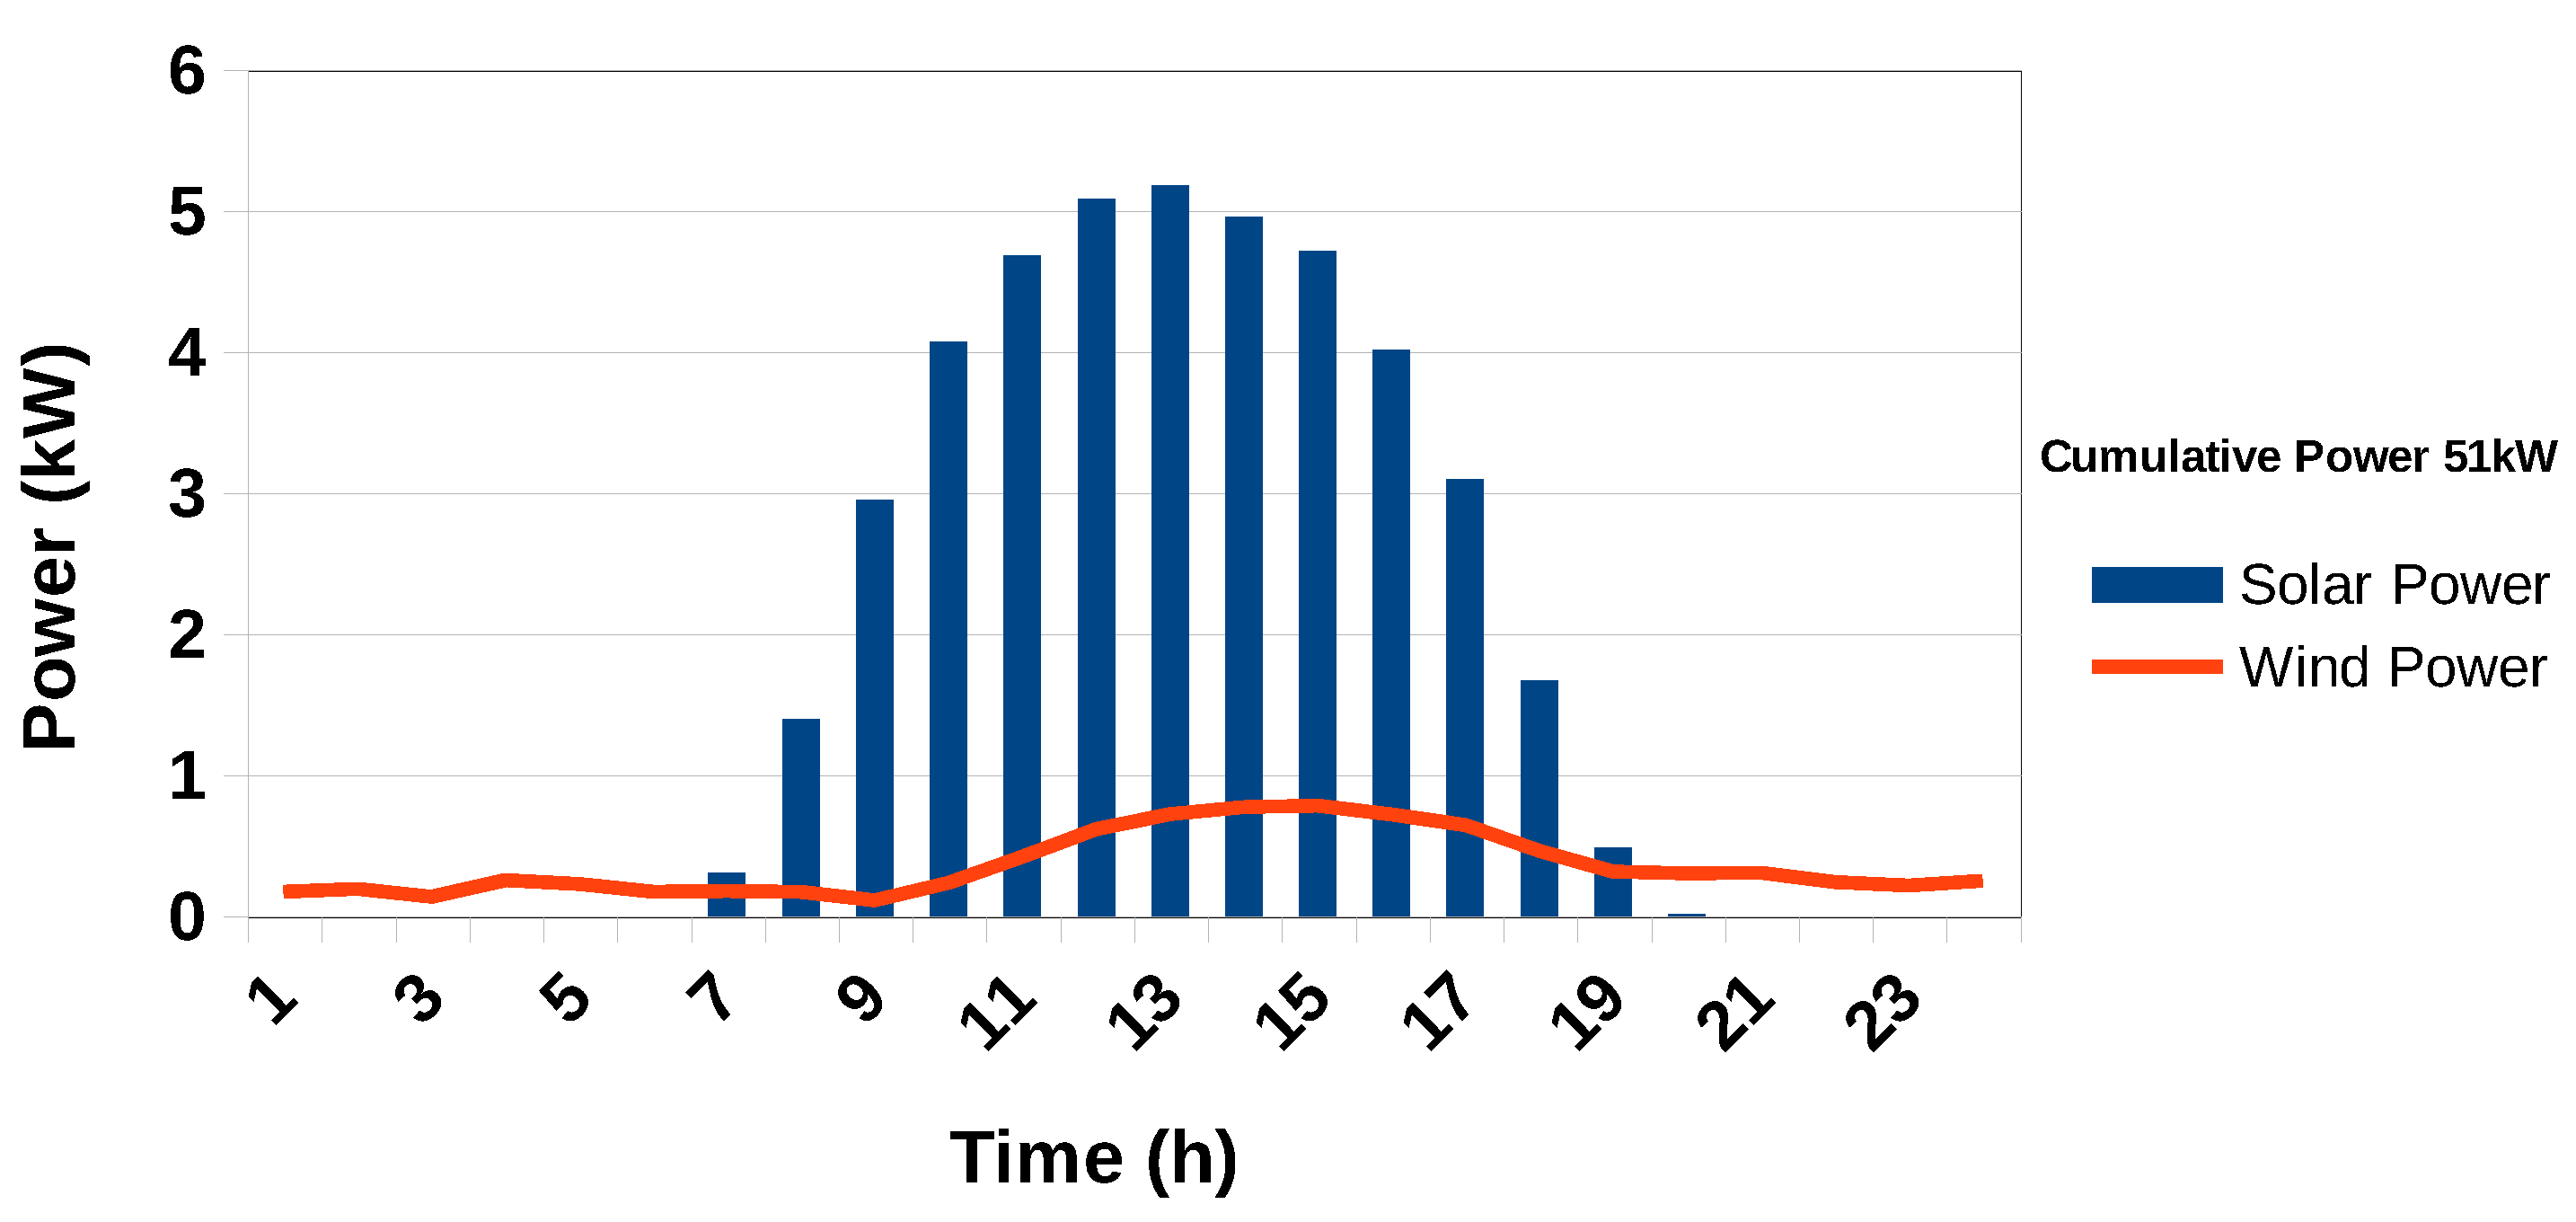
58], and the data are collected from the Lahore region. The figure below shows the energy generation from a PV system and wind turbine.
Figure 4 displays the power produced from a solar system and wind turbine during a typical day, while
Figure 5 shows the flow chart of the optimization algorithm. Wind speeds are very low in the region of Lahore as per data obtained from the literature, and due to lower wind speeds, energy production is also trivial [
59].
5. Analysis of Different Cases
This section presents different cases which are observed with both renewable energy sources and the EV and without them as well. In this study, lead–acid and lithium-ion batteries are used as the storage system. The EV is charged from two different schemes: (1) it is charged from the grid; (2) storage batteries are used to charge the EV. Scenarios with both renewable energy resources and without renewable energy resources have been taken into consideration to study the impact on daily operational cost, which are discussed in the subsections below.
5.1. Case 01: Grid-Connected with BESS Boost
In case 1, the consumer only imports electricity from the gird with the energy storage system. The incurred daily operational cost with the Li-ion battery storage system is USD 68.7969, and with the lead–acid energy storage system, the incurred cost is USD 69.609.
Figure 6 below shows the state of energy for both batteries along with power exchange with the grid. During the peak hours, the exchange with the grid is minimum while the battery provides most of the energy for loads. The peak hours are from 17:00 to 22:00, and power exchange with the grids in these hours is minimal.
It can be observed in
Figure 7 that the state of charge of batteries during peak hours of electricity decreases, providing the ancillary service of meeting the load. The levelized costs of lithium-ion and lead–acid batteries in this case are USD 1.019 and USD 0.0786, respectively. Overall, the operational costs for both lead–acid and lithium-ion batteries are highest in this case, and this case is considered as the base case.
5.2. Case 02: PV-Grid-BESS Synergy
In this case, along with the grid power and energy storage system, the consumer has installed a 10 kW rooftop solar panels system. The solar panels generate considerable amounts of energy as there is an abundance of solar in Lahore for almost 8–10 h during the day.
Figure 8 shows the amount of energy generated from solar panels along with the energy exchange with the grid and the energy stored in batteries. The levelized cost of the solar system is 0.03 USD/kWh. Therefore, the net cost of electricity is reduced by USD 9.986, which is 14.52% less than the base case with lithium battery storage system.
Similarly, with the lead–acid energy storage system, the overall obtained operational cost is USD 59.26, 14.88% less than base. A considerable reduction in operational cost can be seen with both battery storage systems. Moreover, the overall units generated from solar cells serve an imperative role in the reduction of carbon emission. On a daily basis, the amount of carbon which is reduced is approximately 36,018 grams/day.
Figure 8 above depicts the energy exchange with grid. During peak hours, there is no import of energy from the grid. Grid power plunges down during peak hours when the ESS charged from solar cells and the grid during peak hours is utilized. Even during off peak hours, extra energy available in the storage system is sold back to the grid before it is replenished back to full capacity for peak hours.
In
Figure 9, the state of charge for both lead–acid and lithium-ion batteries is depicted. It can be seen that during off-peak hours, the lithium-ion battery is charged at a maximum value of 90%, and the lead–acid battery is charged up to 80%. During off-peak hours, the lithium-ion battery is discharged to 10% and the lead–acid battery is discharged to 30%.
5.3. Case 03: Inclusion of EV with the Grid, PV, and BESS
In this case, PV is utilized again with the electric vehicle and energy storage system. Electric vehicle leaves the home charged at full capacity of 16 kW at 8AM and returns at 4PM. In this case, the EV is bound to be charged from the ESS and the grid, and different operational costs have been observed. Both lead–acid and lithium-ion batteries are considered for this scenario.
Scenario 1 is observed with a lithium-ion battery storage system. Electric vehicles (EVs) are charged in both scenarios with the energy storage system and the grid, and their operational cost is observed. When the EV is exclusively charged by battery energy storage systems (BESS), the overall electricity rates fall down slightly. The operational cost for the particular scenario is USD 56.2602, which is less compared to the case when the EV is charged from grid. The cost when the EV is charged with the grid is USD 56.6473.
In
Figure 10, the power dynamics of grid battery energy storage systems (BESS) and electric vehicles (EVs) are outlined. When the EV is away from home during certain hours of the day, it is disconnected from residence. During this period, the load decreases since the battery is charged and discharged through solar cells, taking advantage of abundant solar energy. Upon the EV’s return home, there is a one-hour window to maximize its charging, coinciding with the start of off-peak hours at 17:00. Both the energy storage system and the battery contribute to meeting load requirements, reducing the need for grid procurement. After peak hours, when solar energy is unavailable, grid power is used to charge both the BESS and EV.
Figure 11 shows the state of charge of the lithium-ion battery when the EV is charged from the battery storage system and the grid. When the EV is charged from grid, the state of charge remains in the lower spectrum of values, signifying that even during non-peak hours, most of energy needs are filled with ESS to reduce the operational cost. But during peak hours, the battery is drained to a comparatively greater extent in the scenario when the EV is charged from grid.
Figure 12 below exhibits the power exchange with the grid in a case when the EV is charged exclusively from grid. Similar to the previous case, the grid BESS and EV operate as a cohesive energy system. During the EV’s downtime, solar power is harnessed for loads. Upon the EV’s return, during peak hours, along with ESS, it also provides power for loads, decreasing procurement from the grid. Post-peak, grid power steps in, charging both the BESS and the EV for sustained energy efficiency.
In the second scenario, a lead–acid battery is employed as the energy storage system. Unlike lithium-ion ESS, the lead–acid battery has a maximum state of charge set at 80%, and it can only discharge to 30% to ensure a longer lifespan. The daily operational cost in this situation is USD 59.2679 when the EV is charged from the grid and USD 58.0848 when charged from the ESS. The operational expenses incurred with the lead–acid battery are marginally higher than those associated with lithium-ion batteries in both cases, whether the EV is charged from the grid or the ESS.
Figure 13 illustrates the energy exchange pattern with the grid throughout various hours of the day while
Figure 14 shows state of charge of battery in the entire day. In the initial hours, the BESS undergoes charging until reaching its maximum capacity. Through the midday hours, solar energy availability enables the energy storage system to satisfy nearly all of the home’s energy demands. During peak hours, when the EV is accessible, a substantial supply of energy is jointly provided by both the EV and the energy storage system, leading to a reduction in grid procurement.
In
Figure 15, the power exchange and status of the electric vehicle and energy storage system are showcased throughout different daily hours, when the electric vehicle exclusively relies on grid charging. The observed pattern closely mirrors the prior scenario, showcasing a decrease in grid procurement during peak hours. Meanwhile, in off-peak hours, solar energy seamlessly meets the home’s energy demands and concurrently charges the battery storage for subsequent use during peak periods.
5.4. Case 04: Integration of Wind with the Grid, PV, BESS, and EV
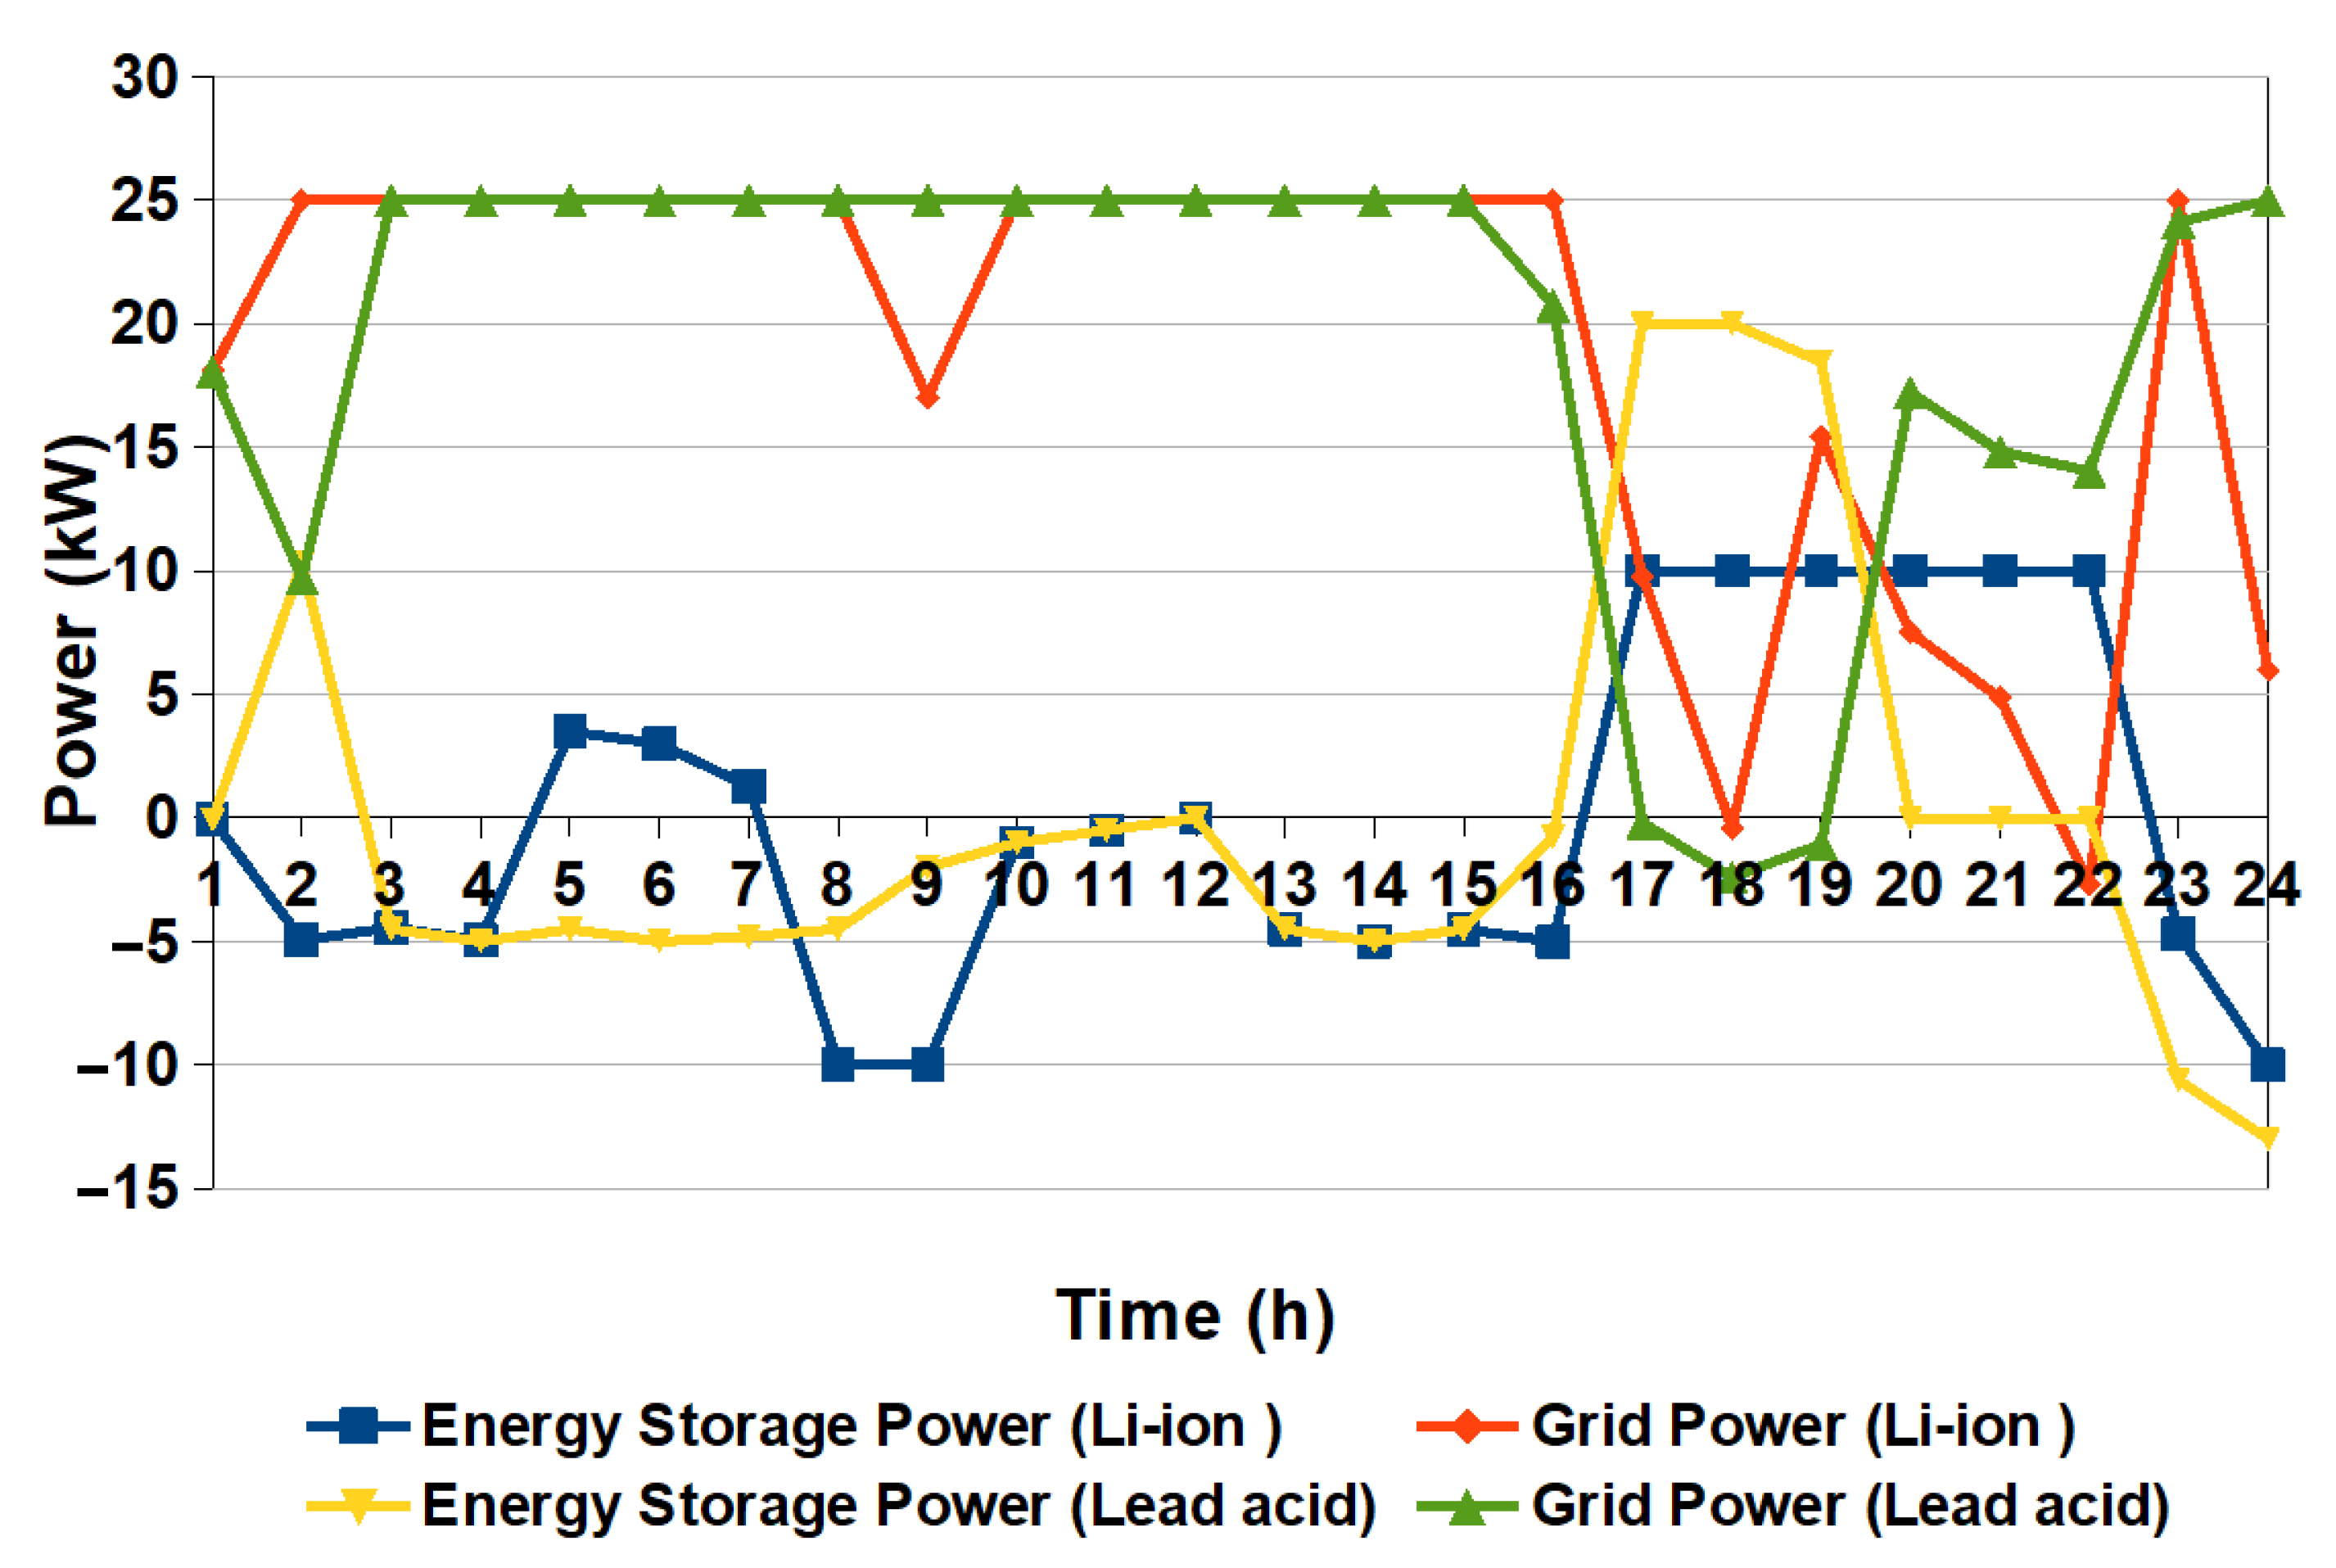
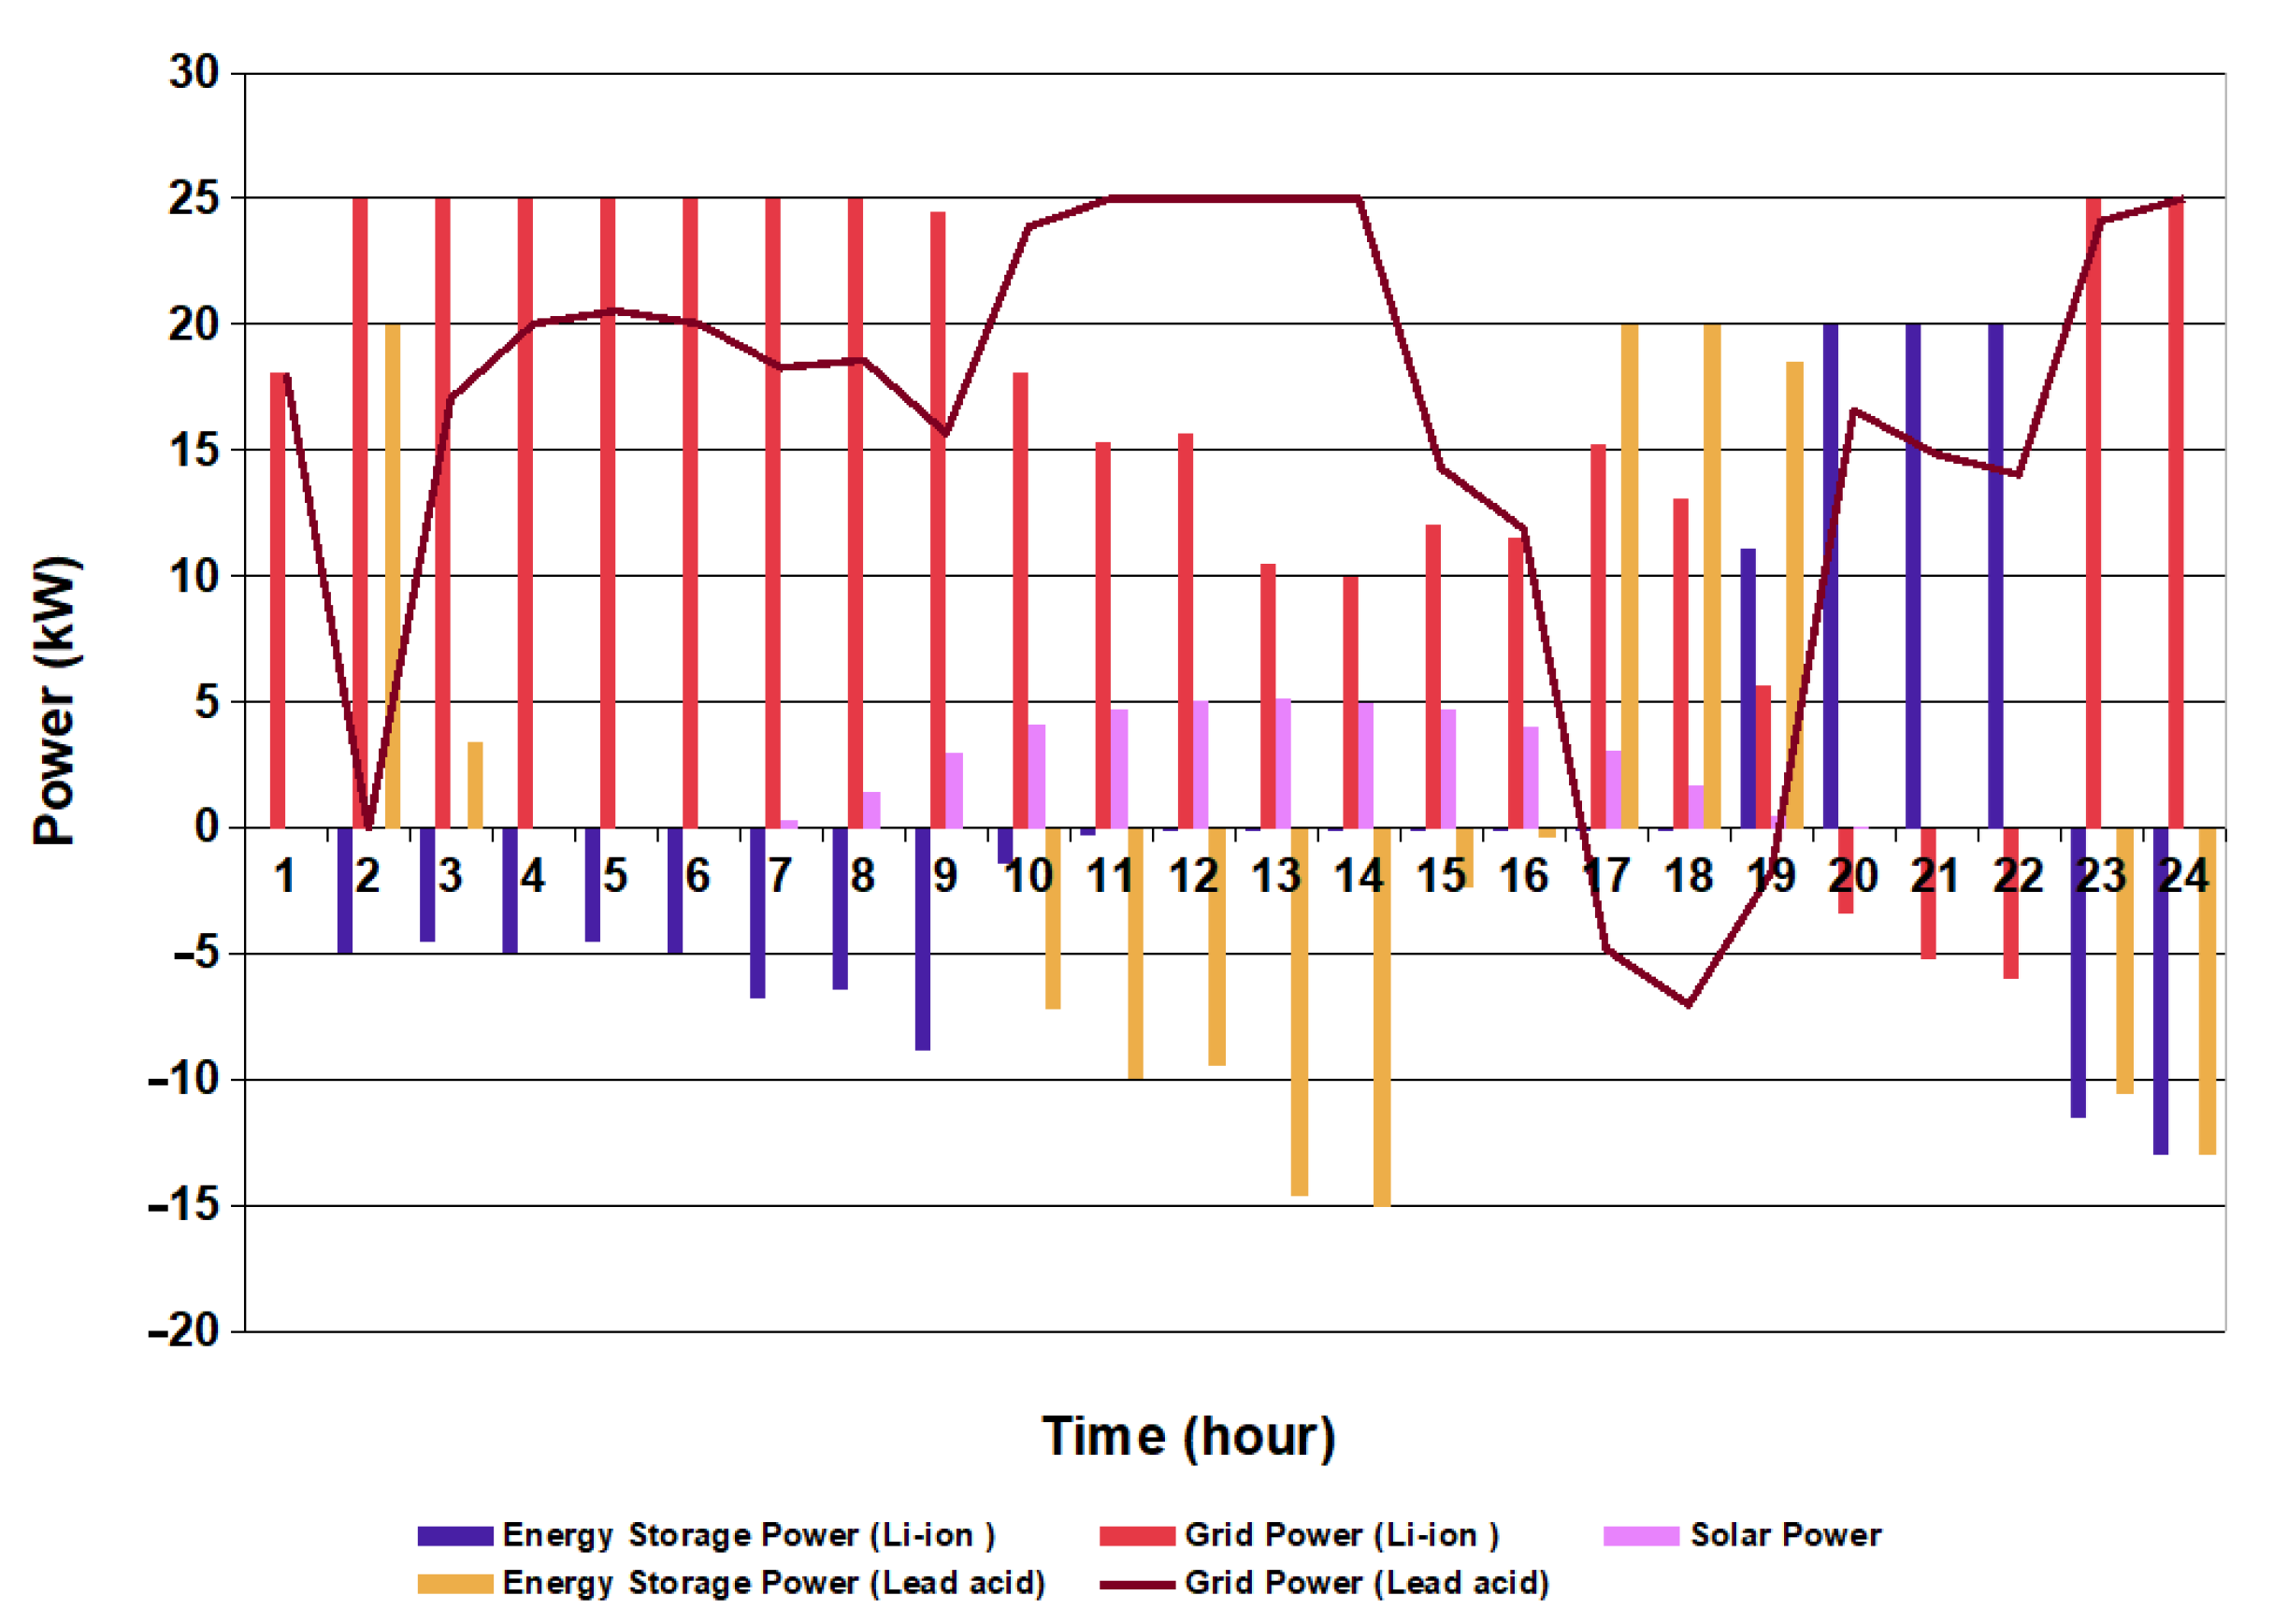
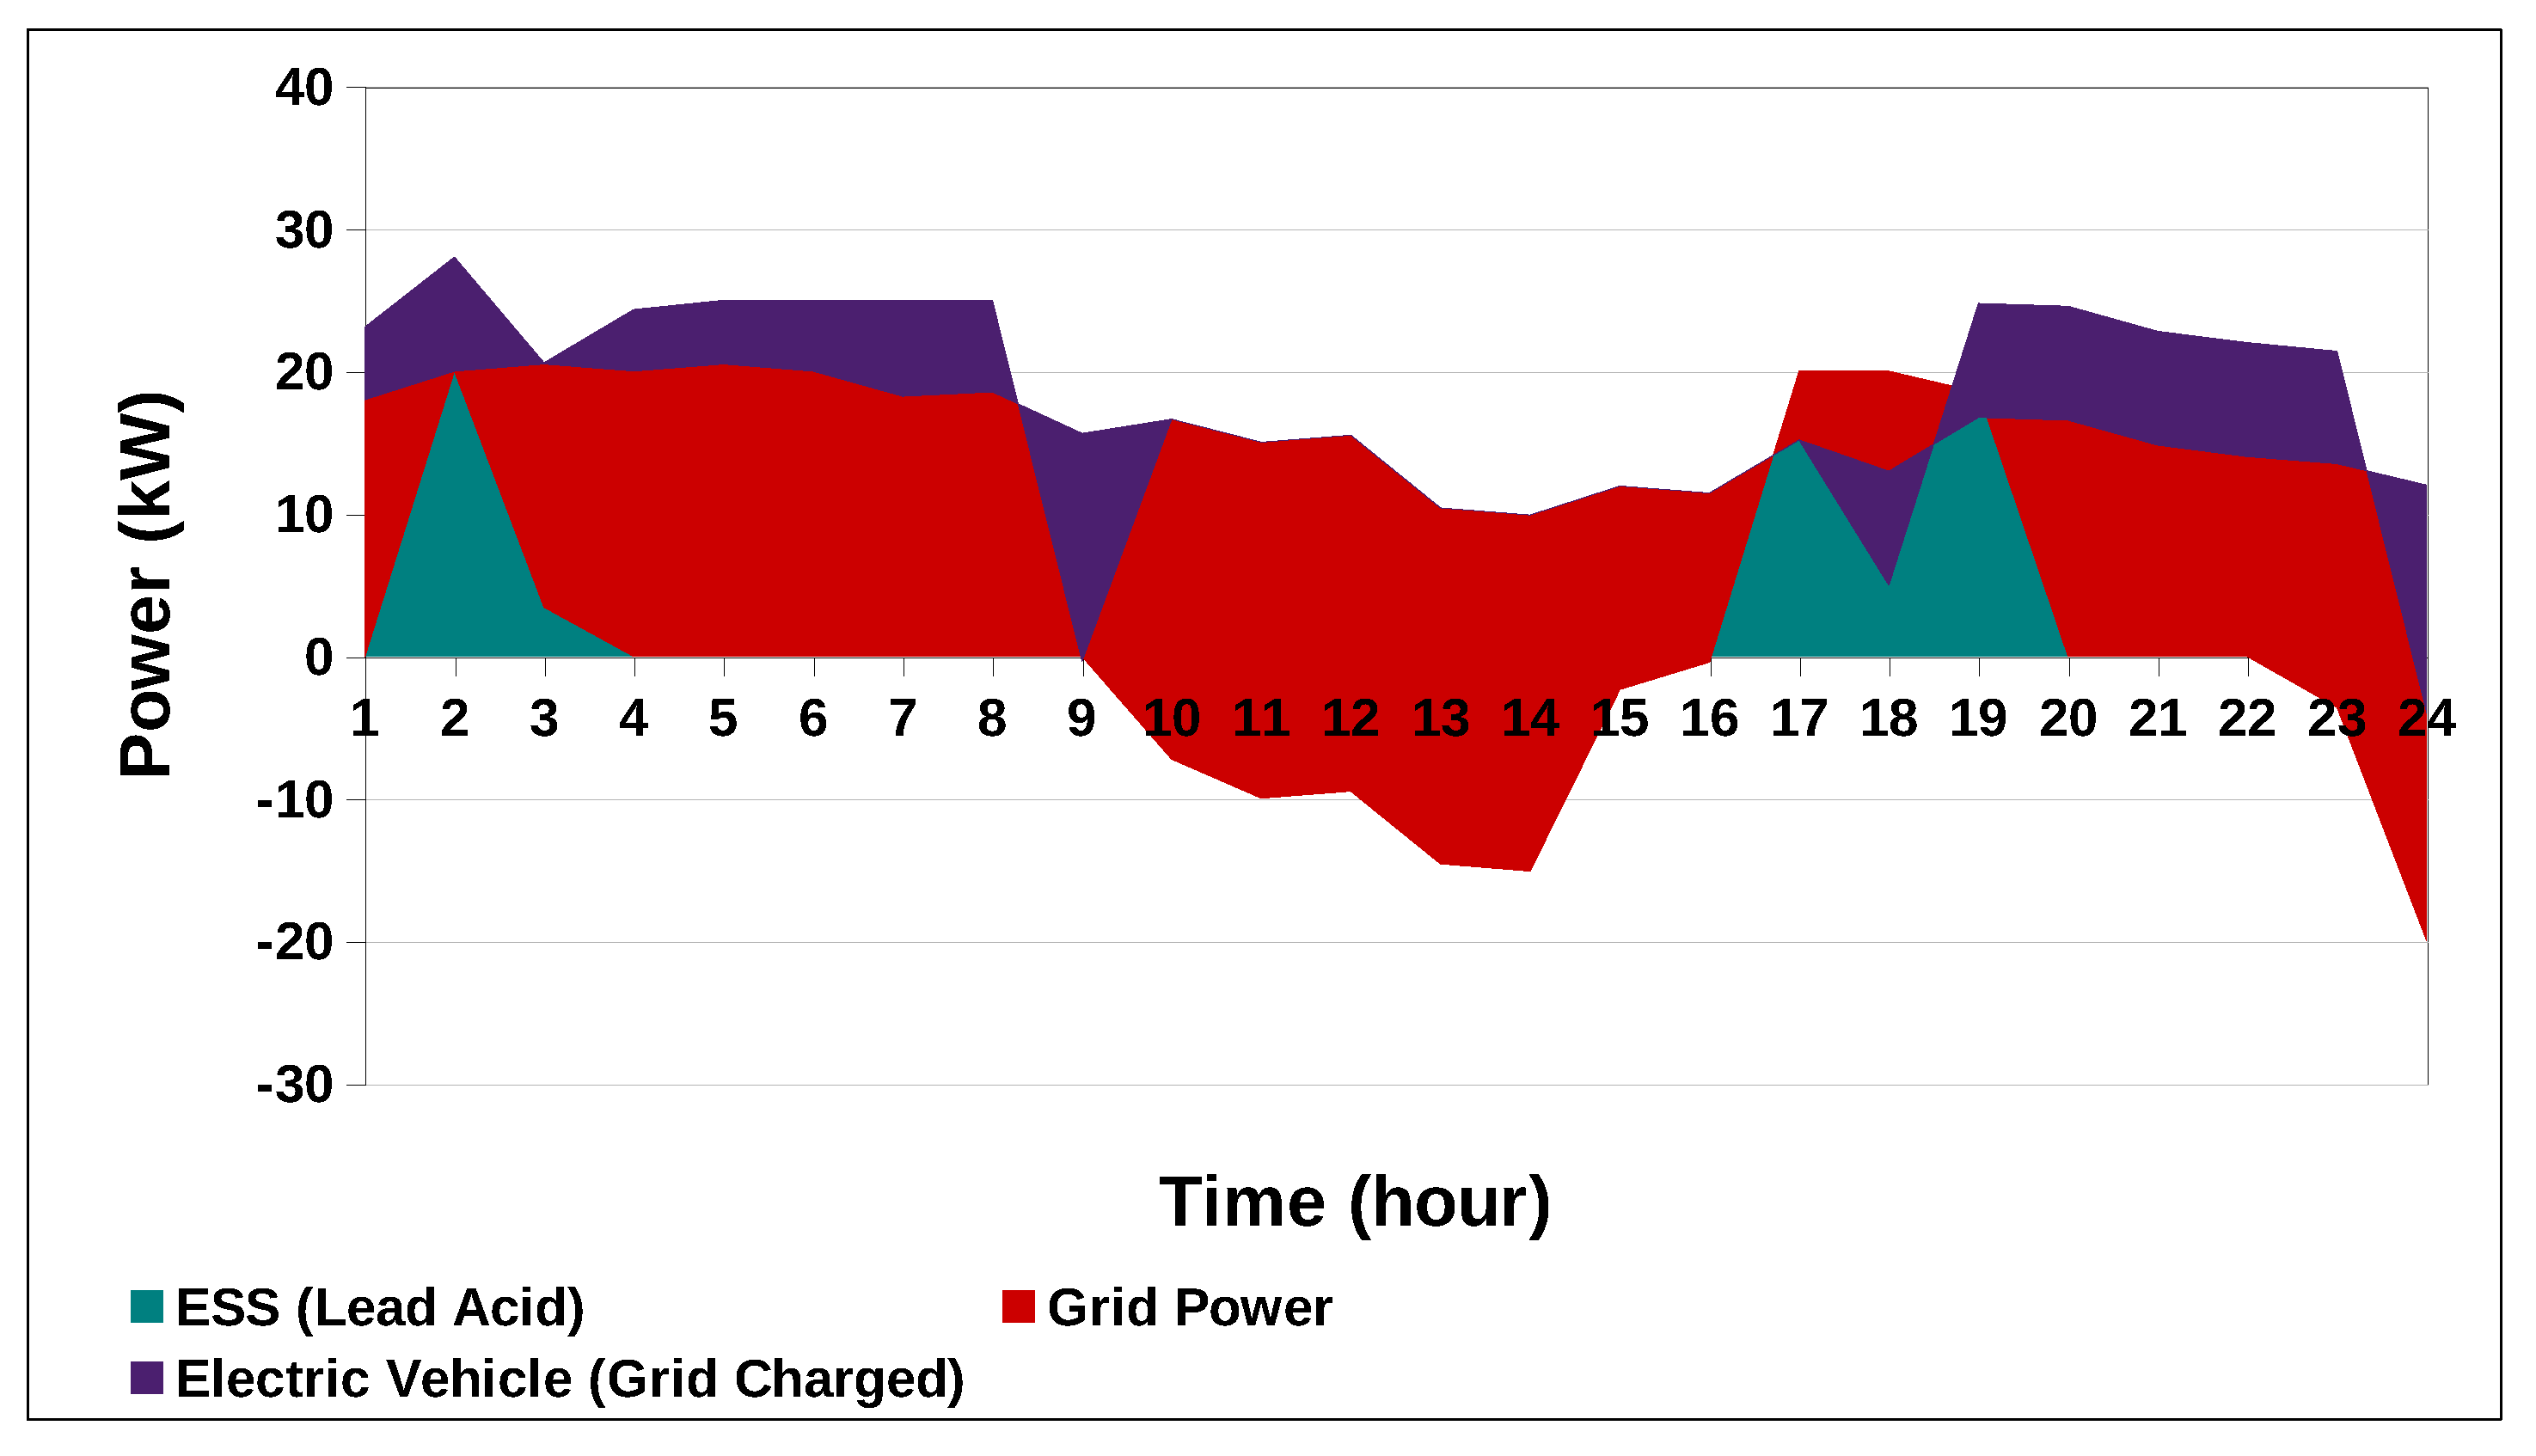
In this scenario, we have enhanced our energy system by introducing a 600 W wind turbine to complement the existing photovoltaic (PV) system, electric vehicle (EV), and battery energy storage system (BESS). The EV usage pattern remains consistent, with the vehicle being inactive between 8 AM and 4 PM. Within this context, we analyze the charging dynamics for EVs, considering both lead–acid and lithium-ion batteries. The strategy for charging the EV involves a combination of energy storage systems (ESS) and grid electricity, resulting in varying operational costs. When relying solely on grid energy for EV charging, the operational cost is USD 69.59 for lead–acid batteries and USD 69.53 for lithium-ion batteries. However, when utilizing ESS energy, the operational cost decreases to USD 68.42 with lead–acid batteries and USD 68.80 with lithium-ion batteries.
Figure 16 illustrates the energy exchange pattern with the grid when charging the EV from either ESS or the grid in the case of a lithium-ion battery energy storage system. In both scenarios, whether charging from the grid or ESS, during peak hours, power export from the grid decreases while most of the household load is supplied by either the EV or ESS.
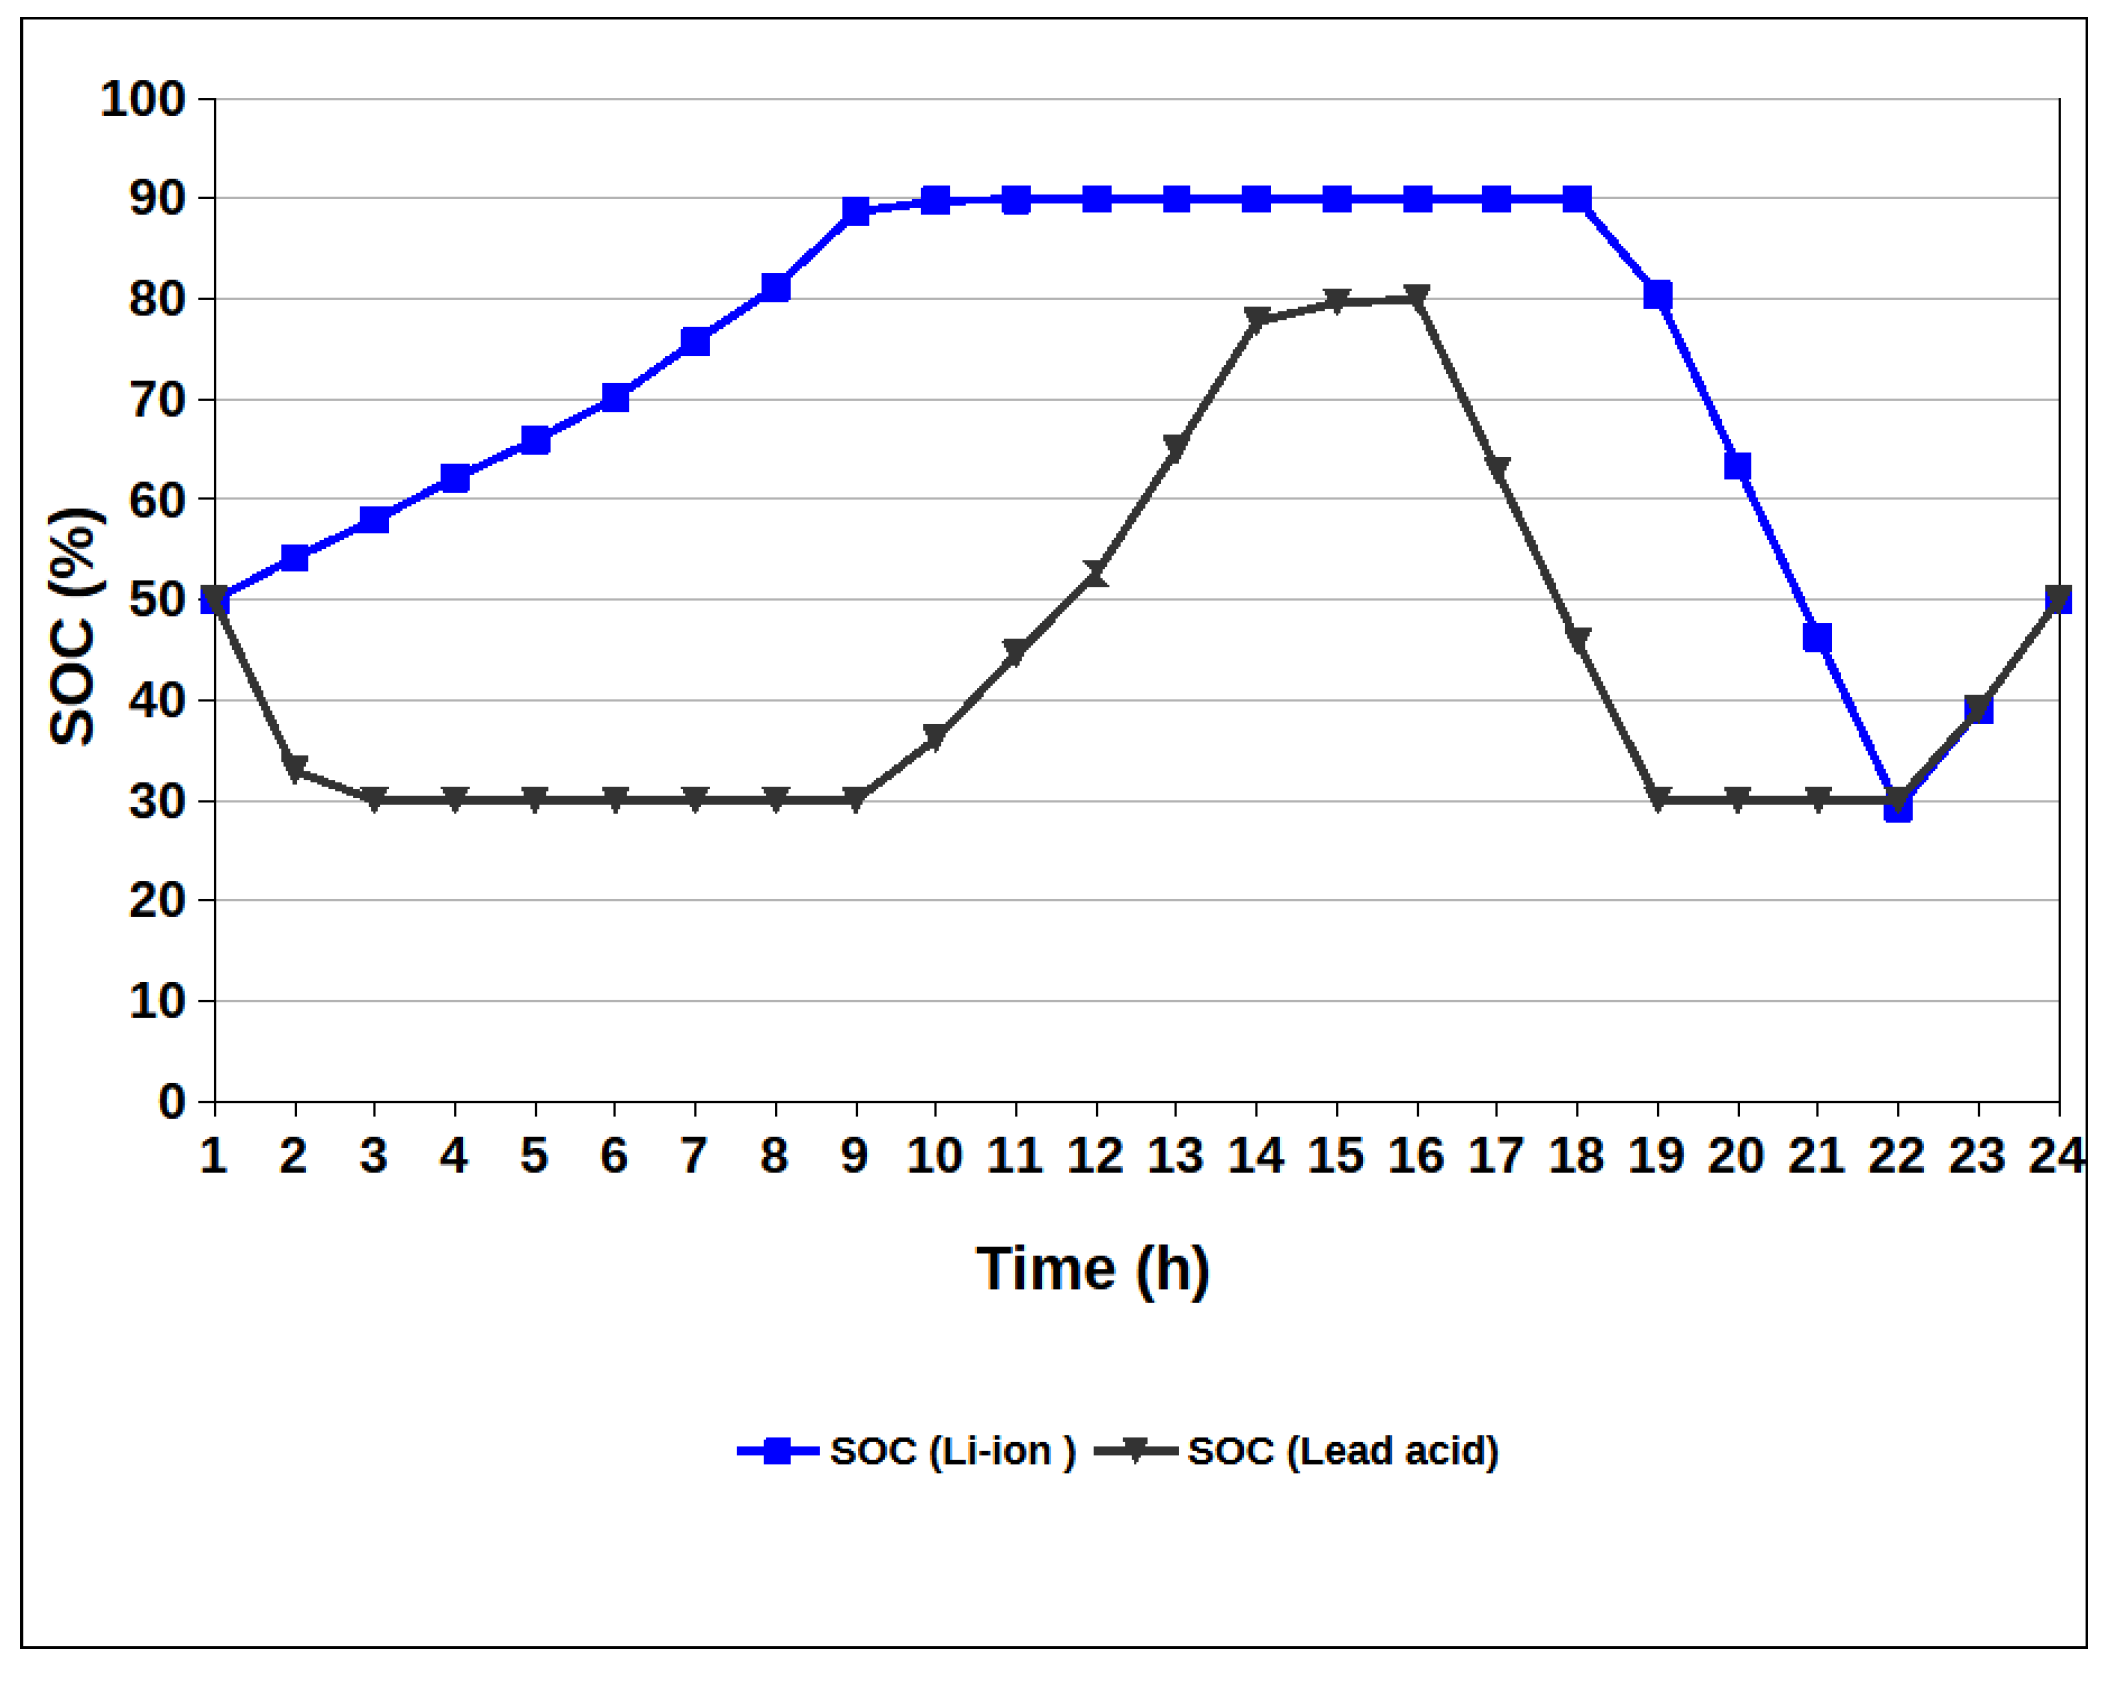
Illustrated in
Figure 17 are the variations in the battery's state of charge during both instances of EV charging. It is evident that as the peak hours commence, the state of charge gradually diminishes, reaching a minimum before stabilizing at 50% at the beginning of the next day. Subsequently, the battery is charged to its full capacity just before the onset of the next peak hours. This cyclical pattern highlights the dynamic charging and discharging of the battery system, strategically managing energy reserves to optimize performance during peak demand periods.
Given the specific limitations imposed on the lead–acid battery, where the maximum state of charge is capped at 80% and the discharge capacity is restricted to 30%, the power exchange and state of charge (SOC) profiles exhibit a distinctive pattern. Notably, during peak hours, the power import from the grid is minimized, with both the energy storage system (ESS) and electric vehicle (EV) playing crucial roles in meeting the load demands. However, it is important to note that because of different constraints on charging and discharging, the lead–acid batteries exhibit a different dynamic compared to lithium-ion batteries. Although the overall levelized cost of lead–acid batteries is lower, their effectiveness is limited by these constraints. Consequently, the operational cost is higher when compared to lithium-ion batteries. In summary, while lead–acid battery storage systems offer a cost advantage, their operational efficiency is compromised due to the restricted limitations on charging and discharging values. This makes lithium-ion batteries a more effective and versatile option in this energy setup.
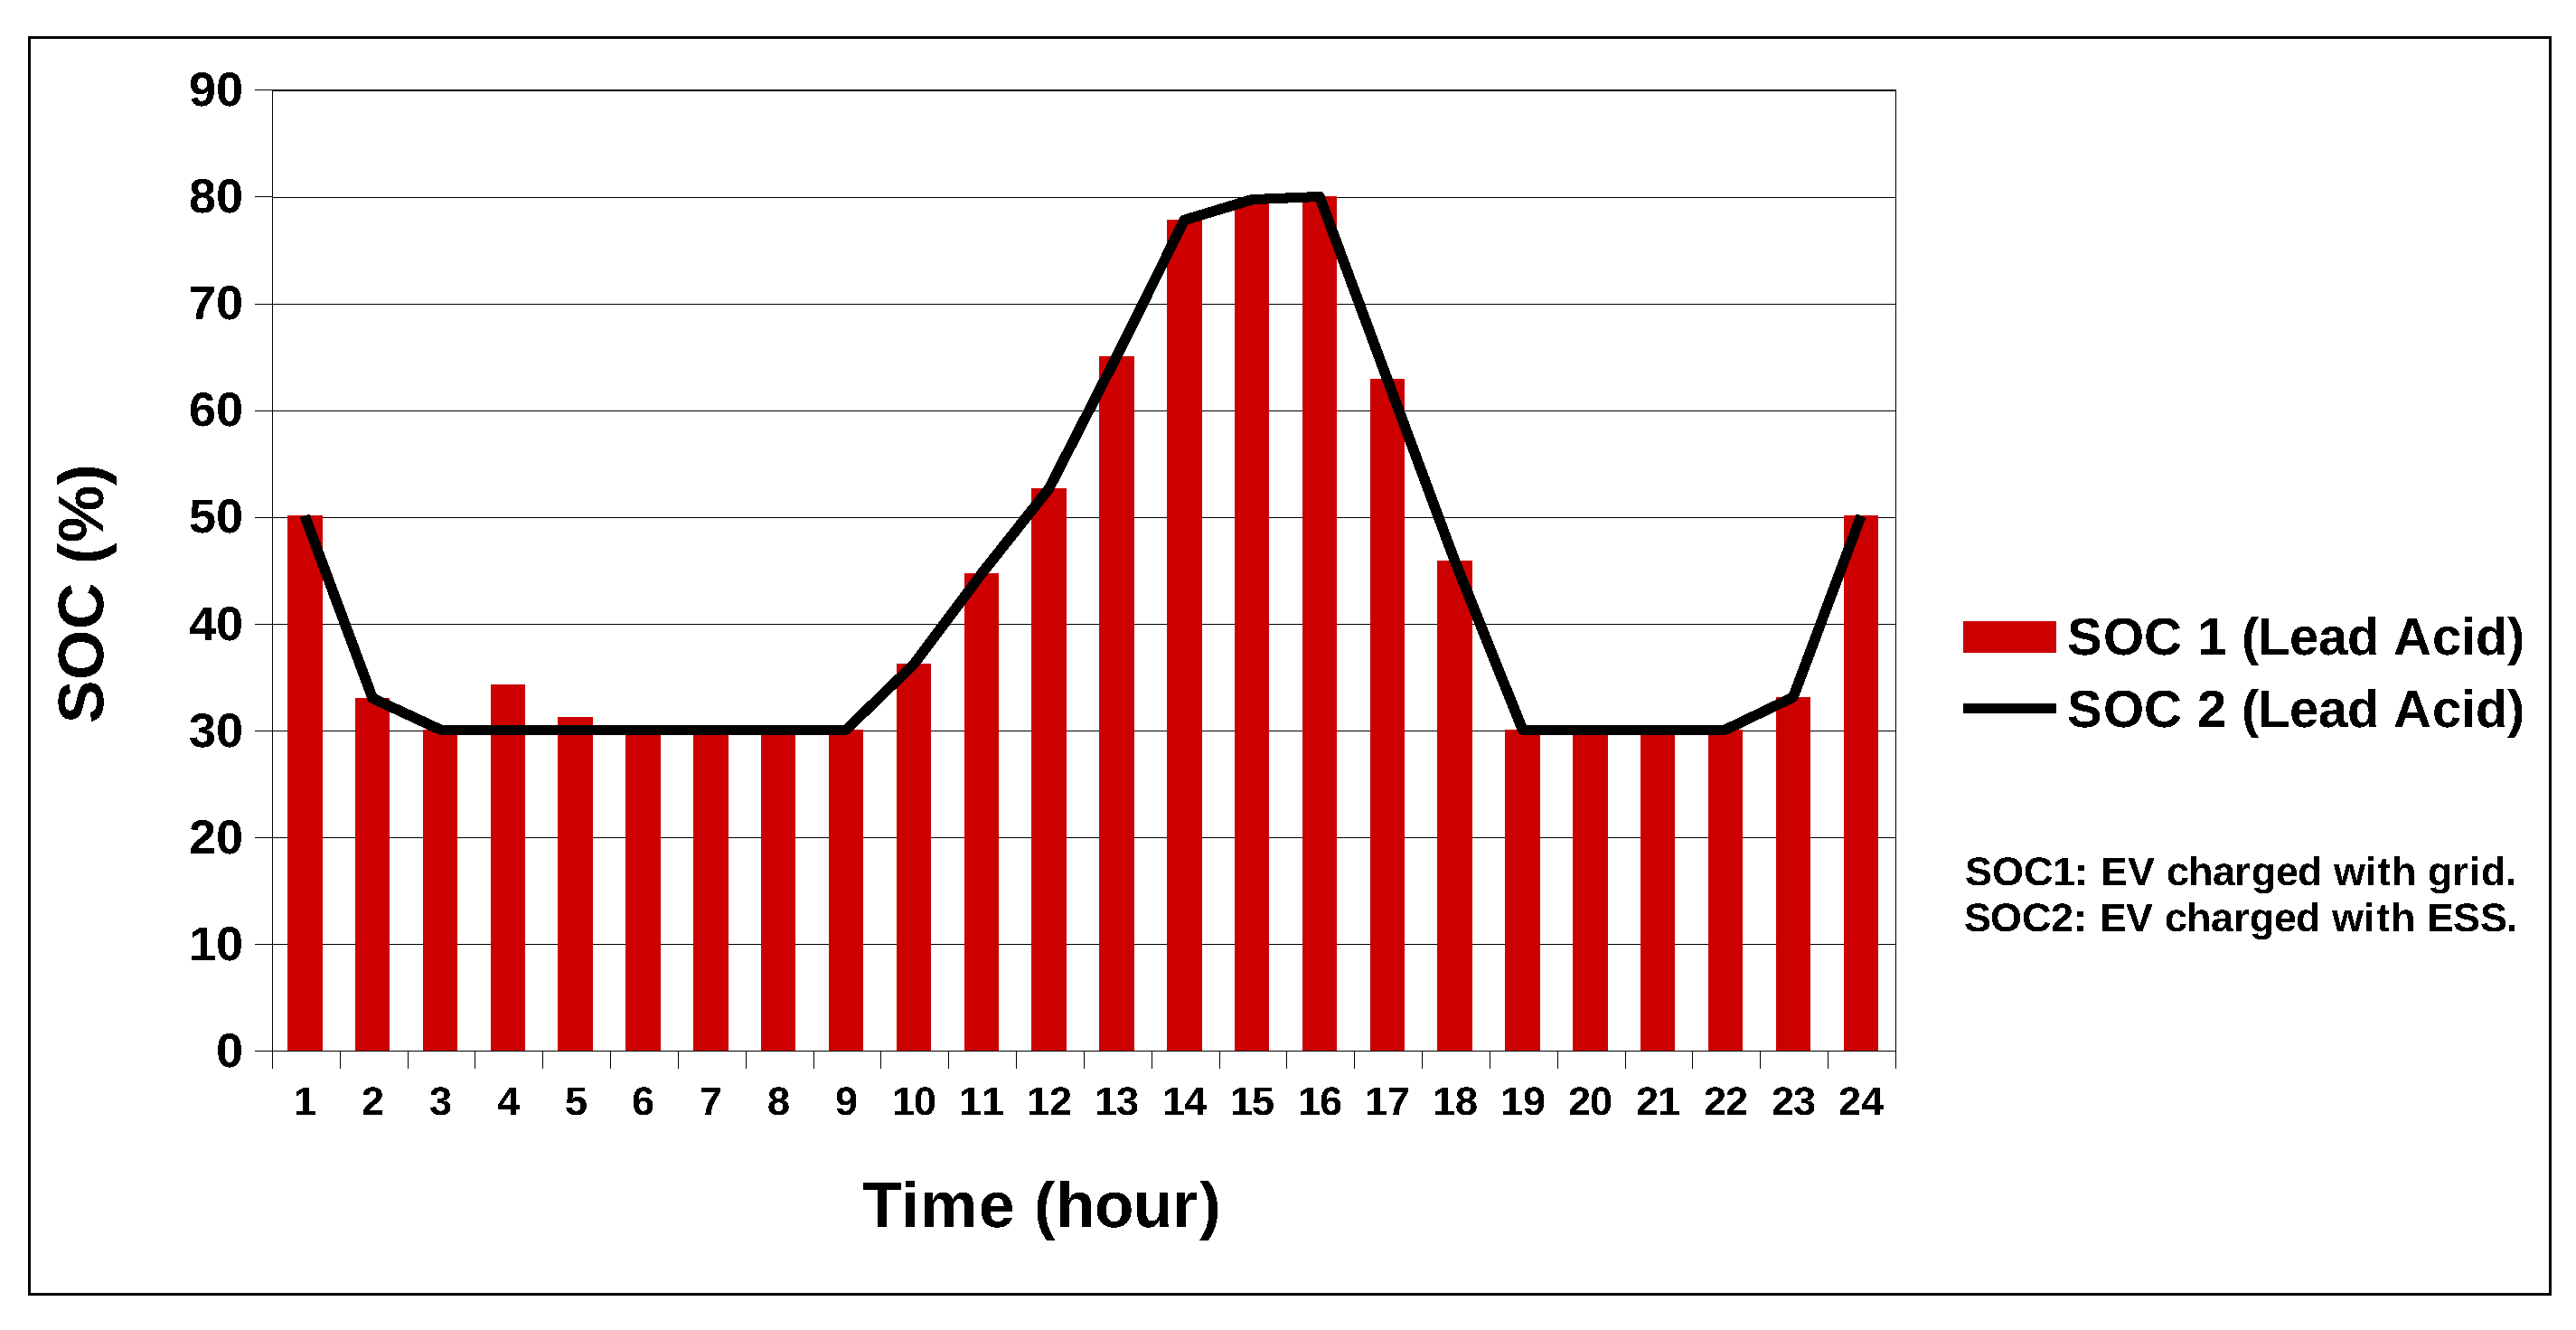
The graphical representation in
Figure 18 illustrates the state of charge (SOC) of the lead–acid battery. When the electric vehicle (EV) is charged using the battery energy storage system (BESS), a distinctive pattern emerges. Notably, during the initial hours of the day, from 1:00 to 6:00, the state of charge of the battery remains relatively low. It gradually rises, reaching up to 80% just before the commencement of peak hours. However, during the peak hours themselves, there is a significant reduction in the state of charge, dropping down to the predetermined lower constraint of 30%. The SOC profile reveals in
Figure 19 that the battery deliberate discharges during peak hours responding to the imposed constraint. This dynamic charging and discharging pattern is a strategic approach to manage and optimize the battery's performance within defined operational parameters.
Overall, the cost reduction in this case is much lower compared to the base case despite the higher levelized cost of wind energy, which is 0.7 USD/Kwh. Due to lower wind speeds, the operational cost is very high, and the wind turbine generates very low units throughout the entire day as calculated from Monte Carlo simulations and from data obtained from the literature as well [
60]. The reduction in carbon emission is a little higher—that is, up to 36,968 grams/day—but the operational cost is very high. The cost reduction in the case of lead–acid battery is only 0.28% compared to base case, while the operational cost remains same in case of the lithium-ion battery energy storage system.
6. Energy Market and Economical Analysis
The cases which are discussed above present a dynamic interplay between energy market and prosumer. By employing multi-energy storage systems and renewable energy sources, a system is proposed which reduces the operational costs, favoring the consumer, and the carbon emission is also lowered, which benefits the utility. This article explores the implementation of the time-of-use (TOU) technique as a demand response strategy, wherein electricity prices fluctuate between peak hours (17:00–22:00) and non-peak hours. The underlying assumption is that consumers have ceded control of their electrical loads to the utility. During peak hours, consumers autonomously reduce their reliance on the grid for energy, leveraging battery management systems and renewable energy sources. This strategic shift in energy consumption results in a noteworthy reduction in overall operational costs, with the potential to decrease bills by 18.2% in the most favorable scenarios. This dual benefit positively impacts both consumers and the grid by fostering a more sustainable and cost-effective energy ecosystem.
In the context of non-peak hours, where energy demand is less, surplus energy generated by solar panels is harnessed. After charging batteries, any excess energy is exported back to the utility. This not only provides consumers with additional incentives but also assists the utility in diminishing its dependence on fossil fuels. Consequently, this practice contributes to a substantial reduction in carbon emissions, which helps the utility in avoiding carbon taxes and reducing peak-hour load as well. By strategically redistributing the load traditionally experienced during peak hours to non-peak periods, this approach optimizes energy distribution and consumption patterns. The synergy between consumer behavior, renewable energy utilization, and grid management emerges as a powerful strategy that not only enhances energy efficiency but also aligns with sustainability goals, making it a win–win for both consumers and the broader energy infrastructure. The implementation of batteries as a storage system poses some challenges as well. The first and foremost challenge in the battery energy storage system is the heavy initial cost. Even though considerable research has been conducted to make batteries more economical, battery storage system is costly. Other than this, they require a huge amount of space to be installed, depending upon the size of the system. Ensuring the proper installation of the battery storage system and compliance with safety regulations can add further complexities to the system and further increase the cost of the system. In some of regions, regulatory policies related to net metering and grid connection might pose some challenges for homeowners and may impact the feasibility of energy storage systems.
Table 3 below presents a comparison of the operational cost in the different scenarios considered in the study.
7. Life Cycle Assessment
Renewable energy exhibits a positive impact on the environment by reducing green gas emissions, minimizing air and water pollution, and uplifting energy independence. These sources play a pivotal role in phasing out fossil fuels. Likewise, there are some negative factors, including habitat disruption, resource extraction, visual and noise disturbances, and challenges in end-of-life disposal. It is essential to establish a balance between the advantages of renewable energy and the potential detrimental effects on the environment while promoting sustainable practices and technical advancement by considering life cycle assessment. In this study, we have considered life cycle assessment in terms of energy payback time.
Energy Pay Back Time
The EPBT has gained popularity as a commonly utilized parameter, owing to its easily interpretable input–output format. Its calculation method is simplified and can be expressed as follows [
61,
62]:
In Pakistan, the energy payback period of solar modules of 500 Wp is between 1.12 years to 1 year as shown in
Figure 20 depending upon solar irradiance and average peak sunshine hours. The three regions are the most feasible locations for PV system installation. The project is installed in the region of Punjab so pay back time is around 1.2 years as shown in
Figure 20.
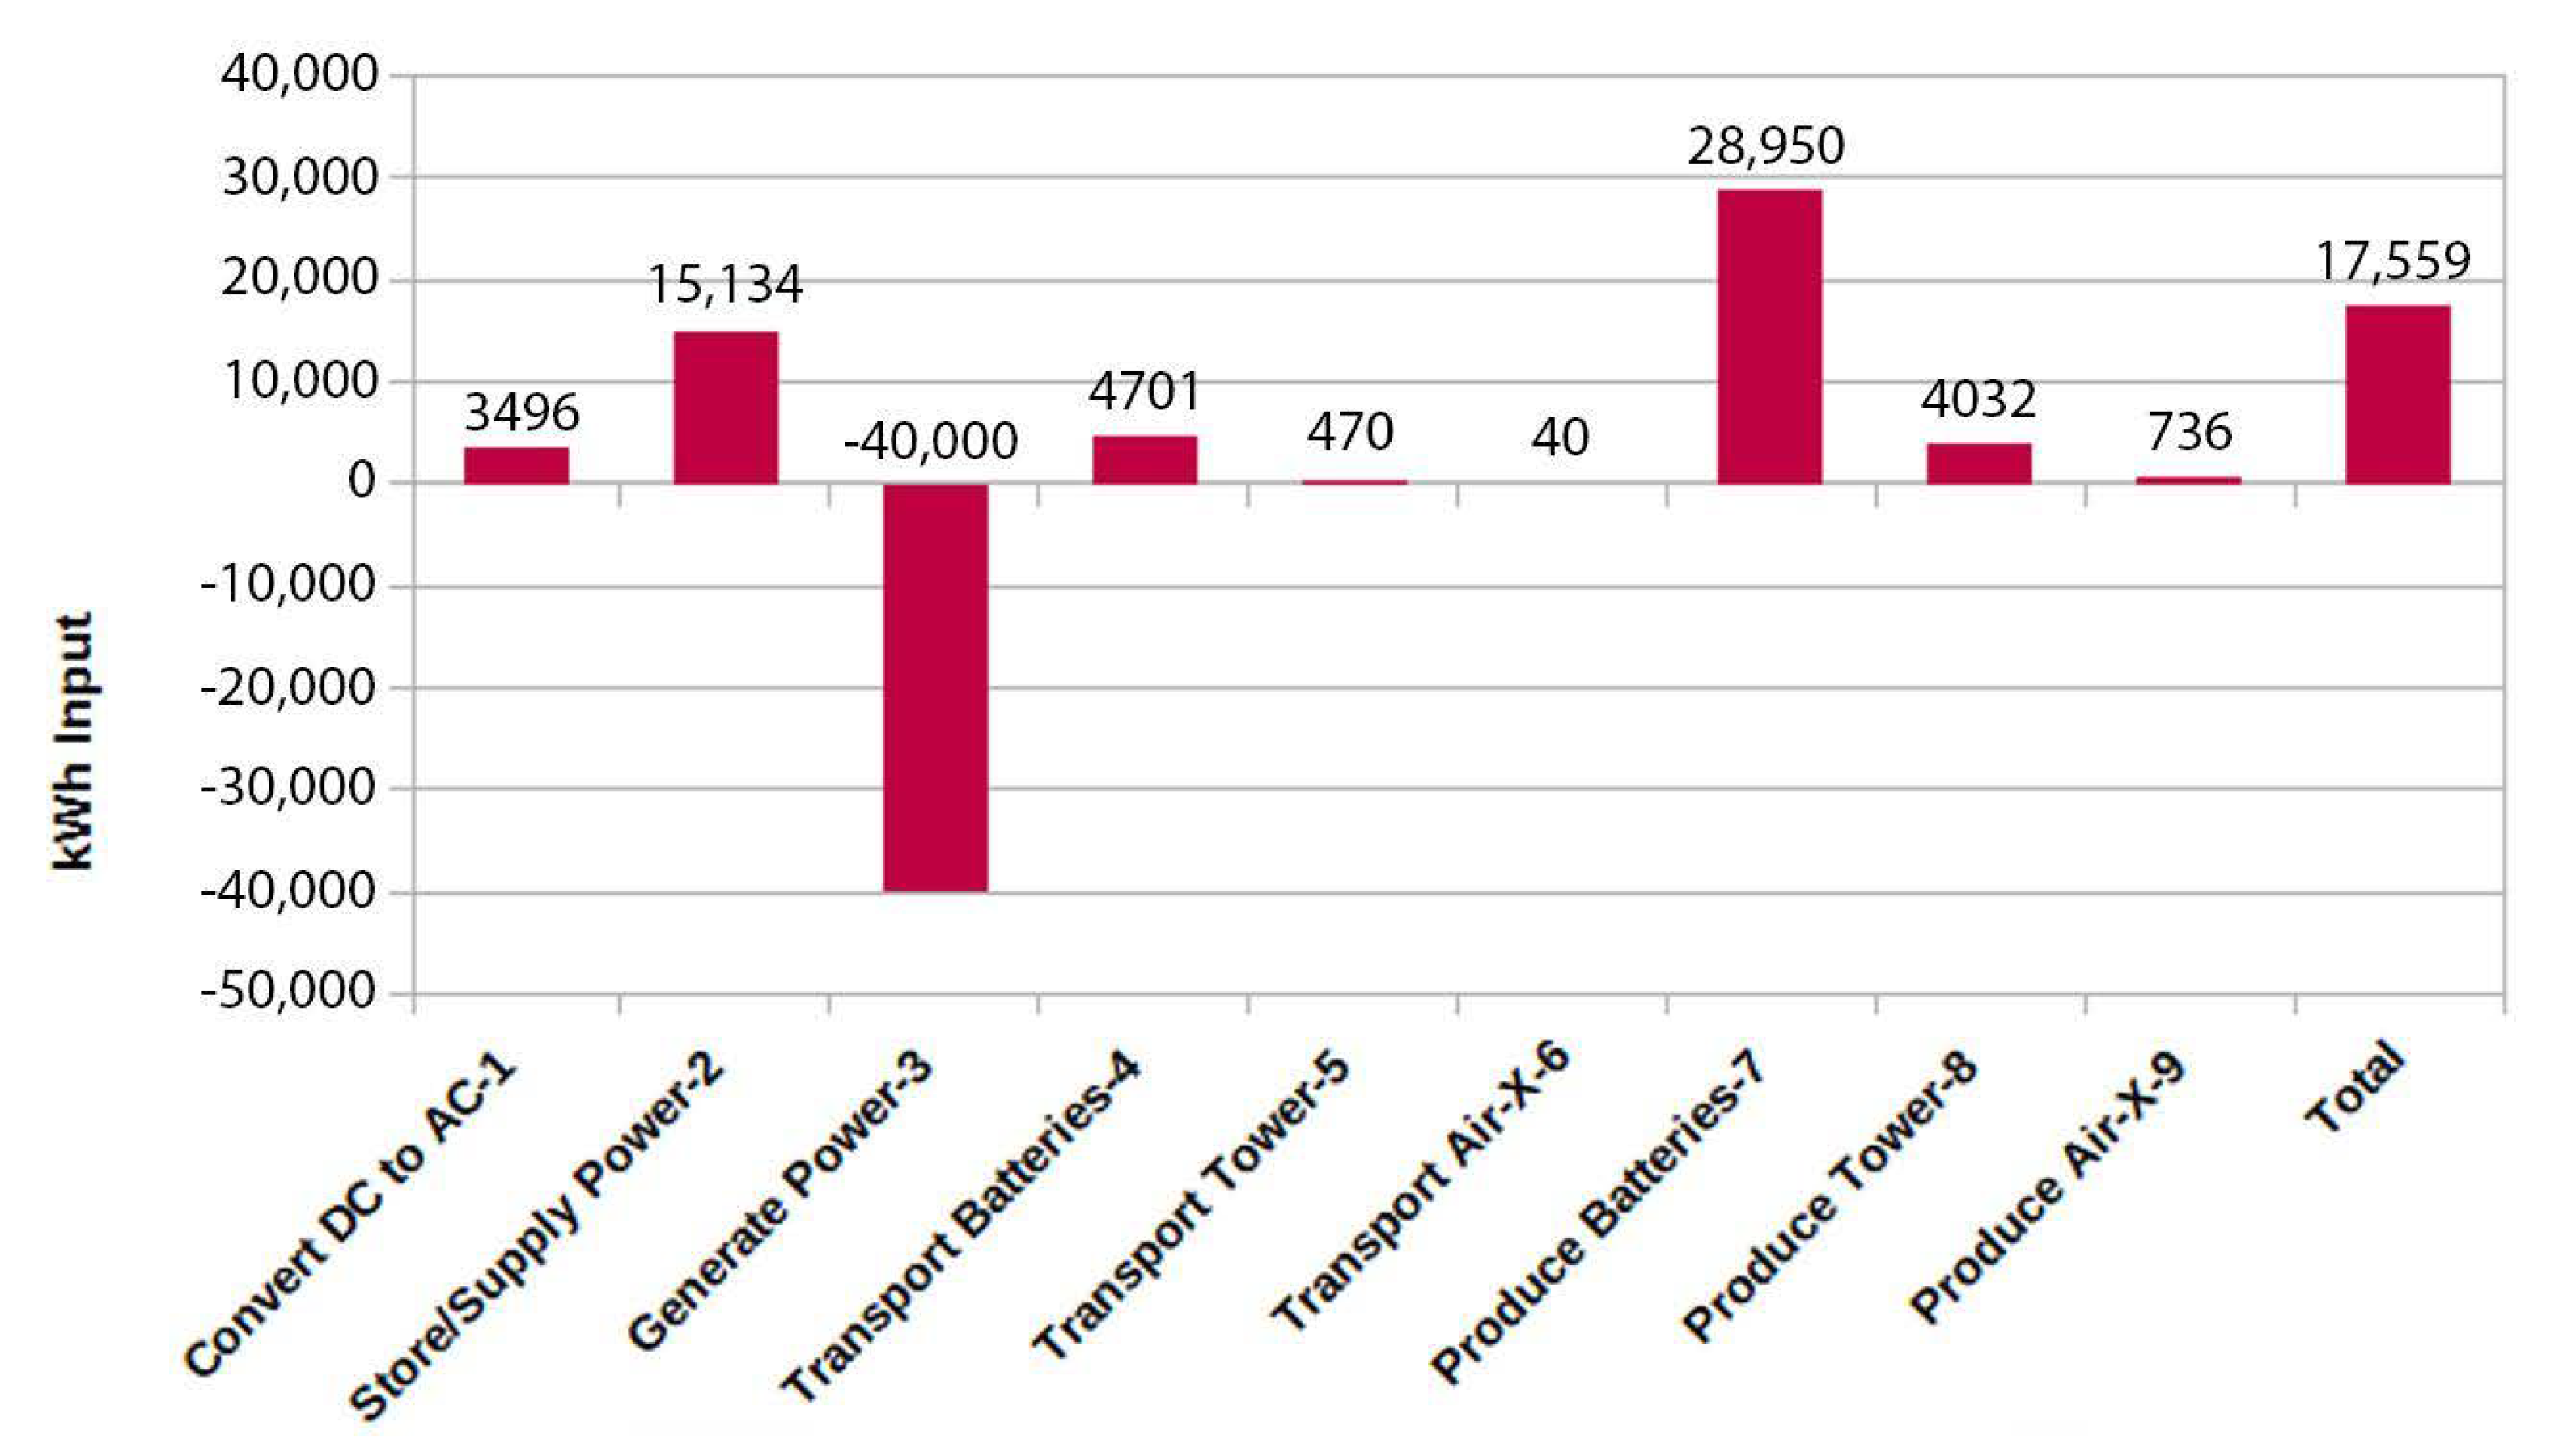
The wind turbine system does not produce sufficient energy over its life cycle because of poor wind speed in the region.
Figure 21 shows that the wind turbine system is unable to produce enough energy due to the average low wind speed being unable to reach the cut-in speed of the turbine.
Figure 21 shows the approximated wind energy over a lifetime of 20 years in the negative bar, while all the positive bars show the energy used in production. The comparison of both graphs reveals that solar PV is more feasible and beneficial in terms of energy payback time [
63].
8. Renewable Energy in Pakistani Perspective: Benefits and Challenges
Pakistan is a developing country, and the rising population is paralleled by a surging demand for energy. This presents a formidable challenge for the utilities and energy suppliers. The issue of rising energy demands can be solved by embracing a prosumer-based market with distributed energy resources (DERs). This transformative approach would empower consumers to become producers of energy and take part in the energy market. Furthermore, this would also alleviate the strain on the utility grid, particularly during peak hours. As Pakistan continues to burgeon as a growing economy, the conventional practice of time-based load shedding during peak demand periods can be mitigated through the transition towards a market structure consisting of prosumers and distributed energy sources. In this paradigm shift, consumers would not merely be passive recipients of energy; they would actively contribute to the market, leveraging from DERs. This shift would foster a dynamic energy ecosystem wherein individuals and businesses would not only generate and consume their energy but would even sell surplus energy. The adoption of a prosumer-based market structure offers multi-faceted benefits. This dynamic change not only aligns with global trends in sustainable energy but also propels Pakistan towards a more resilient and adaptive energy infrastructure. As the nation continues on its route of economic growth, a prosumer-oriented market can serve as a catalyst for sustainable development.
In Pakistan, only the TOU demand response technique is employed to reduce both peak loads and operational cost. But other demand response techniques like real-time pricing (RTP) and peak-time pricing (PTP) can also be considered, which would not only enhance the consumer participation in the energy market but also bring forth a reduction in the operational cost and peak load as well. More energy storage systems like fuel cell, hydrogen-based energy storage systems, and the latest batteries, which are more efficient, can also be utilized, which would further improve the proposed system. This would be considered in future studies.
Implementing renewable energy systems in the residential areas of developing countries like Pakistan faces several challenges. One major issue is the cost; setting up renewable energy and storage systems can be expensive, which might deter people with average incomes from installing them. Additionally, there is a lack of technical expertise among residents with regard to installation and maintenance. Many people are not aware of how to manage their energy usage efficiently or the benefits of demand response techniques. Residents also encounter bureaucratic hurdles when trying to acquire permits for installing renewable energy systems. This red tape can discourage people from making the switch. Moreover, there are complications with net metering policies and connecting renewable energy systems to the grid, making it difficult for homeowners to sell excess energy back to the grid due to the grid's structure. Overall, challenges like cost, lack of expertise, bureaucratic obstacles, and grid-related issues, can hinder the adoption of renewable energy systems in the residential areas of countries like Pakistan.
On the brighter side, a comparison of the existing system with some of the existing literature has indicated a reduction in both cost and CO
2 emission.
Table 4 presents the comparison of the proposed work with existing work in the literature.
9. Conclusions
This paper focuses on optimizing diverse energy sources to effectively manage the electrical load of a residential building of 25 kW load situated in Lahore, Pakistan. The proposed system integrates various renewable energy sources, a battery storage system, and an electric vehicle (EV), all of which are connected to a bidirectional energy meter aimed at minimizing electricity expenses. This study explores different scenarios involving both lithium-ion and lead–acid battery energy storage systems, employing varied charging schemes for the EV. Employing the TOU demand response technique, our findings reveal that utilizing grid power alongside solar PV energy, energy storage systems, and an EV leads to significantly lower operating costs compared to alternative scenarios. Specifically, compared to the base case involving only the grid and battery energy storage system, a cost reduction of 14.88% is observed with lead–acid battery energy storage, while an 18.26% cost reduction is noted with a lithium-ion battery. This study contributes to the broader goal of achieving low carbon energy in the future. The findings from our research indicate that by intelligently employing distributed energy sources along with battery storage systems, we can reduce both costs and carbon emissions. This study lays the foundation from which researchers may propose regulatory frameworks and policies to ease the inclusion of distributed energy systems in residential buildings and the national grid. Future studies should also focus on enhancing energy literacy among consumers to promote their active engagement in the energy market, as well as their knowledge of demand response techniques to ensure the efficient operation of the energy market. In future studies, the authors also aim to consider new energy sources like micro turbines, biomass with the hydrogen-based energy storage system, and the risk-averse power system.


 ,
, 


