Article

Changes in Concurrent Meteorological Extremes of Rainfall and Heat under Divergent Climatic Trajectories in the Guangdong–Hong Kong–Macao Greater Bay Area

1
College of Architecture and Urban Planning, Guangzhou University, Guangzhou 510006, China
2
Architectural Design and Research Institute, Guangzhou University, Guangzhou 510405, China
3
Guangdong Provincial Key Laboratory of Petrochemical Pollution Processes and Control, School of Environmental Science and Engineering, Guangdong University of Petrochemical Technology, Maoming 525000, China
4
State Key Laboratory of Subtropical Building Science, School of Civil Engineering and Transportation, South China University of Technology, Guangzhou 510641, China
5
College of Design and Innovation, Tongji University, Shanghai 200092, China
6
Bartlett School of Architecture, University College London, London WC1N 1EH, UK
7
School of Civil and Environmental Engineering, Nanyang Technological University, Singapore 639798, Singapore
*
Authors to whom correspondence should be addressed.
Sustainability 2024, 16(5), 2153; https://doi.org/10.3390/su16052153
Submission received: 22 January 2024 / Revised: 26 February 2024 / Accepted: 1 March 2024 / Published: 5 March 2024
(This article belongs to the Section Air, Climate Change and Sustainability)

Abstract

:
Concurrent meteorological extremes (CMEs) represent a class of pernicious climatic events characterized by the coexistence of two extreme weather phenomena. Specifically, the juxtaposition of Urban Extreme Rainfall (UER) and Urban Extreme Heat (UEH) can precipitate disproportionately deleterious impacts on both ecological systems and human well-being. In this investigation, we embarked on a meticulous risk appraisal of CMEs within China’s Greater Bay Area (GBA), harnessing the predictive capabilities of three shared socioeconomic pathways (SSPs) namely, SSP1-2.6, SSP3-7.0, and SSP5-8.5, in conjunction with the EC-Earth3-Veg-LR model from the CMIP6 suite. The findings evidence a pronounced augmentation in CME occurrences, most notably under the SSP1-2.6 trajectory. Intriguingly, the SSP5-8.5 pathway, typified by elevated levels of greenhouse gas effluents, prognosticated the most intense CMEs, albeit with a temperate surge upon occurrence. Additionally, an ascendant trend in the ratio of CMEs to the aggregate of UER and UEH portends an escalating susceptibility to these combined events in ensuing decades. A sensitivity analysis accentuated the pivotal interplay between UER and UEH as a catalyst for the proliferation of CMEs, modulated by alterations in their respective marginal distributions. Such revelations accentuate the imperative of assimilating intricate interdependencies among climatic anomalies into evaluative paradigms for devising efficacious climate change countermeasures. The risk assessment paradigm proffered herein furnishes a formidable instrument for gauging the calamitous potential of CMEs in a dynamically shifting climate, thereby refining the precision of prospective risk estimations.

1. Introduction

Anthropogenic endeavors and the ensuing global climatic perturbations have precipitated an alarming escalation in the frequency and magnitude of Urban Extreme Heat (UEH) and Urban Extreme Rainfall (UER) events [1]. UEH and UER are unusually high temperatures and unusually intense precipitation events that occur in urban areas and are well above the multi-year average daily maximum temperature and rainfall. However, concurrent meteorological extremes (CMEs), epitomized by the simultaneous manifestation of dual climatic extremes, exert a more pronounced deleterious impact than their singular counterparts [2]. Such events not only imperil ecosystems, escalating water and energy demands, inducing thermal stress on biota, and diminishing ecosystem service diversity, but also pose grave threats to human health [3,4]. Forecasts suggest an inexorable rise in the frequency and duration of such climatic aberrations [1,5], underscoring the urgency for meticulous CME risk assessments, particularly those tethered to UEH and UER, to preempt and attenuate potential calamities [6].
Conventionally, a CME is delineated as the concurrence of a UEH within a temporal window of seven days, either antecedent or subsequent to a UER [7,8]. Two salient sequences emerge: the first, where UEH precedes UER, is modulated by macroscopic thermodynamics, circulatory shifts, and intricate land–sea–atmospheric feedback mechanisms [9,10]. This sequence augments atmospheric volatility, fostering convective genesis and inundative flooding [11,12]. Conversely, the latter sequence, typified by UER anteceding UEH, often follows post-tropical cyclonic activities, culminating in sustained heatwaves that offset transient temperature declines [8,13,14]. The compounded ramifications of CMEs can thus be exponentially more catastrophic than isolated meteorological extremes [12,15,16]. Recent scholarly pursuits have accentuated the burgeoning interest in the compound risks engendered by UEH and UER confluences [17,18]. While traditionally perceived as discrete phenomena, burgeoning evidence underscores a significant uptick in their simultaneous occurrences, with profound ecological and socio-economic reverberations [19,20,21,22,23].
For UEH risk quantification, prevalent methodologies emphasize temporal durations, elevated temperature thresholds, and standard deviation metrics [6,24,25]. However, these paradigms, in their insularity, may inadvertently obfuscate the true magnitude of UEH, especially when bereft of a holistic comprehension of its frequency, intensity, and duration [26]. Analogously, UER risk assessments have harnessed diverse tools, ranging from statistical process control charts to advanced simulation models [27,28,29]. Given the paramountcy of accurately prognosticating CME risks, there emerges a clarion call for an integrative approach that amalgamates these disparate facets.
Furthermore, it is pivotal to underscore the intricate nexus between two thermal and hydrometeorological variables: heat and precipitation. Their regional interplay can profoundly modulate the genesis and trajectory of CMEs, often culminating in a cascade of reinforcing feedback loops. Seminal studies, leveraging diverse regression techniques, have highlighted the temperature dependency of extreme rainfall events and the intricate probabilistic interplay between thermal and precipitation variables across varied climatic spectra [30,31]. Yet, a conspicuous research chasm persists, particularly in quantifying the risks tethered to concomitant UEH and UER manifestations [32]. This lacuna accentuates the exigency of targeted CME hazard assessments, fostering a granular understanding of the multifaceted impacts of climatic shifts on such phenomena, a sine qua non for devising robust early-warning and mitigation stratagems.
In this milieu, this study endeavors to furnish a comprehensive risk assessment of CMEs, particularly those engendered by UEH and UER in the face of global climatic shifts. This study aims to (1) scrutinize the variability in the Recurrence Period (RP) distribution of CMEs using Global Climate Models (GCMs); (2) discern the alterations in CME risk vis-à-vis future climatic trajectories; and (3) elucidate the primary determinants of CME risk. By delving into the nuanced interplay of UER and UEH, our analysis transcends the extant literature, offering a more holistic perspective on these meteorological confluences. The insights gleaned herein hold profound implications for sculpting efficacious strategies for mitigating the multifarious adversities of CMEs in an evolving climatic landscape.

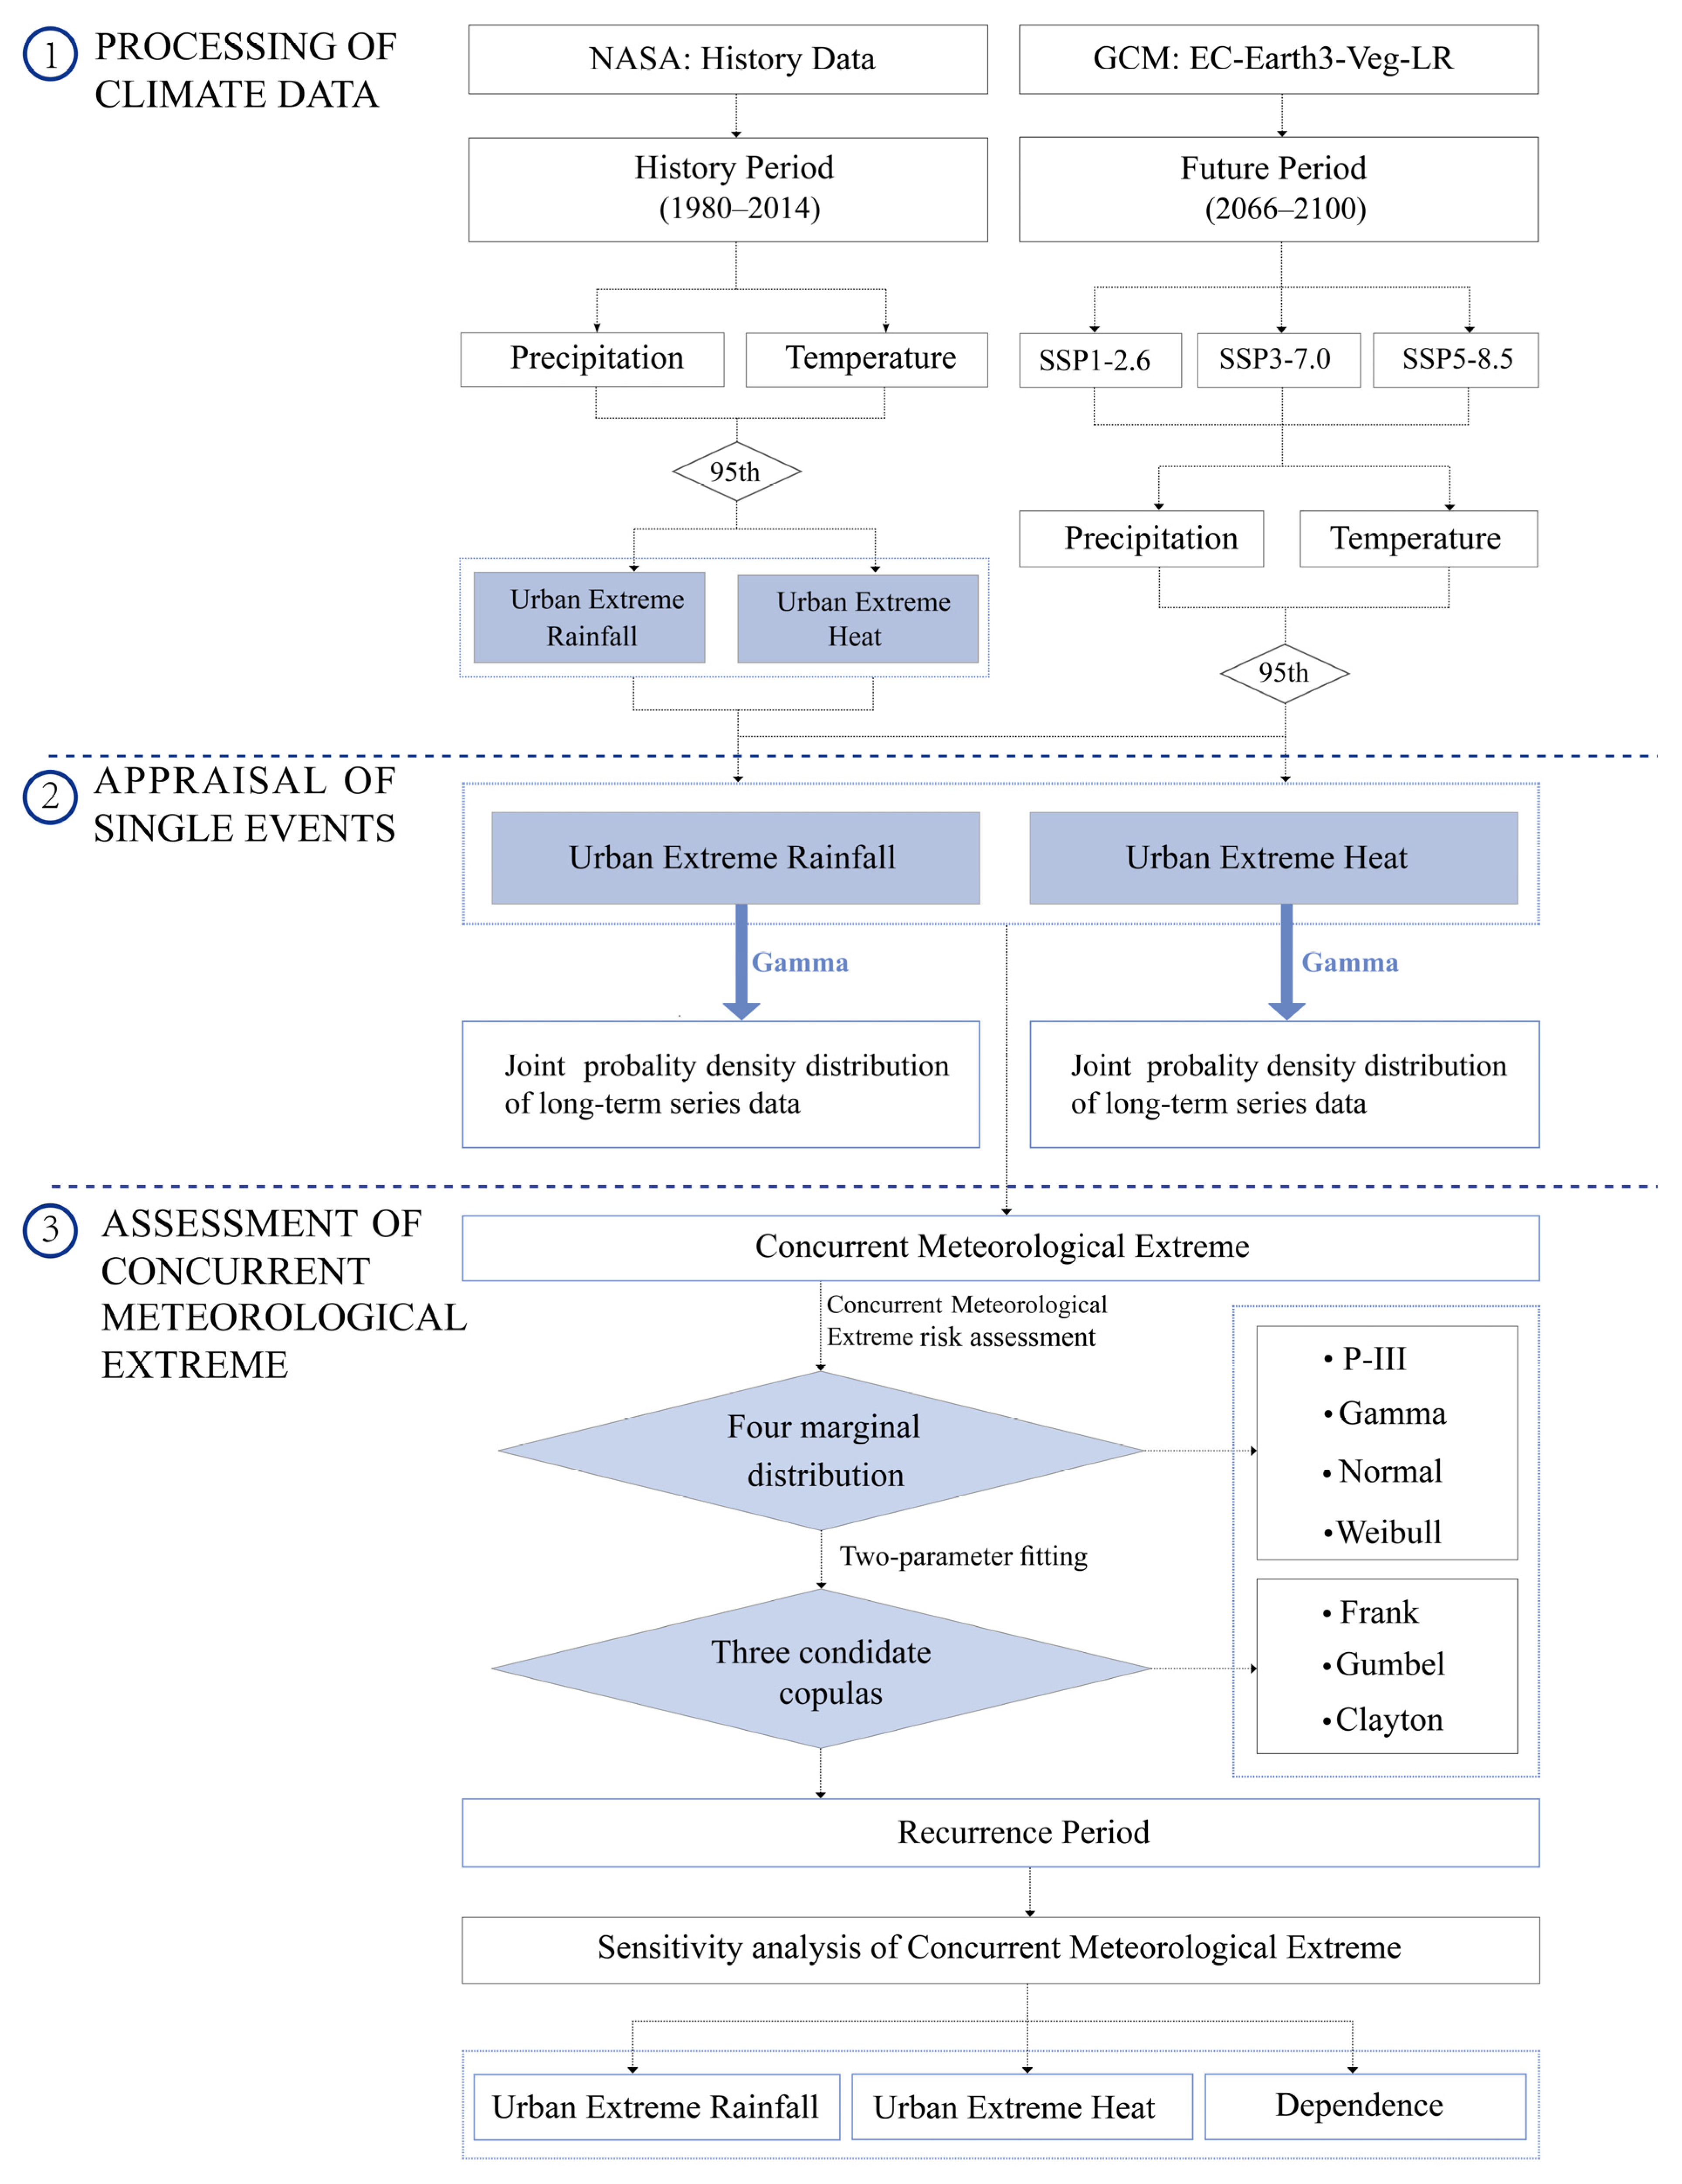
2. Materials and Methods
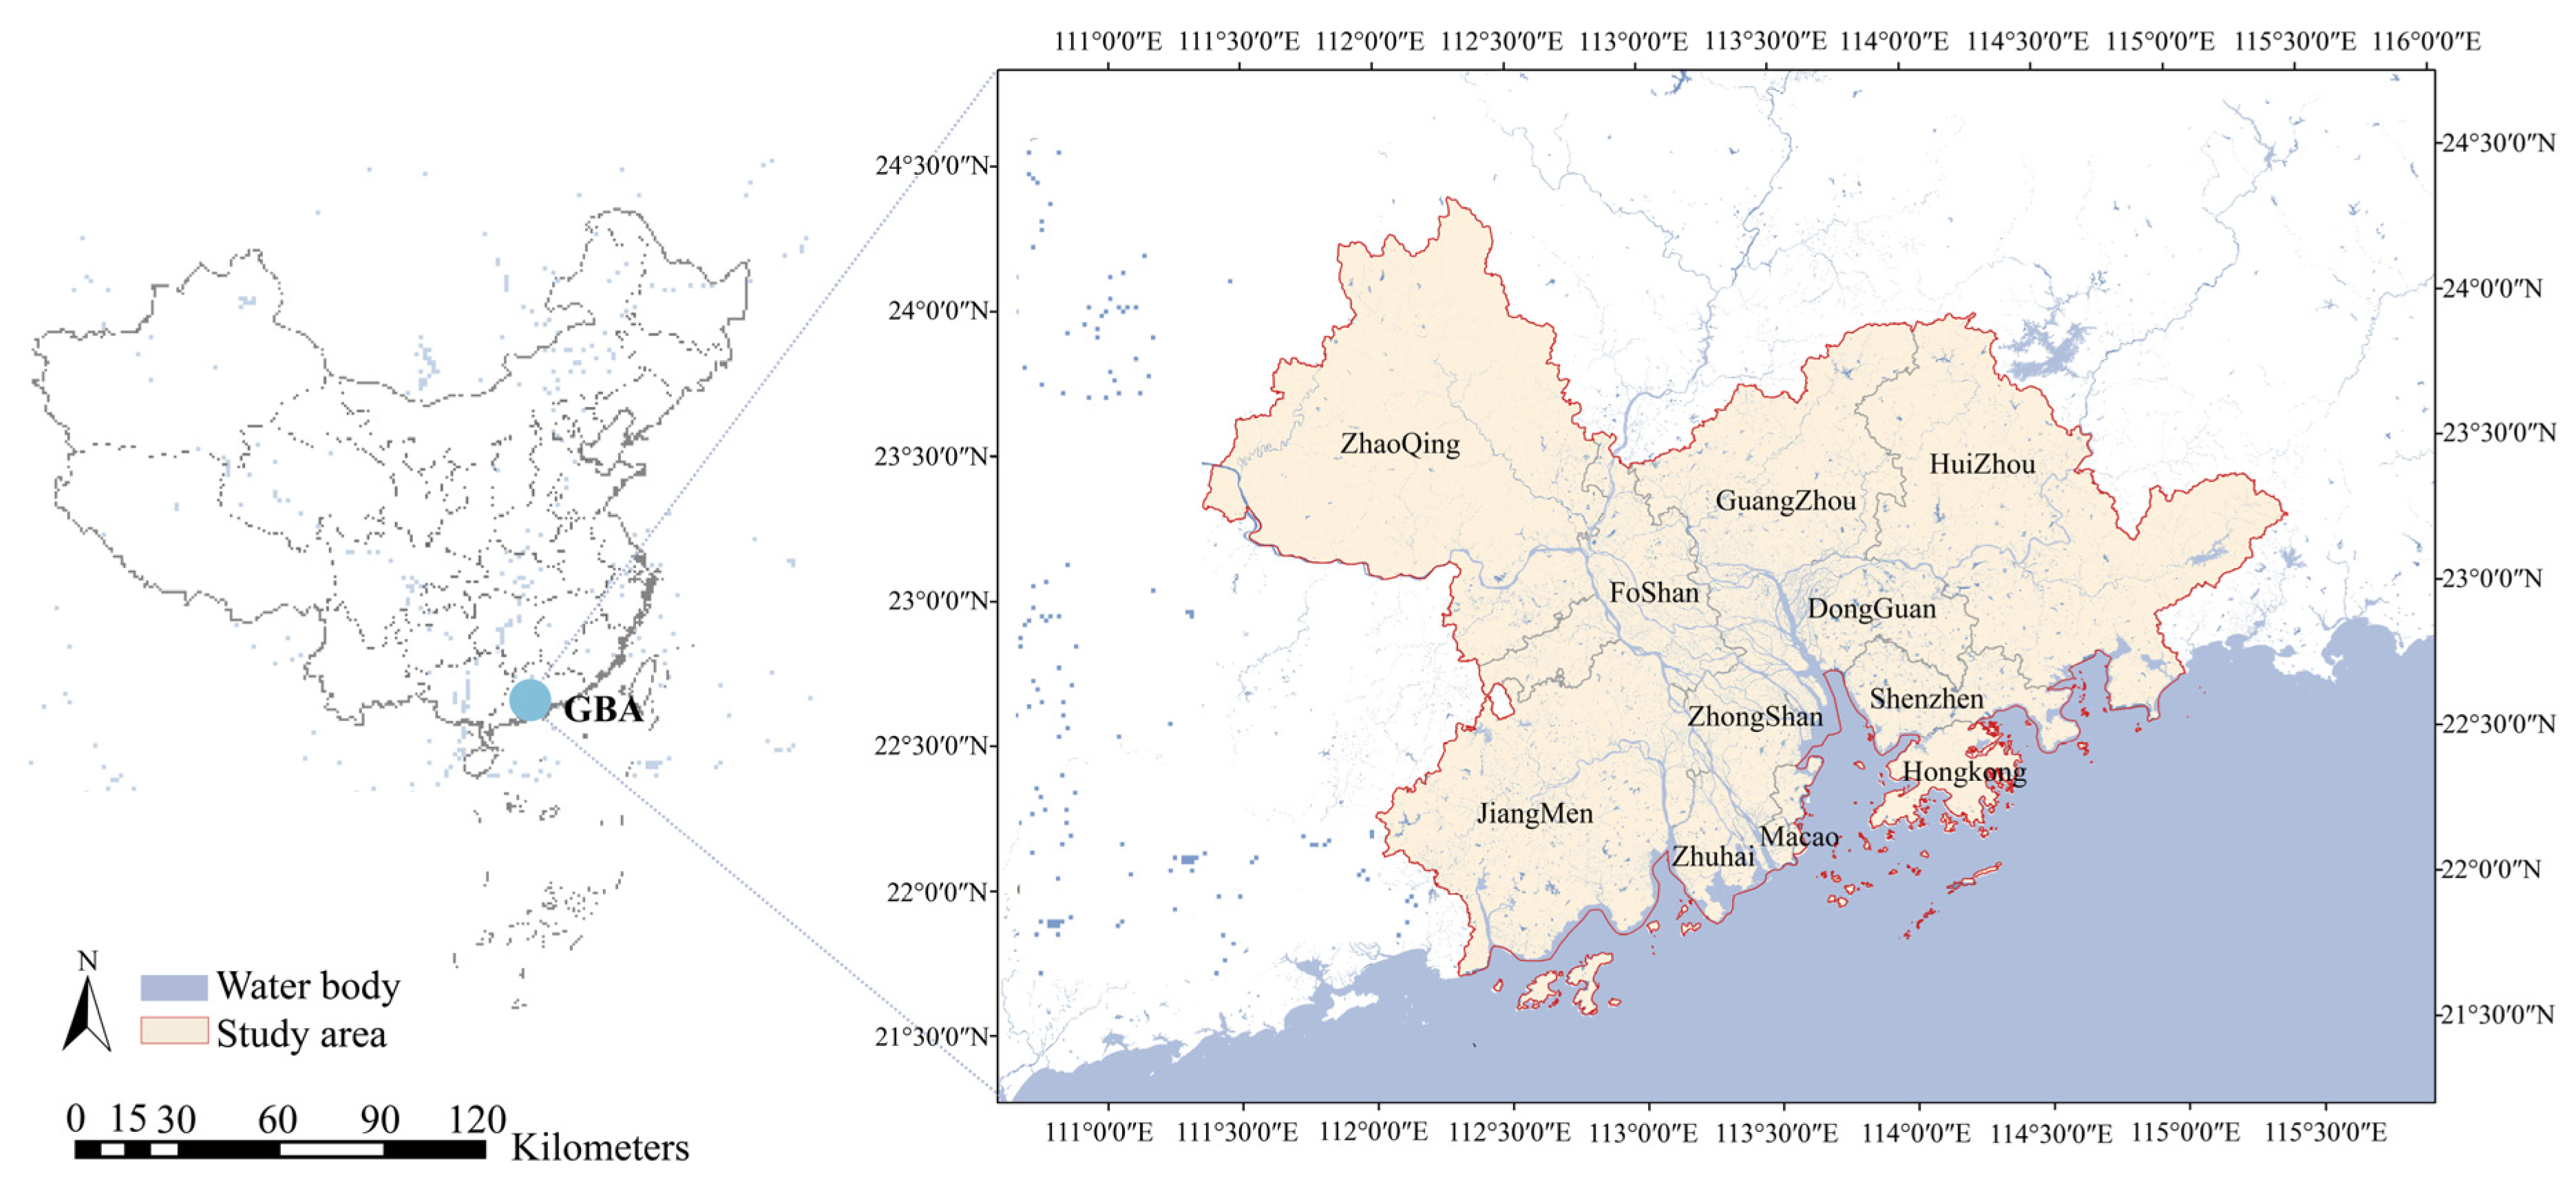
This investigation employed a methodological paradigm, encompassing (1) the meticulous curation and scrutiny of climatic datasets; (2) the rigorous evaluation of extreme precipitation and elevated temperature events; and (3) the intricate assessment of compound hazards. This structured approach is graphically delineated in Figure 1. Time series data, encapsulating protracted rainfall and temperature chronicles, were synthesized by leveraging a GCM amalgamated with an SSP. The extraction of extreme rainfall duration probability distributions was orchestrated via a bi-parametric gamma distribution, with a congruent methodology employed for extreme temperature events. Individualized risk assessments for UER and UEH were conducted for prospective epochs. Furthermore, the hazards intrinsic to CMEs were meticulously evaluated, with a focal emphasis on the determinants catalyzing CME manifestations. This research paradigm reflects a holistic and systematic comprehension of the multifarious ramifications of climatic perturbations for urban milieus.

2.1. Study Locale

The region for this inquiry is the Guangdong–Hong Kong–Macao Greater Bay Area (GBA) in Figure 2, an expansive urban conglomerate spanning 56,000 square kilometers and encompassing eleven metropolises, including Guangzhou, Shenzhen, and Hong Kong, among others. This urban nexus is globally renowned for its prodigious economic contributions and unparalleled population density [33]. The GBA, with its intricate spatial configurations and unique orographic attributes [34], presents an exemplary research milieu. This region’s climatic tapestry is interwoven with a subtropical monsoon climate, registering an annual precipitation average between 1600 and 2300 mm [35]. Recent decades have witnessed an uptick in extreme meteorological events, corroborated by recurrent urban inundations [36]. Historical chronicles spanning 1971–2014 evince an intensifying UEH phenomenon, predominantly manifesting in the densely urbanized precincts of the GBA [37]. Thus, the GBA emerges as a quintessential locale, vulnerable to UER and UEH episodes, rendering it an optimal crucible for climatic modeling and risk prognostication.

2.2. Data Provenance

The dataset for this investigation bifurcates into historical and prospective categories. The historical dataset, spanning 1980–2014 [38,39,40], was procured from NASA’s MERRA-2 atmospheric compendium [41,42,43,44]. For forward-looking climatic extrapolations, the EC-Earth3-Veg-LR of the CMIP6 was harnessed [45,46], focusing on the spatiotemporal intricacies of extreme meteorological events within the GBA for the 2066–2100 horizon [37,38]. The EC-Earth3-Veg-LR model has undergone iterative validation and comparison processes, revealing stronger congruence between simulated and observational data, particularly showcasing greater accuracy and reliability in climatic data representation within the geographical domain of China. This study builds upon existing academic foundations, demonstrating the effectiveness of EC-Earth3-Veg-LR in conjunction with climate change scenario predictions. Lu et al. [47] validated 46 models from CMIP6 using precipitation and temperature data from 1961 to 2014, revealing commendable metrics for EC-Earth3-Veg-LR. Additionally, 17 performance indicators and 5 distinct techniques for multicriteria decision making were employed to ascertain the consistency between observed data and simulated data [48]. Xiao et al. [49] evaluated the spatiotemporal performance of GCMs for temperature and precipitation data released by the China Meteorological Administration from 1956 to 2016 using interannual variability skill and Taylor diagrams, where EC-Earth3-Veg-LR achieved high accuracy in model parameters.
To bridge scalar disparities, a sophisticated statistical downscaling modality was employed. Specifically, the EC-Earth3-Veg-LR simulation from CMIP6 was instrumentalized for future climatic prognostications [45]. The Bias Correction Spatial Disaggregation (BCSD) technique was employed to refine spatial resolution from 100 km to a granular 27 km. Subsequent to this refinement, daily aggregates of meteorological variables were assiduously curated and processed to yield accurate predictive insights. Three distinct scenarios under the EC-Earth3-Veg-LR model, namely, SSP1-2.6, SSP3-7.0, and SSP5-8.5, were selected, each representing unique radiative forcing trajectories occurring by 2100 [50]. The 2066–2100 epoch was earmarked for climatic scenario analysis, resonating with the extant literature [51,52].

2.3. Probability Density of Extreme Events

UER episodes were characterized as sequential days with daily precipitation surpassing the 95th percentile [12], while UEH events were demarcated as a minimum of three consecutive days with temperatures exceeding the 95th percentile, based on the 1980–2014 historical dataset [53,54]. The rationale for this delineation stems from the recognition that prolonged thermal exposure can have deleterious ramifications on both ecological and human systems [10]. Conversely, even ephemeral UER episodes can imperil urban infrastructures [55]. The probability density function, predicated on a two-parameter gamma distribution [56], was employed to elucidate the distribution dynamics of extreme meteorological events. Additionally, the joint probability distribution function was harnessed to discern the interrelationship between the dual factors, offering a comprehensive purview of the coupled UER/UEH dynamics, as represented by Equation (1)
f x = x α 1 e x β β α Γ α
where α = μ 2 σ 2 is the shape parameter, β = σ 2 μ is the scale parameter, μ represents the averages of UER/UEH and duration, and σ denotes the variance.
The joint probability distribution function was utilized to evaluate the distribution relationship between the two factors [57], providing a comprehensive observation of the UER/UEH coupled with duration distributions (Equation (2)).
f x , y = f x f y = x α x 1 y α y 1 e x β x + y β y β x α x β y a y Γ α x Γ α y  
where f(x,y) represents the joint probability distribution of UER/UEH and duration, f(x) denotes the gamma distribution of UER/UEH, and f(y) represents the gamma distribution of duration.

2.4. Prediction of RP in CME

The methodology employed in this study for defining UER and UEH involves the utilization of rainfall and temperature values over a given threshold. UEH that occur within a seven-day interval prior to or after an UER event are defined as CME. It is noteworthy that the seven-day threshold pertains solely to the interval between the UER and UEH, without constraining the duration of either event. Similar to previous studies [7], in order to eliminate redundancy, each UER event was paired with the first UEH event, while the largest UER event was coupled with the same UEH event. However, similar outcomes could be achieved using alternative pairing processes. The cumulative daily rainfall (Qc) and daily average temperature (tc) above the threshold were estimated to characterize extreme events, taking both the duration and intensity of CME events into overall consideration:
  C M E = i = a n Q i Q 95 t h , i = b m t j t 95 t h
where Q i ( t j ) represents the daily precipitation of a UER event starting from date a (b) and ending at date n (m); Q95th and t95th represent the extreme rainfall and heat, respectively. To ensure rigorous adherence to the scientific premise, it is mandatory that the absolute disparity between “a and b” or “n and m” remain less than 7.
The assessment of CME hazards was conducted through the analysis of bivariate RP via copulas. The marginal distributions of UER and UEH events were initially estimated utilizing four parametric distributions, i.e., P-III, Gamma, Normal, and Weibull. The calculation specifics of the four parameters are presented in Table 1. The method of maximum likelihood estimation was employed to compute the parameters of the fitting function. The Kolmogorov–Smirnov test was utilized to analyze whether the data distribution conformed to a theoretical distribution, thereby selecting the optimal univariate fitting function. The selection criterion is as follows: within the critical threshold, the smaller the value of the D statistic, the better the fit.
Subsequently, three candidate copulas, i.e., Frank, Gumbel, and Clayton, were utilized to link the optimal-fit marginal distributions of UER and UEH ( C F Q c q   , F t c q ). The expressions for the three candidate copulas are delineated in Table 2.
In order to ascertain the optimal combination of marginal distributions fit to copulas, the Akaike Information Criterion was employed as a selection criterion, with the objective of identifying models with the minimum Akaike Information Criterion. Subsequently, the joint RP was then computed using the “AND” approach to assess the bivariate hazards of compound events. The RP was calculated as shown below:
R P = E 1 F Q c q F t c q + C F Q c q   , F t c q    
where F Q c q ( F t c q   ) is the surplus of a marginal cumulative distribution exceeding a given quantile-based threshold. According to previous studies [22,23], the same exceedance probability was set for both UER and UEH. E denotes the average inter-arrival time between compound events.

2.5. Sensitivity Analysis

The potential alterations in the hazards associated with compound UER and UEH phenomena within the GBA are predominantly modulated by fluctuations in extreme precipitation and thermal events, as well as their intricate interplay. To discern the relative contributions of these salient determinants to the evolutions in CME hazards, a triadic experimental framework was instituted, drawing inspiration from the methodologies delineated by Bevacqua et al. [58]. In Experiment (a), the focus was directed towards the marginal distributions of UEH events and the interdependence between UER and UEH during the historical epoch. Subsequently, the marginal distributions of UER events for the prospective period were integrated. Experiment (b) mirrored the design of Experiment (a), albeit with a pivotal distinction: the marginal distributions for UEH events in the forthcoming period were interchanged. Experiment (c) adopted a more holistic approach, wherein both marginal distributions of UER and UEH events were anchored in the historical framework, and the meticulously fitted copula was extrapolated for the impending temporal horizon (Text S1 of Supplementary Materials).

3. Results and Discussion

3.1. Single Events

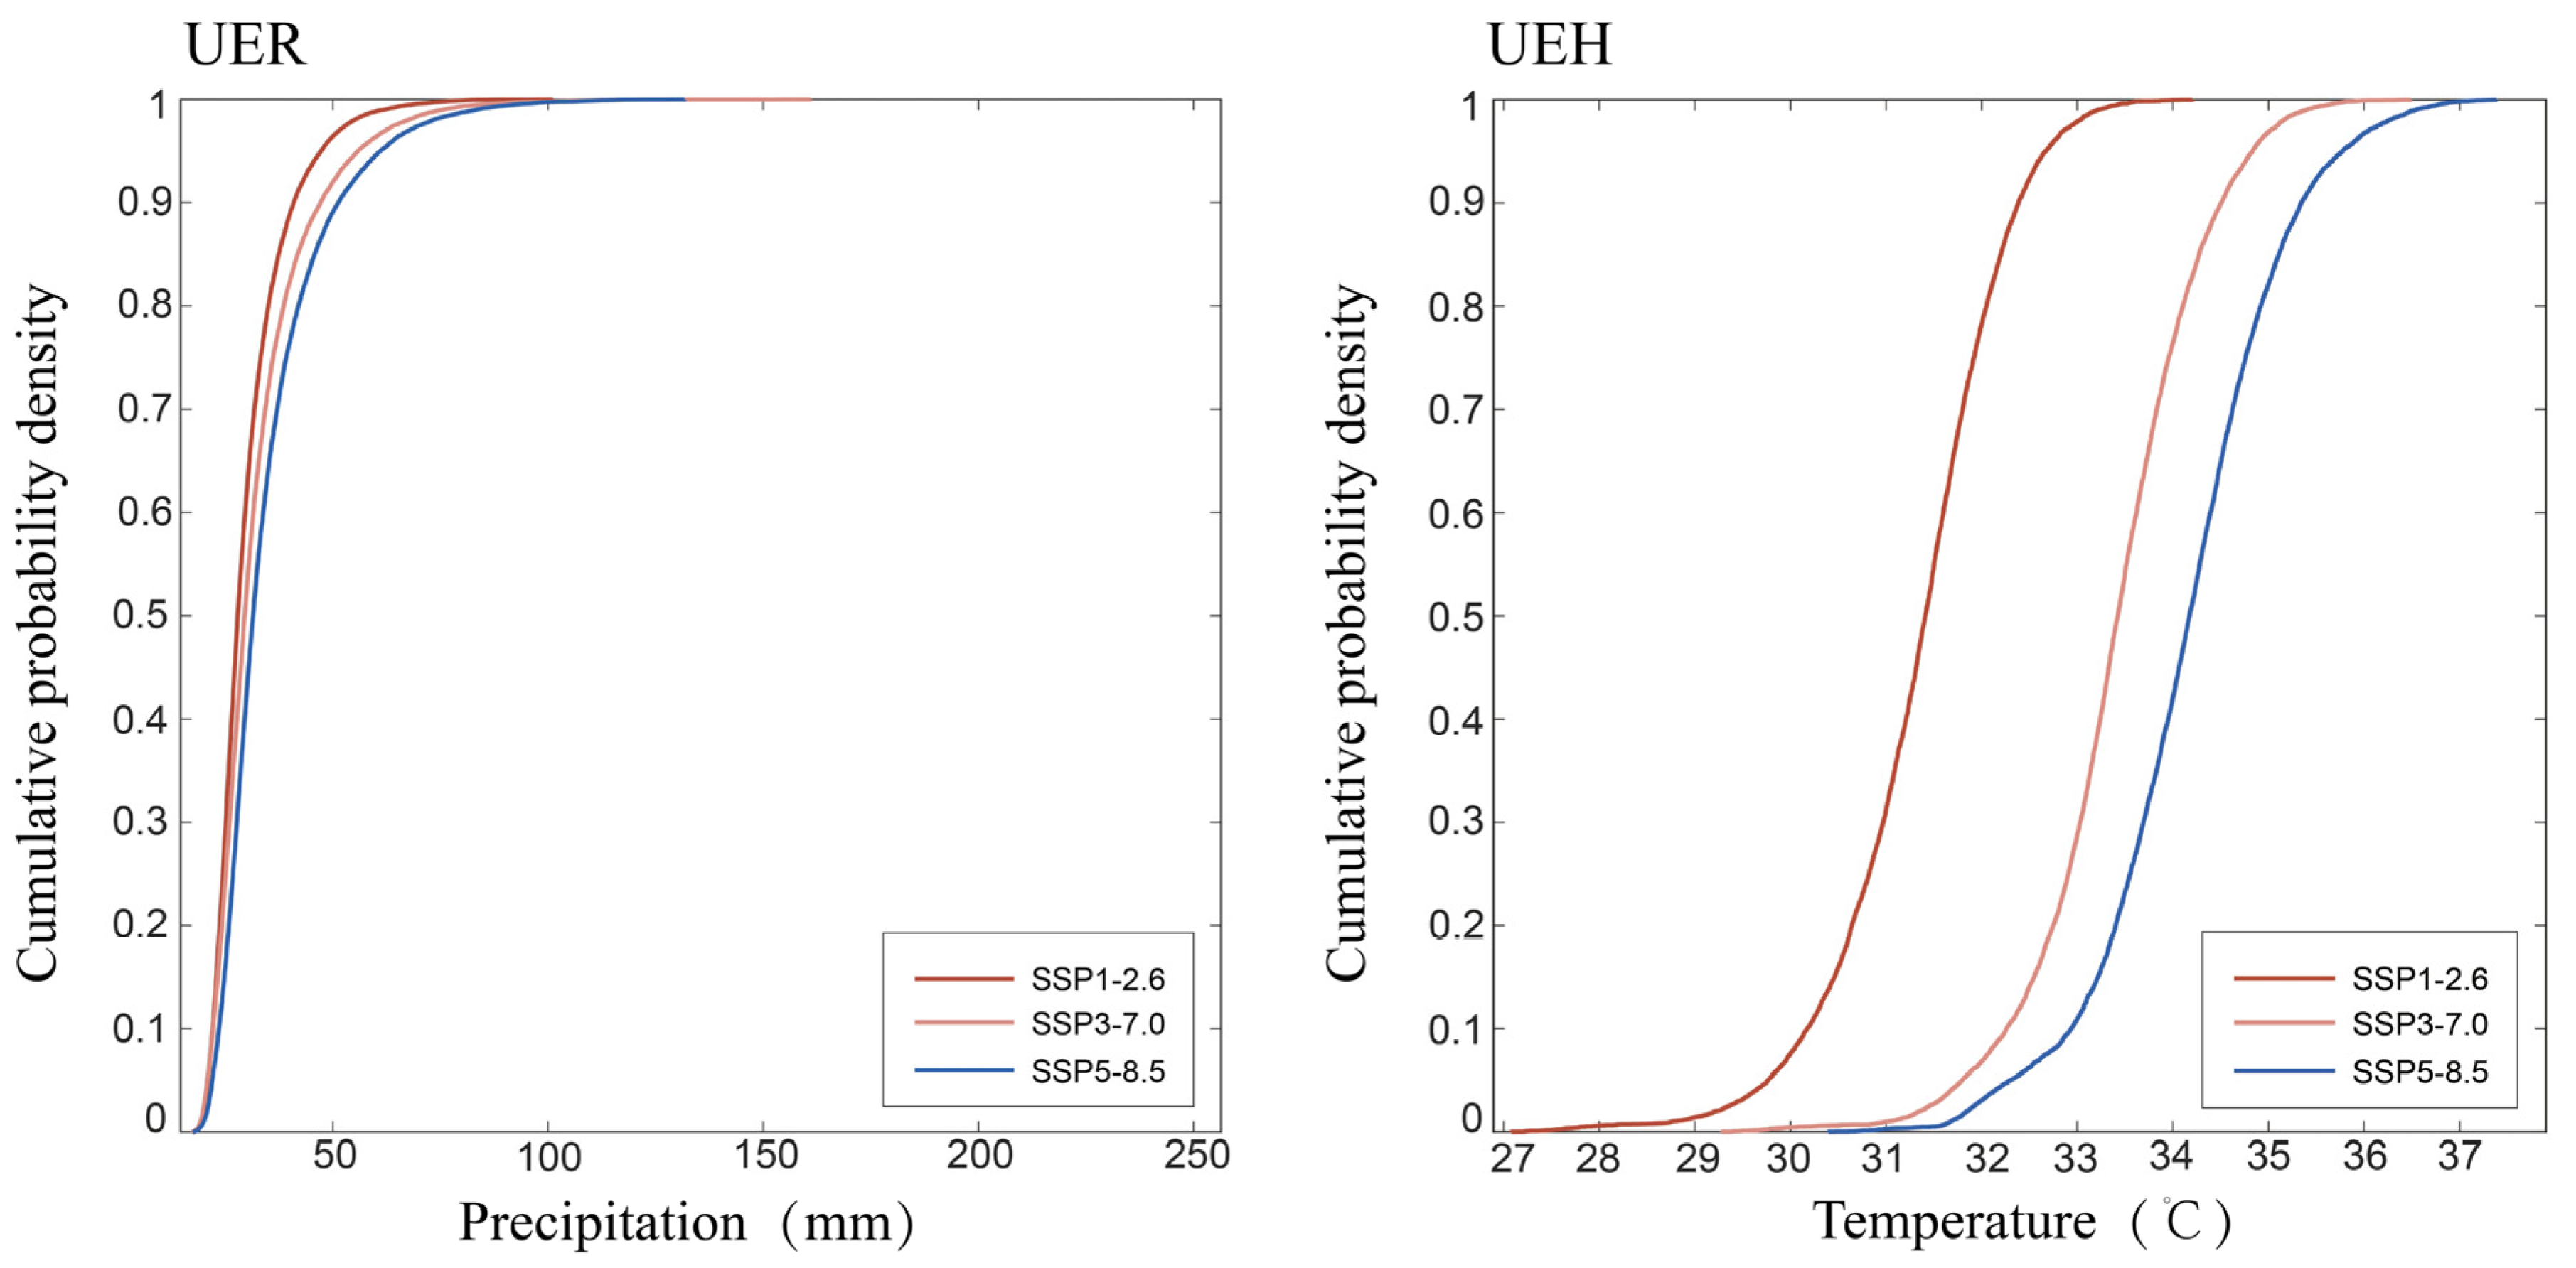
3.1.1. UER/UEH Dynamics

A rigorous statistical analysis of isolated rainfall events, with temporal intervals of one, three, and seven days, was undertaken to discern shifts in mean precipitation metrics. Within the SSP1-2.6 scenario, the mean precipitation exhibited a waning trajectory for the one- and three-day intervals, juxtaposed with a modest increment of approximately 1.4 mm at the seven-day juncture (see to Table 3). This observation resonates with the seminal work of Deng et al. [9], who harnessed a multimodal synthesis to prognosticate flood vulnerabilities in the GBA. Pertaining to UEH events, intervals of three, seven, and fourteen days were earmarked for in-depth statistical exploration (see to Table 3). The SSP1-2.6 scenario consistently manifested a receding temperature trend.
In a parallel evaluation within the SSP3-7.0 scenario, divergent patterns for precipitation and thermal events crystallized. While the mean rainfall trajectory was descending, UEH events unveiled an ascendant trend at the three-day marker, juxtaposed with a decline at the fourteen-day interval. The SSP5-8.5 scenario unveiled a multifaceted tableau. Mean precipitation metrics evinced a decrement at the one- and three-day intervals, counterbalanced by a pronounced surge of approximately 7.4 mm at the seven-day marker. For UEH events, the mean elevated temperature exhibited a relentless ascent, culminating in a notable increment of approximately 1.1 °C at the fourteen-day juncture. These revelations underscore the intricate interplay of climatic perturbations within geo-specific milieus.

3.1.2. Cumulative Probability Density Distribution of Extreme Events

In a juxtaposition of aggregated probability densities for the envisaged epoch, salient variances materialized across the triadic scenarios. Within the SSP1-2.6 scenario, the probability of witnessing a 25 mm rainfall event was pegged at an approximate 27%. This likelihood was accentuated under the SSP3-7.0 and SSP5-8.5 scenarios, registering at approximately 36% and 45%, respectively.
Regarding thermal extremes, with a benchmark of 32 °C, the probability contours exhibited stark divergences across scenarios. The SSP1-2.6 scenario proffered a modest likelihood of approximately 22%. Contrastingly, the SSP3-7.0 paradigm witnessed a meteoric surge to around 99.3%. A congruent trajectory was discerned for the SSP5-8.5 scenario, with the probability cresting at an astonishing 99.7%, denoting a nearly 4.5-fold amplification vis-à-vis SSP1-2.6. Figure 3 delineates the aggregated probability density distributions for UER and UEH during the 2066–2100 horizon across the three scenarios. It is pivotal to underscore that the SSP5-8.5 scenario consistently manifested the apex probability for these meteorological extremes, irrespective of specific precipitation or thermal metrics.
These evaluative insights harmonize with the contemporary climatic literature, notably the IPCC AR6 [12], which accentuates a pronounced ascendant trajectory in extreme meteorological phenomena under elevated greenhouse gas emission scenarios [59]. The pronounced probabilities under the SSP5-8.5 framework, emblematic of maximal greenhouse gas concentrations, portend a future replete with intensified climatic aberrations and their concomitant hazards. This underscores the imperative for global collaborative endeavors to attenuate emissions.

3.2. Assessment of the CME Hazards

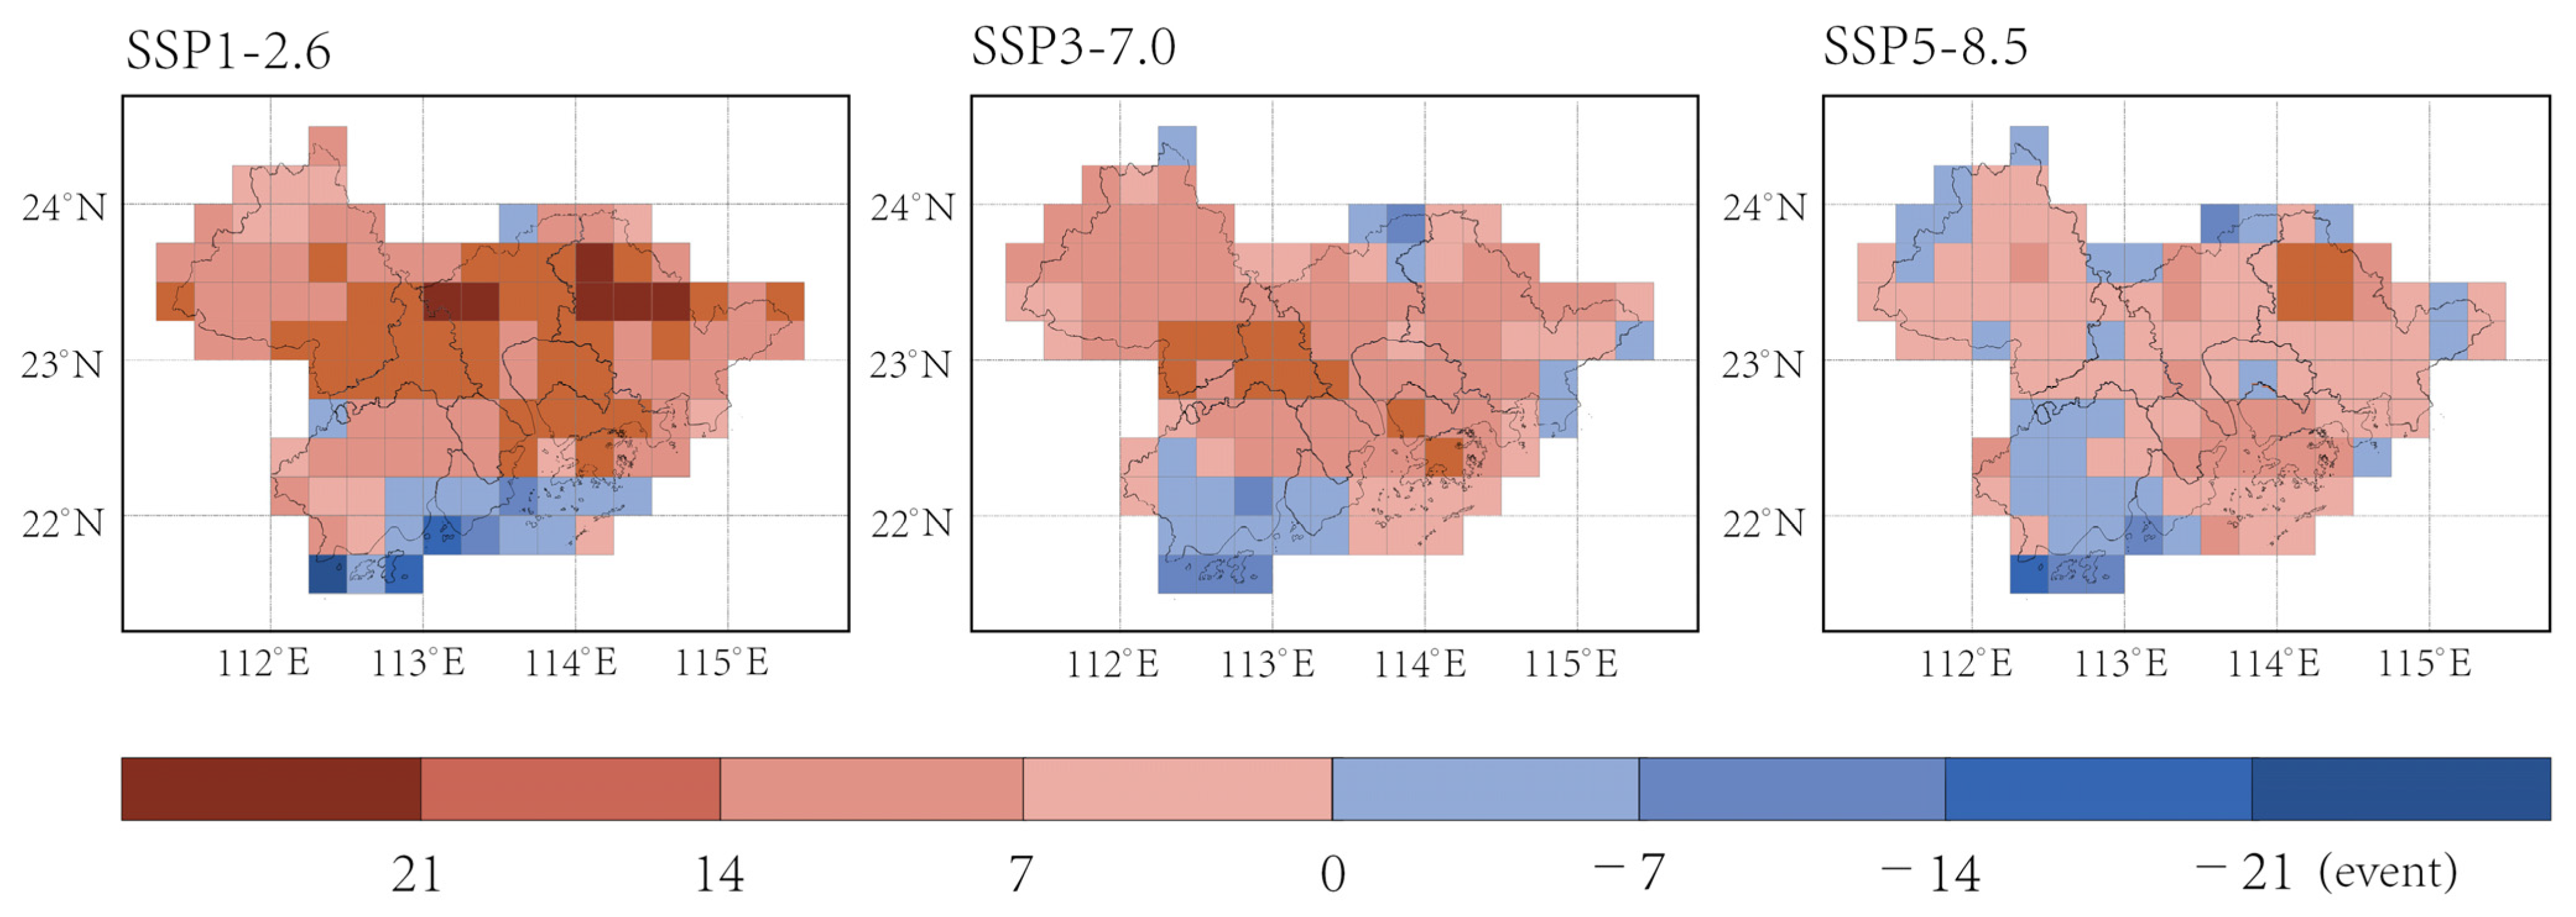
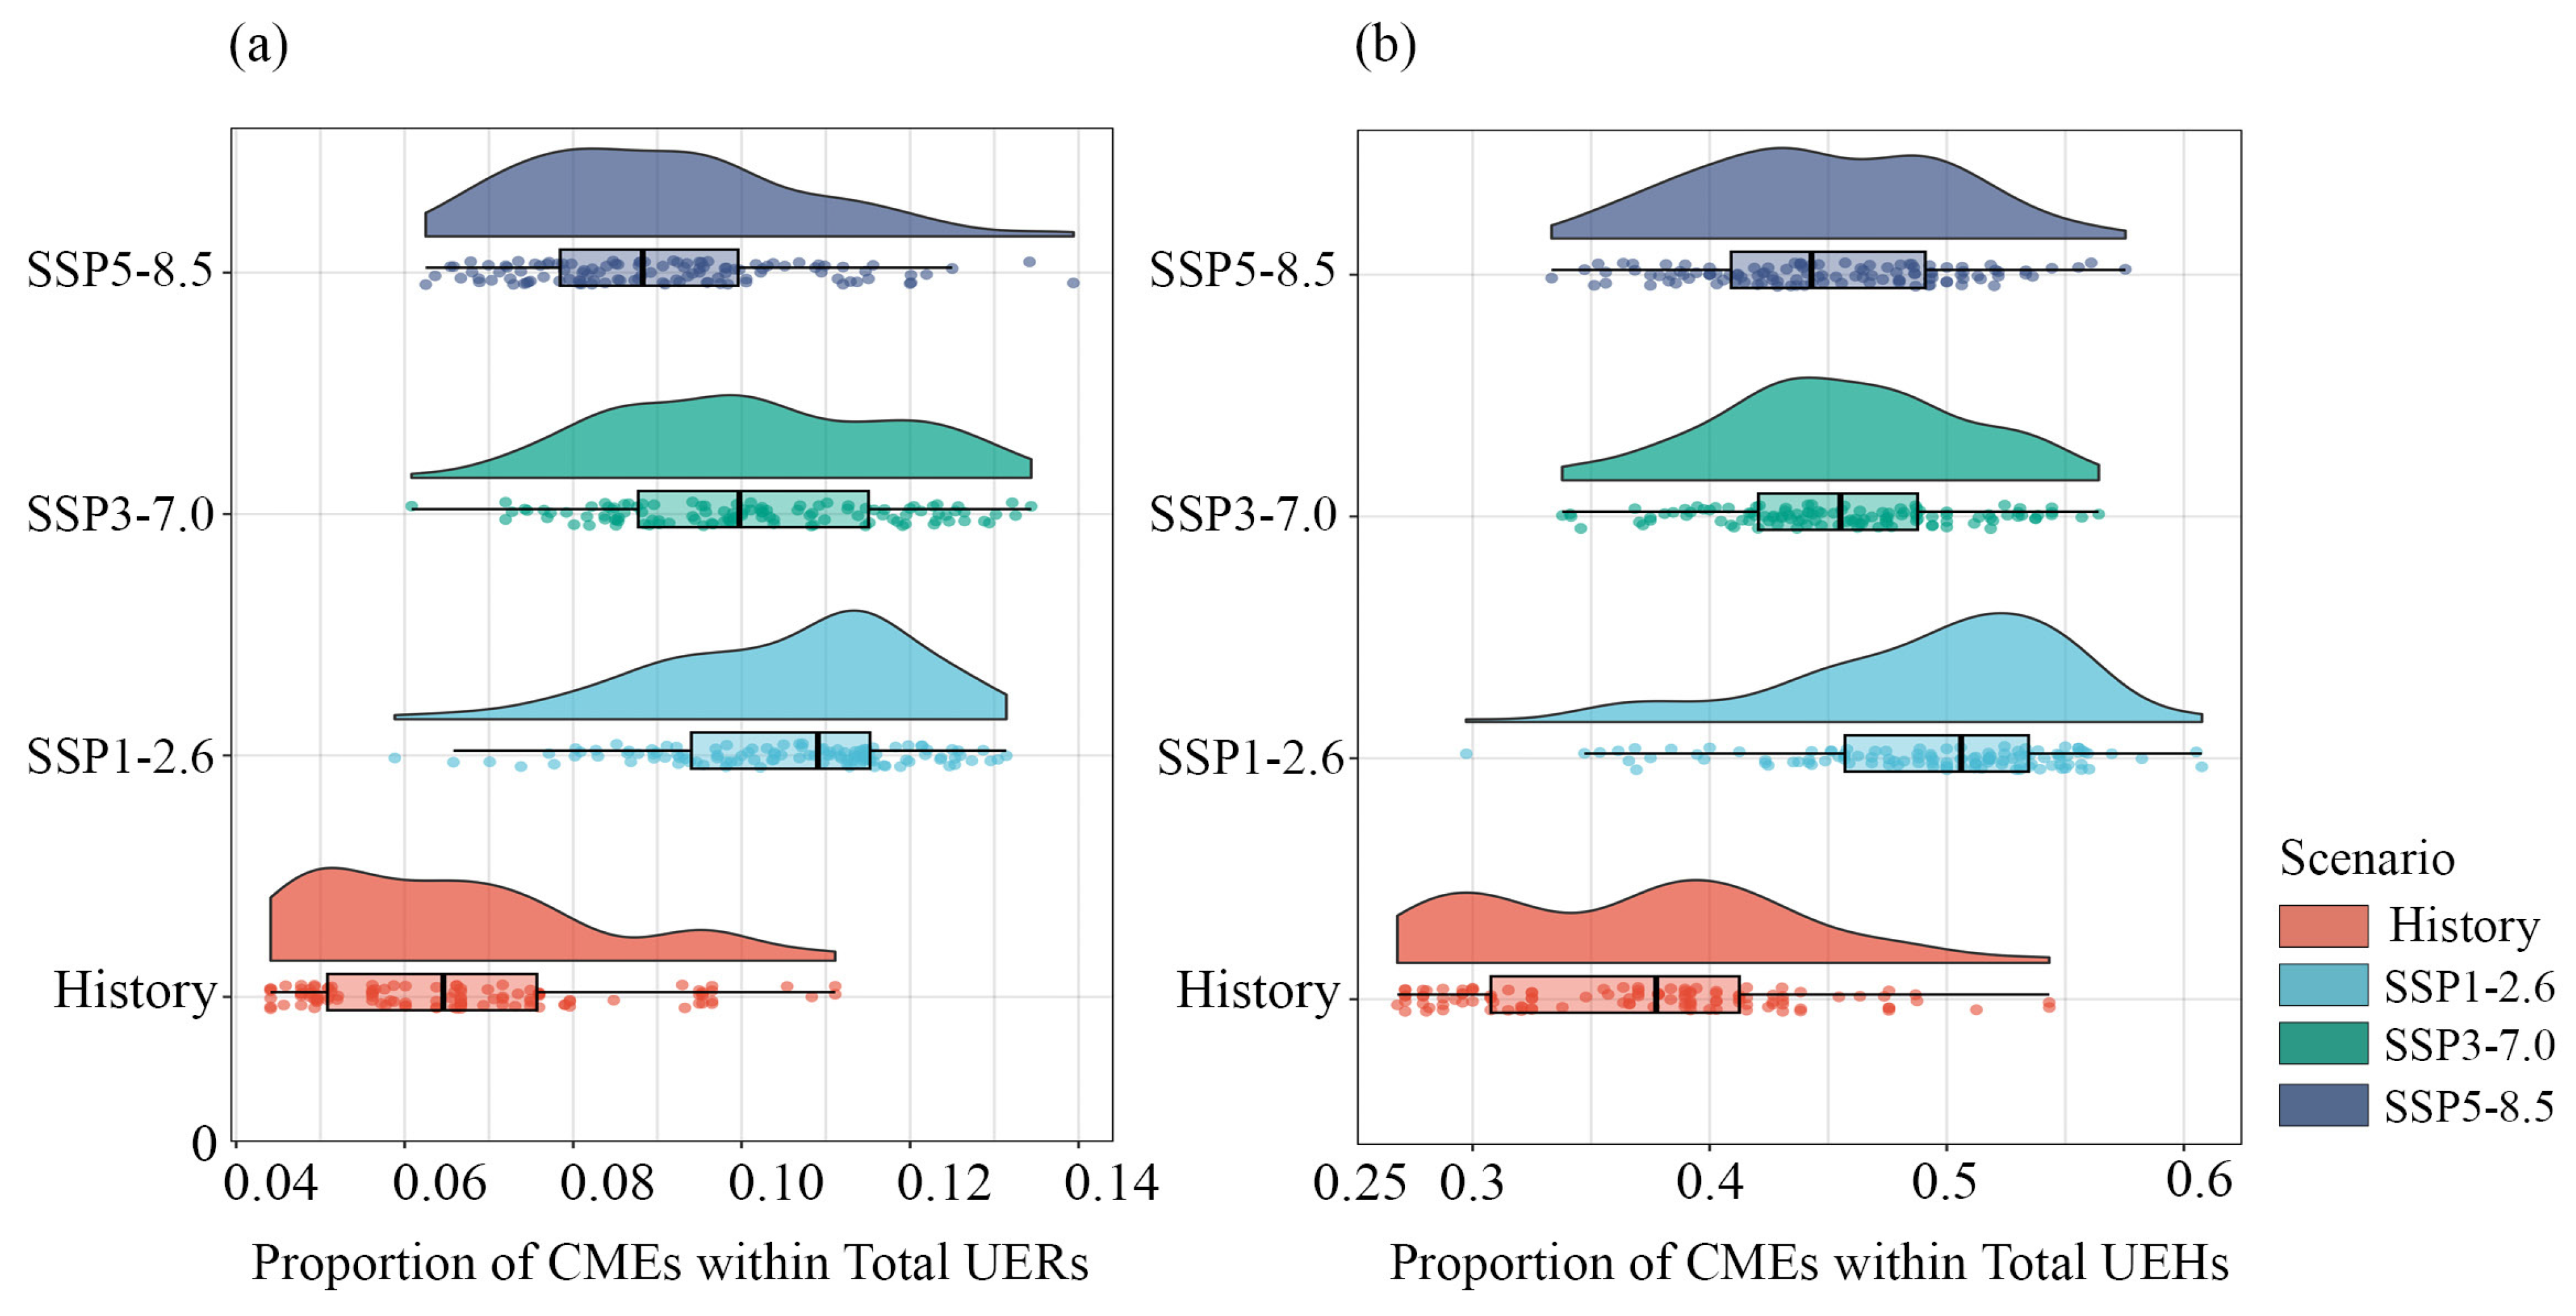
3.2.1. Shift in CME Frequency

In the context of this analysis, a CME is delineated as the concurrent or proximate manifestation of a UEH event within a seven-day span preceding or succeeding a UER. The appraisal of shifts in CME frequency unveiled a conspicuous ascendant trajectory across the expanse of the GBA, with a particular emphasis on its central nexus, under the triadic scenarios: SSP1-2.6, SSP3-7.0, and SSP5-8.5 (Figure 4).
Intriguingly, the zenith of amplification in CME occurrences was registered under the SSP1-2.6 scenario, whereas the SSP5-8.5 scenario manifested a comparatively tempered increment, as depicted in Figure 4. Following this observation, we identified the region wherein the frequency of CME exhibits a notably pronounced increase under the SSP5-8.5 scenario. Subsequently, we computed the RP for this region under three SSPs, as illustrated in Figure 5. A compelling dichotomy emerged: while the quantum of CMEs surged most significantly under SSP1-2.6, the intensity of these events remained relatively subdued. In stark contrast, the SSP5-8.5 scenario exhibited the most acute CME intensity, notwithstanding its relatively marginal uptick in event frequency. This nuanced interplay is graphically elucidated in Figure 5e.

3.2.2. Proportion of CMEs in Total UER Events and UEH Events

Determinants influencing CMEs under both antecedent and prospective climatic conditions—namely, SSP1-2.6, SSP3-7.0, and SSP5-8.5—were projected. The CMEs’ proportion within the aggregate UER events oscillated between 0 and 0.15, with mean metrics of 0.065 (historical), 0.112 (SSP1-2.6), 0.10 (SSP3-7.0), and 0.088 (SSP5-8.5). The CME distribution profile of the GBA during the historical epoch bore semblance to a Gaussian distribution, punctuated with pronounced extremities. In juxtaposition with future scenarios, the GBA’s CME distribution predominantly gravitated rightward, heralding an escalation in CME manifestations (Figure 6).
Regarding the CME proportion within the aggregate UEH events, the metrics spanned from 0 to 0.6, with mean values of 0.38 (historical), 0.53 (SSP1-2.6), 0.45 (SSP3-7.0), and 0.46 (SSP5-8.5). Mirroring the pattern discerned for precipitation phenomena, the CME distribution in prospective epochs predominantly gravitated rightward relative to its historical counterpart, signifying a pronounced surge in CME frequency.
Such revelations carry profound ramifications for the nuanced comprehension of potential perturbations wrought by climatic shifts in meteorological extremities. This aligns seamlessly with the insights of Zscheischler et al. [60], who accentuated the anticipated augmentation in CME manifestations under evolving climatic conditions. Thus, it becomes imperative to meticulously dissect these dynamics to forge efficacious strategies that attenuate the multifaceted impacts of CMEs in a changing climate.

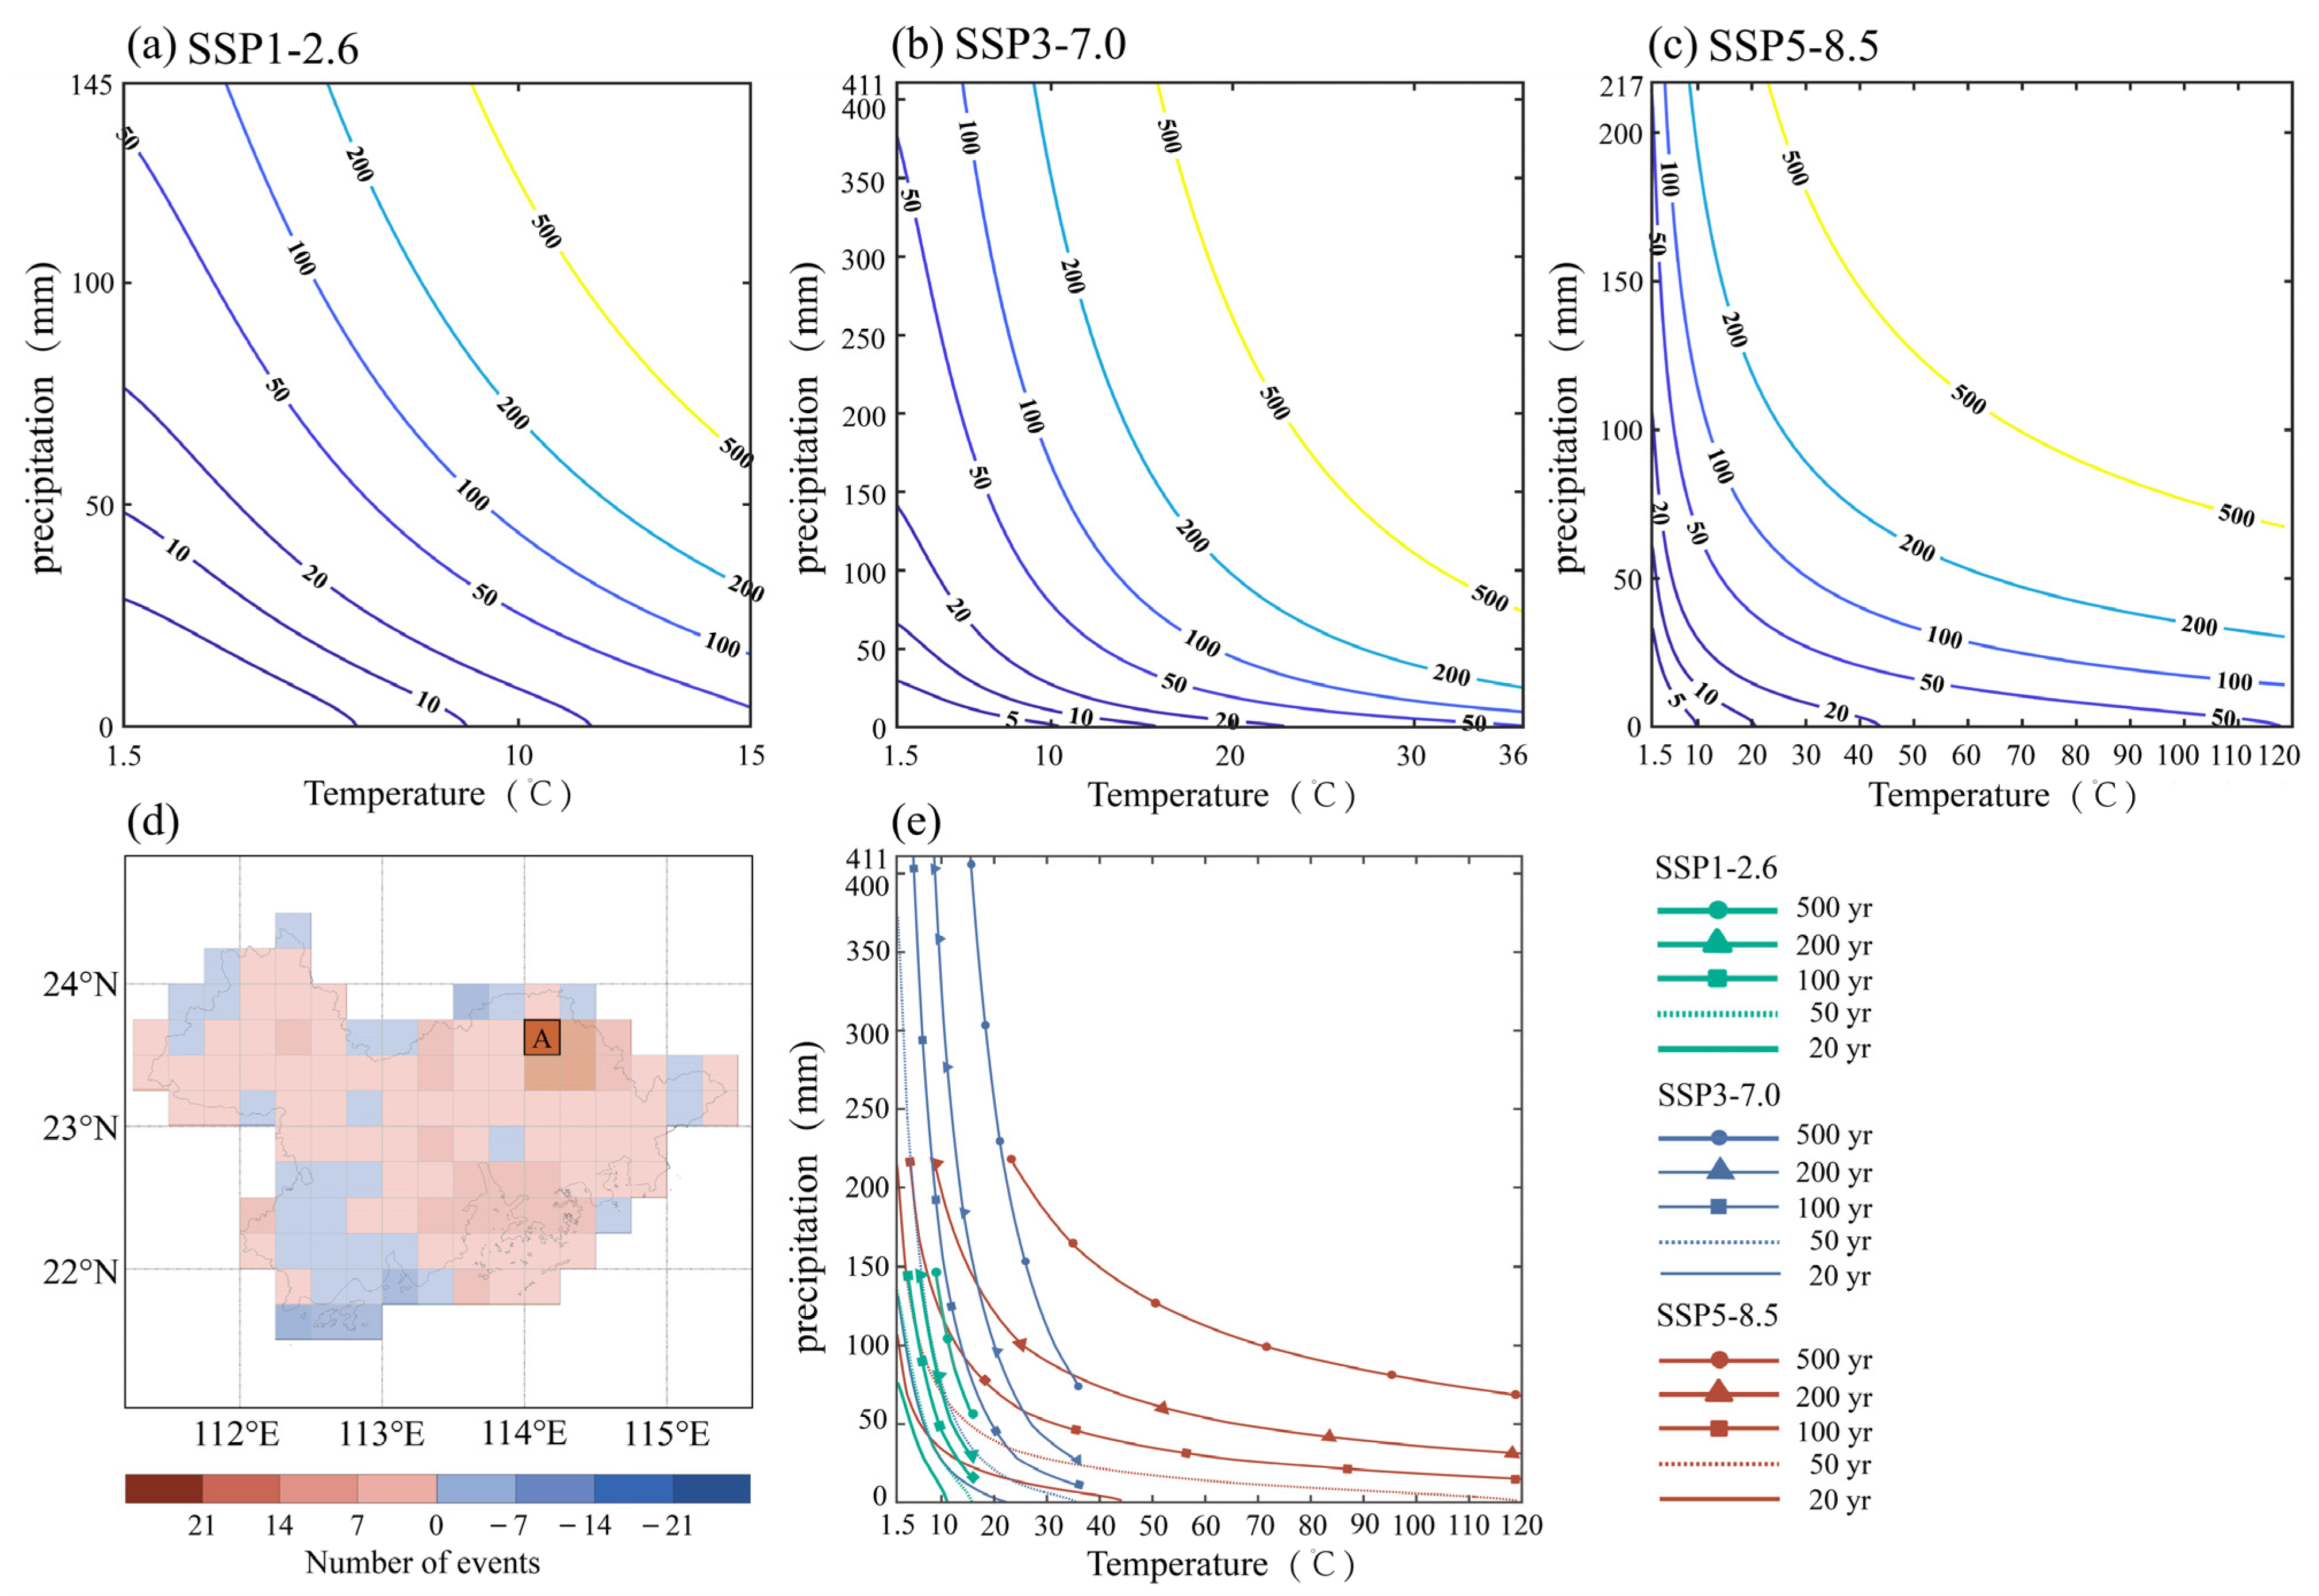
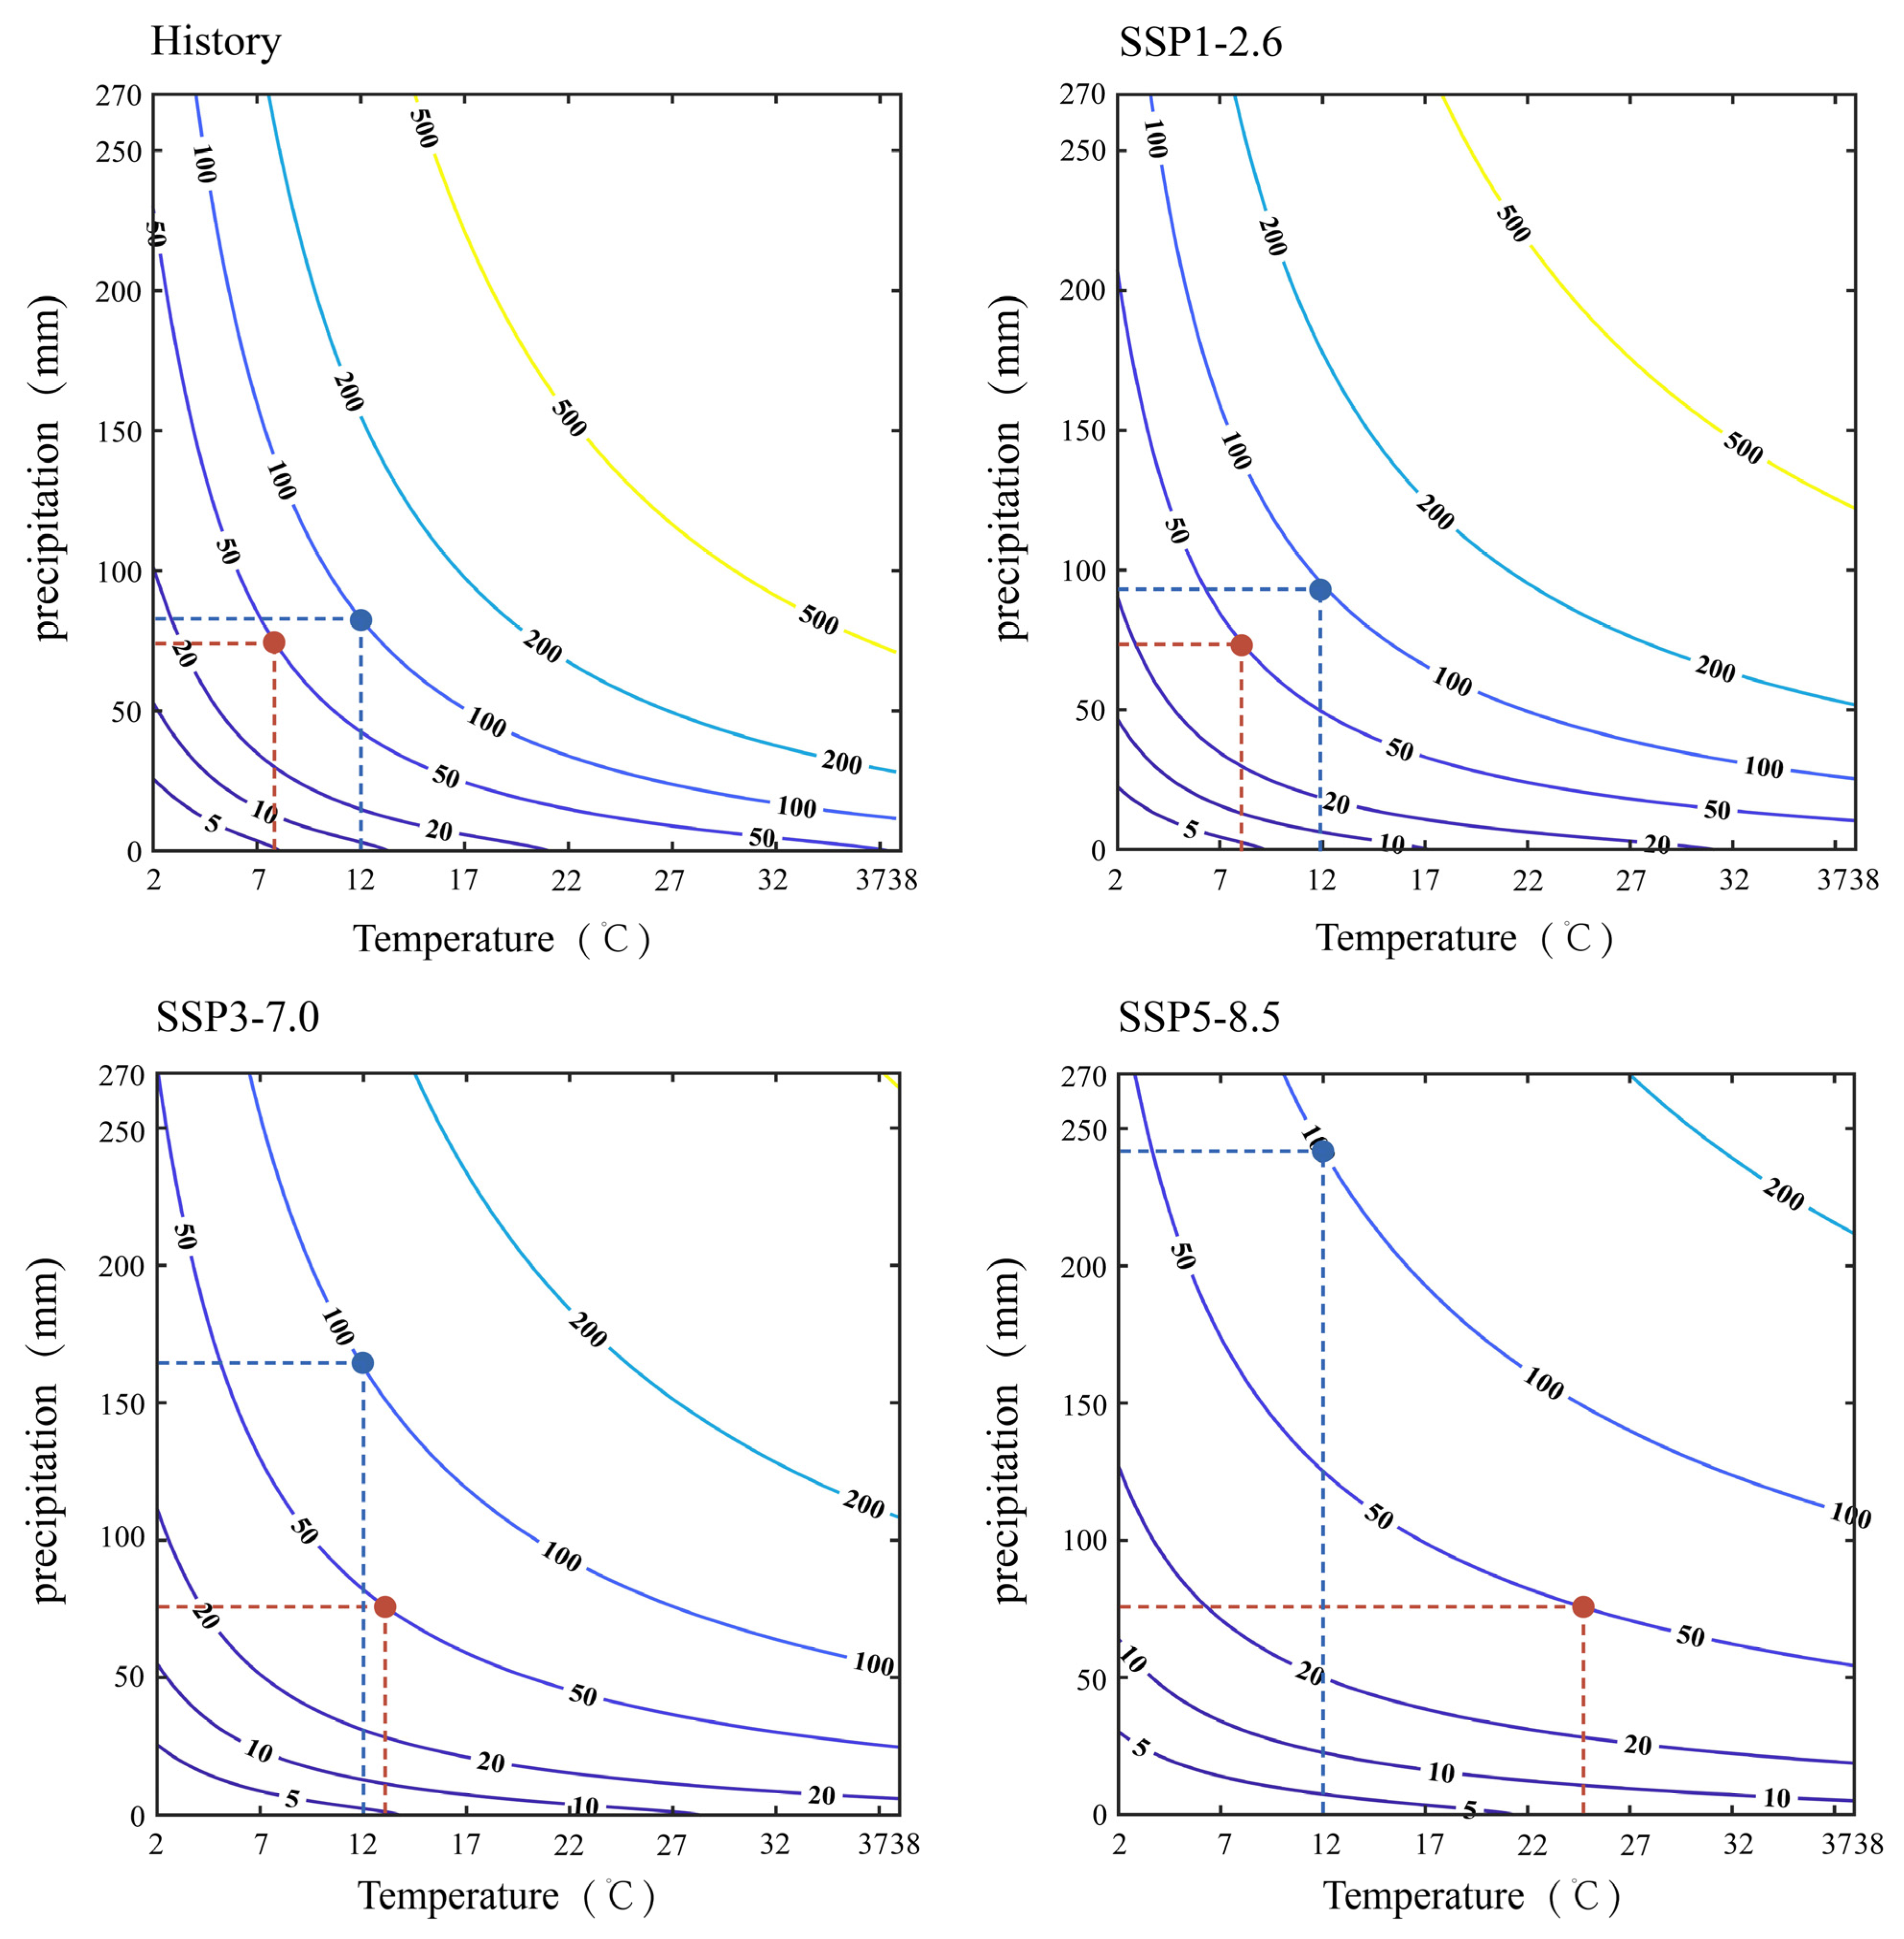
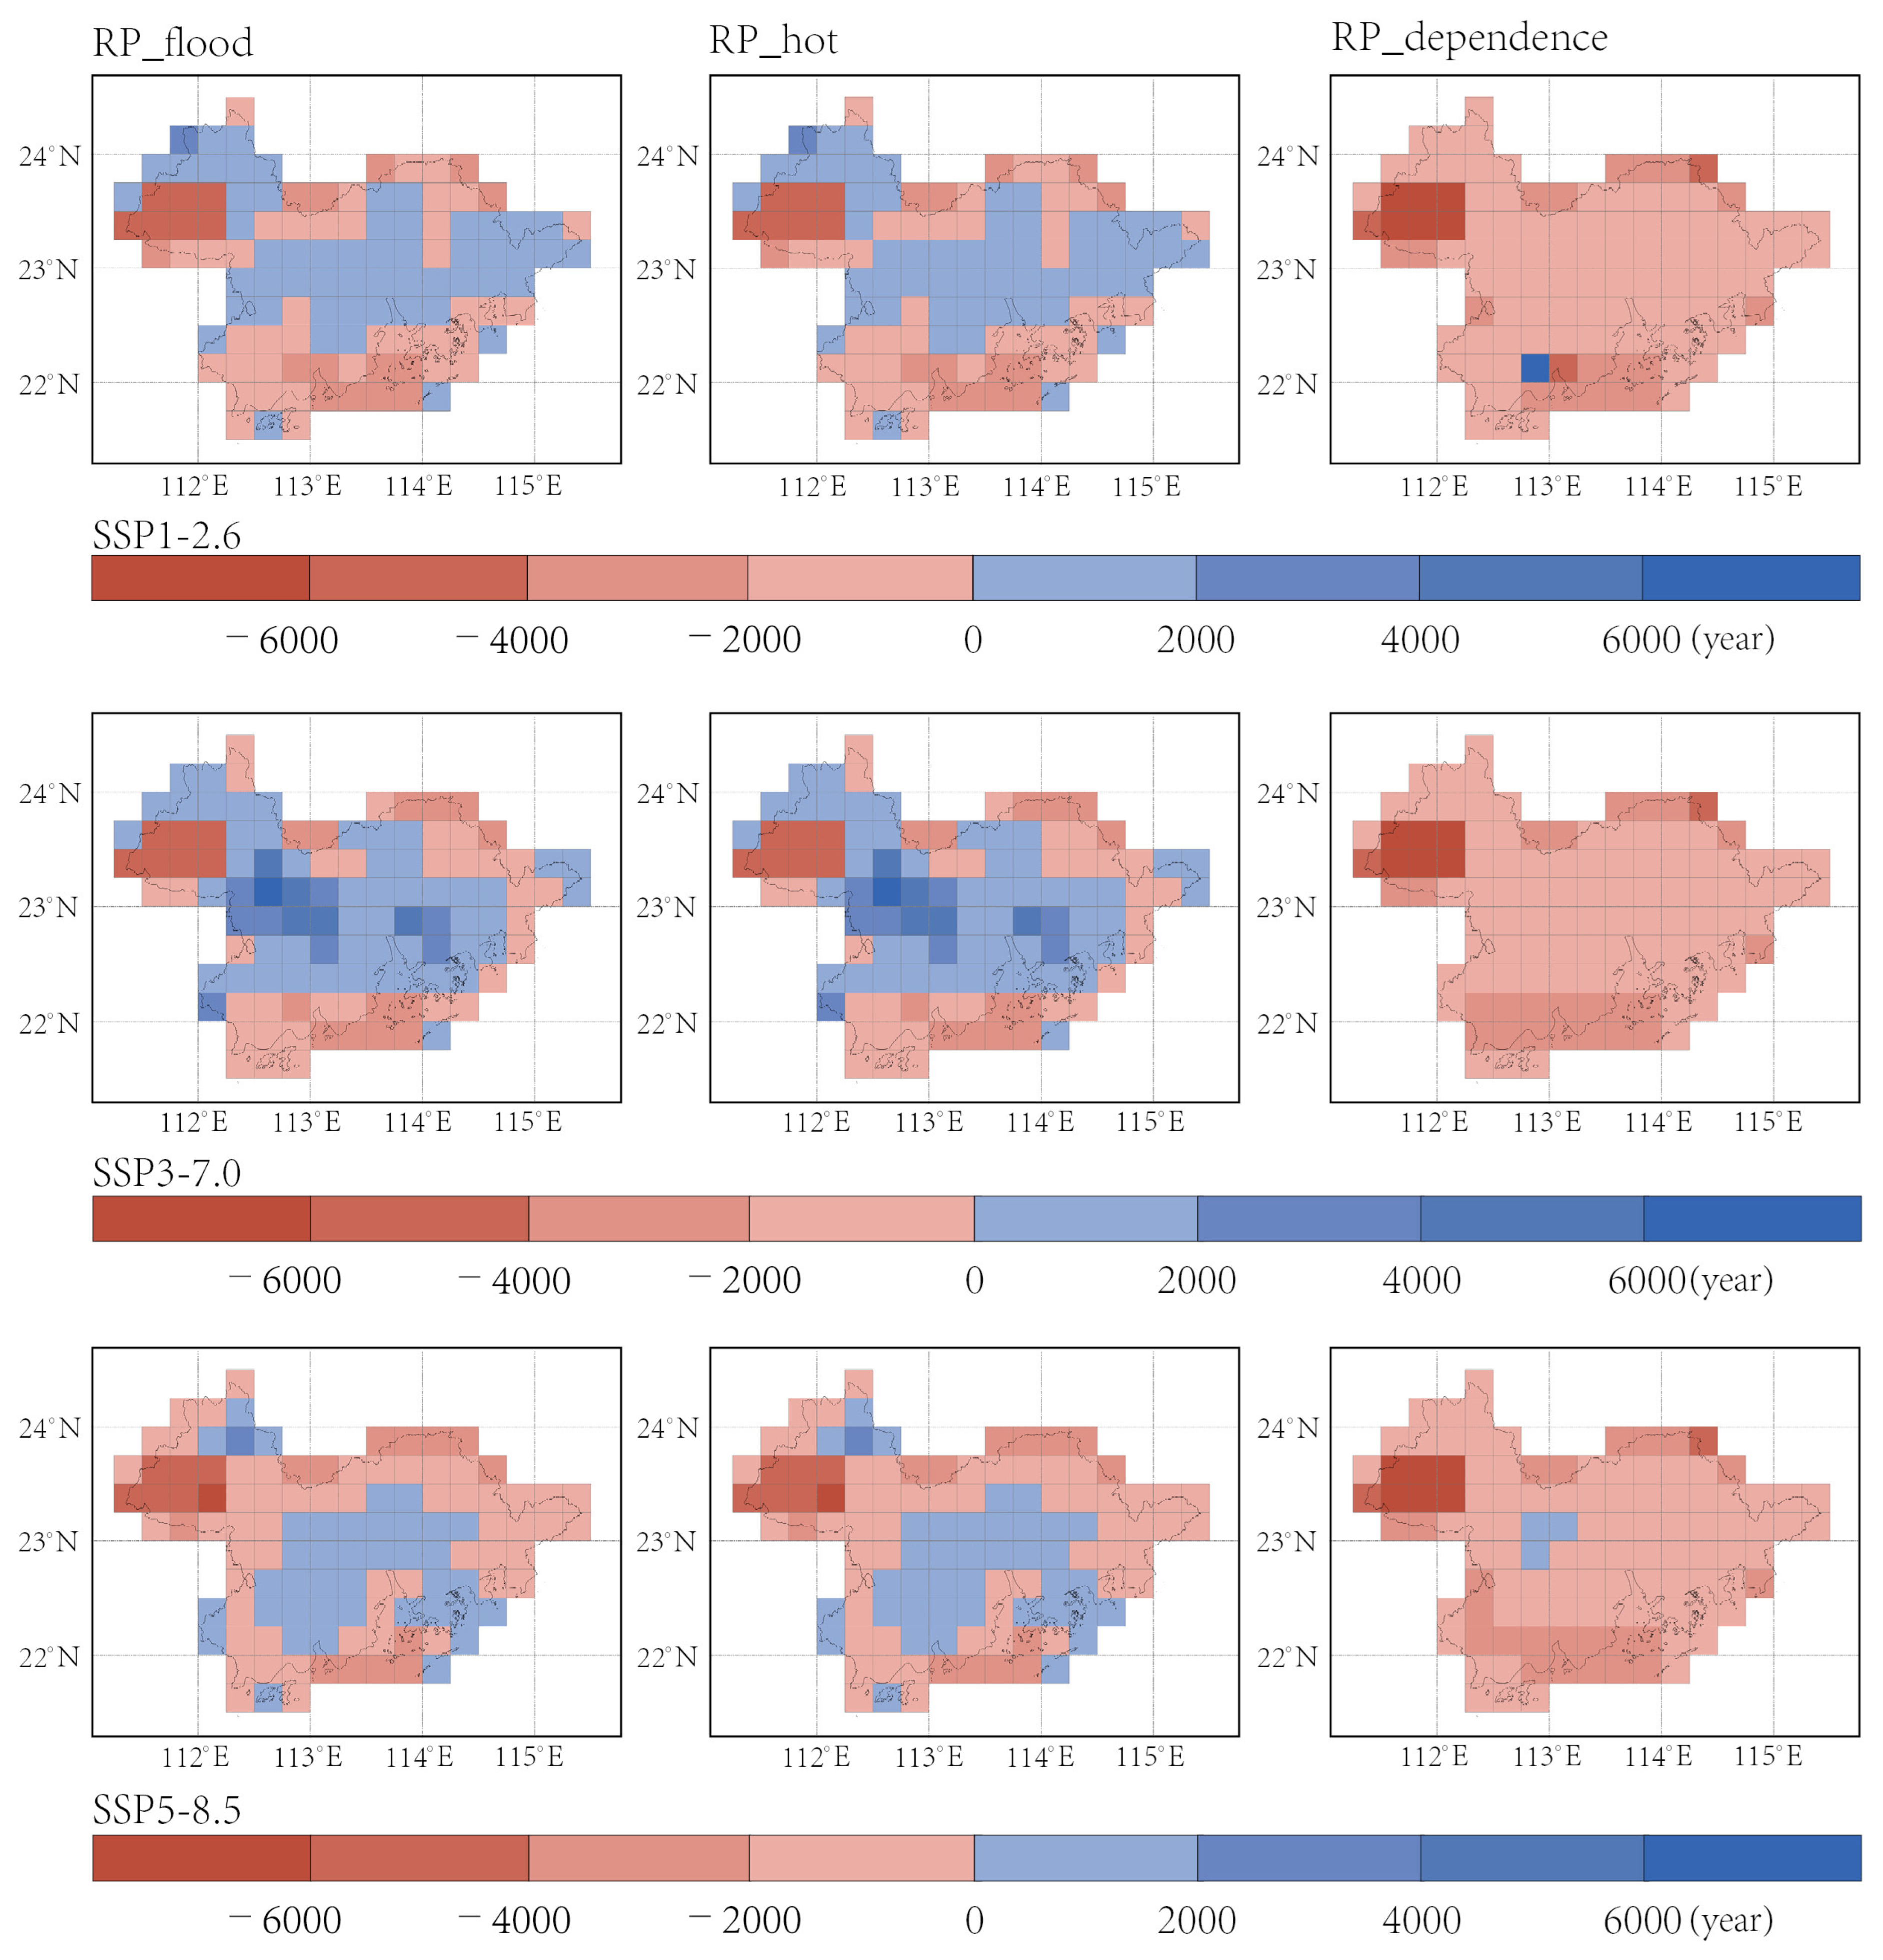
3.2.3. Projection of the Changes in CME Risk

Leveraging a three-and-a-half-decade chronicle of CMEs as a benchmark for prospective hazard delineation, a discernible contraction in the RP of CME was observed across the triad of SSP scenarios. This attenuation in RPs, emblematic of an uptick in event frequency, portends an accentuated prospective risk. This amplification was most salient under the high-emission SSP5-8.5 paradigm, signaling a profound exacerbation of CME perils within the GBA, as depicted in Figure 7. Such observations resonate with the insights of You and Wang. [12], who demarcated a Compound Heatwave and Heavy Rainfall event, forecasting an ascendant trajectory in its manifestation frequency over the ensuing quarter-century, accompanied by a pronounced risk augmentation ranging from 1- to 5-fold.
In the context of CME risk delineation with a rainfall threshold of 75 mm and a 50-year RP, the concomitant temperature metrics were cataloged as approximately 7.8 °C (historical), 8.0 °C (SSP1-2.6), 13.3 °C (SSP3-7.0), and a staggering 25.3 °C (SSP5-8.5). Such metrics intimate an intensifying virulence of CMEs under impending climatic paradigms, especially under SSP5-8.5, where the temperature metric soars to approximately 3.2 times its historical counterpart. Conversely, for CMEs demarcated by a temperature zenith of 12 °C and a centennial RP, the affiliated rainfall magnitudes were cataloged as 85 mm (historical), 95 mm (SSP1-2.6), 160 mm (SSP3-7.0), and 240 mm (SSP5-8.5). Such rainfall metrics signify a conspicuous surge relative to historical benchmarks, further underscoring the amplified perils CMEs might pose in forthcoming epochs. This aligns seamlessly with the prognostications of Zscheischler et al. [61], heralding an imminent escalation in both the frequency and ferocity of CMEs, catalyzed by climatic metamorphoses. Yet, it is imperative to acknowledge that this CME peril delineation, anchored predominantly on precipitation and thermal metrics, remains oblivious to indigenous determinants, encompassing land-use metamorphoses and climatic palliation strategies. Moreover, the intrinsic ambiguities stemming from the allegiance to a solitary GCM, circumscribed temporal data, and an insular climatic purview accentuate the exigency of a more expansive and integrative future inquiry.

3.2.4. Sensitivity Analysis on CMEs

The oscillations discerned in RPs can be attributed to modulations in the marginal distribution of UER and UEH, compounded by the intricate symbiosis between these meteorological extremities. When the variability was scrutinized exclusively within the UER ambit, a modest amplification in the anticipated CME frequency materialized. Across the GBA expanse, RPs under the SSP triad (i.e., SSP1-2.6, SSP3-7.0, and SSP5-8.5) were consistently abbreviated relative to the historical 35-year RP. In juxtaposition, when variability was contemplated singularly for thermal extremities, the projected CME frequency similarly manifested a modest uptick. Yet, accentuating the mutualism between UER and UEH culminated in a marked surge in CME frequency across the majority of locales under all SSP paradigms, as evinced in Figure 8.
Upon meticulous evaluation, the synergy between UER and UEH crystallized as the paramount determinant, amplifying CME frequency. This was inextricably linked with modulations in the marginal distribution of both UER and UEH. Such revelations find resonance in the research of Zscheischler and Seneviratne [23], which emphasized the pivotal role of the nuanced interplay between disparate meteorological extremities in the precision of CME risk prognostications. The outcomes further accentuate the imperative of assimilating these multifaceted interactions into risk assessment matrices and climatic adaptation stratagems.

3.2.5. Limitations and Recommendations

A salient constraint in this study emanates from its exclusive reliance on a singular GCM, which invariably infuses uncertainties from multifarious origins. Moreover, the inherent ambiguities arising from diverse emission trajectories and their intricate interplays underscore the imperative of harnessing an array of GCMs and emission paradigms in subsequent inquiries. This would fortify the veracity of CME risk prognostications. Yet, it is noteworthy that the deployment of the EC-Earth3-Veg-LR model, a constituent of the CMIP6 ensemble, renowned for its adeptness in simulating precipitation and thermal dynamics [45,47,48,49], has substantially mitigated this constraint. Meanwhile, the MERRA-2 dataset is widely recognized as a high-quality global atmospheric reanalysis dataset [41,43]. It offers valuable insights into targeted climatic phenomena, thereby partially alleviating uncertainties associated with a dataset. Additionally, the impact of spatial resolution on model outcomes remains a focal point in contemporary research [62,63]. Hence, employing the most accurate model in the Chinese region and the most precise downscaling techniques is used to mitigate these limitations [45,64,65].
Another potential pitfall pertains to the temporal scope of the dataset, spanning a mere 35 years, both historically and prospectively. A more expansive temporal canvas could potentially refine model precision, encapsulating a more diverse spectrum of natural oscillations and extremities. Ergo, elongating the data chronology would be instrumental in furnishing a more nuanced delineation of the temporal evolution of CMEs’ frequency and intensity.
Furthermore, this study’s geographical purview, confined to the GBA, represents a singular climatic enclave. The potential ramifications of diverse climatic terrains for CME risk dynamics remain uncharted. For instance, within equatorial climes, the propensity for thermally induced deluges might witness a significant surge, thereby amplifying CME frequency [66].
Subsequent scholarly endeavors should endeavor to redress these constraints. This could be achieved by integrating a plethora of GCMs, complemented by an eclectic array of emission trajectories and an extended temporal spectrum, to refine the precision of CME risk delineations. Expanding the geographical ambit of such inquiries to encompass a diverse array of climatic terrains would proffer a holistic perspective on the global dispersion of CME perils. Such comprehensive insights are paramount for the formulation of efficacious, regionally tailored strategies to preemptively address and mitigate the ramifications of climatic metamorphoses. Given the predicted increase in concurrent meteorological extremes, urban planners in the GBA should consider implementing more green spaces to combat urban heat and improving drainage systems to handle extreme rainfall. Policymakers might also consider public awareness campaigns about the risks of such concurrent events.

4. Conclusions

This investigation elucidated an avant-garde schema for prognosticating and appraising the peril of CMEs, intertwined with UEH and UER, within the GBA of China. This modus operandi eclipses conventional paradigms that singularly dissect UER or UEH, opting instead to fathom the synergistic ramifications of their confluence. Forecasts spanning the imminent epoch (2066–2100) presage a discernible amplification in CME peril, juxtaposed against the antecedent era (1980–2014).
Moreover, the empirical outcomes manifest a uniform augmentation in CME manifestations across the triad of SSP scenarios, with the GBA’s central nexus registering the most emphatic surge. Intriguingly, the SSP1-2.6 trajectory unveiled the most prolific proliferation in CME manifestations, albeit with attenuated intensity. In stark contrast, the SSP5-8.5 trajectory manifested the zenith of intensity and protraction, albeit punctuated by sporadic CME episodes. The peril quotient of CME, as delineated by the concomitant RP, evinced a pronounced ascendant trend in prospective epochs, notably under the high-emission vanguard, SSP5-8.5. Sensitivity dissections underscored the intricate symbiosis between UER and UEH as the cardinal architect of CME peril, succeeded by oscillations in their marginal distributions. Ergo, the insights proffered herein should be construed as a diagnostic of CME hazard trajectory for the GBA, accentuating the paramountcy of fortifying societal resilience, especially within precincts vulnerable to acute CME perils. This scholarly endeavor enriches the incipient domain of expansive hydro-climatic explorations, shedding light on a facet of climatic metamorphoses often relegated to obscurity.

Supplementary Materials

The following supporting information can be downloaded at: https://www.mdpi.com/article/10.3390/su16052153/s1, Figure S1: Probability density of UER; Figure S2: Probability density of UEH; Text S1: Methodology of Sensitivity analysis.

Author Contributions

Conceptualization, M.W. and J.L.; methodology, M.W. and Z.C.; software, Z.C., Q.R. and Y.W.; validation, D.Z., M.L., H.Y., J.L. and S.K.T.; formal analysis, M.L., J.L. and S.K.T.; investigation, Z.C.; data curation, Z.C., H.Y., S.Z. and C.F.; writing—original draft preparation, M.W., Z.C. and D.Z.; visualization, Z.C., B.C., Q.R., S.Z., Y.W. and C.F.; supervision, M.W., D.Z. and J.L. All authors have read and agreed to the published version of the manuscript.

Funding

This work was supported by Guangdong Basic and Applied Basic Research Foundation, China [grant number 2023A1515030158, 2023A1515012130]; Guangzhou Sci. Technol. Program, China [grant number 202201010431]; and Maoming Sci. Technol. Program, China [grant number 2021S0054].

Institutional Review Board Statement

Not applicable.

Informed Consent Statement

This study did not involve humans.

Data Availability Statement

Data are contained within the article.

Conflicts of Interest

The authors declare no conflicts of interest.

Abbreviations

BCSD, Bias Correction Spatial Disaggregation; CME, Concurrent Meteorological Extreme; GBA, Greater Bay Area; GCM, Global Climate Model; RP, Recurrence Period; SSP, shared socioeconomic pathway; UEH, Urban Extreme Heat; UER, Urban Extreme Rainfall.

References

  1. Allan, R.P.; Hawkins, E.; Bellouin, N.; Collins, B. 2021: Summary for Policymakers; IPCC: Geneva, Switzerland, 2021. [Google Scholar]
  2. Cai, W.; McPhaden, M.J.; Grimm, A.M.; Rodrigues, R.R.; Taschetto, A.S.; Garreaud, R.D.; Dewitte, B.; Poveda, G.; Ham, Y.-G.; Santoso, A.; et al. Climate impacts of the El Nino-Southern Oscillation on South America. Nat. Rev. Earth Environ. 2020, 1, 215–231. [Google Scholar] [CrossRef]
  3. Bras, T.A.; Seixas, J.; Carvalhais, N.; Jagermeyr, J. Severity of drought and heatwave crop losses tripled over the last five decades in Europe. Environ. Res. Lett. 2021, 16, 065012. [Google Scholar] [CrossRef]
  4. Forzieri, G.; Bianchi, A.; Silva, F.B.E.; Herrera, M.A.M.; Leblois, A.; Lavalle, C.; Aerts, J.; Feyen, L. Escalating impacts of climate extremes on critical infrastructures in Europe. Glob. Environ. Chang. 2018, 48, 97–107. [Google Scholar] [CrossRef] [PubMed]
  5. Garuma, G.F. Tropical surface urban heat islands in east Africa. Sci. Rep. 2023, 13, 4509. [Google Scholar] [CrossRef] [PubMed]
  6. Harrington, L.J. Rethinking extreme heat in a cool climate: A New Zealand case study. Environ. Res. Lett. 2021, 16, 034030. [Google Scholar] [CrossRef]
  7. Chen, Y.; Liao, Z.; Shi, Y.; Tian, Y.; Zhai, P. Detectable Increases in Sequential Flood-Heatwave Events Across China During 1961–2018. Geophys. Res. Lett. 2021, 6, e2021GL092549. [Google Scholar] [CrossRef]
  8. Liao, Z.; Chen, Y.; Li, W.; Zhai, P. Growing Threats From Unprecedented Sequential Flood-Hot Extremes Across China. Geophys. Res. Lett. 2021, 18, e2021GL094505. [Google Scholar] [CrossRef]
  9. Deng, Z.; Wang, Z.; Wu, X.; Lai, C.; Zeng, Z. Strengthened tropical cyclones and higher flood risk under compound effect of climate change and urbanization across China’s Greater Bay Area. Urban Clim. 2022, 44, 101224. [Google Scholar] [CrossRef]
  10. Raghavendra, A.; Dai, A.; Milrad, S.M.; Cloutier-Bisbee, S.R. Floridian heatwaves and extreme precipitation: Future climate projections. Clim. Dynam. 2019, 52, 495–508. [Google Scholar] [CrossRef]
  11. Fowler, H.J.; Lenderink, G.; Prein, A.F.; Westra, S.; Allan, R.P.; Ban, N.; Barbero, R.; Berg, P.; Blenkinsop, S.; Do, H.X.; et al. Anthropogenic intensification of short-duration rainfall extremes. Nat. Rev. Earth. Environ. 2021, 2, 107–122. [Google Scholar] [CrossRef]
  12. You, J.; Wang, S. Higher Probability of Occurrence of Hotter and Shorter Heat Waves Followed by Heavy Rainfall. Geophys. Res. Lett. 2021, 17, e2021GL094831. [Google Scholar] [CrossRef]
  13. Matthews, T.; Wilby, R.L.; Murphy, C. An emerging tropical cyclone-deadly heat compound hazard. Nat. Clim. Chang. 2019, 9, 602–606. [Google Scholar] [CrossRef]
  14. Parker, T.J.; Berry, G.J.; Reeder, M.J. The influence of tropical cyclones on heat waves in Southeastern Australia. Geophys. Res. Lett. 2013, 23, 6264–6270. [Google Scholar] [CrossRef]
  15. Cappucci, M. Storms Deluge New York City, Abruptly Ending Sweltering Heat Wave. Washington Post. 2019. Available online: https://www.washingtonpost.com/weather/2019/07/23/flooding-rain-deluges-new-york-city-abruptly-ending-sweltering-heat-wave/ (accessed on 2 January 2024).
  16. Zhang, W.; Villarini, G. Deadly Compound Heat Stress-Flooding Hazard Across the Central United States. Geophys. Res. Lett. 2020, 15, e2020GL089185. [Google Scholar] [CrossRef]
  17. Sharma, S.; Mujumdar, P.P. On the relationship of daily rainfall extremes and local mean temperature. J. Hydrol. 2019, 572, 179–191. [Google Scholar] [CrossRef]
  18. Sim, I.; Lee, O.; Kim, S. Sensitivity Analysis of Extreme Daily Rainfall Depth in Summer Season on Surface Air Temperature and Dew-Point Temperature. Water 2019, 4, 771. [Google Scholar] [CrossRef]
  19. Chen, H.; Wang, S.; Wang, Y. Exploring Abrupt Alternations Between Wet and Dry Conditions on the Basis of Historical Observations and Convection-Permitting Climate Model Simulations. J. Geophys. Res. Atmos. 2020, 125, e2019JD031982. [Google Scholar] [CrossRef]
  20. Mukherjee, S.; Mishra, A.K. Increase in Compound Drought and Heatwaves in a Warming World. Geophys. Res. Lett. 2021, 1, e2020GL090617. [Google Scholar] [CrossRef]
  21. Ridder, N.N.; Pitman, A.J.; Westra, S.; Ukkola, A.; Hong, X.D.; Bador, M.; Hirsch, A.L.; Evans, J.P.; Di Luca, A.; Zscheischler, J. Global hotspots for the occurrence of compound events. Nat. Commun. 2020, 11, 5956. [Google Scholar] [CrossRef]
  22. Zhou, S.; Williams, A.P.; Berg, A.M.; Cook, B.I.; Zhang, Y.; Hagemann, S.; Lorenz, R.; Seneviratne, S.I.; Gentine, P. Land-atmosphere feedbacks exacerbate concurrent soil drought and atmospheric aridity. Proc. Natl. Acad. Sci. USA 2019, 38, 18848–18853. [Google Scholar] [CrossRef]
  23. Zscheischler, J.; Seneviratne, S.I. Dependence of drivers affects risks associated with compound events. Sci. Adv. 2017, 6, e1700263. [Google Scholar] [CrossRef]
  24. Li, C.; Wang, J.; Liu, M.; Ayal, D.Y.; Gong, Q.; Hu, R.; Yin, S.; Bao, Y. Scenario-based hazard analysis of extreme high-temperatures experienced between 1959 and 2014 in Hulunbuir, China. Int. J. Clim. Chang. Str. 2018, 11, 2–17. [Google Scholar] [CrossRef]
  25. Thompson, V.; Kennedy-Asser, A.T.; Vosper, E.; Lo, Y.T.E.; Huntingford, C.; Andrews, O.; Collins, M.; Hegerl, G.C.; Mitchell, D. The 2021 western North America heat wave among the most extreme events ever recorded globally. Sci. Adv. 2022, 18, eabm6860. [Google Scholar] [CrossRef]
  26. Moghim, S.; Jahangir, M.S. Reliability framework for characterizing heat wave and cold spell events. Nat. Hazards 2022, 2, 1503–1525. [Google Scholar] [CrossRef]
  27. Abeysingha, N.S.; Kularathna, K.M.; Bandara, A.; Ray, R.L. Assessment of extreme rainfall through statistical process control-I chart. J. Earth. Syst. Sci. 2023, 132, 15. [Google Scholar] [CrossRef]
  28. Chen, H.; Xu, Z.; Chen, J.; Liu, Y.; Li, P. Joint Risk Analysis of Extreme Rainfall and High Tide Level Based on Extreme Value Theory in Coastal Area. Int. J. Environ. Res. Public Health 2023, 4, 3605. [Google Scholar] [CrossRef] [PubMed]
  29. Qing, Y.M.; Wang, S. Multi-decadal convection-permitting climate projections for China’s Greater Bay Area and surroundings. Clim. Dynam. 2021, 57, 415–434. [Google Scholar] [CrossRef]
  30. Pandey, P.K.; Das, L.; Jhajharia, D.; Pandey, V. Modelling of interdependence between rainfall and temperature using copula. Model. Earth Syst. Environ. 2018, 4, 867–879. [Google Scholar] [CrossRef]
  31. Pumo, D.; Carlino, G.; Blenkinsop, S.; Arnon, E.; Fowler, H.; Noto, L.V. Sensitivity of extreme rainfall to temperature in semi-arid Mediterranean regions. Atmos. Res. 2019, 225, 30–44. [Google Scholar] [CrossRef]
  32. Chowdhury, M.A.; Zzaman, R.U.; Tarin, N.J.; Hossain, M.J. Spatial variability of climatic hazards in Bangladesh. Nat. Hazards 2022, 3, 2329–2351. [Google Scholar] [CrossRef]
  33. World Bank. East Asia’s Changing Urban Landscape: Measuring a Decade of Spatial Growth; World Bank: Washington, DC, USA, 2015. [Google Scholar]
  34. Yang, C.; Li, Q.; Zhao, T.; Liu, H.; Gao, W.; Shi, T.; Guan, M.; Wu, G. Detecting Spatiotemporal Features and Rationalities of Urban Expansions within the Guangdong-Hong Kong-Macau Greater Bay Area of China from 1987 to 2017 Using Time-Series Landsat Images and Socioeconomic Data. Remote Sens. 2019, 11, 2215. [Google Scholar] [CrossRef]
  35. Wang, Y.; Han, Z.; Gao, R. Changes of extreme high temperature and heavy precipitation in the Guangdong-Hong Kong-Macao Greater Bay Area. Geomat. Nat. Hazards Risk 2021, 12, 1101–1126. [Google Scholar] [CrossRef]
  36. Wang, J.; Chen, Y.; Liao, W.; He, G.; Tett, S.F.B.; Yan, Z.; Zhai, P.; Feng, J.; Ma, W.; Huang, C.; et al. Anthropogenic emissions and urbanization increase risk of compound hot extremes in cities. Nat. Clim. Chang. 2021, 11, 1084–1089. [Google Scholar] [CrossRef]
  37. Ye, H.Y.; Huang, Z.Q.; Huang, L.L.; Lin, L.J.; Luo, M. Effects of urbanization on increasing heat risks in South China. Int. J. Climatol. 2018, 38, 5551–5562. [Google Scholar] [CrossRef]
  38. Du, J.; Wang, K.; Wang, J.; Jiang, S.; Zhou, C. Diurnal Cycle of Surface Air Temperature within China in Current Reanalyses: Evaluation and Diagnostics. J. Clim. 2018, 31, 4585–4603. [Google Scholar] [CrossRef]
  39. Gelaro, R.; McCarty, W.; Suarez, M.J.; Todling, R.; Molod, A.; Takacs, L.; Randles, C.A.; Darmenov, A.; Bosilovich, M.G.; Reichle, R.; et al. The Modern-Era Retrospective Analysis for Research and Applications, Version 2 (MERRA-2). J. Clim. 2017, 30, 5419–5454. [Google Scholar] [CrossRef]
  40. Zhang, H.; Immerzeel, W.W.; Zhang, F.; de Kok, R.J.; Gorrie, S.J.; Ye, M. Creating 1-km long-term (1980–2014) daily average air temperatures over the Tibetan Plateau by integrating eight types of reanalysis and land data assimilation products downscaled with MODIS-estimated temperature lapse rates based on machine learning. Int. J. Appl. Earth Obs. 2021, 97, 102295. [Google Scholar] [CrossRef]
  41. Gueymard, C.A.; Yang, D. Worldwide validation of CAMS and MERRA-2 reanalysis aerosol optical depth products using 15 years of AERONET observations. Atmos. Environ. 2020, 225, 117216. [Google Scholar] [CrossRef]
  42. Jiang, J.; Zhou, T.; Zhang, W. Evaluation of Satellite and Reanalysis Precipitable Water Vapor Data Sets Against Radiosonde Observations in Central Asia. Earth Space Sci. 2019, 6, 1129–1148. [Google Scholar] [CrossRef]
  43. Song, Y.; Wei, J. Diurnal cycle of summer precipitation over the North China Plain and associated land-atmosphere interactions: Evaluation of ERA5 and MERRA-2. Int. J. Climatol. 2021, 41, 6031–6046. [Google Scholar] [CrossRef]
  44. Yang, D.; Bright, J.M. Worldwide validation of 8 satellite-derived and reanalysis solar radiation products: A preliminary evaluation and overall metrics for hourly data over 27 years. Sol. Energy 2020, 210, 3–19. [Google Scholar] [CrossRef]
  45. Thrasher, B.; Wang, W.L.; Michaelis, A.; Melton, F.; Lee, T.; Nemani, R. NASA Global Daily Downscaled Projections, CMIP6. Sci. Data 2022, 9, 262. [Google Scholar] [CrossRef] [PubMed]
  46. Xie, W.; Wang, S.; Yan, X. Evaluation and Projection of Diurnal Temperature Range in Maize Cultivation Areas in China Based on CMIP6 Models. Sustainability 2022, 14, 1660. [Google Scholar] [CrossRef]
  47. Lu, K.; Arshad, M.; Ma, X.; Ullah, I.; Wang, J.; Shao, W. Evaluating observed and future spatiotemporal changes in precipitation and temperature across China based on CMIP6-GCMs. Int. J. Climatol. 2022, 42, 7703–7729. [Google Scholar] [CrossRef]
  48. Patel, G.; Das, S.; Das, R. Identification of Best CMIP6 Global Climate Model for Rainfall by Ensemble Implementation of MCDM Methods and Statistical Inference. Water Resour. Manag. 2023, 37, 5147–5170. [Google Scholar] [CrossRef]
  49. Xiao, H.; Zhuo, Y.; Sun, H.; Pang, K.; An, Z. Evaluation and Projection of Climate Change in the Second Songhua River Basin Using CMIP6 Model Simulations. Atmosphere 2023, 14, 1429. [Google Scholar] [CrossRef]
  50. O’Neill, B.C.; Tebaldi, C.; van Vuuren, D.P.; Eyring, V.; Friedlingstein, P.; Hurtt, G.; Knutti, R.; Kriegler, E.; Lamarque, J.-F.; Lowe, J.; et al. The Scenario Model Intercomparison Project (ScenarioMIP) for CMIP6. Geosci. Model Dev. 2016, 9, 3461–3482. [Google Scholar] [CrossRef]
  51. Rhoades, A.M.; Jones, A.D.; Srivastava, A.; Huang, H.; O’Brien, T.A.; Patricola, C.M.; Ullrich, P.A.; Wehner, M.; Zhou, Y. The Shifting Scales of Western US Landfalling Atmospheric Rivers Under Climate Change. Geophys. Res. Lett. 2020, 17, e2020GL089096. [Google Scholar] [CrossRef]
  52. Shi, H.; Garcia-Reyes, M.; Jacox, M.G.; Rykaczewski, R.R.; Black, B.A.; Bograd, S.J.; Sydeman, W.J. Co-occurrence of California Drought and Northeast Pacific Marine Heatwaves Under Climate Change. Geophys. Res. Lett. 2021, 17, e2021GL092765. [Google Scholar] [CrossRef]
  53. Cheng, J.; Xu, Z.; Zhao, D.; Xie, M.; Zhang, H.; Wang, S.; Su, H. The burden of extreme heat and heatwave on emergency ambulance dispatches: A time-series study in Huainan, China. Sci. Total Environ. 2016, 571, 27–33. [Google Scholar] [CrossRef]
  54. Urban, A.; Hanzlikova, H.; Kysely, J.; Plavcova, E. Impacts of the 2015 Heat Waves on Mortality in the Czech Republic-A Comparison with Previous Heat Waves. Int. J. Environ. Res. Public. Health 2017, 14, 1562. [Google Scholar] [CrossRef]
  55. Yin, J.; Guo, S.; Gentine, P.; Sullivan, S.C.; Gu, L.; He, S.; Chen, J.; Liu, P. Does the Hook Structure Constrain Future Flood Intensification Under Anthropogenic Climate Warming? Water Resour. Res. 2021, 2, e2020WR028491. [Google Scholar] [CrossRef]
  56. Chapman, T.G. Stochastic models for daily rainfall in the Western Pacific. Math. Comput. Simulat. 1997, 43, 351–358. [Google Scholar] [CrossRef]
  57. Yu, Y.; Chen, L.; Xiao, Y.; Chang, C.-C.; Zhi, X.; Shen, Z. New framework for assessing urban stormwater management measures in the context of climate change. Sci. Total Environ. 2022, 813, 151901. [Google Scholar] [CrossRef]
  58. Bevacqua, E.; Maraun, D.; Vousdoukas, M.I.; Voukouvalas, E.; Vrac, M.; Mentaschi, L.; Widmann, M. Higher probability of compound flooding from precipitation and storm surge in Europe under anthropogenic climate change. Sci. Adv. 2019, 9, eaaw5531. [Google Scholar] [CrossRef] [PubMed]
  59. Arias, P.; Bellouin, N.; Coppola, E.; Jones, R.; Krinner, G.; Marotzke, J.; Naik, V.; Palmer, M.; Plattner, G.-K.; Rogelj, J. Climate Change 2021: The Physical Science Basis. Contribution of Working Group I to the Sixth Assessment Report of the Intergovernmental Panel on Climate Change; Technical Summary; IPCC: Montreal, QC, Canada, 2021. [Google Scholar]
  60. Zscheischler, J.; Westra, S.; Van Den Hurk, B.J.; Seneviratne, S.I.; Ward, P.J.; Pitman, A.; AghaKouchak, A.; Bresch, D.N.; Leonard, M.; Wahl, T. Future climate risk from compound events. Nat. Clim. Chang. 2018, 6, 469–477. [Google Scholar] [CrossRef]
  61. Zscheischler, J.; Martius, O.; Westra, S.; Bevacqua, E.; Raymond, C.; Horton, R.M.; van den Hurk, B.; AghaKouchak, A.; Jézéquel, A.; Mahecha, M.D. A typology of compound weather and climate events. Nat. Rev. Earth Environ. 2020, 7, 333–347. [Google Scholar] [CrossRef]
  62. Giorgi, F.; Raffaele, F. On the dependency of GCM-based regional surface climate change projections on model biases, resolution and climate sensitivity. Clim. Dynam. 2022, 58, 2843–2862. [Google Scholar] [CrossRef]
  63. Su, X.; Shao, W.; Liu, J.; Jiang, Y. Multi-Site Statistical Downscaling Method Using GCM-Based Monthly Data for Daily Precipitation Generation. Water 2020, 12, 904. [Google Scholar] [CrossRef]
  64. Gutmann, E.; Pruitt, T.; Clark, M.P.; Brekke, L.; Arnold, J.R.; Raff, D.A.; Rasmussen, R.M. An intercomparison of statistical downscaling methods used for water resource assessments in the United States. Water Resour. Res. 2014, 50, 7167–7186. [Google Scholar] [CrossRef]
  65. Hwang, S.; Graham, W.D. Assessment of alternative methods for statistically downscaling daily GCM precipitation outputs to simulate regional streamflow. J. Am. Water Resour. Assoc. 2014, 50, 1010–1032. [Google Scholar] [CrossRef]
  66. Alfieri, L.; Bisselink, B.; Dottori, F.; Naumann, G.; de Roo, A.; Salamon, P.; Wyser, K.; Feyen, L. Global projections of river flood risk in a warmer world. Earth’s Future 2017, 2, 171–182. [Google Scholar] [CrossRef]
Figure 1. Illustrative model delineating this study’s conceptual framework. Note: “95th” denotes threshold. A UEH event was defined as an event in which the temperature was above the 95th percentile for at least three consecutive days. UER events were characterized as sequential days with daily precipitation surpassing the 95th percentile.
Sustainability 16 02153 g001
Figure 2. Geographical depiction of the designated study area.
Sustainability 16 02153 g002
Figure 3. Visual representation of cumulative probability density distributions for UER and UEH during the future period (2066–2100) under the specified SSP1-2.6, SSP3-7.0, and SSP5-8.5 scenarios.
Sustainability 16 02153 g003
Figure 4. Comparative analysis of CME during the historical (1980–2014) and future (2066–2100) periods under SSP1-2.6, SSP3-7.0, and SSP5-8.5 scenarios. Red (blue) hues indicate areas where the number of events is increasing (decreasing).
Sustainability 16 02153 g004
Figure 5. Recurrence period contour delineations for the area exhibiting the most pronounced sensitivity (indicated by the most intense red) under the SSP1-2.6, SSP3-7.0, and SSP5-8.5 scenarios. Region A is defined as the area exhibiting the most pronounced sensitivity. (a) The RP in region A under SSP1-2.6 scenario. (b) The RP in region A under SSP3-7.0 scenario. (c) The RP in region A under SSP5-8.5 scenario. (d) Region A showing the most obvious sensitivity (indicated by the most intense red one) in the SSP5-8.5 scenario. (e) RP distribution plots for three SSPs on the same coordinate system.
Sustainability 16 02153 g005
Figure 6. Proportional representation of CME in the GBA during the historical period (1980–2014) and under SSP1-2.6, SSP3-7.0, and SSP5-8.5 scenarios for the future period (2066–2100). The proportions of (a) total UER events and (b) total UEH events are shown.
Sustainability 16 02153 g006
Figure 7. A comparative assessment elucidating the alterations in RPs for CMEs juxtaposing historical and future periods in the historical baseline, SSP1-2.6, SSP3-7.0, and SSP5-8.5 scenarios.
Sustainability 16 02153 g007
Figure 8. Changes in RPs induced by UER, UEH, and dependence for the 35-Year period during 2066–2100 under SSP1-2.6, SSP3-7.0, and SSP5-8.5 scenarios. Red (blue) hues denote decreases (increases) in return periods. The darker the color, the larger the value.
Sustainability 16 02153 g008
Table 1. A synopsis of marginal distributions employed in this study.
Marginal DistributionProbability Density FunctionParameters
P-III f x a , b , c = 1 b a Γ α x c a 1 e x p ( x c ) b a and b are shape and location parameters.
Gamma f x a , b = 1 b a Γ α x a 1 e x p x b a and b are shape and scale parameters.
Normal f x a , b = 1 b 2 π e x p ( x a ) 2 2 b 2 a and b are mean and standard deviations.
Weibull f x a , b = b a x a e x p x a b a and b are mean and standard deviations.
Table 2. Two-parameter Copula function utilized in this study.
TypeFunctionParameters
Frank C F r a n k θ = 1 θ I n 1 + e x p θ F t c 1 e x p θ 1 θ is associated parameter.
Gumbel C G u m b e l θ = e x p I n F Q C θ + I n F t c θ 1 / θ
Clayton C C l a y t o n θ = e x p F Q C θ + F t c θ 1 1 / θ
Table 3. Statistical presentation of climatic characteristics under representative climate conditions.
Mean Daily Precipitation Accumulation of UER Events within CME (mm)Mean Daily Temperature Magnitude of
UEH Events within CME (°C)
Duration (Day)1373714
History period34.944.240.033.033.434.1
SSP1-2.628.931.841.431.131.432.2
SSP3-7.030.637.138.633.133.433.7
SSP5-8.532.440.247.533.934.435.2
Disclaimer/Publisher’s Note: The statements, opinions and data contained in all publications are solely those of the individual author(s) and contributor(s) and not of MDPI and/or the editor(s). MDPI and/or the editor(s) disclaim responsibility for any injury to people or property resulting from any ideas, methods, instructions or products referred to in the content.

