Article

Do Living Arrangements and Eating Habits Influence University Students’ Food Waste Perception in Italy and Poland?

by
Małgorzata Miśniakiewicz
1,
Vera Amicarelli
2,
Grzegorz Chrobak
3,
Agnieszka Górka-Chowaniec
4 and
Christian Bux
2,*
1
Department of Food Product Quality, Krakow University of Economics, 30033 Krakow, Poland
2
Department of Economics, Management and Business Law, University of Bari Aldo Moro, 70124 Bari, Italy
3
Institute of Spatial Management, Wroclaw University of Environmental and Life Sciences, 50375 Wroclaw, Poland
4
Department of Physical Culture and Tourism Management, Jerzy Kukuczka Academy of Physical Education in Katowice, 40065 Katowice, Poland
*
Author to whom correspondence should be addressed.
Sustainability 2024, 16(5), 2102; https://doi.org/10.3390/su16052102
Submission received: 29 January 2024 / Revised: 26 February 2024 / Accepted: 29 February 2024 / Published: 3 March 2024
(This article belongs to the Special Issue Smart and Sustainable Food Supply Chain Management)

Abstract

:
Consumers’ perception plays a central role in tackling food waste at the final consumption stage, specifically among university students. In Europe, it is estimated that 47 to 67 Mt of food waste is generated at the household level or at food service consumption, including university canteens. The present cross-country research, through an online-based questionnaire among university students, investigates students’ perception on food waste by distinguishing among two different categories: on the one side, students living with their family; on the other side, students living without their family. Further, the research distinguishes among students eating at university canteens, students preparing food at home, students purchasing take-away foods and students coming back home to eat. The study compares university students’ perception on food waste in Italy and in Poland, with the overarching purpose of shaping sustainable pathways and defining educational interventions to enhance students’ perception and awareness on food waste. Data are analyzed according to the Mann–Whitney U test and the Kruskal–Wallis test. Age is a pivotal factor and suggests a generational gap in awareness and attitude toward food waste, whereas sex significantly affects food waste perception in Poland but not in Italy, suggesting a more homogeneous perception across sexes. The research highlights the impacts that socio-economic and environmental crises (e.g., climate change, the Russia–Ukraine conflict, high inflation rates) have on food waste perception in Poland, which is closer to that of Russia and Ukraine compared to that of Italy, and provides academics, practitioners and public authorities with practical and theoretical insights toward food waste minimization.

1. Introduction

Consumers’ perception plays a central role in tackling food waste at the final consumption stage, specifically among university students [1,2], since perception, defined as “the ability to see, hear or become aware of something through the senses” [3], represents the first variable in the awareness–attitude–behavior mechanism toward food waste minimization. Specifically, interventions on food waste perception are more likely to influence changes in consumers’ behavior more than interventions on food waste attitude [4]. In Europe, an amount of about 57 Mt of food waste was estimated in 2020, of which on average of 11% was generated at primary production, 20% at processing and manufacturing, 7% at retail and distribution, 9% at restaurants and food services and 53% at households, for an amount of 127 kg per person per year [5,6]. In the ranking of the five countries that generate the most food waste, it results that Italy and Poland rank third and fifth place, with, respectively, 8.65 Mt and 4 Mt of food being discarded. Out of the total, about 59% of food waste is generated at restaurants, food services and households, highlighting the need to intervene in the field of consumers’ perception and behavior [7,8,9]. Specifically, considering that universities may be comparable to mini-cities or large businesses [10,11] and that university students are one of the largest food-wasting group [12,13], it is essential to intervene on such a segment of the population.
The existing body of research has been largely interested in food waste among young generations, from school pupils [14,15] to university students [16], and the main research trends refer to the analysis of consumers’ behavior [17], waste valorization [18], disposal drivers [19] and environmental consequences [20]. Qian et al. [19] identified the main drivers for food waste generation, highlighting the multidimensional factors that contribute to high amounts of waste among university students, such as sex, education, family wealth, presence of others, time pressure and location. Further, the need to enhance practical and effective guidance and incentive measures was stressed, for instance, tasting spoons, guest forecasting tools and plate waste trackers [17]. Under the quantitative perspective, Malefors et al. [17] estimated a rather possible reduction in food waste from 44 to 6 g per student, if suitable measures are introduced.
According to the waste management hierarchy (Directive 2008/98/EC), the purpose of the European Union is to prevent or minimize waste, with specific reference to food waste, as highlighted by the circular economy action plan [21]. Considering the circular economy monitoring framework, which includes ten indicators related to commodity production and consumption, waste management, secondary raw materials, competitiveness and innovation [6], one specific indicator is addressed to determining food waste. Specifically, the monitoring framework aims at measuring food waste at the production, distribution and consumption stages in mass units by highlighting its “undue pressure on finite natural resources, the environment and climate change” and by stressing its important financial costs [22].
In light of these premises, the present research investigated food waste perception among university students in Italy and Poland, which ranked third and fifth place in the top five countries that waste the most food in Europe. Such countries generate about 12.65 Mt of food waste per year, which is equal to 14% of the European amount [5]. It carried out an online-based questionnaire among university students, distinguishing between students living with their family and students living alone. Further, it distinguished among students eating at university canteens, students preparing food at home, students purchasing take-away foods and students coming back home to eat. The purpose of the study was to answer the subsequent research question: “Do living arrangements and eating habits influence university students’ food waste perception in Italy and Poland?”. The findings from this research are essential to defining sustainable pathways and educational interventions to enhance students’ perception and awareness of food waste, as well as to provide academics, practitioners and public authorities with practical and theoretical insights toward food waste minimization. To the best of the authors’ knowledge, the current analysis represents the first that relates food waste perception among university students and their alternative living arrangements options. The results of the living arrangements are crucial in comprehending students’ identity development in terms of status and life experiences [23], but also in shaping more sustainable and healthy food habits [24,25].

2. Research Context

2.1. Food Waste in Italy and Poland

The latest statistics [5] illustrate that about 127 kg of food per inhabitant were wasted in 2020, soon after the COVID-19 lockdown. Of such an amount, approx. 55% were generated at the household level, which means about 70 kg per person, whereas the remaining quota was generated across the entire supply chain, from primary production (11%) to industrial processing (18%), retail and distribution (7%) and restaurants and collective catering (9%). Compared to the 2012 data (European Parliament, 2017), which estimated an average amount of 173 kg of food waste per person per year, equal to approx. 88 Mt in Europe, it results that food waste decreased by 28%. Figure 1 illustrates the 2020 data on food waste, distinguishing per country and per supply chain stage.
About 65% of the entire amount of food waste generated in Europe comes from five countries, namely: Germany (10.92 Mt), France (9 Mt), Italy (8.65 Mt), Spain (4.26 Mt) and Poland (4 Mt), for an amount of 36.83 Mt. It results that Italy and Poland rank third and fifth among the countries that waste the most food in Europe [6]. Specifically, food waste amounted to 146 kg per capita in Italy and 105 kg per capita in Poland. Table 1 lists, in detail, the amount of food waste generated in Italy and Poland per supply chain stage and identifies the percentages of food waste out of the total. The largest amount of food waste is generated in households, recording the highest percentage in Italy (73%) and Poland (57%).

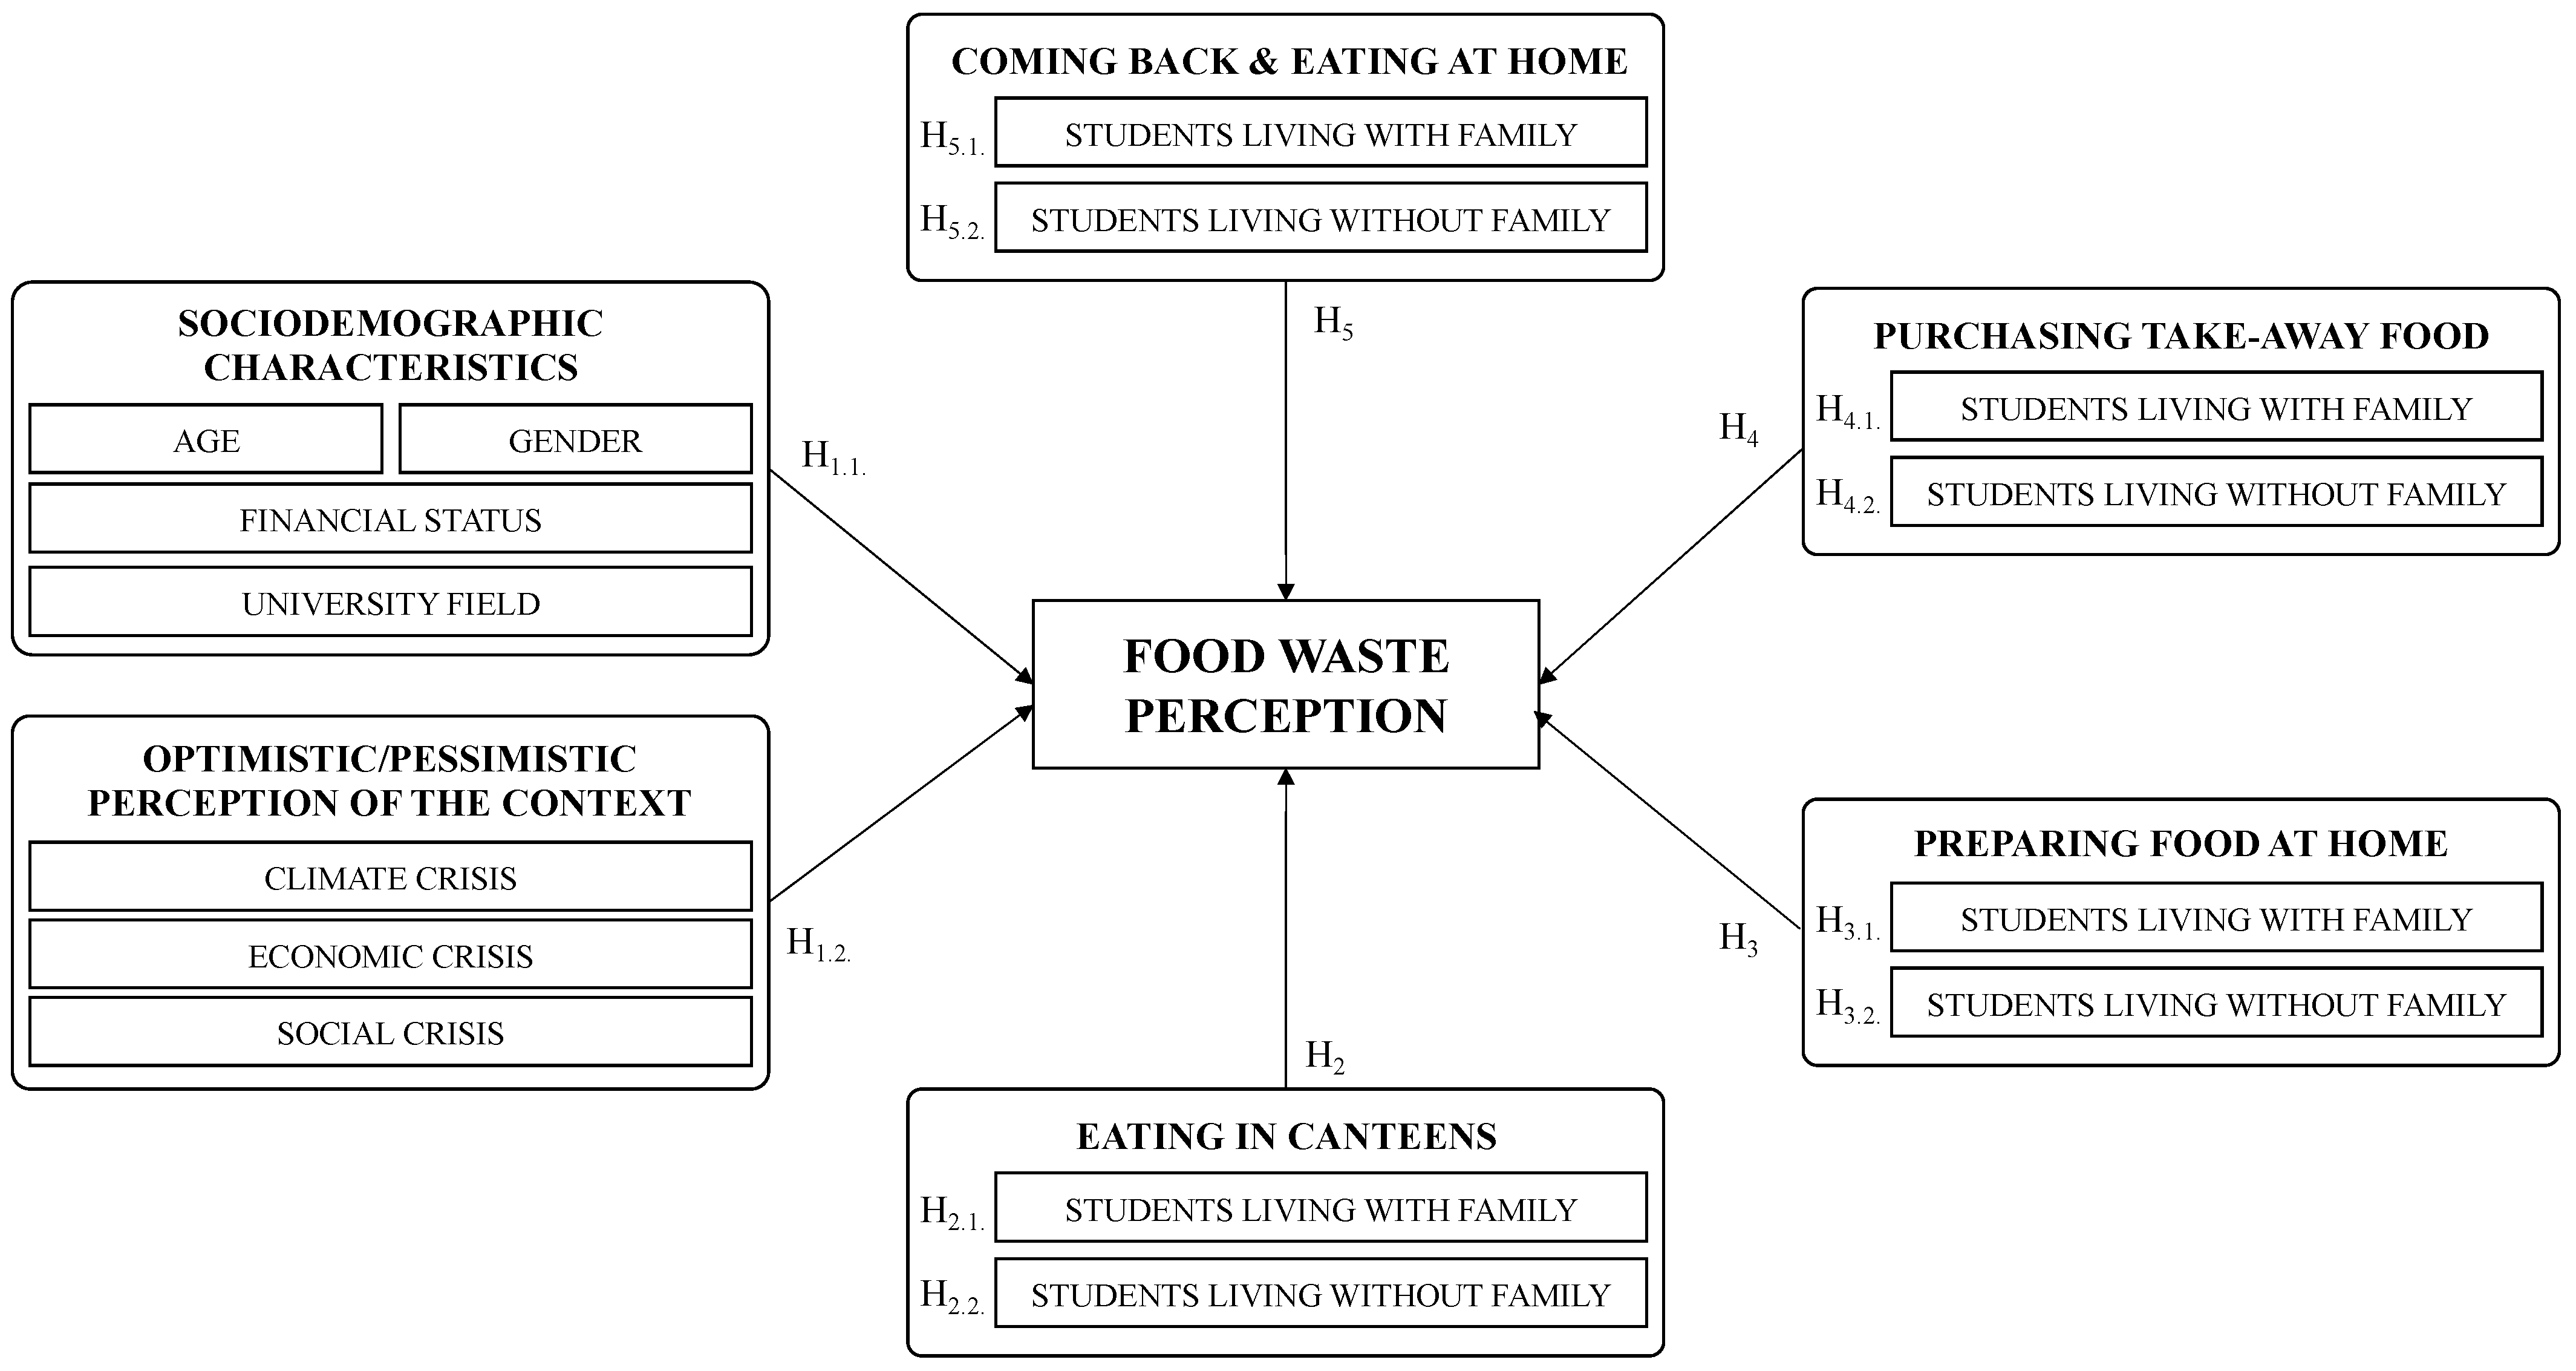
2.2. Hypotheses Development

The research was based on three pillars: (i) food waste minimization represents a key issue to achieve the Sustainable Development Goals at the global level and Green Deal at the European level [27,28]; (ii) several efforts are required to change food waste perception and behavior at restaurants, food services and households [29,30]; and (iii) young generations, in the current research represented by university students from 18 to 35 years, have a significant responsibility in reducing food waste, considering their social role as “healthy carriers” toward sustainable development. Young generations, which encompass both Millennials (i.e., people born from 1981 to 1996) and Generation Z (i.e., people born from 1997 to 2012) [31], seem to highly react to the environmental issue and should be considered intergenerational carriers of inspiration, hope and culture [26]. However, so as to concretely minimize food waste among university students, significant steps are required: (i) increase awareness; (ii) change attitudes through experience and cognition; and (iii) change and maintain behavior over time. Considering authoritative studies on the topic [4], changes in attitude are not likely to lead directly to changes in behavior, but it is essential to intervene on the perception by rising the “urgency” or the “desire to act” at the personal level through specific information, calling for commitment and trying to instill concrete needs in the target audience. Therefore, this research investigated food waste perception and awareness, in terms of cultural background (e.g., beliefs, values, rules), social context (e.g., social or physical environment) and education (e.g., information, lessons, instruction).
In light of previous research on the topic [32,33,34], sociodemographic variables such as age, education and household size and composition, as well as employment status and income, have been considered as the most common and relevant factors influencing food waste perception. The first hypothesis was developed to investigate the relationship and the effects that sociodemographic characteristics have with food waste perception.
Hypothesis 1.1. (H1.1.).
Sociodemographic characteristics (age, sex, financial status, university field) have an effect on the food waste perception among university students.
In addition, consumers are influenced by significant experiences with food scarcity and food insecurity, such as wars, conflicts and epidemics. Specifically, Szabó-Bódi et al. [35] estimated that people experiencing wars, such as those who lived through World War II, tend to waste less compared to those who have never experienced such tragic events, especially in Europe [29]. In addition, it has been evaluated that, during the COVID-19 pandemic, people wasted less amounts of food compared to the period soon before the pandemic [7]. Such reductions should be read in the light of the increases in inflation and in the cost of raw materials, and therefore also of basic food, as revealed by global markets [36]. The second hypothesis investigates the effects that optimistic or pessimistic feelings on the socio-economic and environmental context have on food waste perception among university students.
Hypothesis 1.2. (H1.2.).
An optimistic or a pessimistic perception about the socio-economic context (i.e., climate crisis, economic crisis, social crisis) has an effect on food waste perception among university students.
Soon after formulating the hypotheses associated with the sociodemographic characteristics of the students and their perception on the social and the economic context, this research distinguished between students living with their family and students living without them. Previous research has highlighted that living arrangements among university students significantly affect their eating habits [25]. For instance, students living at a parental home are more likely to consume fruit and vegetables, whereas those living outside tend to eat cakes or unhealthy foods. In addition, as outlined by Maillet and Grouzet [37], the transition from school to university leads students to eat less food, less healthily and less regularly, due to moves from home to university residence or off-campus housing. Specifically, regarding students living without their family, this research investigated those living alone, with friends and/or colleagues and with their boyfriend/girlfriend, hypothesizing that such variables could influence their food waste perception [19]. Regarding students’ lunch habits, the research investigated four scenarios, namely: (i) eating in canteens; (ii) preparing food at home; (iii) purchasing take-away food; and (iv) coming back and eating at home.
The agri-food system contributes to the worldwide greenhouse gas emissions by up to 37%, considering all stages of the supply chain, from primary production to logistic activities and consumption among final users [38]. It results that the emissions associated with agri-food activities account for about 31 Mt of CO2eq. Nowadays, one of the main challenges in the catering sector is related to the energy consumption for final use, namely the energy used for the production, the transformation and the conservation of both animal and vegetable food products, as well as the energy used for facilities and air conditioning [39,40]. However, the amount of food waste at the final consumption stage, together with the environmental impacts associated with its disposal, still represent a difficult environmental burden. It results that food waste accounts for peaks of 40% in schools and 30% in hospitals [41]. In such a light, the subsequent hypotheses were developed, so as to understand how to shape strategies and policies toward food waste minimization. Such hypotheses were developed on the basis of the overarching research question: “Do eating in canteens, preparing food at home or purchasing take-away foods influence university students’ food waste perception?”.
Hypothesis 2.1. (H2.1.).
Among the students who live with their family, eating in canteens has an effect on food waste perception.
Hypothesis 2.2. (H2.2.).
Among the students who do not live with their family, eating in canteens has an effect on food waste perception.
Hypothesis 3.1. (H3.1.).
Among the students who live with their family, preparing food at home has an effect on food waste perception.
Hypothesis 3.2. (H3.2.).
Among the students who do not live with their family, preparing food at home has an effect on food waste perception.
Hypothesis 4.1. (H4.1.).
Among the students who live with their family, purchasing take-away food has an effect on food waste perception.
Hypothesis 4.2. (H4.2.).
Among the students who do not live with their family, purchasing take-away food has an effect on food waste perception.
Hypothesis 5.1. (H5.1.).
Among the students who live with their family, coming back and eating at home has an effect on food waste perception.
Hypothesis 5.2. (H5.2.).
Among the students who do not live with their family, coming back and eating at home has an effect on food waste perception.
Figure 2 summarizes the different hypotheses.

3. Materials and Methods

This research adopted a questionnaire to investigate food waste perception among university students. As outlined by previous research on the topic [7], questionnaires have been highly adopted in food waste research and have been defined as structured and formal ways of collecting quantitative or qualitative information among consumers [42]. Such a tool is cost effective, accessible and easy to read, and its development requires a suitable stepwise approach, which is as follows: (i) context analysis (Section 2.1) and hypothesis development (Section 2.2); (ii) questionnaire drafting (Section 3.1); (iii) sampling strategy and data collection (Section 3.2); and (iv) statistical approach and data analysis (Section 3.3).

3.1. Questionnaire Drafting

The questionnaire was composed of three sections: (i) food habits at lunch and food waste perception (11 questions); (ii) level of awareness about food waste environmental, social and economic implications (nine questions); and (iii) sociodemographic information (ten questions), for a number of 30 questions. In the research, the subsequent definition of food waste was adopted: “the quantity of different foods thrown away, composted or used as animal feed because out of date, spoiled or no longer wanted for other reasons, and it was specified not to consider inedible food waste, such as bones, peels or shells” [43,44].
The questionnaire was composed of multiple-choice questions (e.g., sociodemographic characteristics), dichotomous questions and questions that can be answered according to a 5-point Likert scale, from “1 = not at all” to “5 = very much” (e.g., level of food waste perception). In terms of food waste consequences, students were asked to evaluate their level of perception and awareness with reference to either the environmental, economic or ethical implications of food waste. Additionally, students were asked to evaluate some drivers, according to their potential to generate food waste, namely bad food storage, lack in cooking skills (or bad meals quality), taste preferences, out of use based on the label, over purchase, and emotional reasons [45,46].

3.2. Sampling Strategy and Data Collection

The present research represents a cross-country study in Italy and Poland. The questionnaire was first developed in English and then translated into Italian and Polish. Considering the translation of the questionnaire as an essential step to guarantee replicability and comparability, the authors adopted a “forward translation”, which requires the translation from the original language to the target language by at least two independent translators [47,48], both aware of the concepts the questionnaire intends to measure, to reach a translation as close as possible to the original one [49].
The questionnaire, translated in Italian and Polish, was implemented in Google Forms, an online platform useful for receiving fast answers and analyzing data in multimodal formats [50]. It was disseminated online from 1 May to 1 June 2023 on social media such as Instagram, LinkedIn and Facebook, according to the non-probabilistic snowball sampling method. Such a method, as outlined by previous researchers [51], represents a widely applied tool in Internet research, and it helps reach as many respondents as possible while requiring minimal planning and human resources [52]. To guarantee the validity of the sample at a p-value = 0.5, about 385 university students from each country were considered an acceptable sample.

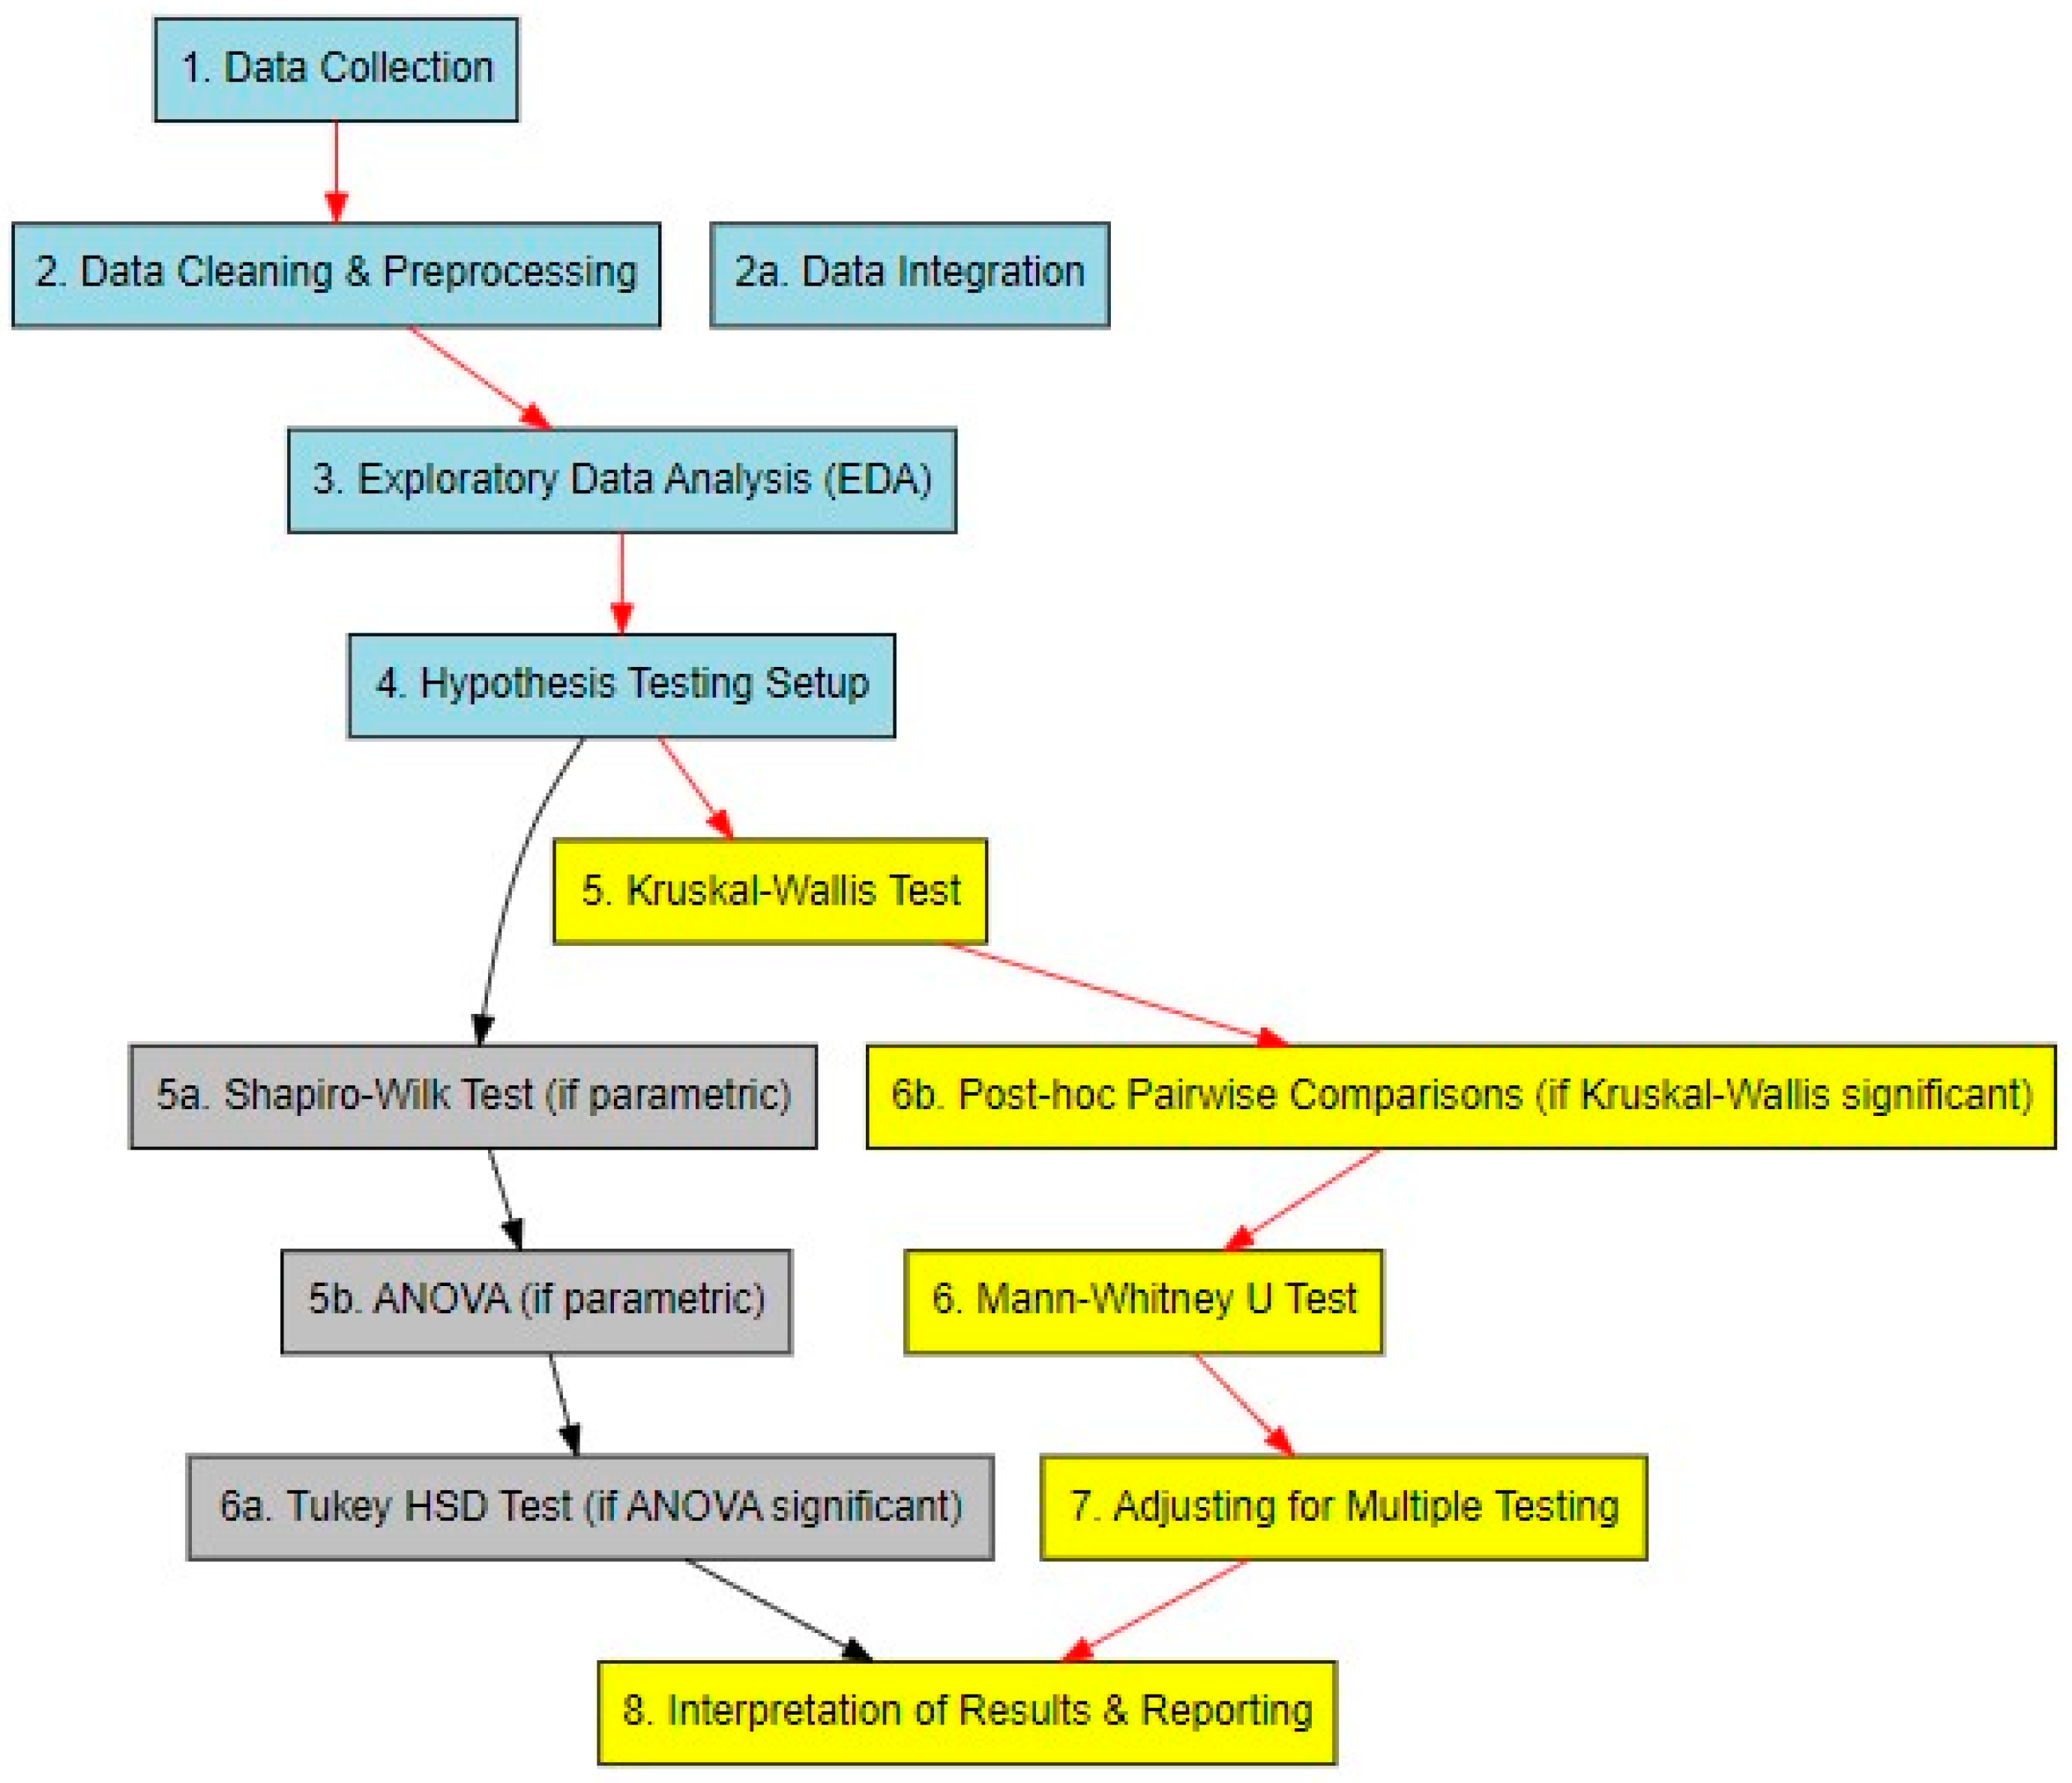
3.3. Statistical Approach and Data Analysis

Figure 3 illustrates the research methodological workflow. The process initiates with data collection, followed by meticulous data cleaning and preprocessing. An exploratory analysis was conducted to inform the subsequent hypothesis testing setup. Due to the data not meeting parametric assumptions, as indicated by the grayed-out steps (the Shapiro–Wilk test for normality and ANOVA), the Kruskal–Wallis test was employed to assess differences across multiple groups. Significant findings from this test lead directly to post hoc pairwise comparisons using the Mann–Whitney U test. Steps involving parametric tests (Shapiro–Wilk, ANOVA, and Tukey HSD) were omitted, which is justified by the non-parametric nature of the data. The analysis concluded with Adjusting for Multiple Testing to ensure the robustness of the findings, followed by the Interpretation of Results & Reporting, where results were synthesized and contextualized within the research narrative.
To verify the developed hypotheses (Section 2.2), the authors employed non-parametric statistical tests, specifically the Mann–Whitney U test and the Kruskal–Wallis test. These tests were particularly suited for the analysis as they do not assume a specific distribution of the data and are robust to the presence of outliers. The Mann–Whitney U test was utilized to compare two independent groups, while the Kruskal–Wallis test was employed when more than two groups were involved in the comparison. The test serves as a non-parametric alternative to the one-way analysis of variance (ANOVA), extending its application to scenarios where the assumptions of ANOVA, particularly the requirement for normality and homogeneity of variances, are not met. In this study, the Kruskal–Wallis test was judiciously employed in situations where comparisons extended beyond a binary framework, encompassing more than two independent groups. It operates on the ranks of the data rather than the data values themselves, rendering it less susceptible to the effects of outliers and non-normal distributions. It evaluates the null hypothesis that the median of all groups is equal, or more precisely, that there is no difference in the distribution of the dependent variable across the groups being compared. The procedure begins with the ranking of all data points pooled across the groups, followed by the calculation of the sum of the ranks for each group. The test statistic, denoted as H, is computed based on these ranks, taking into account the size of each group and the overall distribution of the ranks. The resulting H statistic approximately follows a chi-square distribution with k − 1 degrees of freedom, where k is the number of groups.
In the context of this study, the Kruskal–Wallis test facilitated a comprehensive assessment of the differences in food waste perception across various subgroups defined by sociodemographic characteristics, living arrangements and eating habits. This allowed for an inclusive and comparative analysis, highlighting the nuances and subtleties in the data that might have been overlooked with parametric tests. The adoption of the Kruskal–Wallis test in this research is further justified by its utility in providing an initial overview of the data. Where significant results were detected, post hoc analyses using pairwise comparisons with adjustments for multiple testing were conducted to pinpoint the specific group differences. These subsequent analyses employed the Mann–Whitney U test, ensuring a thorough and rigorous examination of the hypotheses in question.
Following the identification of significant differences among groups through the Kruskal–Wallis test, the Mann–Whitney U test was utilized for post hoc pairwise comparisons. This test is particularly advantageous in non-parametric statistics, permitting comparisons between two independent samples when the assumptions for parametric equivalents, such as the t-test, are not tenable. The Mann–Whitney U test evaluates the null hypothesis that two independent samples come from the same distribution, specifically that there is no difference in the medians of the two groups. It does so by ranking all the observations together and then calculating the sum of the ranks for each of the two groups. The test statistic U is derived from these ranks and represents the number of times a score from one group precedes a score from the other group. This test is robust to outliers and does not require the data to be normally distributed, making it particularly suitable for skewed distributions commonly encountered in survey data. It is sensitive to differences in both the location and shape of the distributions of the two groups.
In this research, the Mann–Whitney U test was applied to the pairwise comparisons within the context of sociodemographic variables, eating habits and perceptions of food waste. It was instrumental in discerning specific differences between groups identified as statistically different through the Kruskal–Wallis test. The significance level for these comparisons was carefully adjusted for the use of multiple tests to control for the increase in Type I error rate, thus ensuring the results’ integrity. Thus, by applying the Mann–Whitney U test to our dataset, we were able to draw more nuanced conclusions about the impact of various factors on food waste perception. This contributed to a more granular understanding of the underlying dynamics within the student population in both countries.

4. Results and Discussion

The current section reports the empirical analysis of data collected from university students, aiming to explore and verify the various hypotheses connected to their food consumption habits and their perception of food waste. Understanding these aspects is crucial, as it can provide insights into potential areas of intervention to enhance food waste awareness and promote sustainable practices among the younger population. Data encompassed responses from students in different living situations, with diverse sociodemographic backgrounds and varying habits related to food consumption and waste.

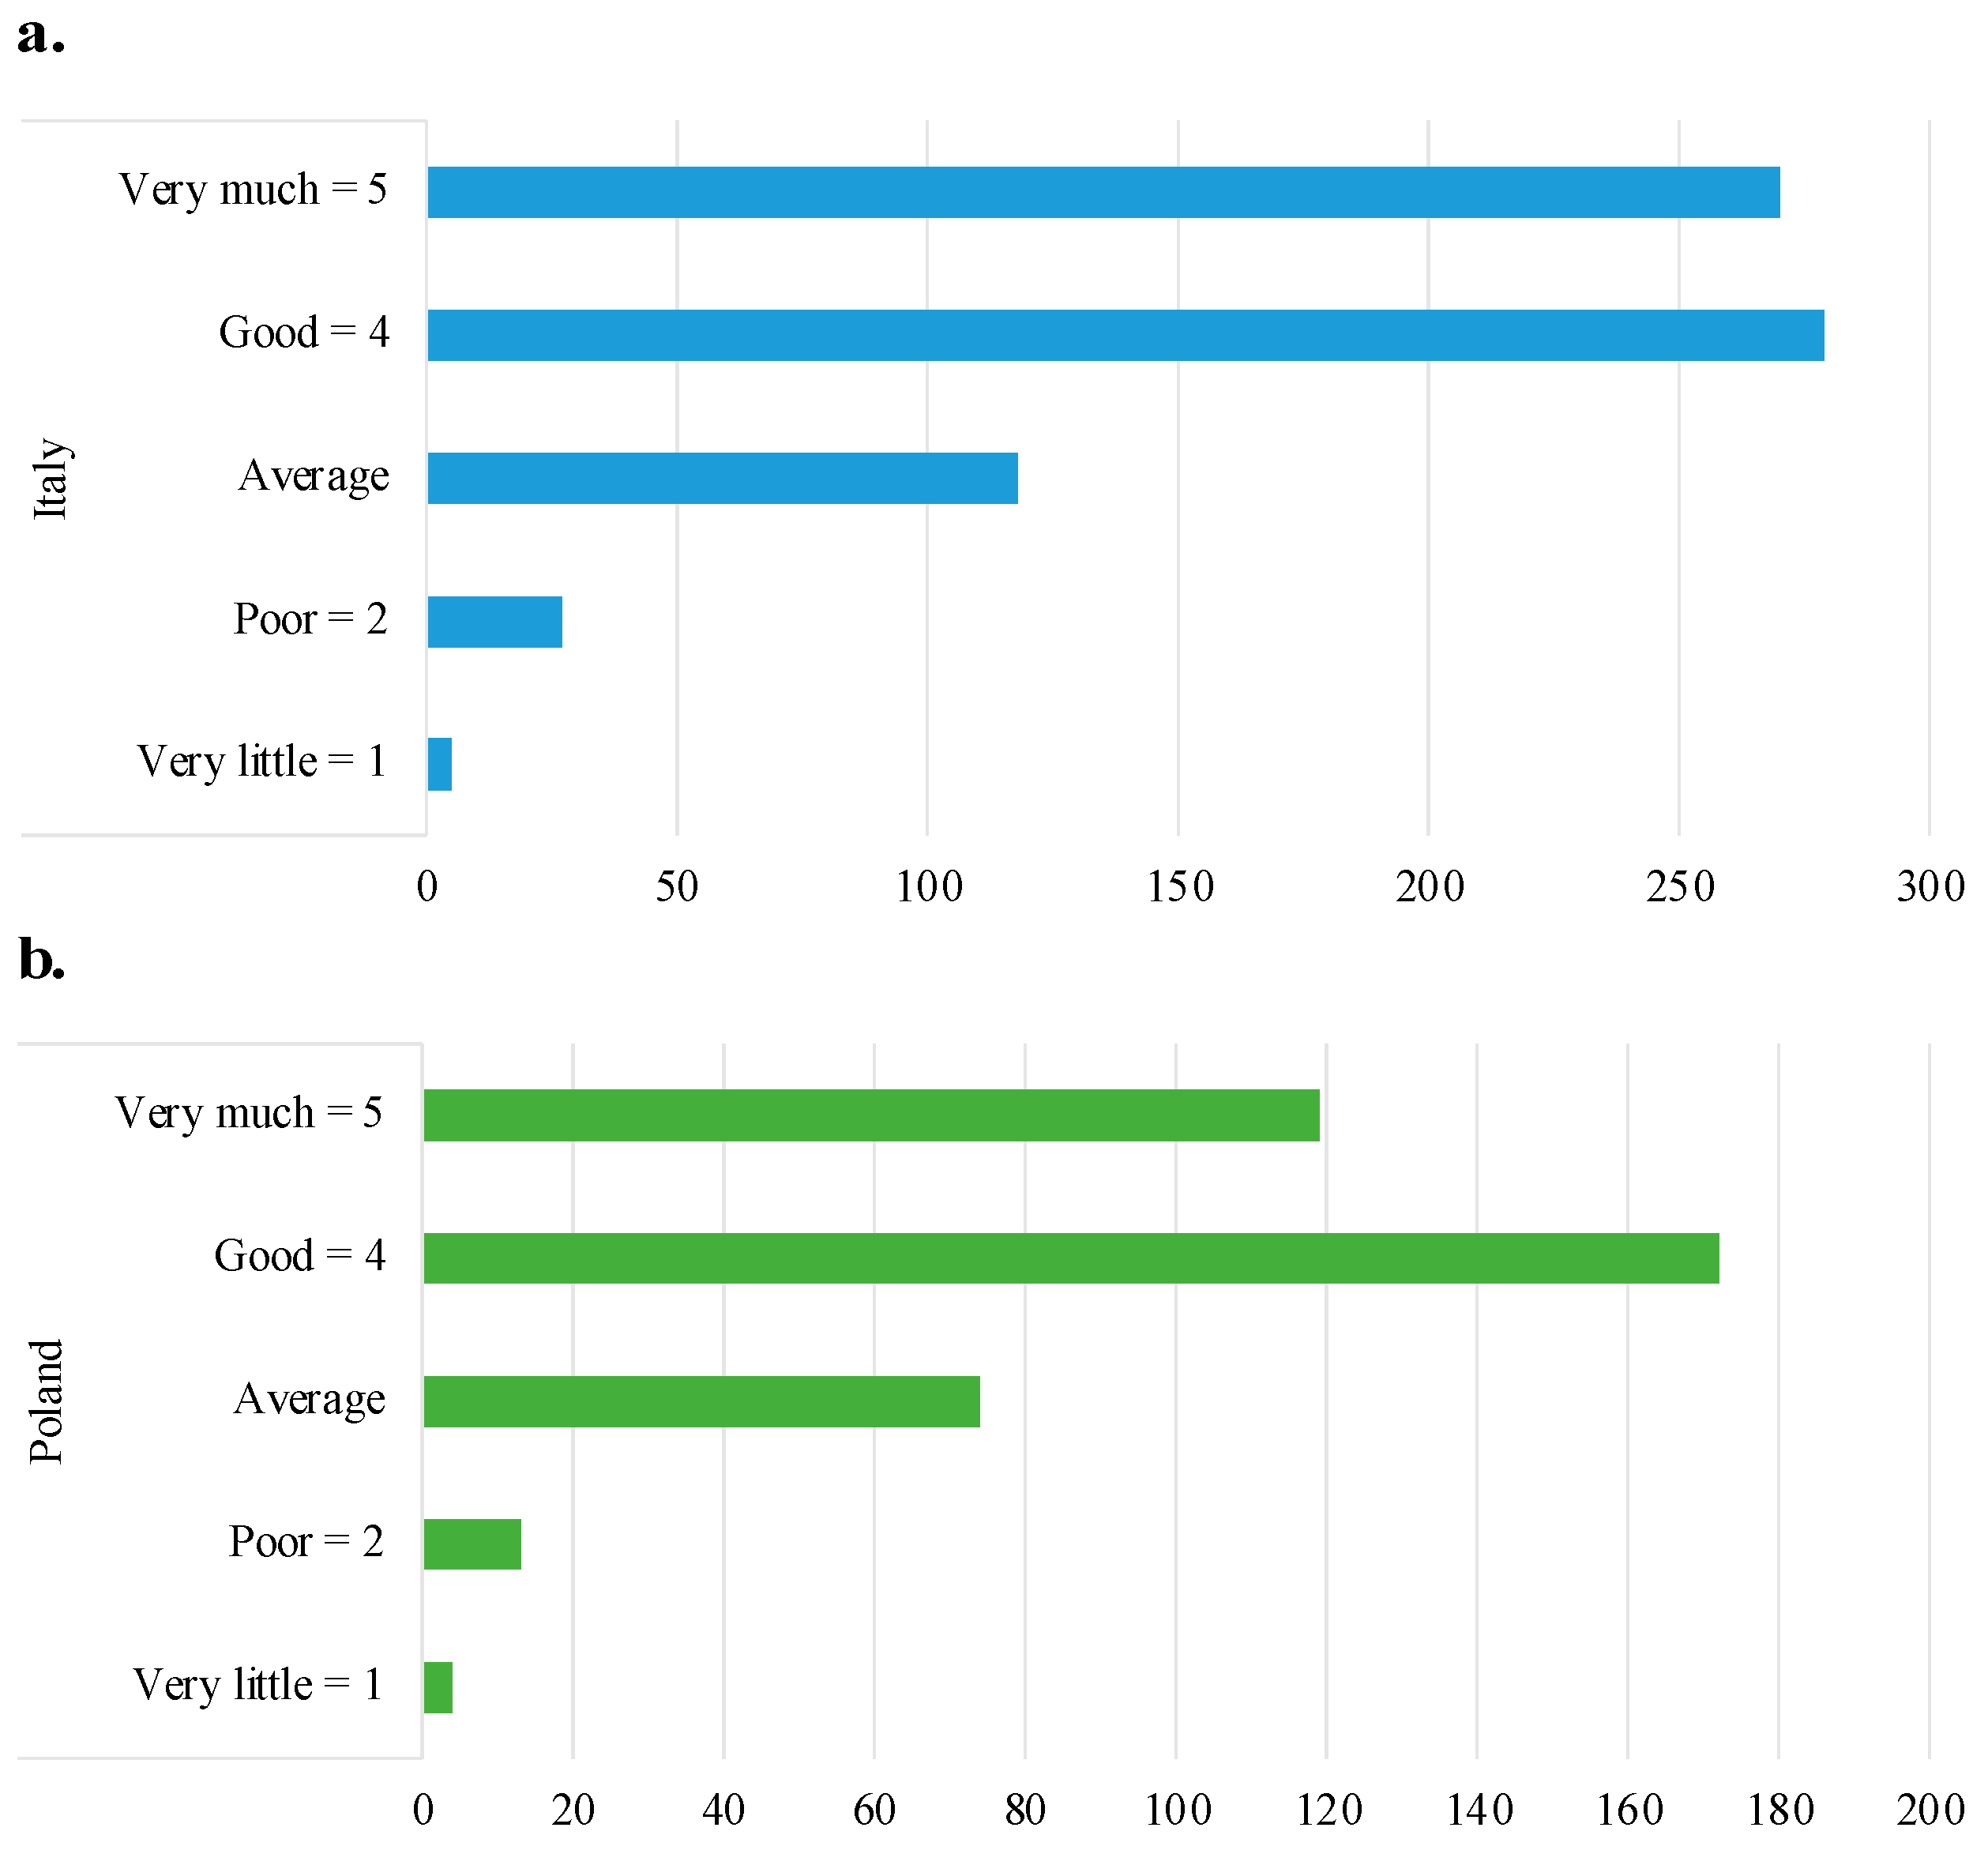
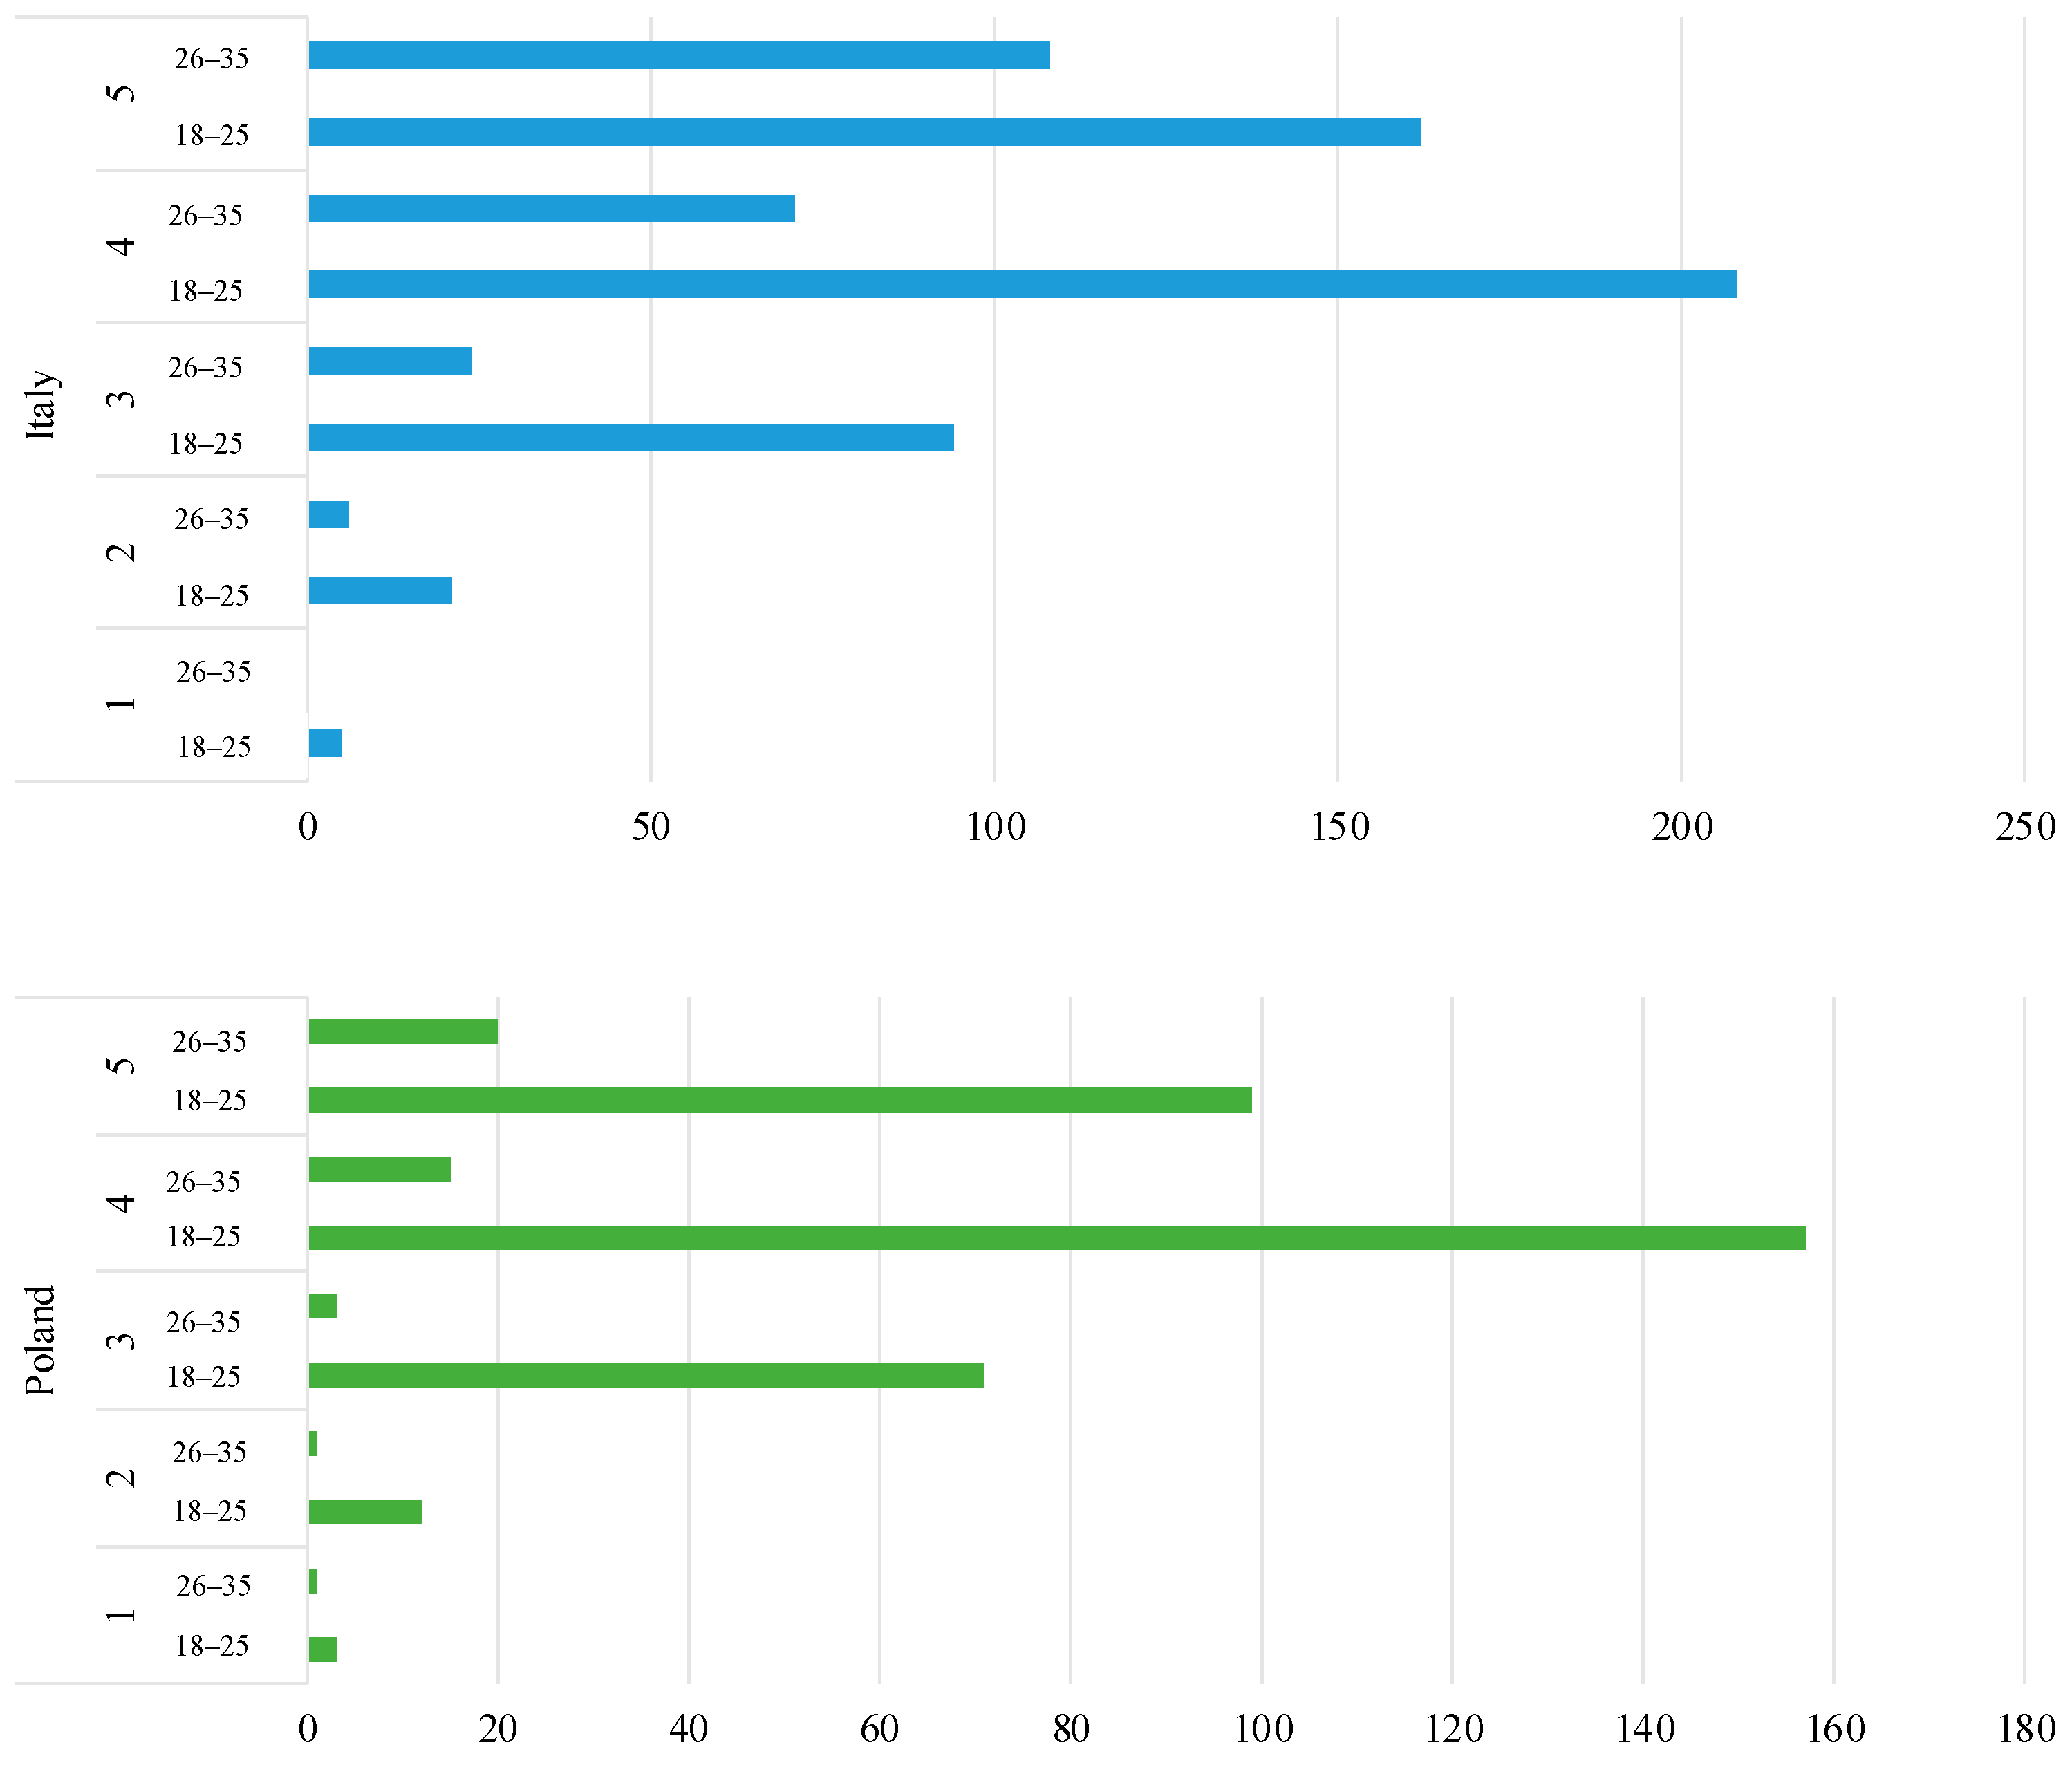
4.1. Sociodemographic Characteristics of the Sample

In Italy, 699 university students participated in the research, whereas in Poland, 382 respondents participated. Table 2 illustrates the sociodemographic characteristics of the sample.
Prior to conducting detailed pairwise comparisons, it was essential to perform a general assessment of the groups in question to determine if there were any overall differences that warranted further investigation. To serve this purpose, the Kruskal–Wallis test was adopted to compare Italy and Poland in terms of food waste awareness, revealing a significant difference between the groups (Figure 4). About 39% of the Italians declared a high awareness of food waste compared to 31% in Poland.

4.2. Hypothesis Verification

The comparative analysis between Italian and Polish university students’ perceptions of food waste was checked for insights as a result of hypothesis verification, particularly when dissecting the roles played by sociodemographic variables and specific dietary habits.
Table 3 presents the hypotheses, the characteristics, the adopted test, the statistics, the p-value and the significance distinguishing between Italy and Poland. In the subsequent sections, this paper investigates and discusses the statistically significant results, in terms of the p-value, by focusing on sociodemographic factors (Section 4.2.1), the influence of socio-economic and environmental crises (Section 4.2.2) and living arrangements and eating habits (Section 4.2.3).

4.2.1. Sociodemographic Factors (H1.1.)

In both Italy and Poland, age proved to be a pivotal factor. The Italian sample, in utilizing the Mann–Whitney U test, revealed significant differences in food waste perception across various age groups (p = 0.00000272). This trend was also evident in the Polish data, where age-related perceptual differences were significant (p = 0.0079), suggesting a generational gap in awareness and attitudes toward food waste. Figure 5 illustrates food waste awareness vs. age group in Italy and in Poland.
Consumers between 18–25, so-called “emerging adults”, are no longer teenagers but are still different from adults in terms of cognition, self-definition, emotional control and behavior [53]. Specifically, although university students were generally considered a “single social group,” the results reveal a significant difference between those aged 18–25 (i.e., Generation Z) and those aged 26–35 (i.e., Millennials), with younger people having a greater awareness of food waste. These results are in contrast with those reached by Tsai et al. [54], who evaluated that young people are unable to assume the responsibilities of adults, also in terms of food waste, and who highlighted the need for young consumers to be guided by adult people in terms of correct consumption and waste patterns. On the contrary, the higher food waste awareness of younger people was confirmed by Viccaro et al. [55]. Students belonging to Generation Z are highly influenced by environmental programs and awareness campaigns, which were confirmed as relevant instruments to address young people’s behavior in minimizing food waste and promoting sustainable consumption patterns. Their role in shaping social and personal norms for either their generation or the younger (i.e., should be underlined, Generation Alpha) and older (i.e., Millennials, Generation X, Baby Boomers) ones. Young students can develop sustainable social norms and adopt them in a continuous inspiration–plan–do–act process.
Sex dynamics presented varied influences in the two countries. In Poland, sex significantly affected food waste perception (p = 0.00013), indicating distinct approaches or awareness levels between male and female students. Conversely, the Italian dataset did not register any significant sex-based impact (p = 0.8551), implying a more homogenous perception across sexes in Italy. Figure 6 illustrates food waste awareness vs. sex in Italy and in Poland.
In Italy, about 16.5% of students attended a bachelor’s degree, a master’s degree or a Ph.D. program in political sciences, followed by a 16.1% in education sciences, 12.6% in medicine and 11.2% in economics and management, with smaller percentages distinguishing among law, tourism and hospitality, applied sciences, IT, etc. These findings reveal that the field of study is as a significant factor in Italy (p = 0.0209), indicating that the awareness of food waste might be intertwined with the academic background, potentially reflecting the curriculum’s influence or the students’ environmental engagement based on their field. However, in Poland, students’ field of study did not demonstrate a substantial effect on their food waste perception (p = 0.187), suggesting a more uniform awareness regardless of academic discipline. Financial status, an important sociodemographic variable, showed no significant effect on food waste perception in either country.

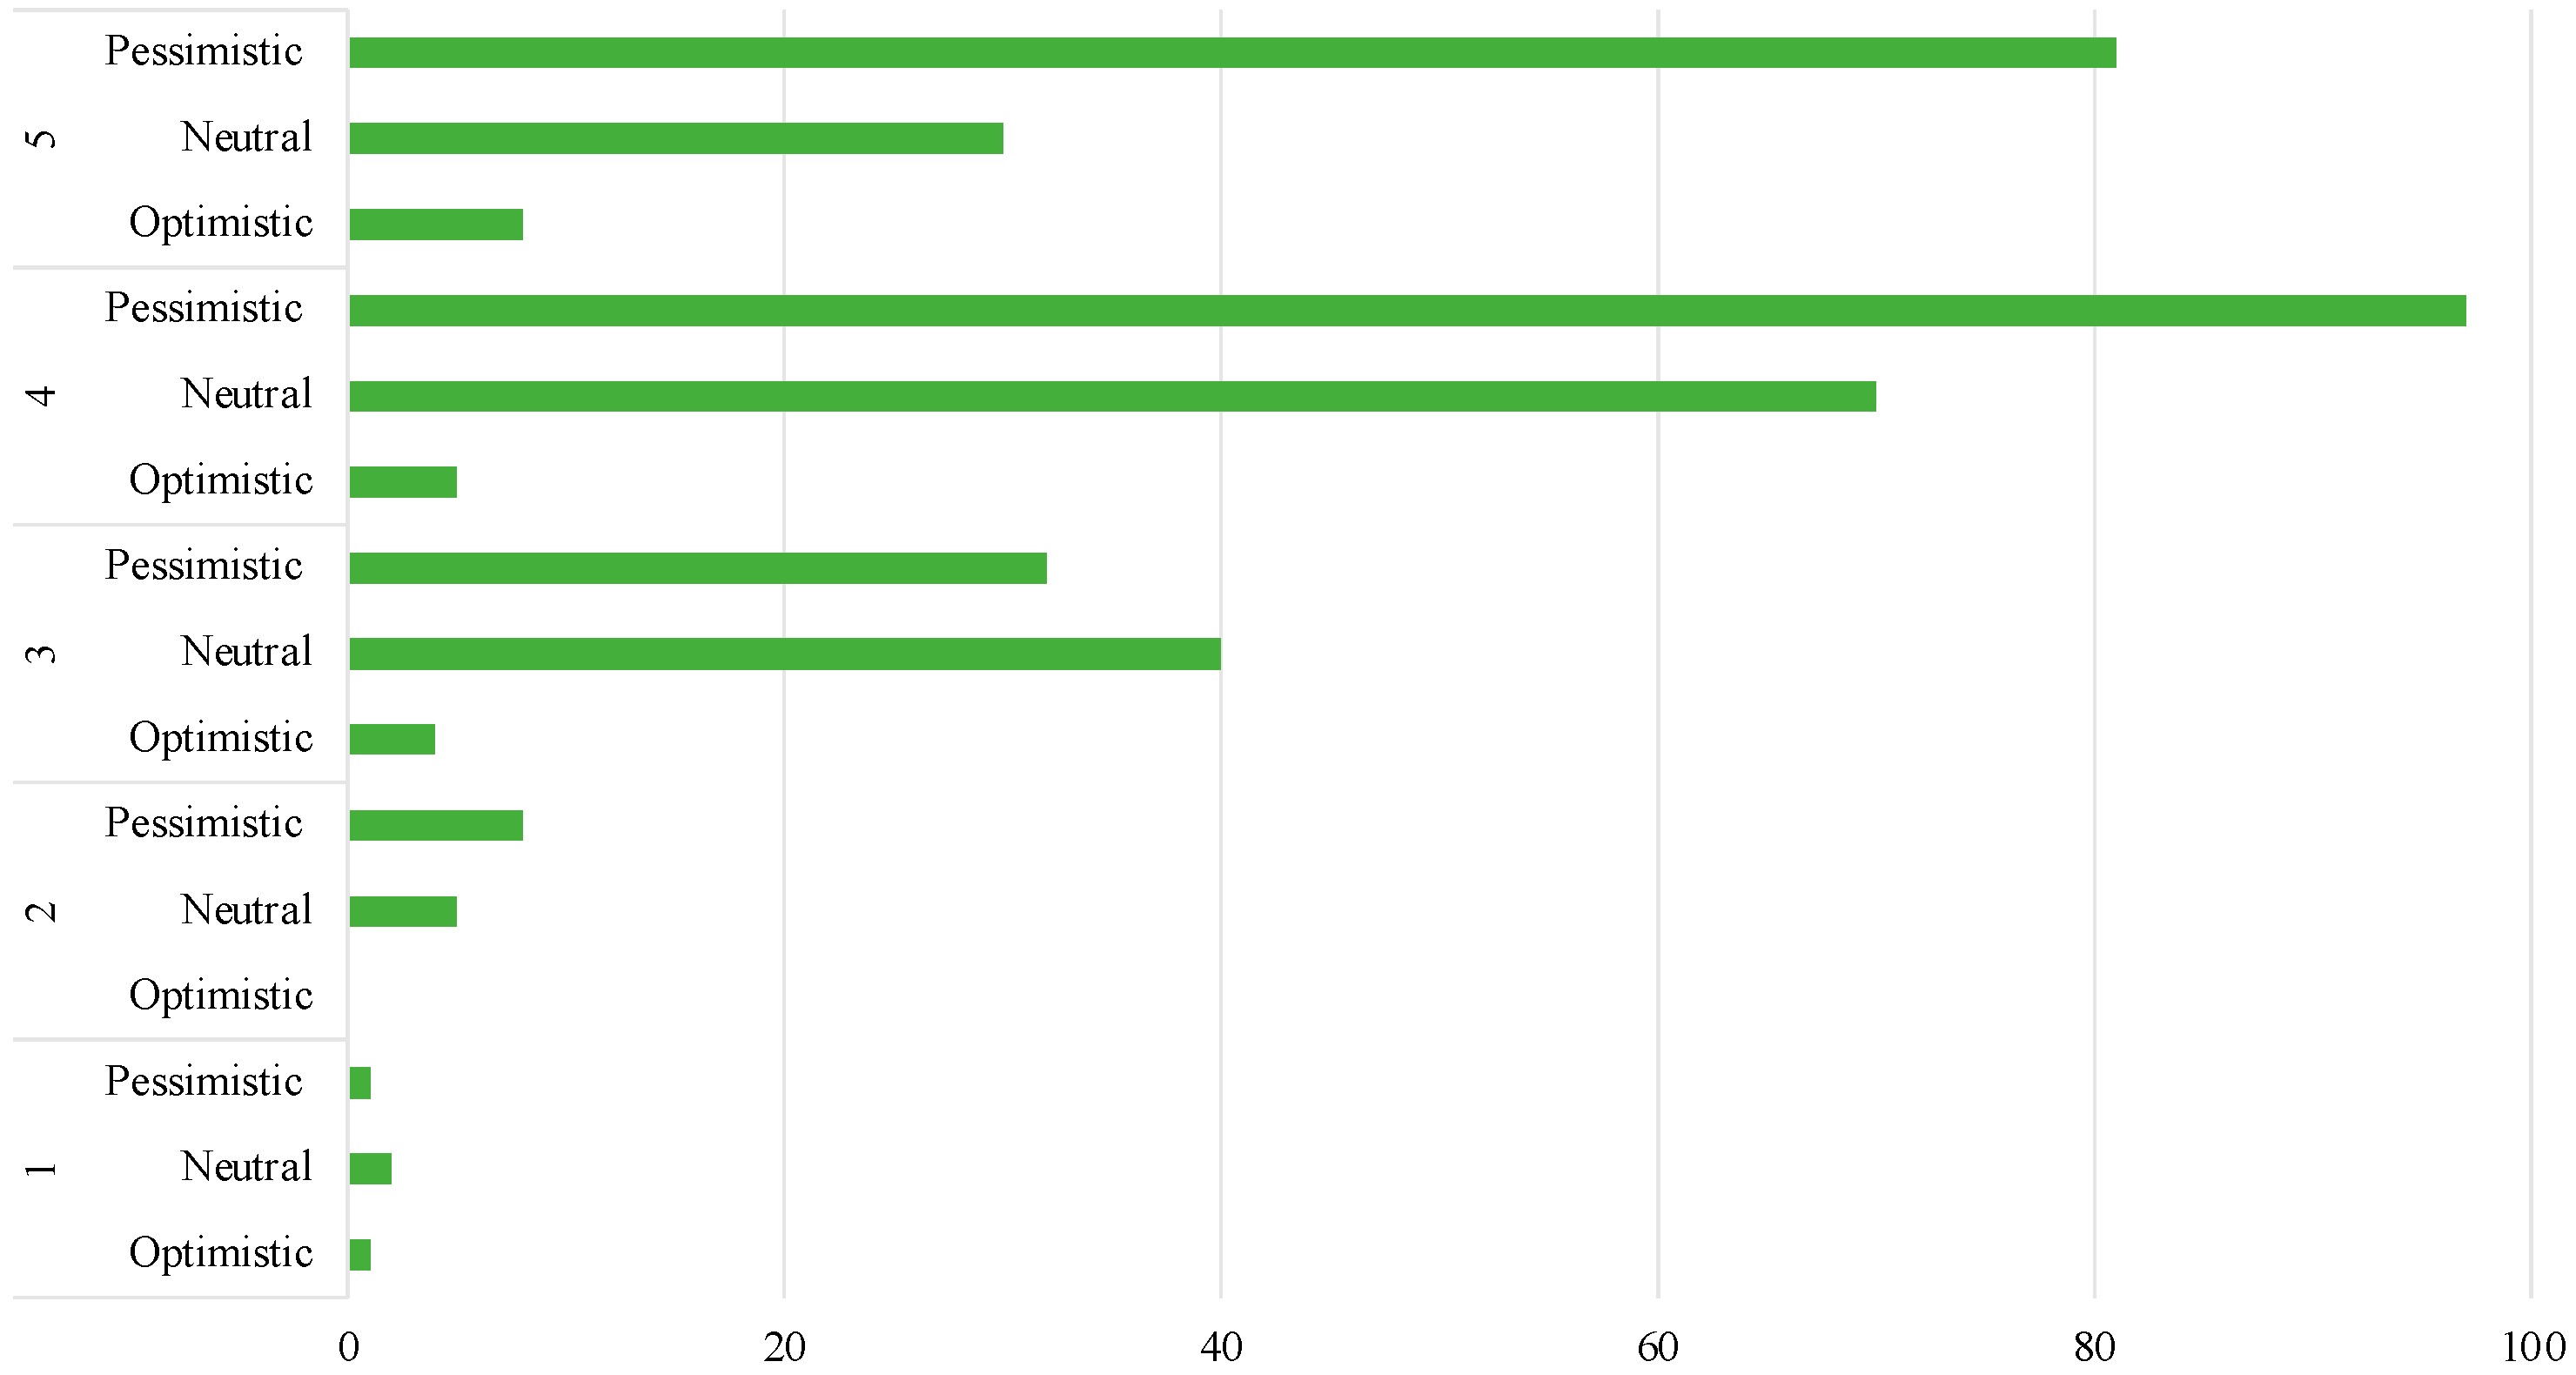
4.2.2. Influence of Socio-Economic and Environmental Crises (H1.2.)

The impact of broader socio-economic and environmental crises on students’ food waste perceptions was markedly different in the two countries. In Italy, these macro-level crises appeared disconnected from the individual-level awareness of food waste (p = 0.1243). In contrast, the Polish data suggest a significant correlation (p = 0.000447), indicating that students’ awareness of food waste is potentially heightened by their perceptions of broader societal and environmental challenges. Figure 7 illustrates the food awareness vs. climate–economy–social crises in Italy and Poland (H1.2.).
Similar results were reached by Grunert et al. [56], who identified a cluster of “sensitive” consumers, discussing the significant roles of climate change, rising energy prices and emotional reactions in changing food consumption behavior. Soon after the COVID-19 pandemic, which changed food waste perception among consumers [8], the Russia–Ukraine conflict modified food consumption habits and the perception of food security [57]. Specifically, the conflict led to significant disruption in consumers’ daily behavior, since food and energy prices increased (i.e., inflation), and it highlighted an increase in price sensitivity [56]. The nexus of food waste management and price sensitivity, soon after supply demand shocks and disruptions such as the COVID-19 pandemic or the Russia–Ukraine conflict, represents an important aspect for reaching food waste minimization and environmental sustainability [56]. In the current research, although a negative impact on food waste perception among university students was expected, due to panic buying and stockpiling [58], climate–economy–social crises had a positive effect on food waste awareness and perception. Possible solutions for tackling food insecurity, uncertainty and panic buying are linked to increased and efficient shopping planning [59,60], which can be either carried out among students living with families, preparing food at home or buying take-away foods. In addition, the price increases in food commodities resulted in a more cautious food consumption behavior and in a reduction in food waste generation, confirming that economic factors have a strong potential for minimizing food waste [58,61].

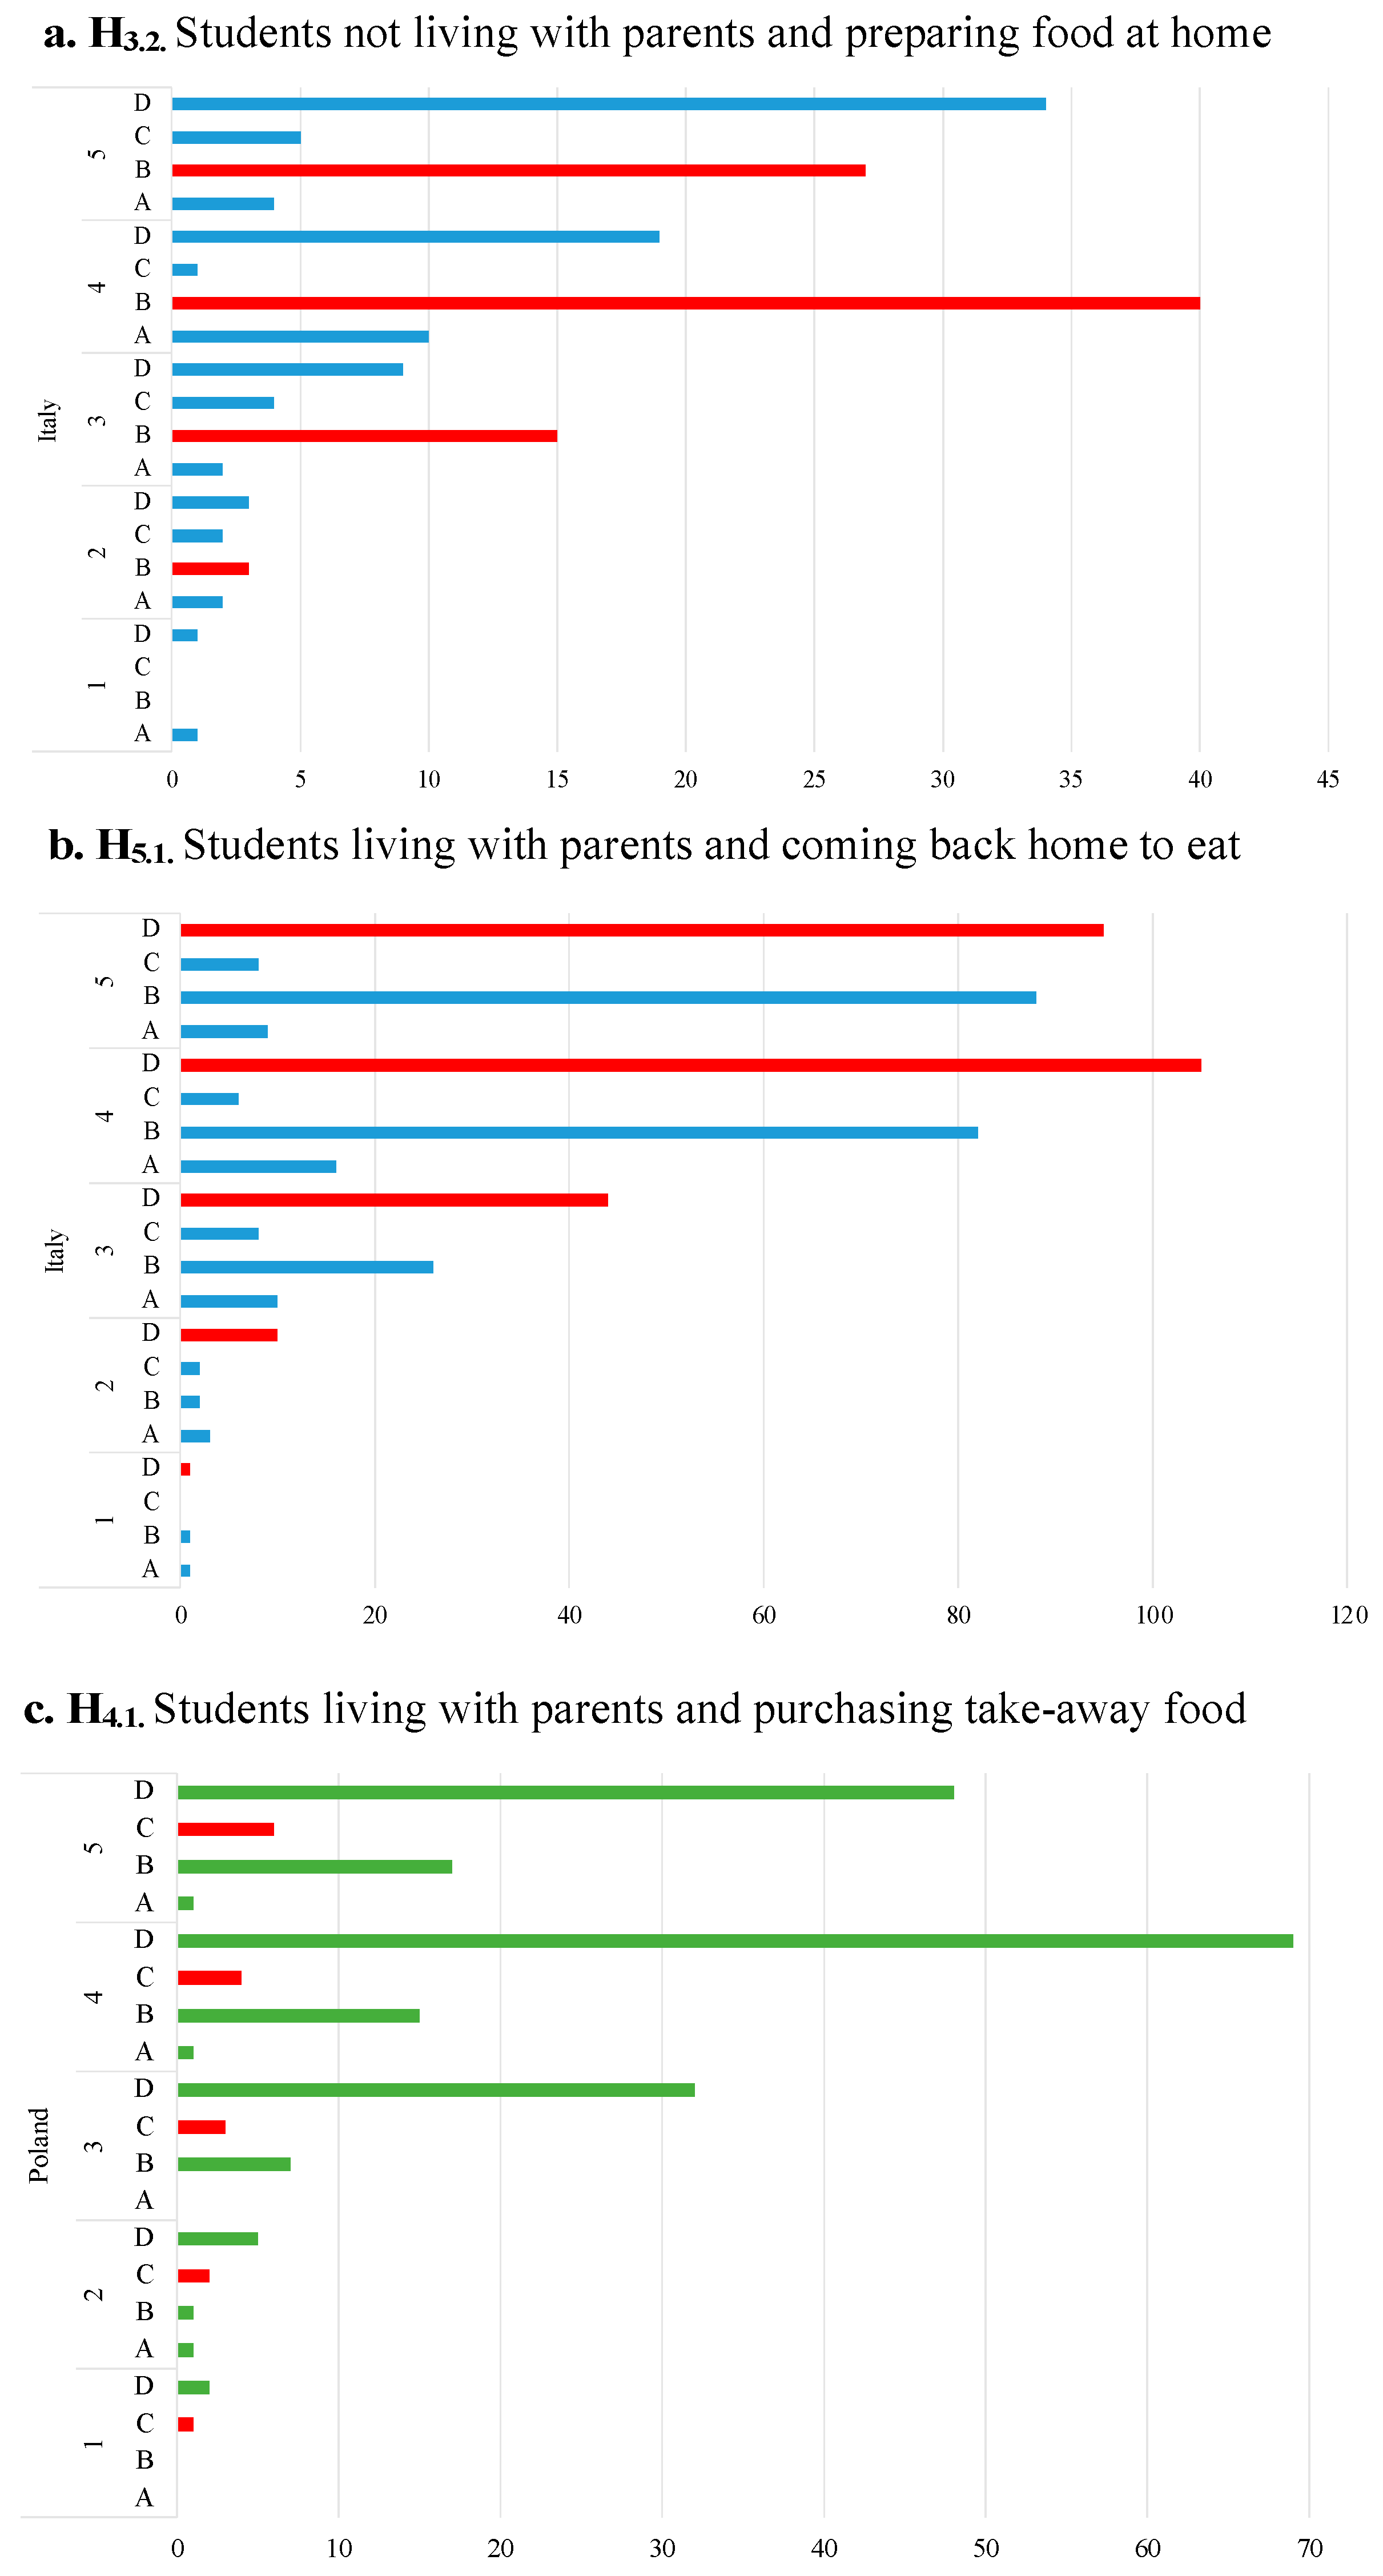
4.2.3. Living Arrangements and Eating Habits (H3.2., H4.1. and H5.1.)

Living arrangements influence food consumption behavior, specifically in the university students, since they have to adopt new habits due to environmental stressors, determinants and pressure [62]. The investigation into the interrelation between living arrangements (i.e., with or without family) and dietary practices (i.e., eating in canteens, preparing food for lunch at home, buying take-away food, going back home to have lunch) amongst university students in Italy and Poland yielded insightful revelations on their perception of food waste. This segment of the study underscores the complexity inherent in the correlation between personal lifestyle choices and environmental consciousness. Figure 8 illustrates food waste awareness vs. living arrangements and dietary practice.
In Italy, the influence of familial cohabitation on students’ attitudes toward food waste was pronounced. The study identified three distinct eating habits as influential among students residing with their families: returning home for meals, preparing food at home and purchasing take-away food. These practices were statistically significant in their association with food waste perception (p = 0.0017), highlighting the integral role of domestic culinary environments in shaping students’ perspectives on food waste.
It results that students living with family and coming back home for lunch have a higher (and significant) awareness of food waste (H5.1.), as confirmed by other cross-country studies among consumers [63]. Specifically, people living alone are more likely to waste food compared to people living in couples or with family, roommates or friends. The role of families in the field of food waste reduction is key in shaping sustainable strategies based on the reuse of leftovers for other meals [64]. Moreover, the influence of the family environment is positive in reducing food waste, since food shopping, handling and cooking is mostly performed by other family members, such as the students’ family, which are expected to have efficient planning and good cooking skills [65]. Lastly, considering the importance of infrastructure facilities such as storage space, equipment and containers [64], students living with families are supposed to have access to better facilities compared to students renting or living in dormitories. Considering students not living with their families, a significant degree of food waste awareness is estimated among those who prepare food at home (H3.2.). Likewise, the students living with their family, students who prepare food at home, are more likely to know about issues related to food consumption and food waste, possessing a higher level of responsibility than those who do not cook. It turns out that taking care of the house, including food (both purchasing, handling and preparing), represents an element of improvement in the perception of food waste compared to students who eat in canteens or buy take-away food. It is true that the transition to adulthood carries tremendous change and responsibility [66], but the higher the responsibility rate, the greater the perception of food waste and the lower its generation.
Other dietary practices, such as dining in canteens, preparing meals at home or returning home for meals, did not present a statistically significant relationship with food waste perception in Poland. This suggests that, for students in familial living situations, food waste awareness may be less dependent on the nature of their dietary habits, with the notable exception of take-away food consumption. Nevertheless, despite the statistical significance, it appears that students who buy take-away food do not have particular food waste awareness, supporting the idea that food waste minimization requires food management and preparation responsibility. Lastly, among students not living with their families, in Poland, no significant correlations were observed between any of the dietary habits examined (eating in canteens, home food preparation, purchasing take-away food, or returning home for meals) and their perception of food waste (p-values from 0.149 to 0.917). This uniformity in perception, irrespective of dietary practices, indicates the presence of other influential factors the beyond living arrangements and dietary choices that shape students’ awareness of food waste.

4.3. Educational Interventions

Education represents one of the main drivers for more sustainable consumption models (and mindsets) among young generations. The findings from this research are essential for defining educational interventions to enhance students’ perception on food waste. Specific interventions should be addressed to students’ living alone, where the level of food waste is more likely to be higher. Both people directly involved in education and awareness programs, such as professors, but also foodservice operators, should adopt strategies to enhance responsibility among consumers, since a greater perception of food waste lowers its generation.
In terms of financial and environmental awareness, educational campaigns through social media, for instance, should stress the need to reduce food waste, riding on the malleability and easy influenceability of university students. Recent studies [67,68] highlighted that young people are more open to social media influencers and fashion trends; therefore, sustainable messages should be introduced without delay. Specifically, as suggested by Neubig et al. [69], food operators should adopt social pressure methods to (dis)engage consumers in certain behaviors, by stressing the concepts of “approval” or “disapproval”. More practically, as highlighted by Eriksoon et al. [70], foodservice operators should develop an Environmental Code, defined as a potential benchmarking threshold for legal and illegal levels of food waste. However, together with “mandatory practices”, foodservice operators could adopt voluntary practices aimed at influencing final consumers’, for instance: (a) advise guests to start with small tasting portions; (b) inform guests about how much food is wasted; (c) build good relations with guests; (d) maintain calm dining environments; (e) present the food on a plate so guests can see what is served; and (f) put the waste bin behind a counter to make it more complicated to waste food.
One more opportunity for developing awareness among students regards university teachings, which occupy a large part of students’ time and can influence and suggest sustainable behaviors. However, as outlined by previous studies on the topic [71], the effectiveness of teaching sustainability is high if sustainability is considered in mandatory disciplines, not in marginal ones [72], and the same must be realized for food waste in particular. Specifically, professors should consider that education on sustainability is “a systematic approach to understanding, one which goes beyond technical knowledge and even understanding the basics of a healthy ecosystem and thriving society” and must include management ethics, entrepreneurship, environmental studies, system thinking and self-awareness [73]. Therefore, tangible, sustainable campus practices, such as projects on greenhouse gas reduction, biodiversity protection, energy efficiency and ecological footprint reduction, are required.

5. Conclusions

This research investigated the influence of living arrangements and dietary practices on food waste perception among university students in Italy and Poland. Specifically, through an online-based questionnaire, the research analyzed two categories of students, namely those living with their family and those living without them and also considered, in depth, the students that eat at university canteens, those who prepare food at home and those who purchase take-away meals. In Italy, 699 university students participated in the research, whereas in Poland, 382 respondents participated, with an average of 39% in Italy compared to 31% in Poland in terms of “high” food waste awareness.
In terms of sociodemographic characteristics (H1.1.), age was identified as a pivotal factor both in Italy and Poland. This research revealed that students belonging to Generation Z are more likely to be influenced by environmental campaigns on food waste reduction compared to Millennials, highlighting the need to invest resources into young students and take advantage of their positive role as “health carriers” of sustainable consumption patterns. In addition, sex resulted as an interesting factor in Poland, with men being more conscious of food waste compared to women. Lastly, this study revealed a significant role in Italy, stressing that the university curriculum has an influence on the students’ environmental engagement.
One significant result of the research is related to the influence of socio-economic and environmental crises (H1.2.) on food waste perception, with a significant correlation in Poland. Soon after supply demand shocks and disruptions such as the COVID-19 pandemic or the Russia–Ukraine conflict, a strong nexus between food waste management and price sensitivity results, which represents a key to reducing food waste and enhancing environmental sustainability.
Lastly, this research investigated the influence of living arrangements and dietary practices on food waste perception, highlighting that living and food habits represent environmental stressors, determinants and pressure. Specifically, it results that students living with family and coming back home for lunch have a higher (and significant) awareness of food waste (H5.1.), as well as students not living with their families but preparing food at home (H3.2.). The transition to adulthood carries tremendous change and responsibility, but the higher the responsibility rate, the greater the perception of food waste and the lower its generation.

Limitations and Future Research Directions

This study has some limitations regarding both the methodology and the utilitarian nature of the results obtained. The sample selected for the study consisted of individuals, university students, in the age range of 18 to 35 years; therefore, an attempt to extrapolate the results to an entire population must be taken with some caution. In addition, there was a certain disproportion in the size of the sample in each country, with 699 students in Italy and 382 respondents in Poland. Consumer opinions about the perception of food waste may vary depending on the socio-demographic characteristics of the individual and the territorial scope [74]. Another limitation was that the respondents came from only two countries, although Italy and Poland are relatively large EU countries (in terms of the number of inhabitants, Italy and Poland in 2023 were after Germany and France as the third and fifth countries wasting the most food in the European Union) [75], which due to historical conditions are perceived as multicultural countries, and now, from year to year, this nature of multiculturalism is deepening [76,77]. Despite the above limitations, the results obtained (especially given their cross-sectional nature) are practical, identifying factors determining the perception of food waste by the student population with particular attention paid to living conditions and nutritional practices. Due to the fact that the research was conducted in the context of global crises [78], the research tool proposed in this paper can be used to develop a comparative analysis of possible changes in the perception of food waste in the conditions of turbulence in the environment but also during other currently potential crises. The research tool proposed in this paper may be useful for further cross-cultural comparisons in the area analyzed.

Author Contributions

Conceptualization, M.M., V.A., A.G.-C. and C.B.; methodology, G.C.; software, G.C.; formal analysis, G.C.; investigation, C.B.; resources, M.M., A.G.-C. and C.B.; data curation, G.C.; writing—original draft preparation, M.M., A.G.-C. and C.B.; writing—review and editing, C.B.; visualization, C.B.; supervision, M.M., V.A. and A.G.-C. All authors have read and agreed to the published version of the manuscript.

Funding

This research received no external funding.

Informed Consent Statement

Informed consent was obtained from all subjects involved in the study by accepting to participate to the questionnaire survey, which was anonymous.

Data Availability Statement

Data are available upon request.

Conflicts of Interest

The authors declare no conflicts of interest.

References

  1. Wang, H.; Ma, B.; Cudjoe, D.; Farrukh, M.; Bai, R. What influences students’ food waste behaviour in campus canteens? Br. Food J. 2022, 125, 381–395. [Google Scholar] [CrossRef]
  2. Zhang, H.; Li, S.; Wei, D.; He, J.; Chen, J.; Sun, C.; Vuppaladadiyam, A.K.; Duan, H. Characteristics, environmental impact, and reduction strategies of food waste generated by young adults: Case study on university canteens in Wuhan, China. J. Clean. Prod. 2021, 321, 128877. [Google Scholar] [CrossRef]
  3. Oxford Languages. Oxford English Dictionary. 2021. Available online: https://languages.oup.com/research/oxford-english-dictionary/ (accessed on 22 February 2024).
  4. Giordano, C.; Alboni, F.; Cicatiello, C.; Falasconi, L. Do discounted food products end up in the bin? An investigation into the link between deal-prone shopping behaviour and quantities of household food waste. Int. J. Consum. Stud. 2018, 43, 199–209. [Google Scholar] [CrossRef]
  5. Eurostat. Food Waste: 127 kg per Inhabitant in the EU in 2020. 2022. Available online: https://ec.europa.eu/eurostat/web/products-eurostat-news/-/ddn-20220925-2 (accessed on 14 April 2023).
  6. Eurostat. Food Waste and Food Waste Prevention—Estimates. 2023. Available online: https://ec.europa.eu/eurostat/web/waste/data/database (accessed on 14 April 2023).
  7. Amicarelli, V.; Lagioia, G.; Sampietro, S.; Bux, C. Has the COVID-19 pandemic changed food waste perception and behavior? Evidence from Italian consumers. Socio-Econ. Plan. Sci. 2022, 82, 101095. [Google Scholar] [CrossRef]
  8. Filimonau, V.; Vi, L.H.; Beer, S.; Ermolaev, V.A. The COVID-19 pandemic and food consumption at home and away: An exploratory study of English households. Socio-Econ. Plan. Sci. 2022, 82, 101125. [Google Scholar] [CrossRef] [PubMed]
  9. Strotmann, C.; Baur, V.; Börnert, N.; Gerwin, P. Generation and prevention of food waste in the German food service sector in the COVID-19 pandemic—Digital approaches to encounter the pandemic related crisis. Socio-Econ. Plan. Sci. 2022, 82, 101104. [Google Scholar] [CrossRef] [PubMed]
  10. Leal Filho, W.; Salvia, A.L.; Davis, B.; Will, M.; Moggi, S. Higher education and food waste: Assessing current trends. Int. J. Sustain. Dev. World Ecol. 2021, 28, 440–450. [Google Scholar] [CrossRef]
  11. Leal Filho, W.; Ribeiro, P.C.C.; Setti, A.F.F.; Azam, F.M.S.; Abubakar, I.R.; Castillo-Apraiz, J.; Tamayo, U.; Özuyar, P.G.; Frizzo, K.; Borsari, B. Toward food waste reduction at universities. Environ. Dev. Sustain. 2023, 6, 1–22. [Google Scholar] [CrossRef]
  12. Bravi, L.; Murmura, F.; Savelli, E.; Viganò, E. Motivations and Actions to Prevent Food Waste among Young Italian Consumers. Sustainability 2019, 11, 1110. [Google Scholar] [CrossRef]
  13. Nikolaus, C.J.; Nickols-Richardson, S.M.; Ellison, B. Wasted food: A qualitative study of U.S. young adults’ perceptions, beliefs and behaviors. Appetite 2018, 130, 70–78. [Google Scholar] [CrossRef]
  14. Piras, S.; Righi, S.; Banchelli, F.; Giordano, C.; Setti, M. Food waste between environmental education, peers, and family influence. Insights from primary school students in Northern Italy. J. Clean. Prod. 2023, 383, 135461. [Google Scholar] [CrossRef]
  15. Marques, C.; Lima, J.P.M.; Fialho, S.; Pinto, E.; Baltazar, A.L. Impact of a Food Education Session on Vegetables Plate Waste in a Portuguese School Canteen. Sustainability 2022, 14, 16674. [Google Scholar] [CrossRef]
  16. Knezevic, B.; Kurnoga, N.; Anic, I.-D. Typology of university students regarding attitudes towards food waste. Br. Food J. 2019, 121, 2578–2591. [Google Scholar] [CrossRef]
  17. Malefors, C.; Sundin, N.; Tromp, M.; Eriksson, M. Testing interventions to reduce food waste in school catering. Resour. Conserv. Recycl. 2022, 177, 105997. [Google Scholar] [CrossRef]
  18. Wang, L.; Zhu, L.; Pan, S.; Wang, S. Low-carbon emitting university campus achieved via anaerobic digestion of canteen food wastes. J. Environ. Manag. 2023, 335, 117533. [Google Scholar] [CrossRef]
  19. Qian, L.; Li, F.; Cao, B.; Wang, L.; Jin, S. Determinants of food waste generation in Chinese university canteens: Evidence from 9192 university students. Resour. Conserv. Recycl. 2021, 167, 105410. [Google Scholar] [CrossRef]
  20. Li, J.; Li, W.; Wang, L.; Jin, B. Environmental and Cost Impacts of Food Waste in University Canteen from a Life Cycle Perspective. Energies 2021, 14, 5907. [Google Scholar] [CrossRef]
  21. European Commission. Circular Economy Action Plan. 2023. Available online: https://environment.ec.europa.eu/strategy/circular-economy-action-plan_en (accessed on 4 May 2023).
  22. Eurostat. Monitoring Framework. 2023. Available online: https://ec.europa.eu/eurostat/web/circular-economy/monitoring-framework (accessed on 4 May 2023).
  23. Jordyn, M.; Byrd, M. The relationship between the living arrangements of university students and their identity development. Adolescence 2003, 38, 267–278. [Google Scholar]
  24. Riddell, L.J.; Ang, B.; Keast, R.S.; Hunter, W. Impact of living arrangements and nationality on food habits and nutrient intakes in young adults. Appetite 2011, 56, 726–731. [Google Scholar] [CrossRef] [PubMed]
  25. El Ansari, W.; Stock, C.; Mikolajczyk, R.T. Relationships between food consumption and living arrangements among university students in four European countries—A cross-sectional study. Nutr. J. 2012, 24, 11–28. [Google Scholar] [CrossRef]
  26. Official Journal of the European Union. Commission Delegated Decision (EU) 2019/1597 of 3 May 2019. 2019. Available online: https://eur-lex.europa.eu/legal-content/EN/TXT/PDF/?uri=CELEX:32019D1597 (accessed on 14 April 2023).
  27. Lemaire, A.; Limbourg, S. How can food loss and waste management achieve sustainable development goals? J. Clean. Prod. 2019, 234, 1221–1234. [Google Scholar] [CrossRef]
  28. Ardra, S.; Barua, M.K. Halving food waste generation by 2030: The challenges and strategies of monitoring UN sustainable development goal target 12.3. J. Clean. Prod. 2022, 380, 135042. [Google Scholar] [CrossRef]
  29. Vittuari, M.; Garcia Herrero, L.; Masotti, M.; Iori, E.; Caldeira, C.; Qian, Z.; Bruns, H.; van Herpen, E.; Obersteiner, G.; Kaptan, G.; et al. How to reduce consumer food waste at household level: A literature review on drivers and levers for behavioural change. Sustain. Prod. Consum. 2023, 38, 104–114. [Google Scholar] [CrossRef]
  30. Principato, L.; Mattia, G.; Di Leo, A.; Pratesi, C.A. The household wasteful behaviour framework: A systematic review of consumer food waste. Ind. Mark. Manag. 2021, 93, 641–649. [Google Scholar] [CrossRef]
  31. Akbar, P.N.G.; Gunawijaya, J. Millennials and Gen Z: Their Characteristics, Perceptions, and Satisfaction from Leisure and Event Perspectives. Proceedings 2022, 83, 9. [Google Scholar] [CrossRef]
  32. Ilakovac, B.; Voca, N.; Pezo, L.; Cerjak, M. Quantification and determination of household food waste and its relation to sociodemographic characteristics in Croatia. Waste Manag. 2020, 102, 231–240. [Google Scholar] [CrossRef] [PubMed]
  33. van Geffen, L.; van Herpen, E.; van Trijp, H. Causes & Determinants of Consumers’ Food Waste: A Theoretical Framework; Wageningen UR: Wageningen, The Netherlands, 2016; pp. 1–26. [Google Scholar]
  34. Qi, D.; Roe, B.E. Household food waste: Multivariate regression and principal components analyses of awareness and attitudes among U.S consumers. PLoS ONE 2016, 11, e0159250. [Google Scholar] [CrossRef]
  35. Szabó-Bódi, B.; Kasza, G.; Szakos, D. Assessment of household food waste in Hungary. Br. Food J. 2018, 120, 625–638. [Google Scholar] [CrossRef]
  36. Behnassi, M.; El Haiba, M. Implications of the Russia–Ukraine war for global food security. Nat. Hum. Behav. 2022, 6, 754–755. [Google Scholar] [CrossRef]
  37. Maillet, M.A.; Grouzet, F.M.E. Understanding changes in eating behavior during the transition to university from a self-determination theory perspective: A systematic review. J. Am. Coll. Health 2023, 71, 422–439. [Google Scholar] [CrossRef]
  38. IPCC. Special Report on Climate Change and Land. 2019. Available online: https://www.ipcc.ch/srccl/ (accessed on 26 April 2023).
  39. ENEA. Rapporto Annuale Sull’efficienza Energetica 2017. 2017. Available online: https://www.efficienzaenergetica.enea.it/component/jdownloads/?task=download.send&id=126&catid=40&Itemid=101 (accessed on 26 April 2023).
  40. Bux, C.; Zizzo, G.; Amicarelli, V. A combined evaluation of energy efficiency, customer satisfaction and food waste in the healthcare sector by comparing cook-hold and cook-chill catering. J. Clean. Prod. 2023, 429, 139594. [Google Scholar] [CrossRef]
  41. Holt-Giménez, E. A Foodie’s Guide to Capitalism: Understanding the Political Economy of What We Eat; Publisher/Imprint; Monthly Review Press: New York, NY, USA, 2017. [Google Scholar]
  42. Møller, H.; Ole, J.H.; Gustavsson, J.; Oestergren, K.; Stenmarck, A. Report on Review of (Food) Waste Reporting Methodology and Practice; Ostfold Research: Fredrikstad, Norway, 2014. [Google Scholar]
  43. Shu, Y.; Roe, B.E.; Bender, K. Adapting, refining and expanding a validated questionnaire to measure food waste in U.S. households. MethodsX 2021, 8, 101377. [Google Scholar] [CrossRef] [PubMed]
  44. Davenport, M.L.; Qi, D.; Roe, B.E. Food-related routines, product characteristics, and household food waste in the United States: A refrigerator-based pilot study. Resour. Conserv. Recycl. 2019, 150, 104440. [Google Scholar] [CrossRef]
  45. Kasavan, S.; Siron, R.; Yusoff, S.; Fakri, M.F.R. Drivers of food waste generation and best practice towards sustainable food waste management in the hotel sector: A systematic review. Environ. Sci. Pollut. Res. 2022, 29, 48152–48167. [Google Scholar] [CrossRef] [PubMed]
  46. Hebrok, M.; Boks, C. Household food waste: Drivers and potential intervention points for design—An extensive review. J. Clean. Prod. 2017, 151, 380–392. [Google Scholar] [CrossRef]
  47. Guillemin, F.; Bombardier, C.; Beaton, D. Cross-cultural adaptation of health-related quality of life measures: Literature review and proposed guidelines. J. Clin. Epidemiol. 1993, 46, 1417–1432. [Google Scholar] [CrossRef] [PubMed]
  48. Beaton, D.; Bombardier, C.; Guillemin, F.; Ferraz, M. Recommendations for the Cross-Cultural Adaptation of the DASH and Quick DASH Outcome Measures; Institute for Work and Health: Toronto, ON, Canada, 2007. [Google Scholar]
  49. Tsang, S.; Royse, C.F.; Terkawi, A.S. Guidelines for developing, translating, and validating a questionnaire in perioperative and pain medicine. Saudi J. Anaesth. 2017, 11, 80–89. [Google Scholar] [CrossRef]
  50. Hsu, H.Y.; Wang, S. Using Google forms to collect and analyze data. Sci. Scope 2017, 40, 64–67. [Google Scholar] [CrossRef]
  51. Cohen, N.; Arieli, T. Field research in conflict environments: Methodological challenges and snowball sampling. J. Peace Res. 2021, 48, 423–435. [Google Scholar] [CrossRef]
  52. Alaimo, L.S.; Fiore, M.; Galati, A. How the COVID-19 pandemic is changing online food shopping human behaviour in Italy. Sustainability 2020, 12, 9594. [Google Scholar] [CrossRef]
  53. Arnett, J.J. Emerging adulthood: A theory of development from the late teens through the twenties. Am. Psychol. 2000, 55, 469. [Google Scholar] [CrossRef]
  54. Tsai, W.C.; Chen, X.; Yang, C. Consumer Food Waste Behavior among Emerging Adults: Evidence from China. Foods 2020, 9, 961. [Google Scholar] [CrossRef]
  55. Viccaro, M.; Coppola, A.; D’Angelo, M.C.; Genovese, F.; Romano, S.; Cozzi, M. Young People Are Not All the Same! The Theory of Planned Behaviour Applied to Food Waste Behaviour across Young Italian Generations. Sustainability 2023, 15, 14741. [Google Scholar] [CrossRef]
  56. Grunert, K.G.; Chimisso, C.; Lähteenmäki, L.; Leardini, D.; Sandell, M.A.; Vainio, A.; Vranken, L. Food-related consumer behaviours in times of crisis: Changes in the wake of the Ukraine war, rising prices and the aftermath of the COVID-19 pandemic. Food Res. Int. 2023, 173, 113451. [Google Scholar] [CrossRef] [PubMed]
  57. Lin, F.; Li, X.; Jia, N.; Feng, F.; Huang, H.; Huang, J.; Fan, S.; Ciais, P.; Song, X.P. The impact of Russia-Ukraine conflict on global food security. Glob. Food Secur. 2023, 36, 100661. [Google Scholar] [CrossRef]
  58. Borghesi, G.; Morone, P. A review of the effects of COVID-19 on food waste. Food Secur. 2023, 15, 261–280. [Google Scholar] [CrossRef] [PubMed]
  59. Amuakwa-Mensah, F.; Amuakwa-Mensah, S.; Klege, R.A.; Adom, P.K. Stockpiling and food worries: Changing habits and choices in the midst of COVID-19 pandemic. Socio-Econ. Plan. Sci. 2021, 82, 101181. [Google Scholar] [CrossRef] [PubMed]
  60. Principato, L.; Secondi, L.; Cicatiello, C.; Mattia, G. Caring more about food: The unexpected positive effect of the COVID-19 lockdown on household food management and waste. Socio-Econ. Plan. Sci. 2020, 82, 100953. [Google Scholar] [CrossRef]
  61. Roe, B.E.; Bender, K.; Qi, D. The impact of COVID-19 on consumer food waste. Appl. Econ. Perspect. Policy 2020, 43, 401–411. [Google Scholar] [CrossRef]
  62. Mikhael, Z.; Wehbe, T.; Jaoude, E.A. Nutritional Behaviors and Living Arrangements during the University Years: A Correlation Study. Annu. Public. Health Res. 2018, 5, 1071. [Google Scholar]
  63. Iori, E.; Masotti, M.; Falasconi, L.; Risso, E.; Segrè, A.; Vittuari, M. Tell Me What You Waste and I’ll Tell You Who You Are: An Eight-Country Comparison of Consumers’ Food Waste Habits. Sustainability 2023, 15, 430. [Google Scholar] [CrossRef]
  64. Aloysius, N.; Ananda, J.; Mitsis, A.; Pearson, D. Why people are bad at leftover food management? A systematic literature review and a framework to analyze household leftover food waste generation behavior. Appetite 2023, 186, 106577. [Google Scholar] [CrossRef]
  65. Papadaki, A.; Hondros, G.; Scott, J.A.; Kapsokefalou, M. Eating habits of University students living at, or away from home in Greece. Appetite 2007, 49, 169–176. [Google Scholar] [CrossRef] [PubMed]
  66. Smith, L.; Disler, R.; Watson, K. Physical activity and dietary habits of first year nursing students: An Australian dual-method study. Collegian 2020, 27, 535–541. [Google Scholar] [CrossRef]
  67. Feijoo, G.; Moreira, M.T. Fostering environmental awareness towards responsible food consumption and reduced food waste in chemical engineering students. Educ. Chem. Eng. 2020, 33, 27–35. [Google Scholar] [CrossRef]
  68. Croes, E.; Bartels, J. Young adults’ motivations for following social influencers and their relationship to identification and buying behavior. Comput. Hum. Behav. 2021, 124, 106910. [Google Scholar] [CrossRef]
  69. Neubig, C.M.; Vranken, L.; Roosen, J.; Grasso, S.; Hieke, S.; Knoepfle, S.; Macready, A.L.; Masento, N.A. Action-related information trumps system information: Influencing consumers’ intention to reduce food waste. J. Clean. Prod. 2020, 261, 121126. [Google Scholar] [CrossRef]
  70. Eriksson, M.; Christensen, J.; Malefors, C. Making food waste illegal in Sweden—Potential gains from enforcing best practice in the public catering sector. Sustain. Prod. Consum. 2023, 35, 229–237. [Google Scholar] [CrossRef]
  71. Žalėnienė, I.; Pereira, P. Higher Education for Sustainability: A Global Perspective. Geogr. Sustain. 2021, 2, 99–106. [Google Scholar] [CrossRef]
  72. Figueiró, P.S.; Raufflet, E. Sustainability in higher education: A systematic review with focus on management education. J. Clean. Prod. 2015, 106, 22–23. [Google Scholar] [CrossRef]
  73. Kassel, K.; Rimanoczy, I.; Mitchell, S.F. The Sustainable Mindset: Connecting Being, Thinking, and Doing in Management Education. In Academy of Management Annual Meeting Proceedings; Academy of Management: Briarcliff Manor, NY, USA, 2016. [Google Scholar] [CrossRef]
  74. Henriques, A.S.; King, S.C.; Meiselman, H.L. Consumer segmentation based on food neophobia and its application to product development. Food Qual. Prefer. 2009, 20, 83–91. [Google Scholar] [CrossRef]
  75. European Union. Facts and Figures about Life in the European Union, 2023. Available online: https://european-union.europa.eu/principles-countries-history/key-facts-and-figures/life-eu (accessed on 25 November 2023).
  76. Domańska-Szaruga, B.; Knap-Stefaniuk, A. Diagnosis of the organizational culture of multicultural enterprises—Introduction to in-depth research. Nowocz. Syst. Zarządzania 2022, 17, 37–48. [Google Scholar] [CrossRef]
  77. Śliz, A.; Szczepański, M.S. The phenomenon of multiculturalism: The case of Poland. Soc. Pathol. Prev. 2017, 2, 37–51. [Google Scholar] [CrossRef]
  78. Mączyńska, E. Crises as impulses for changes in socio-economic systems. MAZOVIA Reg. Stud. 2022, 9–30. [Google Scholar] [CrossRef]
Figure 1. Food waste (t) per country and per supply chain stage in Europe in 2020. Source: Personal elaboration by the authors on Eurostat [4]. Data were estimated according to the different measurement methodologies suggested by the Commission Delegated Decision (EU) 2019/1597 [26], and comparability was guaranteed by reporting food waste in its fresh mass weight.
Sustainability 16 02102 g001
Figure 2. Research hypotheses. Source: Personal elaboration by the authors.
Sustainability 16 02102 g002
Figure 3. Research study methodological workflow. Note: The chart illustrates the sequential steps from the data collection and preliminary analysis steps (in blue) to result interpretation, with non-parametric tests (in yellow) highlighted due to the data’s characteristics, and parametric tests (in gray) omitted. Source: Personal elaboration by the authors.
Sustainability 16 02102 g003
Figure 4. Food waste awareness in Italy (a) and Poland (b). Note: Participants were asked to respond to the question “How aware are you of the problem of food waste?” and could answer according to a five-point Likert scale. Source: Personal elaboration by the authors.
Sustainability 16 02102 g004
Figure 5. Food waste awareness vs. age group in Italy (a) and in Poland (b) according to H1.1. Note: 1 = very little; 2 = poor; 3 = average; 4 = good; 5 = very much aware of food waste. Source: Personal elaboration by the authors.
Sustainability 16 02102 g005
Figure 6. Food waste awareness vs. sex in Italy (a) and in Poland (b) according to H1.1. Note: 1 = very little; 2 = poor; 3 = average; 4 = good; 5 = very much aware of food waste. Source: Personal elaboration by the authors.
Sustainability 16 02102 g006
Figure 7. Food awareness vs. climate–economy–social crisis concern in Poland (H1.2.). Note: Participants were asked to respond to the question “How do you perceive the social and economic context in your country, following the social–economic–environmental crisis (e.g., Russia–Ukraine conflict, high inflation rate)?”; 1 = very little; 2 = poor; 3 = average; 4 = good; 5 = very much aware of food waste. Source: Personal elaboration by the authors.
Sustainability 16 02102 g007
Figure 8. Food waste awareness vs. living arrangements and dietary practice according to H3.2. (a) and H5.1. (b) in Italy and H4.1. (c) in Poland. Note: A = eating in canteens; B = preparing food for lunch at home; C = buying take-away food and eating in public areas; D = going back home to have lunch. Red lines indicate the living arrangement objects of the hypothesis; 1 = very little; 2 = poor; 3 = average; 4 = good; 5 = very much aware of food waste. Red lines identify the significant values. Source: Personal elaboration by the authors.
Sustainability 16 02102 g008
Table 1. Food waste amounts (t) in Italy and Poland per supply chain stage (%).
Supply Chain StageItaly (t)Italy (%)Poland (t)Poland (%)
Primary production1,270,63815%670,54717%
Processing and manufacturing510,0186%544,94214%
Retail and distribution343,5354%320,3968%
Restaurants and food services193,9152%190,2935%
Households6,332,34973%2,275,92157%
Total8,650,455-4,002,099-
Source: Personal elaboration by the authors on Eurostat [4].
Table 2. Sociodemographic characteristics of the sample.
Sociodemographic CharacteristicsCategoriesItaly (%)Poland (%)
SexFemale72.686.7
Male26.713.3
Other0.70
Age18–2530.489.6
26–3569.610.4
Household composition13.110.2
211.720.6
3–466.851.4
5 or more18.417.8
Education (attendance)Bachelor’s degree51.362.7
Master’s degree41.932.4
Ph.D. or other6.84.9
Financial statusHard4.70.8
Humble4131.3
Good43.151.4
Excellent4.915.4
Prefer not to answer6.41.1
Living arrangementFamily73.356.4
Friends and/or colleagues13.118.8
Boyfriend or girlfriend6.612.8
Alone6.912
Source: Personal elaboration by the authors.
Table 3. Comparative analysis of hypothesis testing between Italian and Polish university students.
HypothesisCharacteristic (Test)Statistics (IT)p-Value (IT)Significance (IT)Statistics (PO)p-Value (PO)Significance (PO)
H1.1Age (MWU)63,0140.00000272YES5200.50.0079YES
Sex (MWU)47,629.50.8551NO12,4400.00013YES
University field (KW)23.920.0209YES18.450.187NO
Financial status (KW)3.930.4149NO3.40.493NO
H1.2Climate–economy–social crisis (KW)4.170.1243NO15.430.000447YES
H2.1Living with the family and eating in canteens (KW)6.340.096NO22530.0646NO
H2.2Not living with the family and eating in canteens (KW)12.450.0143YES0.4110.7453NO
H3.1Living with the family and preparing food at home (KW)15.150.0017YES1.890.169NO
H3.2Not living with the family and preparing food at home (KW)16.30.00099YES2.080.149NO
H4.1Living with the family and purchasing take-away food (KW)15.150.0017YES19.660.00058YES
H4.2Not living with the family and purchasing take-away food (KW)6.340.096NO0.510.917NO
H5.1Living with the family and coming back home to eat (KW)15.150.0017YES2.170.538NO
H5.2Not living with the family and coming back home to eat (KW)6.340.096NO5.330.149NO
Note: The table summarizes the statistical outcomes for various sociodemographic and behavioral characteristics related to food waste perception. The left column denotes the hypothesis tested, followed by the characteristic in question, the statistical test employed, the test statistic, the p-value and the detected significance across Italy and Poland, respectively. The results indicate significant cross-cultural variations in the factors influencing food waste perception. MWU = Mann–Whitney U; KW = Kruskal–Wallis; IT = Italy; PO = Poland.
Disclaimer/Publisher’s Note: The statements, opinions and data contained in all publications are solely those of the individual author(s) and contributor(s) and not of MDPI and/or the editor(s). MDPI and/or the editor(s) disclaim responsibility for any injury to people or property resulting from any ideas, methods, instructions or products referred to in the content.

