Article

Analysis of Potential Environmental Risks in the Hydraulic Fracturing Operation in the “La Luna” Formation in Colombia

by
Camilo Andrés Guerrero-Martin
1,2,* and
Alexandre Szklo
2
1
Department of Engineering, Federal University of Pará, Campus Salinópolis, Rua Raimundo Santana Cruz, S/N, Bairro São Tomé, Salinópolis 68721-000, Brazil
2
Centre for Energy and Environmental Economics (Cenergia), Energy Planning Program (PPE), Alberto Luiz Coimbra Institute for Graduate Studies and Research in Engineering (COPPE), Universidade Federal do Rio de Janeiro (UFRJ), Rio de Janeiro 21941-917, Brazil
*
Author to whom correspondence should be addressed.
Sustainability 2024, 16(5), 2063; https://doi.org/10.3390/su16052063
Submission received: 6 November 2023 / Revised: 23 January 2024 / Accepted: 30 January 2024 / Published: 1 March 2024

Abstract

:
This article presents an in-depth analysis of potential environmental risks associated with hydraulic fracturing operations within the “La Luna” formation in Colombia. Using the Conesa methodology, it assesses the environmental impacts of unconventional reservoir production in Colombia, including water usage, chemical additives, air emissions, and the potential for groundwater contamination. This study incorporates comprehensive data on geological characteristics, operational procedures, and environmental conditions specific to the region. This analysis highlights the need for a proactive approach to managing potential environmental risks associated with hydraulic fracturing in Colombia. The findings underscore the importance of implementing robust regulatory measures, comprehensive monitoring systems, and the industry’s best practices to mitigate and prevent adverse environmental impacts. This research contributes to the ongoing global dialogue on the environmental implications of hydraulic fracturing in regions with sensitive ecological conditions. The environmental impacts of unconventional reservoirs are widely recognized as a general consensus; however, the absence of applied studies with the rigor of an explicit methodology in Andean countries highlights the need for specific research in this region. This article addresses this gap by proposing a detailed and structured methodology to assess and mitigate environmental impacts in unconventional reservoirs. Emphasizing the importance of knowing the characteristics of reservoir fluids, this research highlights that this critical information is only revealed by drilling exploration wells and PVT (pressure, volume, and temperature) analysis. Obtaining this data is crucial for shaping specific mitigation measures, thus allowing for the formulation of a robust environmental management plan tailored to the conditions of the reservoirs in the Andean region. This precise and contextualized approach contributes to closing the knowledge gap and promotes more sustainable practices in the exploitation of unconventional reservoirs in this specific geographical context. The methodology used in this study proved its effectiveness by accurately quantifying the risks associated with each of the environmental alterations inherent to the hydraulic fracturing process in the La Luna formation. The results obtained allowed for the identification of the critical points most susceptible to environmental impacts, serving as a solid basis for the elaboration of an environmental management plan. This strategic approach not only enabled the delineation of specific mitigation measures but also facilitated the selection of the most appropriate locations for the implementation of the plan, maximizing the effectiveness of corrective actions. It is noteworthy that the successful application of the Conesa methodology in this unconventional reservoir context evidences the versatility and applicability of this approach, consolidating it as a valuable tool for environmental assessment and effective planning in the hydraulic fracturing industry.

1. Introduction

Approximately 80% of the global primary energy consumption derives from hydrocarbons, with South America contributing 8.2% and 3.6% of oil and gas production, respectively. Notably, the region possesses 19.5% of the world’s proven crude oil reserves and 4.2% of its proven gas reserves [1,2]. Consequently, there have been ongoing debates concerning the exploitation of hydrocarbon reserves, which could ensure energy security locally and foster fiscal gains for State development [3,4]. As part of this discussion, the application of the CONESA methodology has been employed, constituting an unprecedented initiative.
Furthermore, the growing reserves and the escalation of production necessitate exploration and extraction from new plays, where the significance of unconventional reservoirs comes into play. South America holds significant potential as a substantial source of unconventional hydrocarbons [5,6,7]. Nevertheless, the practicality of oil extraction from unconventional reservoirs hinges on surmounting challenges related to water contamination, environmental degradation, induced seismic activity, and regulatory and institutional complexities.
This research delves into the intricate dynamics of a hydraulic fracturing facility in Colombia, comprehensively detailing its economic benefits, the specific technology utilized, and its associated environmental challenges. A meticulous analysis of the facility’s impacts and environmental risks is conducted, followed by a comprehensive outline of the mitigation measures necessary to counteract them. Additionally, this study provides comprehensive guidelines and suggestions for navigating the socioeconomic, institutional, and environmental challenges and opportunities pertinent to the development of similar projects in Colombia and other Andean countries as well.
To our knowledge, this is the first time that a structured study of the challenges of extracting unconventional hydrocarbons in Colombia and even in Andean countries has been addressed, especially if we consider the different aspects of these challenges. There are studies on the challenge of water consumption in the possible production of shale gas in Brazil [8] and even several studies on Argentina [9,10,11]. But, the literature still does not adequately address Andean countries, particularly countries that have unconventional resources in the Amazon region.
In turn, the Conesa methodology for environmental impact assessment in Colombia stands out as a suitable alternative for several reasons that reflect its effectiveness and adaptability to the particularities of the Colombian context. First, the Conesa methodology has smartly integrated positive aspects of previous methodologies, such as the well-known Leopold methodology and the RAM risk matrix. By incorporating and improving aspects of previous approaches, Conesa is able to take advantage of lessons learned and strengths identified in the field of environmental impact assessment.
Additionally, the widespread adoption and use of Conesa’s methodology in Colombia validate its effectiveness and relevance at the local level. The fact that this methodology is widely used in the country suggests that it has proven to be appropriate and reliable for addressing the specific complexities and challenges that characterize Colombia in terms of environmental impacts.
The validation of the CONESA methodology in the present study was carried out via a rigorous analysis of the relevant scientific literature and a detailed review of case studies duly cited in this manuscript. This methodological approach made it possible to support and substantiate the applicability and effectiveness of the CONESA methodology, ensuring its consistency and validity in the research context. Consultation of specialized scientific sources and reference to specific cases provided a solid basis to support the conclusions and ensure the robustness of the methodological approach employed in this study.
At the same time, the results obtained in this study have specific relevance for unconventional reservoirs in the Andean region. These findings constitute a significant contribution that goes beyond the geographical limits of this study, as their applicability extends to Andean countries with geological similarities. Although the uniqueness of each region is recognized, the results serve as a preliminary example and a starting point for future studies in related areas. Adapting the particularities of each region will maximize the usefulness of these results, facilitating knowledge transfer and providing practitioners and industry experts with a solid foundation to address the specific challenges associated with unconventional reservoirs in the Andean context.
Finally, this manuscript addresses the main research question by first exploring the complexity of potential impacts from the exploration and production chain of unconventional reservoirs. Then, the research formulates general measures for an environmental management plan to effectively mitigate these adverse effects, focusing on specific and applicable strategies. Finally, the study evaluates the suitability of the CONESA methodology to address the uniqueness of these projects, answering the critical question of whether CONESA proves to be an adequate and efficient approach in the environmental assessment of unconventional reservoirs. How do we propose and apply a methodology for assessing the impacts of the production of unconventional hydrocarbons in Colombia, given the different dimensions of these impacts?

2. Background

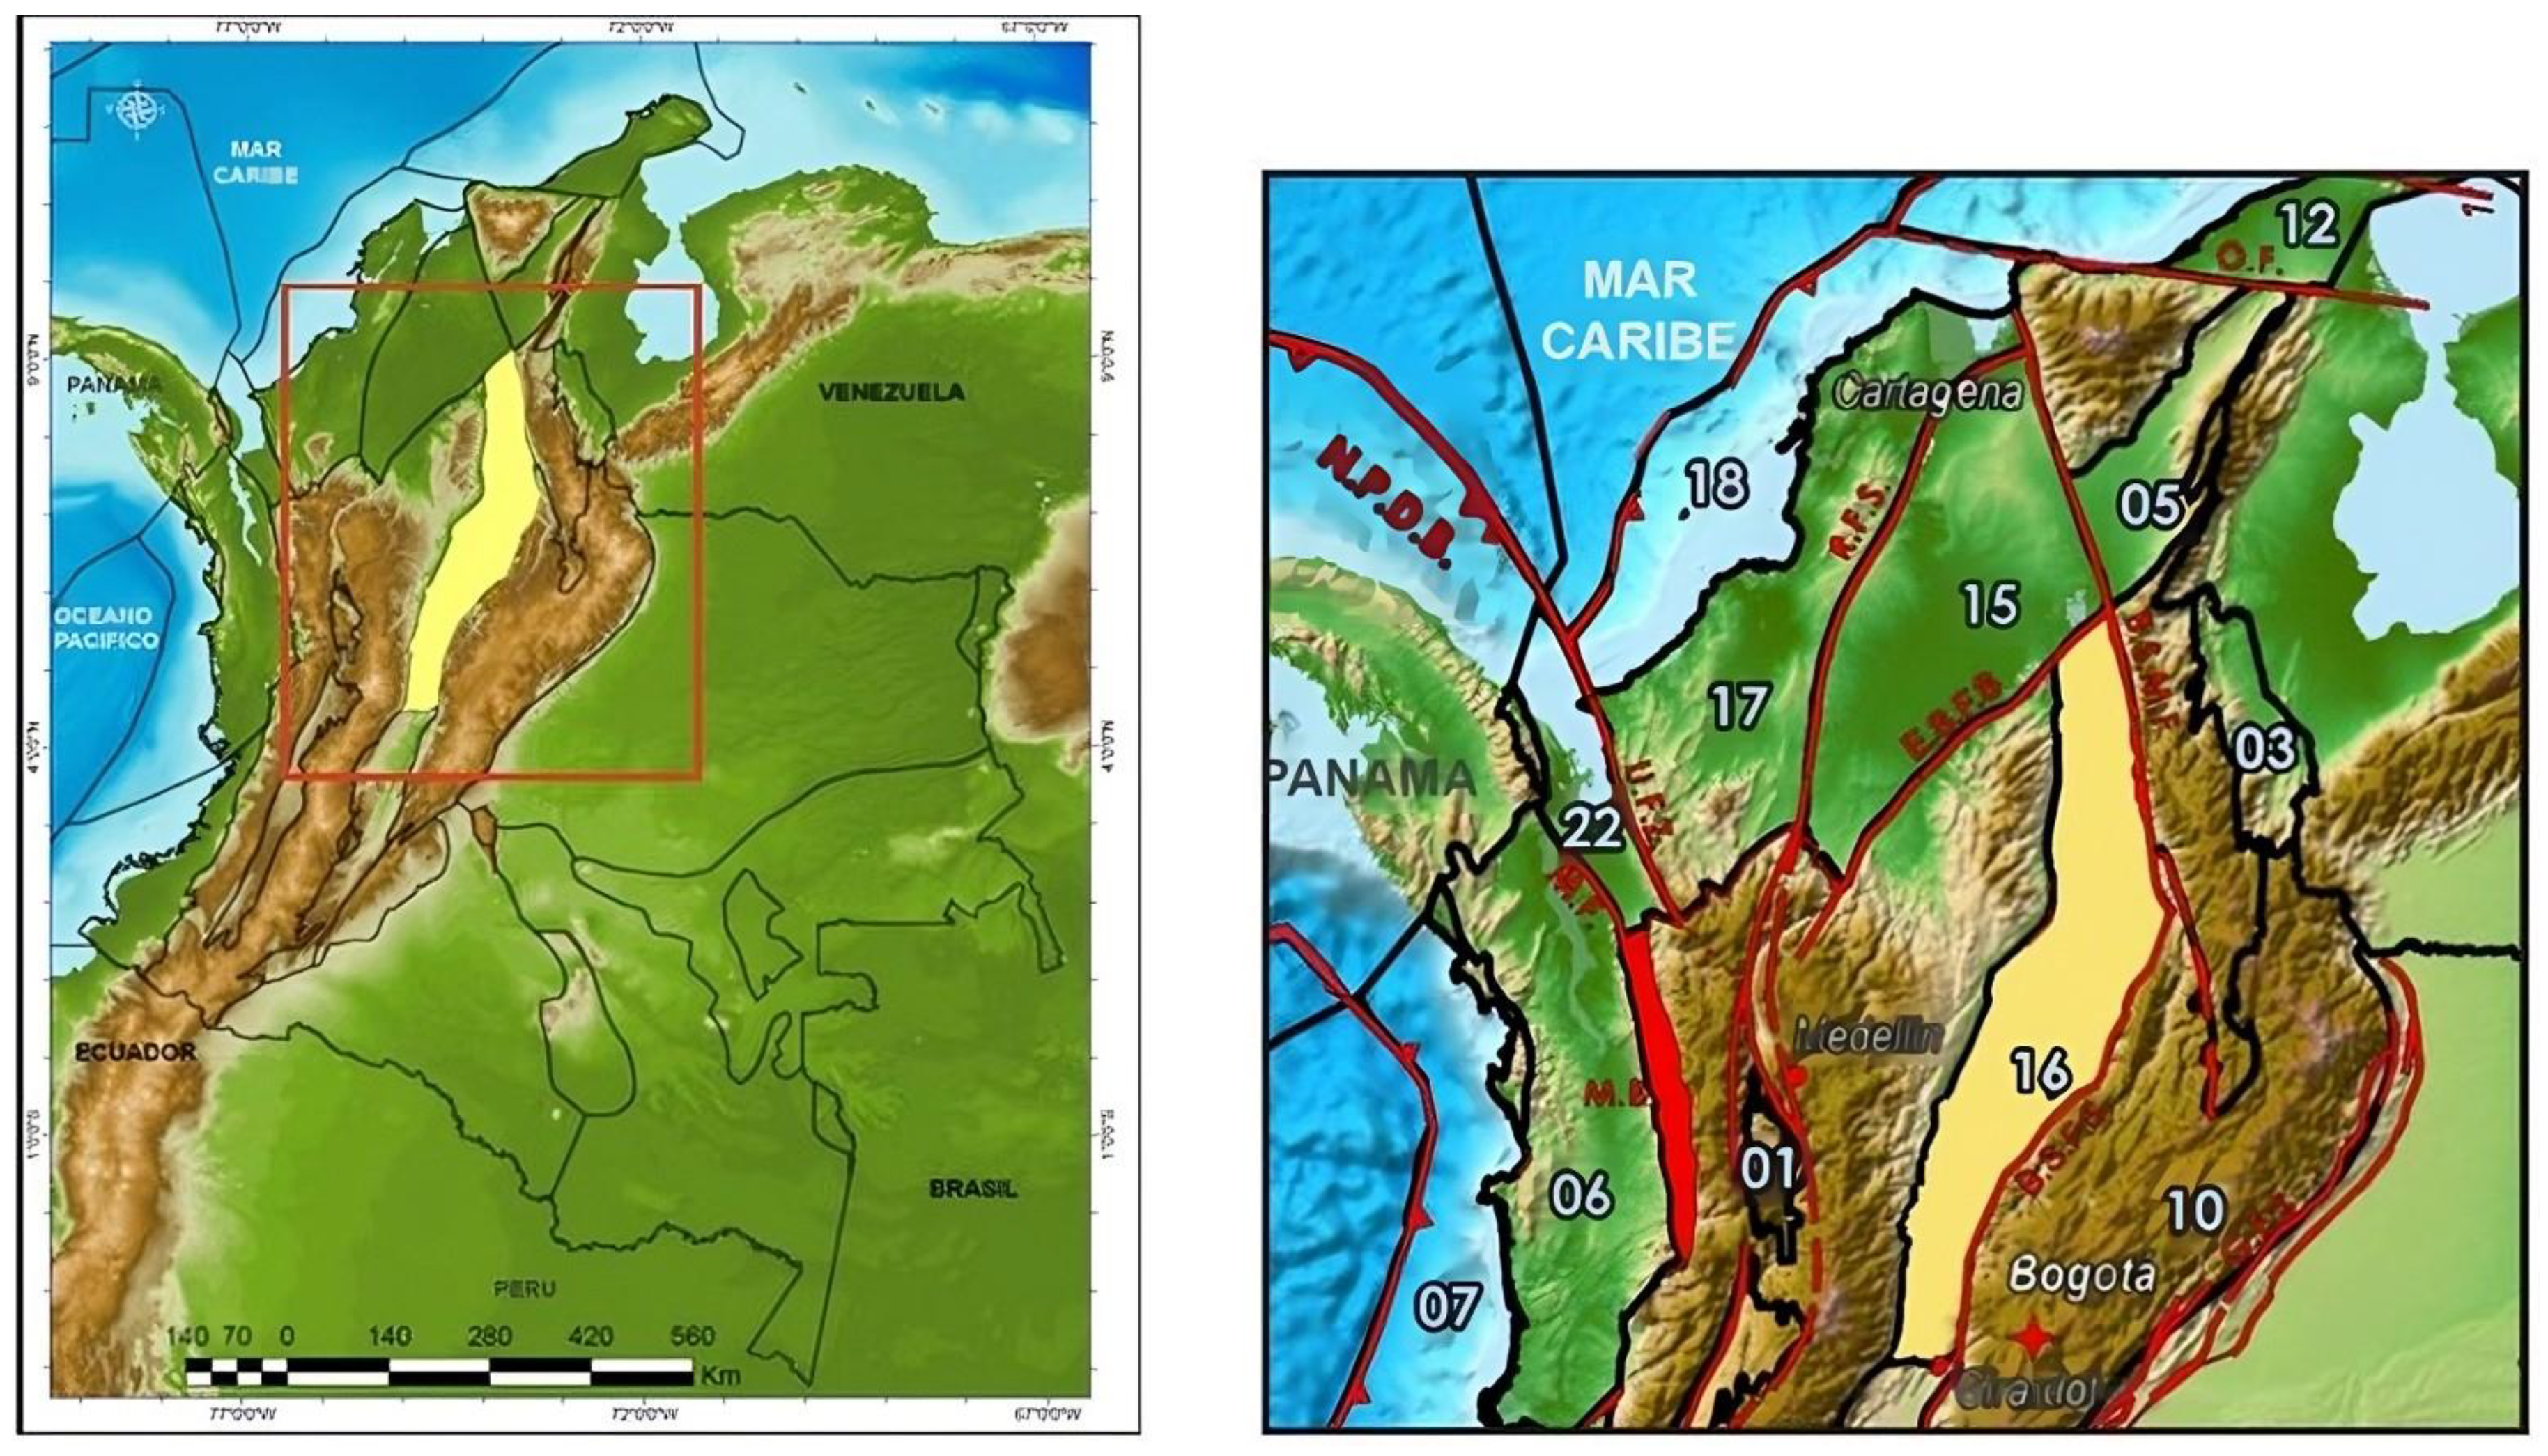
This study applied the analysis to the Middle Magdalena Valley (VMM) basin (Figure 1) operated by the Colombian oil company ECOPETROL. This is an unconventional reservoir in Colombia. The La Luna unconventional oil production field, located in the Middle Magdalena Valley (VMM) basin, is the third largest unconventional reservoir in the western hemisphere in terms of volume of reserves and potential for oil and natural gas extraction [12,13,14].
Actually, on the one side, this study deepens the previous research on the challenges of expanding oil frontiers in unconventional reservoirs. In fact, the dependence on oil revenues is a complex challenge for several countries. Many countries depend not only on oil production and its exports but also on imports of oil products. This creates an intricate challenge for these countries, as they must equate two conflicting challenges: the need to deal with replenishing oil reserves, which is crucial for maintaining government revenue; and the growing pressure to carry out the energy transition away from fossil fuels. This complex task is exacerbated when potential oil resources require innovative technologies and are located in sensitive areas. This intensifies the environmental and technical concerns associated with exploiting these resources. In the Andean countries, this scenario becomes even more complicated, highlighting the pressing need for strategic approaches and innovative solutions. An example of this is oil development in the Amazon basin of Ecuador, which has generated a critical intersection between economic progress and the health of local communities [17]. Also, in Peru, strategic work on environmental disaster planning for coastal oil spills exposes the need to anticipate and mitigate the risks associated with hydrocarbon [18].
However, more specifically, Colombia is an emblematic country in this case. The Middle Magdalena Valley (VMM) region in Colombia has a complex and layered geology that has led to the development of unconventional reservoirs, particularly in the form of shale gas. Exploration and exploitation of these resources involve a detailed understanding of the geology of the area [19,20,21].
The stratigraphic sequence in the Middle Magdalena Valley spans several geologic eras, with a particular focus on the Upper Cretaceous and Tertiary formations [22]. Within this stratigraphy, the La Luna Formation emerges as a critical component, hosting hydrocarbon source rocks [23]. The source rocks, located mainly in the La Luna Formation, have accumulated organic matter over geologic time [24]. These rocks are essential for oil and gas generation, and their detailed study provides valuable information on the amount and composition of hydrocarbons present in the region [25].
As for the tectonic structure, it is related to the Andes Mountains to the west and the Magdalena Basin to the east, resulting in systems such as folds and faults. These structures can significantly influence hydrocarbon migration and reservoir configuration [26]. Now, with respect to the unconventional reservoirs that can be found in the La Luna formation, the presence of shale gas stands out. This type of deposit is trapped in shale layers, sedimentary rocks rich in organic matter [27,28]. The La Luna Formation is the main generating unit of the basin, with a thickness of approximately 200 feet [27,28,29]. TOC ranges from 1.5% to 9.6%, with an average of 3.8%. This formation is currently in the hydrocarbon generation window [30]. The predominant oils in the basin have an API gravity exceeding 30° and are of outstanding quality [30,31]. The correlation between reservoir depth and API gravity is not straightforward. These oils originate from a later expulsion stage, and their elevated thermal transformation accounts for the elevated API gravity [31,32]. Efficient extraction of this gas requires the use of advanced techniques, such as hydraulic fracturing (fracking), which allows the gas trapped in the shale layers to be released by injecting fluids at high pressure [33,34]. Hydraulic fracturing is presented as the most suitable technique for hydrocarbon extraction in unconventional reservoirs such as shale and tight due to its ability to maximize productivity in low permeability formations [33,34]. These types of reservoirs, characterized by a compact source rock, require a solution to release the hydrocarbons trapped in their pores [35]. Fracking involves injecting high-pressure fluids into the formation, creating fractures that allow for higher permeability and, thus, more efficient extraction of oil and gas. This technique has proven to be highly effective in the exploitation of shale and tight reservoirs [36,37].
At the time of writing, the La Luna Formation, which is the third basin with unconventional oil potential in the Americas, has not been exploited yet. A more rigorous legal framework is awaited to make its exploitation viable; it is currently considered a contingent resource.
A conventional reservoir is formed through several stages that are governed by a chronological profile: initially, the hydrocarbon originates in a rock called a source rock, characterized by its very fine granulometry and the narrowness of its pores, through the accumulation of marine organic matter in sedimentary rock in an anaerobic environment. Subsequently, by the effect of the pressure that the oil causes under the rock, the oil is expelled from the source rock, which is called primary migration; then, the fluid flows into a formation composed of a sealing rock that prevents it from sliding, where, finally, the resource lodges in a formation called reservoir rock, which has good permo-porous characteristics; this process is known as secondary migration.
When the deposition of hydrocarbons does not have any of the steps listed above, the concept of unconventional reservoir (UCR) is used [38,39,40,41,42,
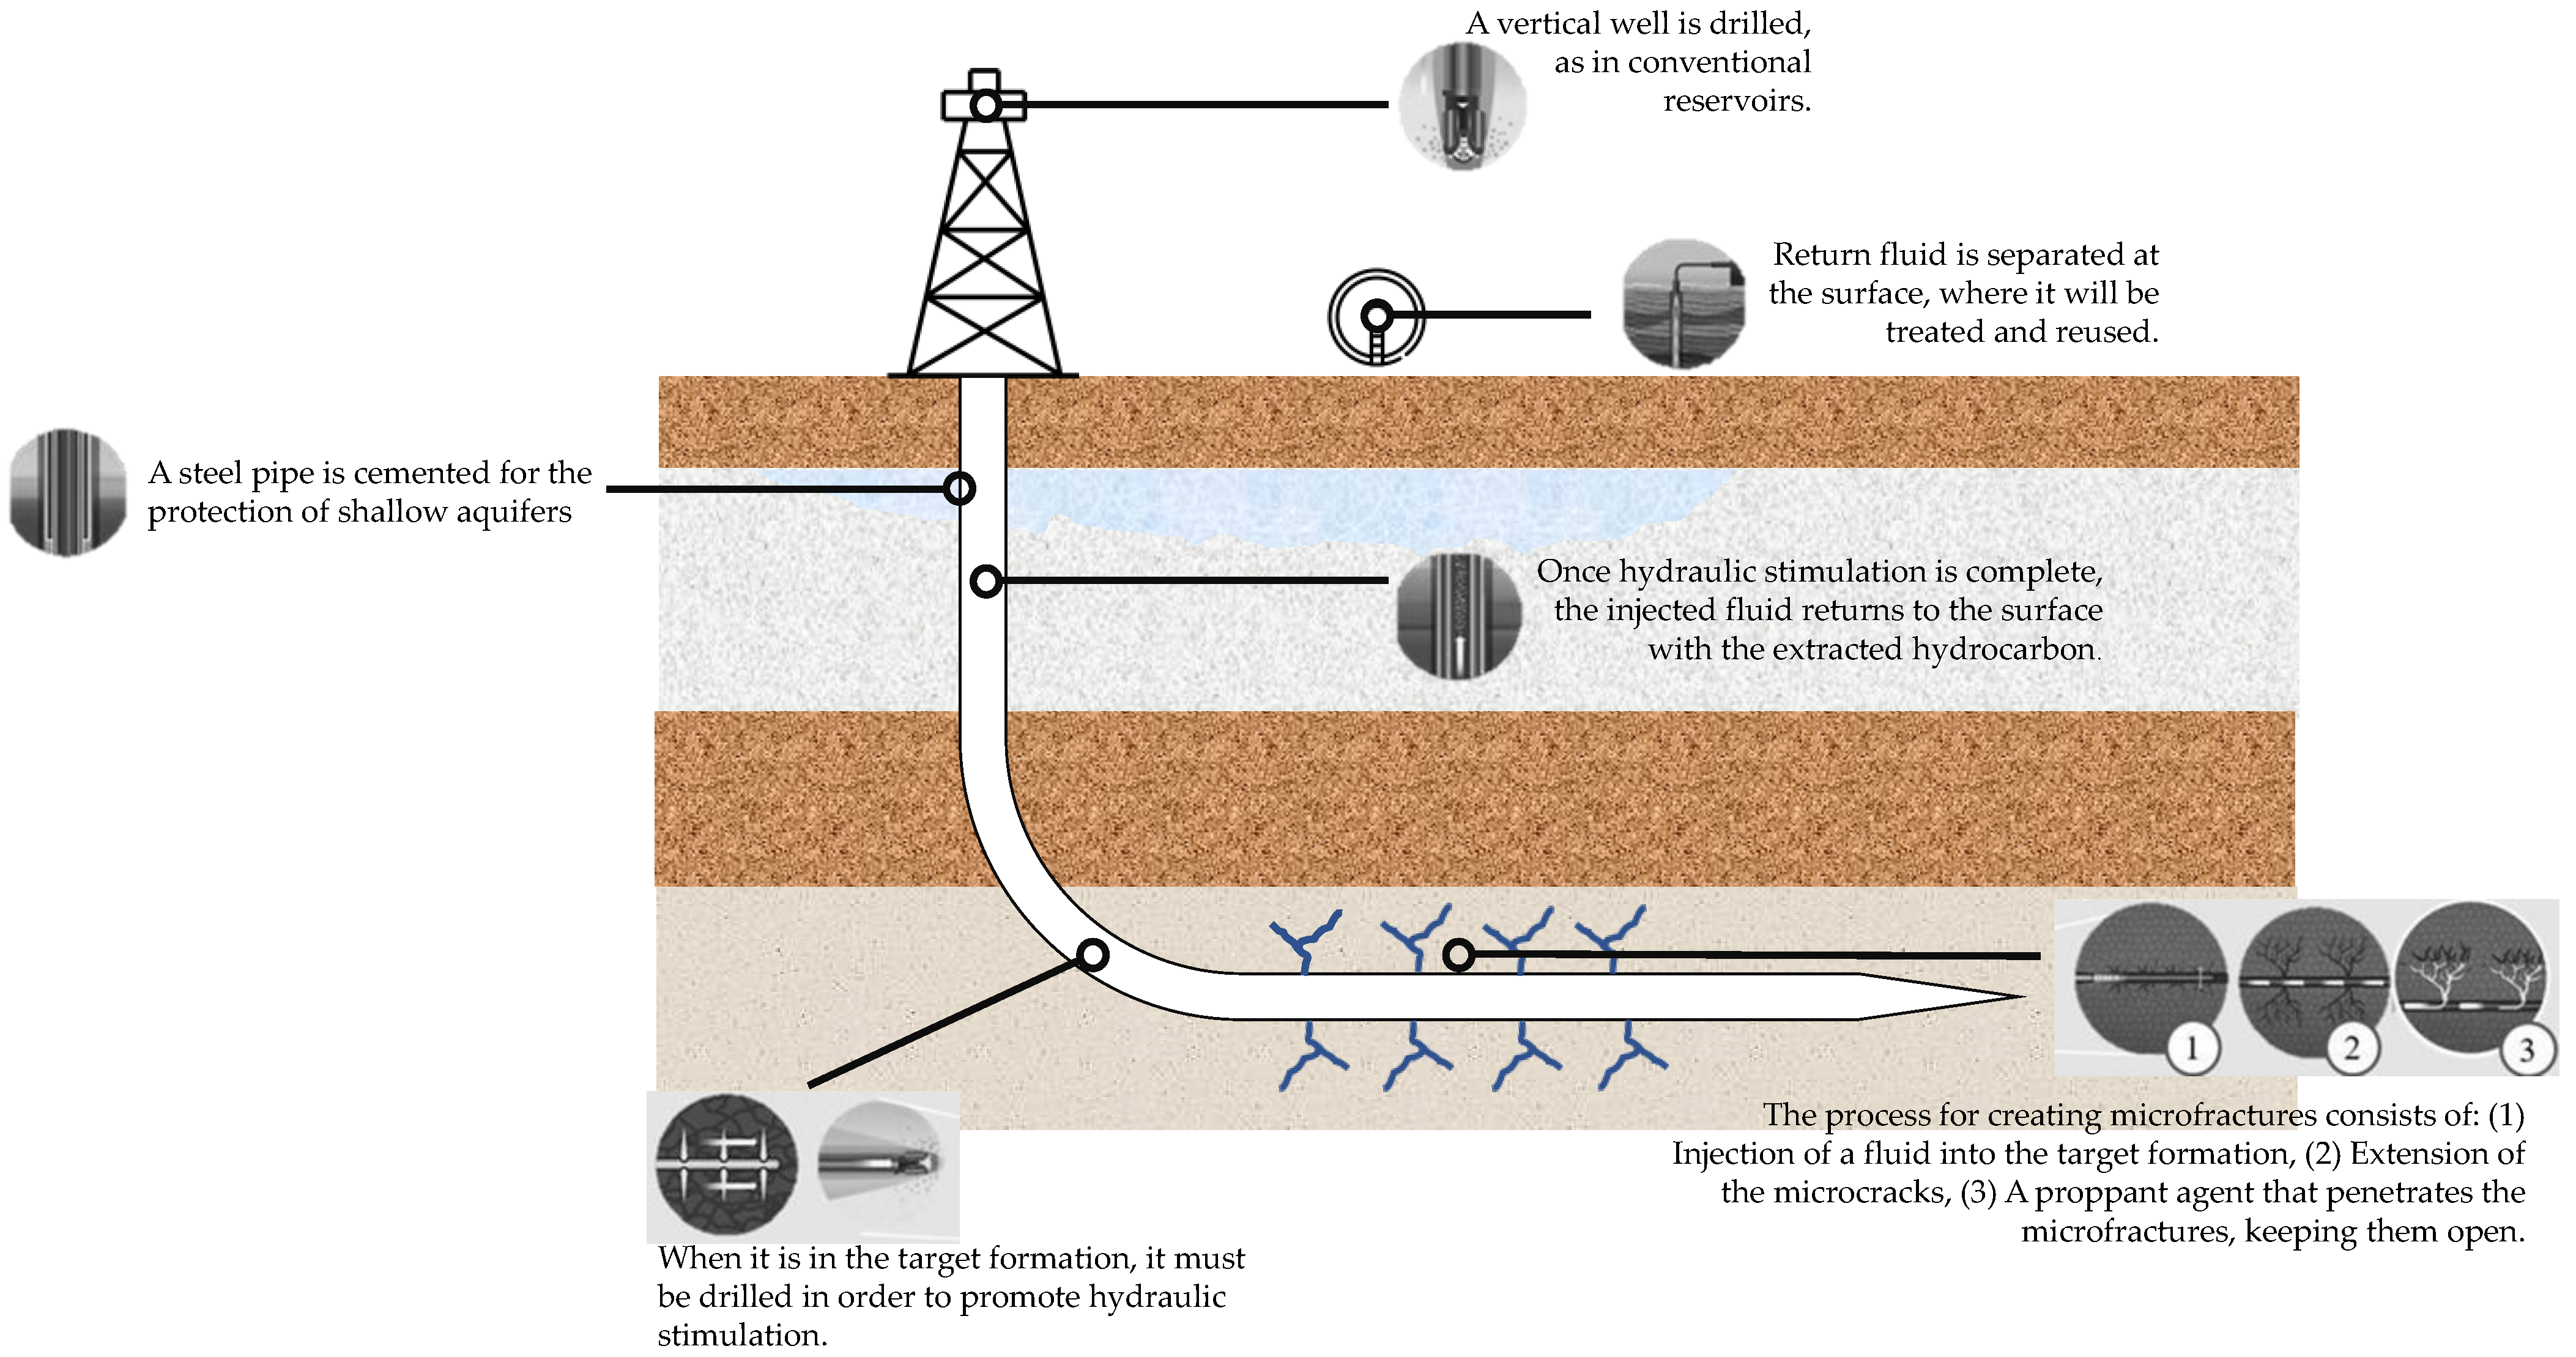
43]. These unconventional reservoirs have the uniqueness in that two of their basic petrophysical properties, permeability and porosity, are significantly low. Thus, vertical drilling does not provide economically viable production rates. For this reason, it is necessary to drill horizontally, applying hydraulic stimulation techniques, which allow for the optimal drainage areas to be obtained and to generate fractures that allow the hydrocarbons to flow to the canyon beds. Figure 2 shows the most important points regarding this technique [44,45,46,47,48].
Each petroleum reservoir has its specificities regarding mineralogical composition, permeability, porosity, temperature, and pressures. Therefore, different types of fracturing fluids have been developed so that they can be used appropriately for each type of reservoir. Effective hydraulic fracturing stimulation design involves selecting the appropriate fluid and proppant for the operation. The amount of fluid and proppant used, as well as the pressure and injection rate, are closely related to the fracture dimensions and, consequently, to its productivity [48,50].
The fracturing fluid must be viscous enough to carry the support agents and to improve the circulation inside the well, avoiding the accommodation of the proppants generated by the gravitational forces [51,52,53].
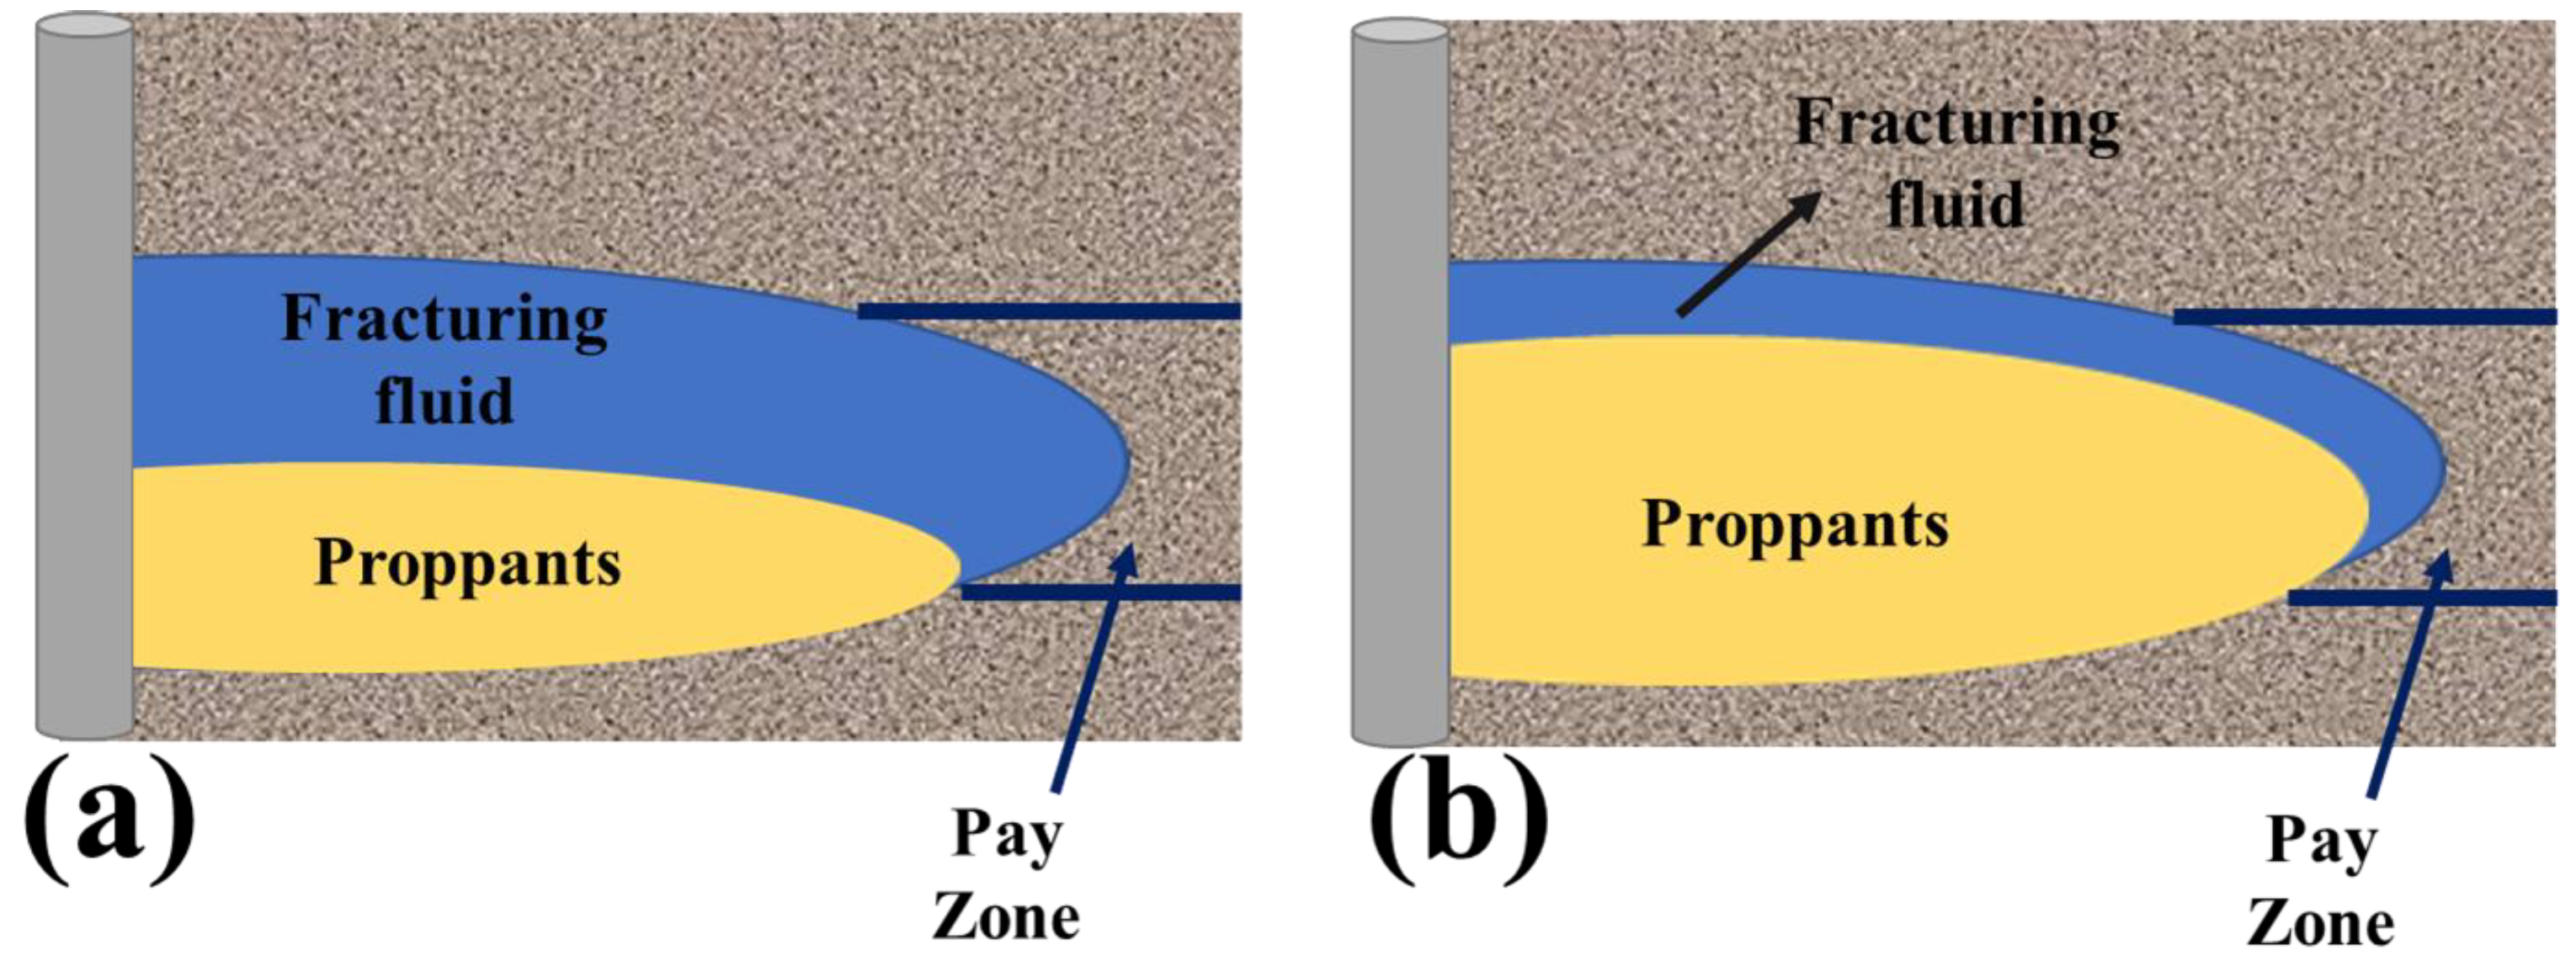
The viscosity of the fracturing fluid also influences the fracture geometry. If the fluid is too viscous, the vertical length of the fracture may exceed the vertical length of the producing layer, resulting in a lower-than-expected accommodation of the proppants. Figure 3 demonstrates the application of the fracking technique being performed with fluids of excessive (left) and moderate (right) viscosity [51,52,53,54,55,56].
In parallel, the pumping rate of the fluid is of great importance. This variable is dependent on the density and the friction involved in the flow. In addition, it is important to consider the infiltration of the fluid into the formation, the compatibility with the formation, and its displacement, among others [57,58].
A sequence of materials must be added to a fracturing fluid for it to meet the requirements and have a composition that makes the use of the technology possible [55,59]. Table 1 shows the different types of additives and their respective role in hydraulic fracturing.
The infiltration of fracturing fluid into the target layer (leak-off) is an important aspect of planning a hydraulic fracturing project. Therefore, the larger the fracture, the larger the leak-off will be. Cross-linkers are of utmost importance to reduce this leak-off. In the process of modifying the polymeric structure, which constitutes the gelling agents, the cross-linkers help in the formation of the filter cake, a layer of residues deposited on the fracture wall, minimizing the subsequent leak-off of the fracturing fluid. As filter cake formation is a severe process, initially, the fracture wall is more exposed to seepage, and an additional amount of fracturing fluid enters the rock, called spurt loss [61,62].
Oil- or water-based fracturing fluids are most frequently employed in fracking. Since the oil sector uses water-based fluids the most, they are more suitable. Water-based fluids are more widely accessible and less expensive because of this. Due to its relatively high density and minimal risk of combustion and pollution, this type of fluid also benefits from low pumping pressure requirements and favorable gelling agent reactivity. Its relatively high density is a drawback as it makes well cleaning more challenging [61,62,63,64,65].
On the other hand, oil-based fluids have the advantage of having high viscosity, which helps in the conduction of propellants, and low density, which facilitates the well cleaning (well cleaning in unconventional reservoirs refers to the operations performed to maintain the productivity and efficiency of an unconventional hydrocarbon well, such as shale oil or shale gas. These wells often require periodic maintenance and cleanup due to the unique characteristics of unconventional reservoir production [64,65,66,67]) process. However, its use involves risks related to combustion and pollution; it demands a higher pumping rate and has a high cost when compared to water-based fluids [66,67,68].
On the other hand, the proppant material is the solid particles that enable the propagation of fractures, generating a path of greater permeability and conductivity for the fluid. Its choice must be carefully performed so that it resists the closure of the fracture and ensures the flow of the reservoir [68,69,70,71].
To select the ideal proppant, it is necessary to analyze the density, the crushing resistance, the size and distribution of grains along the crack, the ease with which the granular material is transported, the roundness, and particle sphericity. The support agent must have dimensions and specific mass that allow it to be transported through the fracturing fluid and be minimally degradable over time. This section discusses the properties of the different types of proppants applied [68,69,70,71,72,73,74,75,76]. Table 2 shows the densities and crushing strengths (compressive strength of the particles or grains of the rock formation being fractured) of the proppants usually used in fracking.
Pure sand is widely used due to its wide availability, which reduces the costs of the operation. However, this resource has limited application since it provides good conductivity and permeability only when subjected to a crushing strength of less than 6000 psi. In this case, the sand can be treated with resin (RCS—resin-coated sand), aiming to provide the sand with a higher crushing strength [76,77,78,79,80,81].
Ceramic proppants have higher crush resistance. They have aluminum in their composition (extracted from bauxite) as their main component, besides having silica and clay at low levels. They are classified into two main types, according to their bauxite content: ceramic proppants of intermediate strength ceramic proppants (ISP); and high strength bauxite (HSB) [81,82,83]. The intermediate-strength ceramic proppants are derived from bauxite synthesized with a high mullite content. The high-strength ceramic proppants, on the other hand, are derived from synthesized bauxite rich in aluminum oxide. In addition, the IDC is an intermediate-density ceramic proppant known as bauxites [83,84,85].

3. Methods

To assess the impacts of unconventional hydrocarbon production in the Middle Magdalena Valley (VMM) basin, this study proposes and applies different indicators, which are described in this section. Then, it applies a multicriteria analysis to derive an aggregated impact result. Subsequently, measures are proposed to mitigate these environmental impacts.
The main method is based on the Conesa Methodology [83]. This methodology was applied by several environmental studies and development projects to assess the potential impacts of human activities on the environment [86,87]. The appropriateness of this methodology depends on several factors, and its use may vary according to the context and the specific objectives of the assessment.
Moreover, 
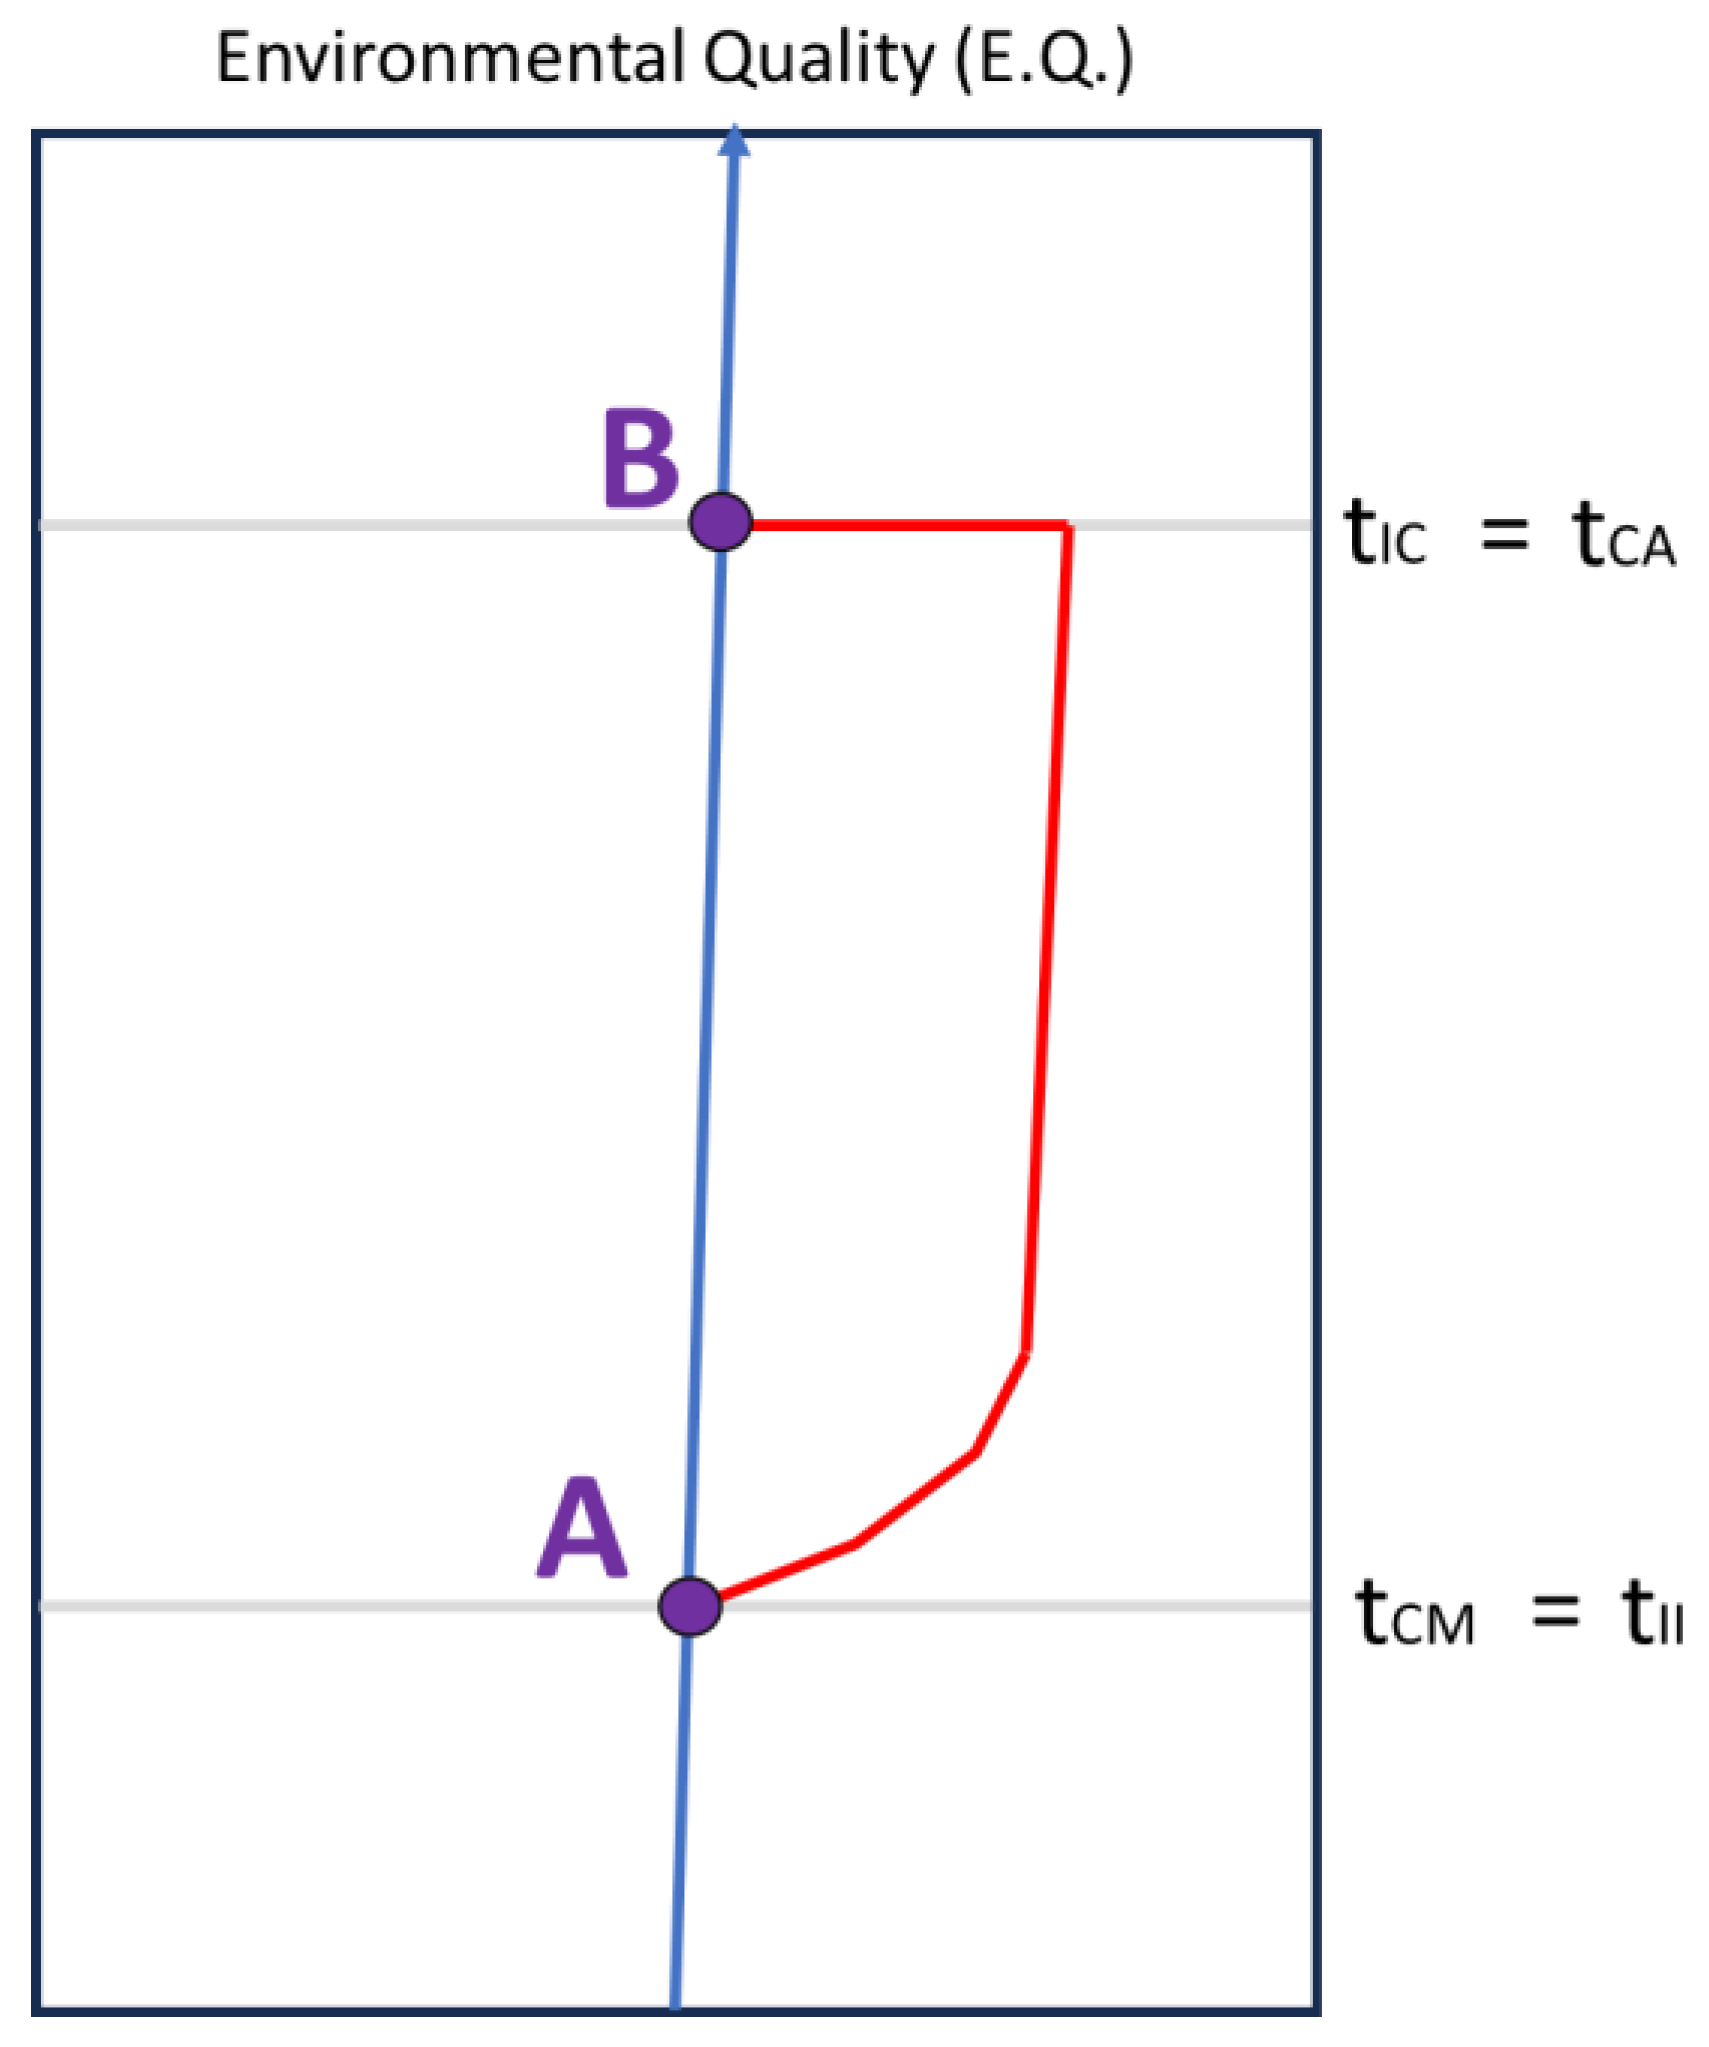
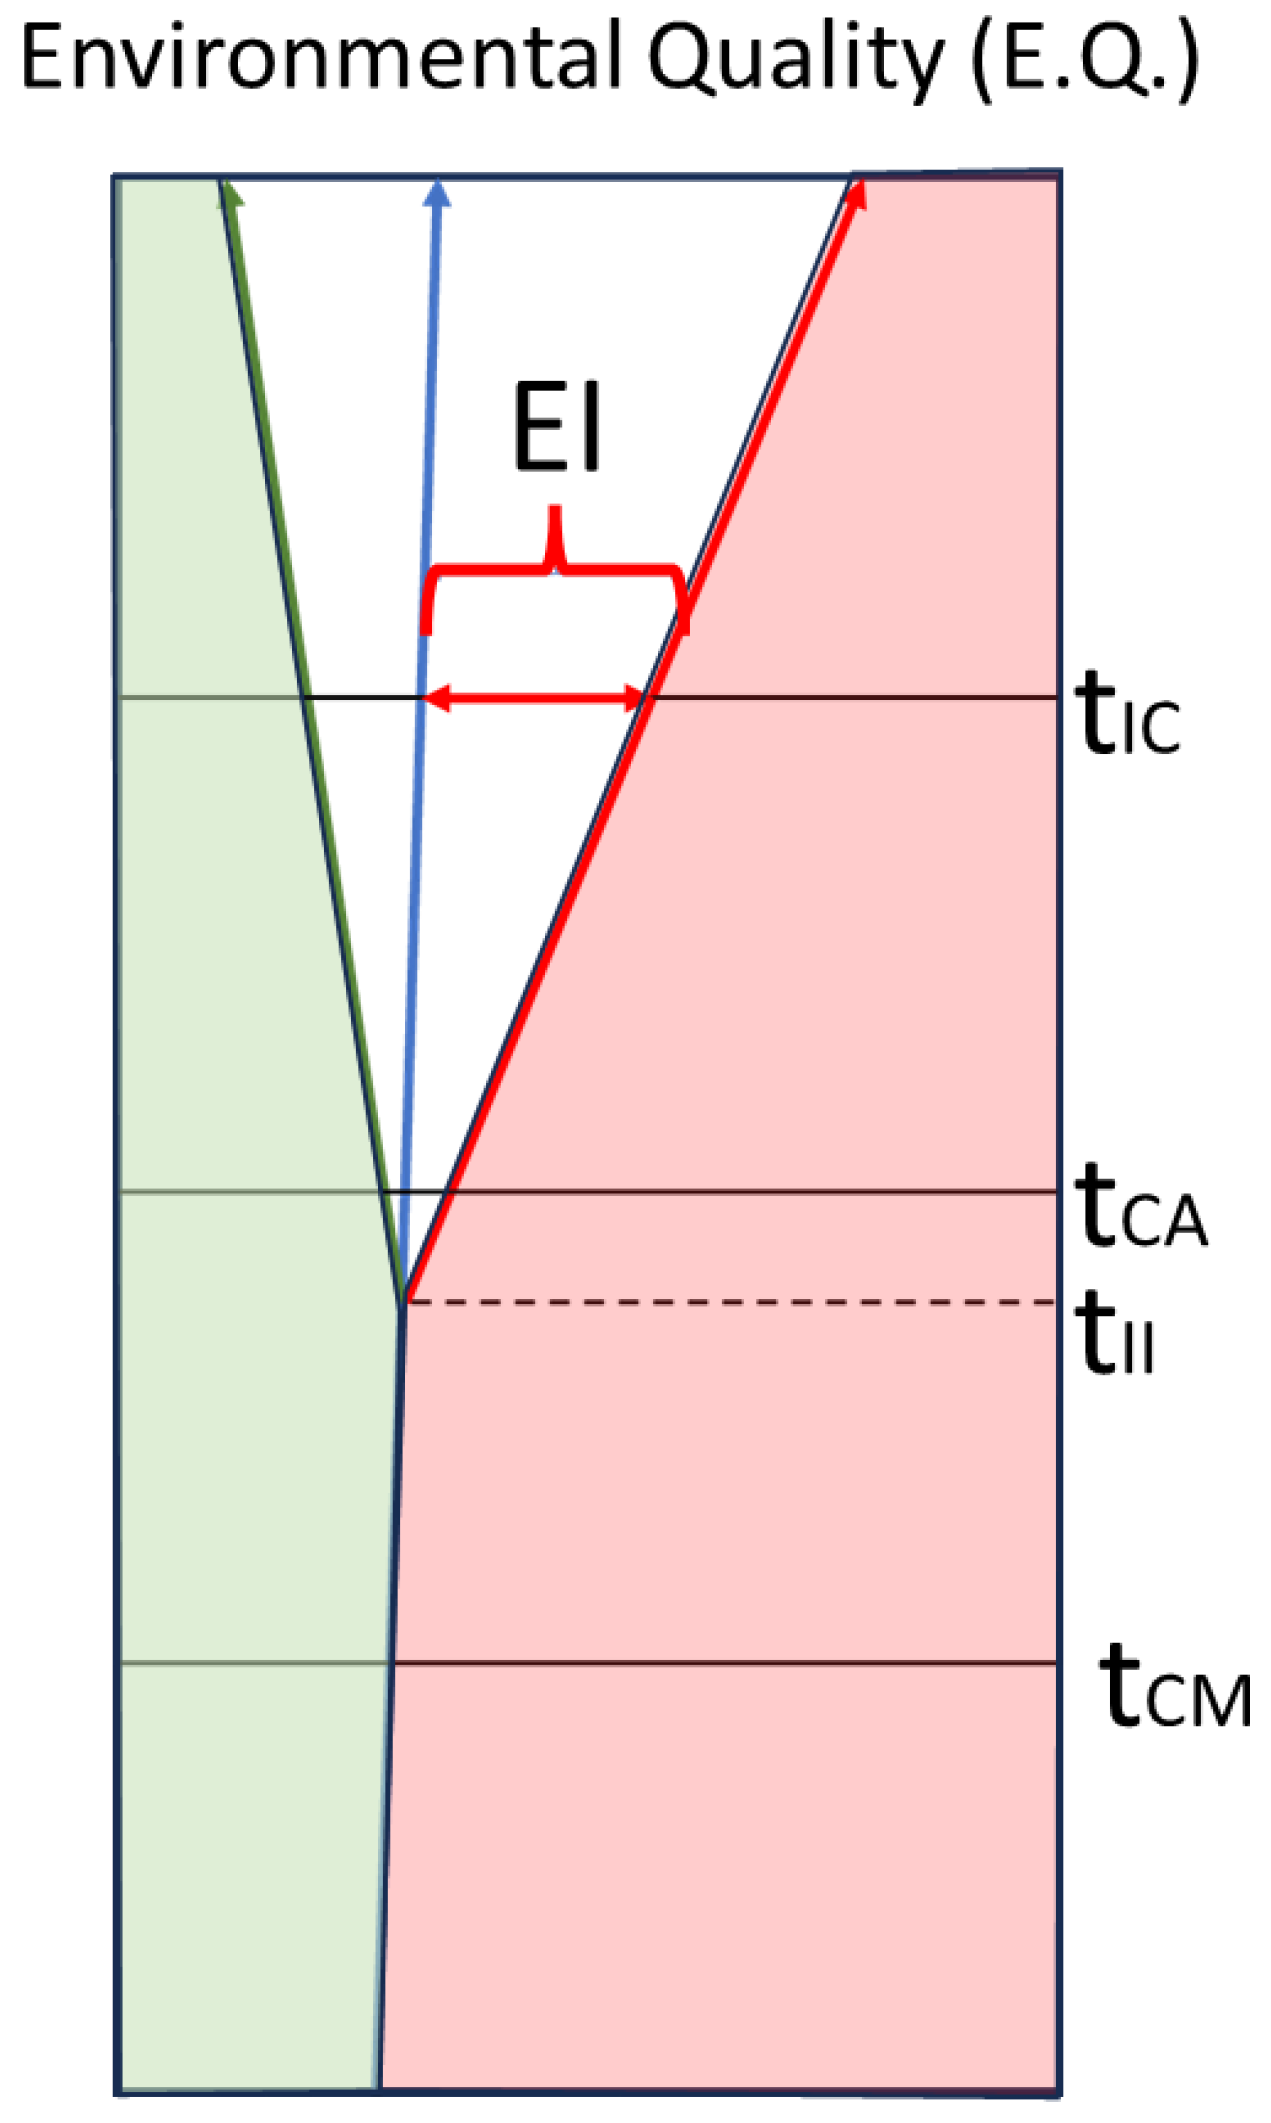
Figure 4 provides a detailed visual representation of the environmental impact associated with a specific action. In the graphical representation, colors have been assigned to clearly distinguish between beneficial impacts, highlighted in green, and adverse effects, marked in red. What is remarkable about this representation is the inclusion of a timeline that allows for observing the evolution of the negative environmental impact from the time of the completion of the action to the defined period of interest. This temporal approach provides a dynamic perspective, facilitating the identification of trends and changes in the magnitude of the negative environmental impact over time. In addition, quantifying the magnitude of adverse impacts provides valuable data for a more accurate and detailed assessment of the long-term effects of the action under consideration on the environment.
It should be noted that tIC represents a time of Interest considered; in turn, tCA represents the time of completion of the action; TII is a time of Impact Initiation, and tCM corresponds to the time of Current Moment.
Moreover, 
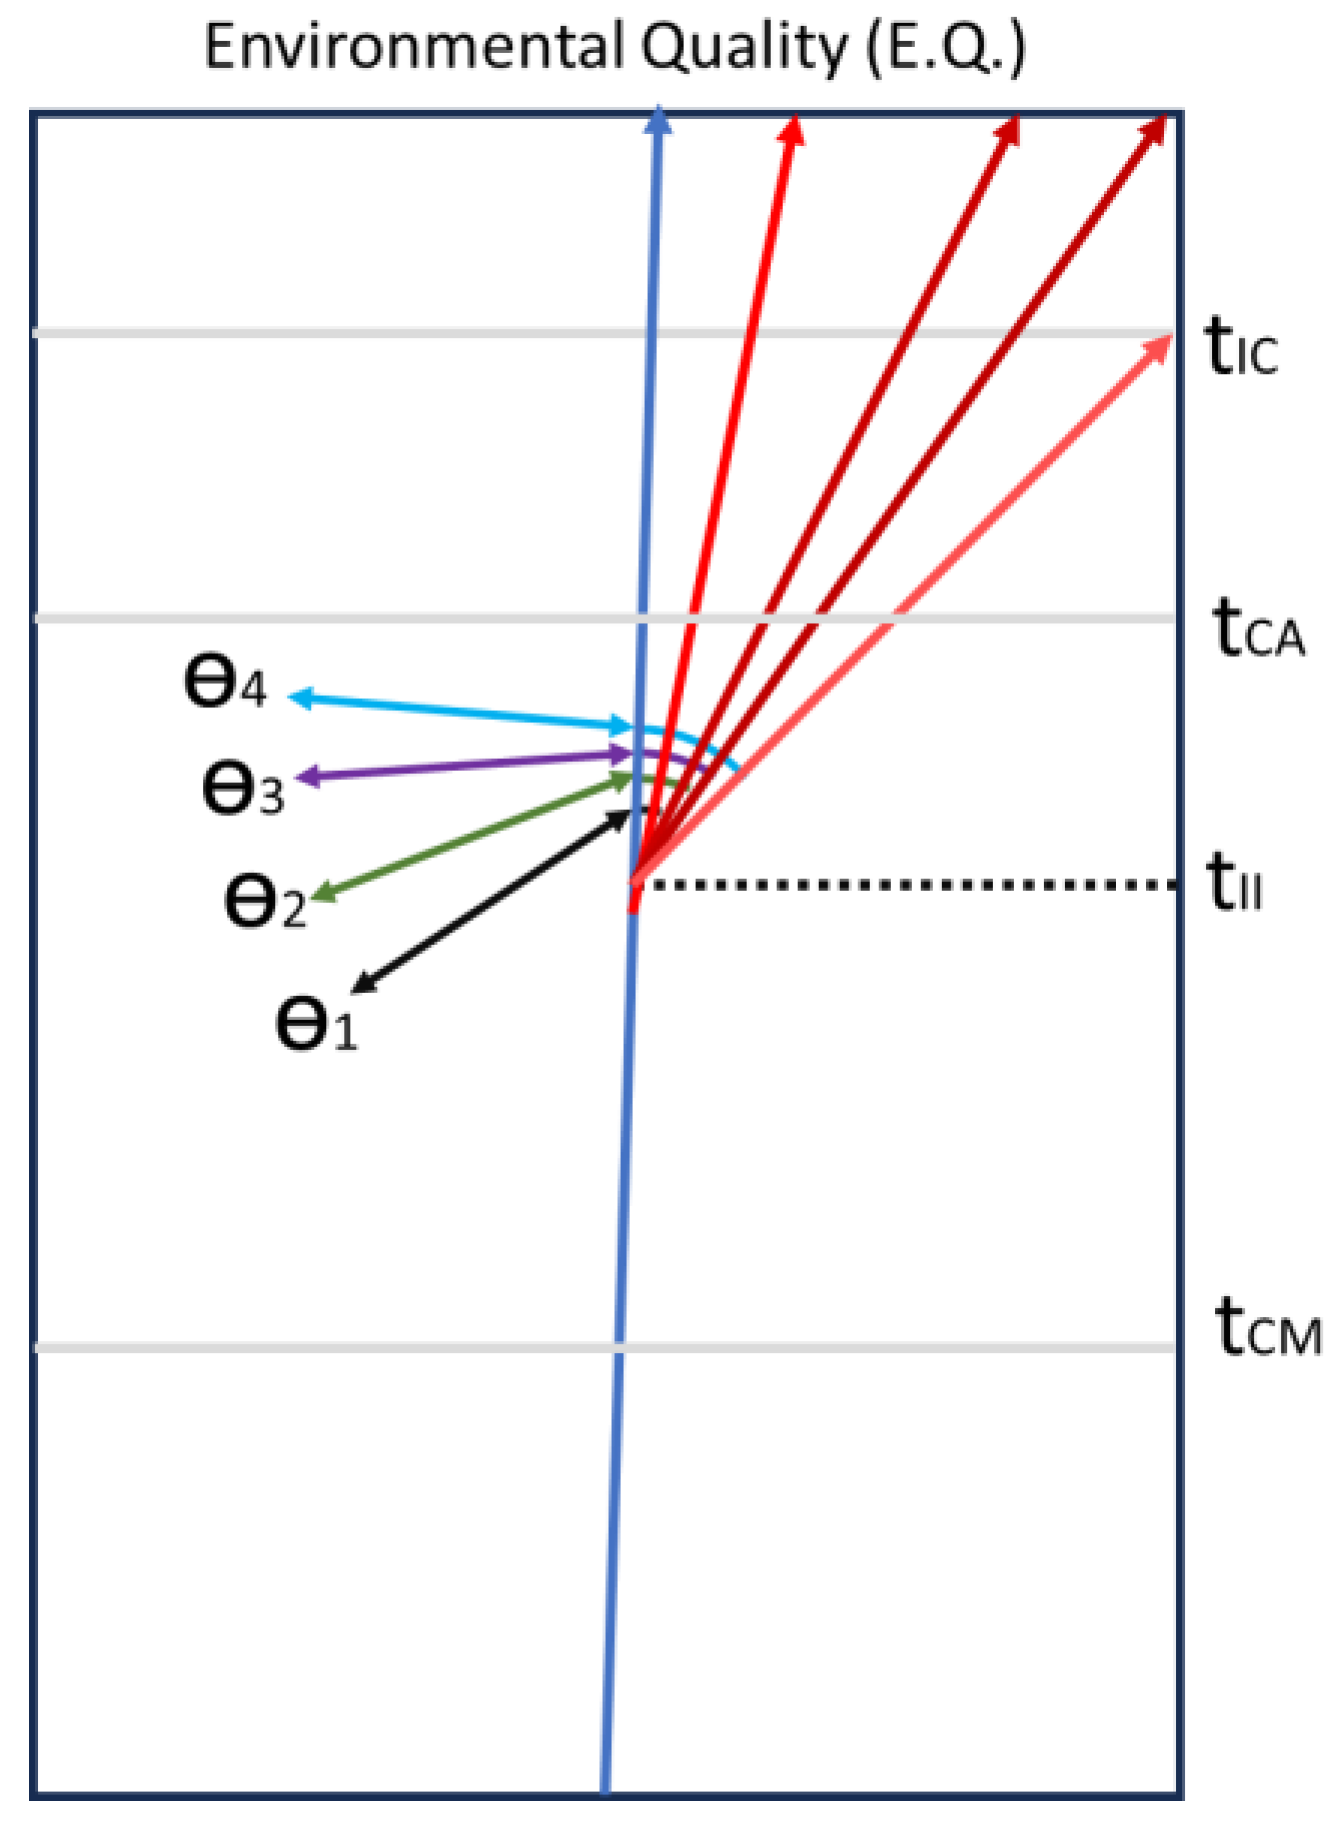
Figure 5 shows the negative environmental impact derived from a specific action, using a distinctive red color. Four lines stand out, representing the degree of incidence of the environmental impact, with the angle formed between these lines and the line representing the evolution of the environment or of a “no action” factor being preponderant. The novelty of this approach lies in the fact that the angle formed provides a visual measure of the severity of the environmental damage, establishing a direct relationship between the extent of the angle and the magnitude of the adverse impact. Thus, the greater the angle, the greater the degree to which the environment is affected, allowing for an intuitive interpretation of the severity of the negative environmental impact of the action under consideration. In this way, a direct relationship can be given between the magnitude of the angle and its incidence in terms of impact; thus, angle 4 will be categorized as total impact, angles 3 and 2 as medium and notable, respectively, and finally, 1 as minimal impact.
On the other hand, Figure 6 highlights, in an illuminating way, the temporality of the impact of an environmental disturbance. In the graphic representation, two key categories can be distinguished, identified as (A) immediate and (B) medium-term, clearly indicating the moment at which the harmful effects are manifested in the environment. The ability to categorize the impact as immediate or medium-term based on the harmful disturbance to the environment is crucial for the subsequent assessment and classification of the risk associated with the impact. This temporal approach provides a more detailed understanding of the temporal dynamics of adverse environmental effects, serving as a valuable tool for informed decision-making in the management and mitigation of environmental impacts.
In addition, 
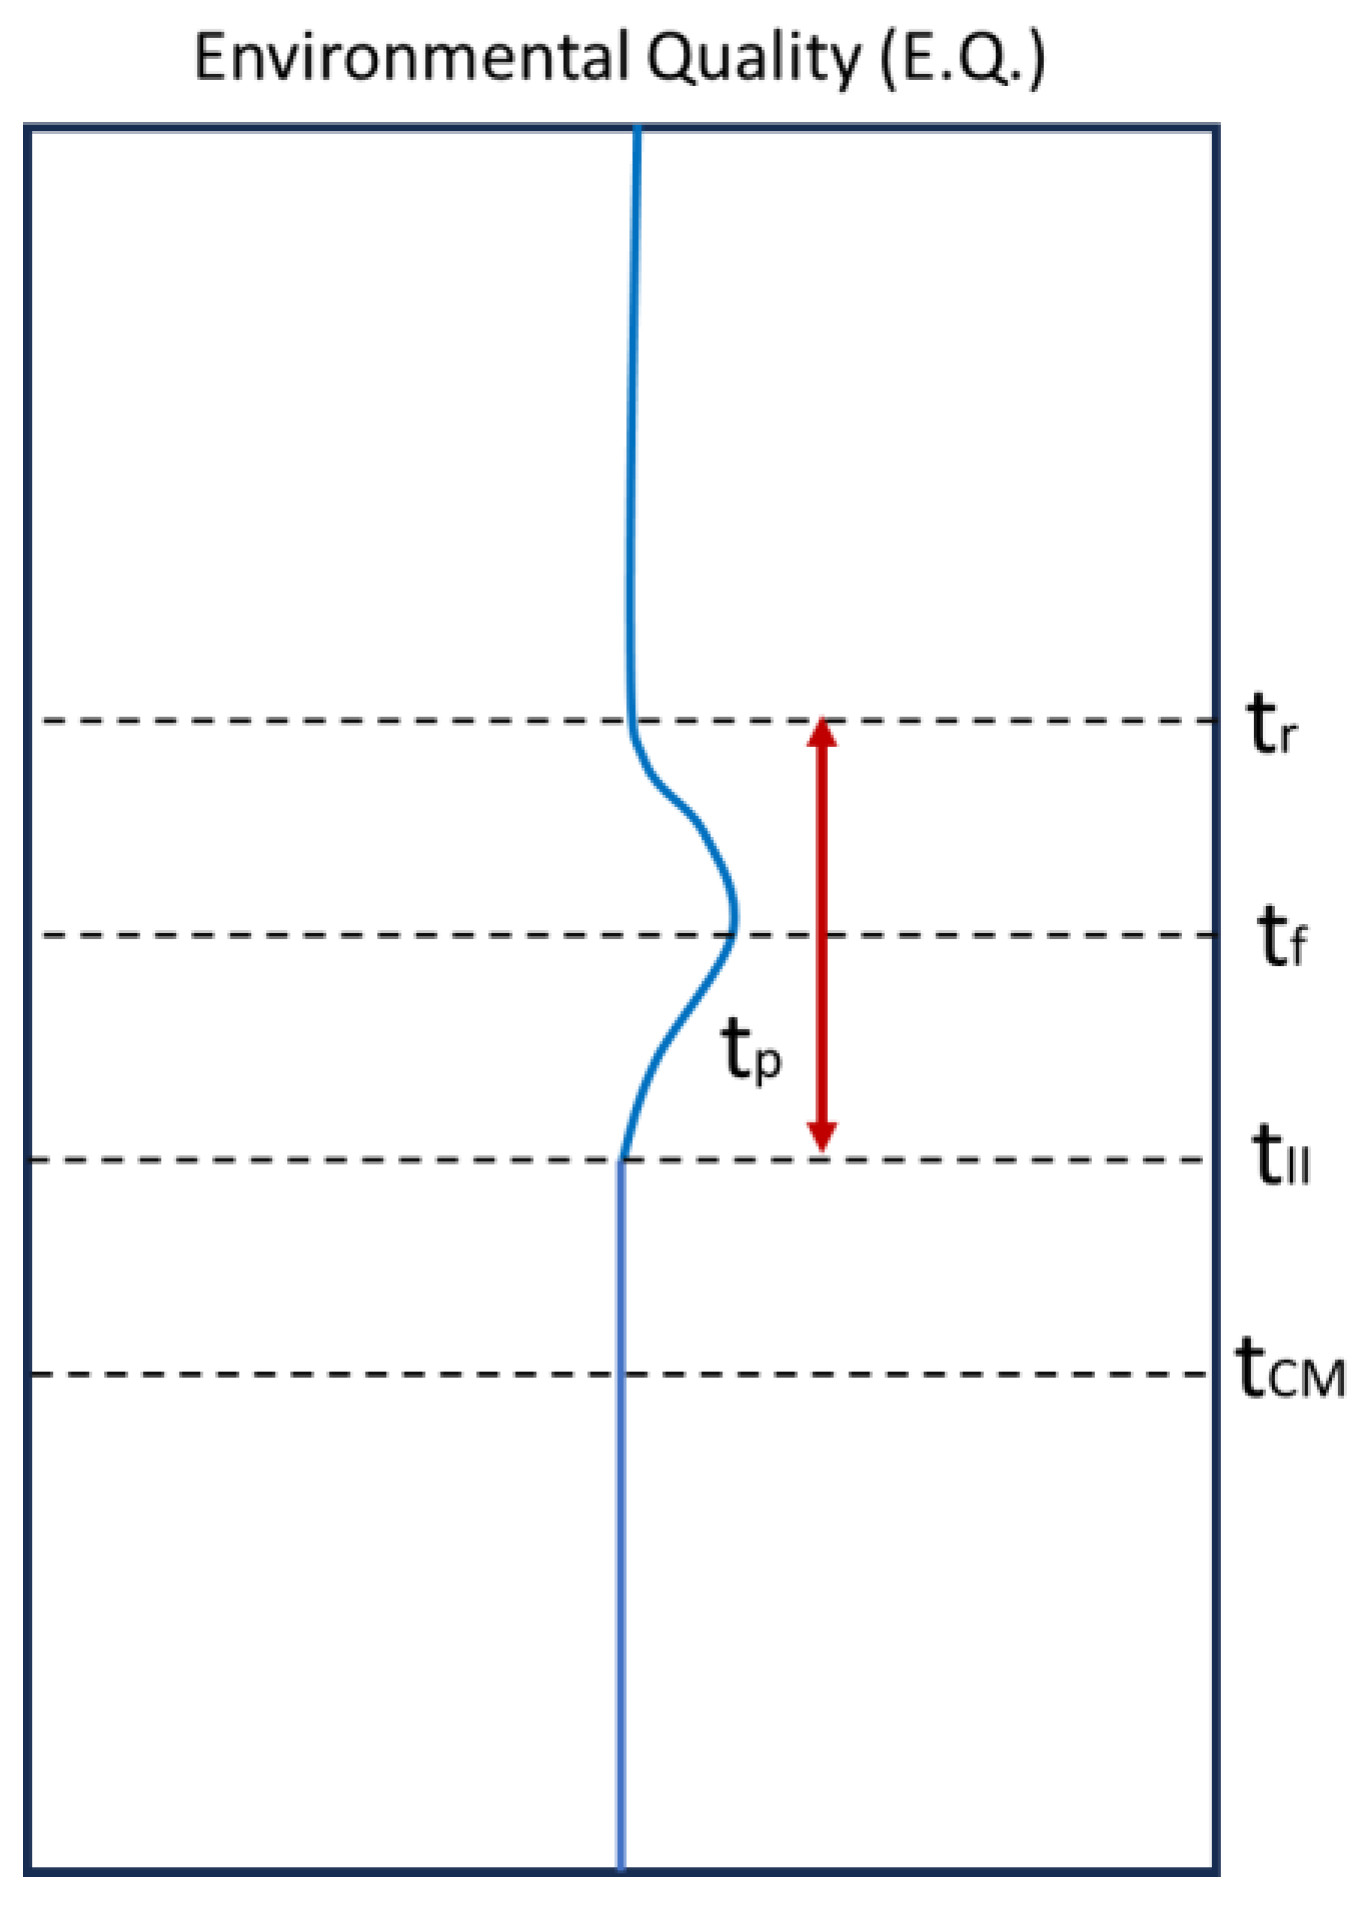
Figure 7 highlights the duration of an environmental impact and the time required to carry out its quantification and, subsequently, the corresponding remediation. In this graphic representation, the timeline of the impact is clearly observed, indicating the beginning and the end of its manifestation. At the same time, an additional period is identified that covers the time for impact quantification, marking the moment when the detailed evaluation process begins. On the other hand, what is very significant about this figure is the explicit connection between the duration of the impact and the time required for its quantification and remediation. This visual approach allows one to appreciate how mitigation and remediation of an environmental impact are intrinsically linked to a precise understanding of its temporal duration. The figure, therefore, provides a valuable tool for planning effective and timely interventions, facilitating conscious and sustainable environmental management in response to impacts arising from specific actions.
The assessment of the parameters that make up the environmental impacts is carried out by means of a scale that reflects the importance and seriousness of each qualitative aspect. In this context, the qualitative weight of the intensity of the environmental impact is considerably greater than that of the effect. For example, intensity represents the degree of destruction in a given area, providing a more direct measure of the magnitude of the impact. In contrast, the effect relates to the cause of the impact, whether it is the result of the action being studied or a previous action. Given this qualitative difference, intensity is evaluated on a scale of up to 12 units, considering their midpoints, while effect is quantified in a range of up to 4 units. This hierarchical weighting allows for a more precise and detailed evaluation of environmental impacts, focusing on the dimension of greatest qualitative relevance in the evaluation process.

3.1. Intensity (IN)

This indicator assesses the extent to which an activity or action affects a specific factor in a particular area, such as soil, air, or water. The rating scale ranges from 1 to 12, with 12 indicating complete destruction of the factor in the area where the effect occurs and 1 representing minimal impact. Values falling between these two extremes indicate varying degrees of impact.
The intensity rating scale used in this context ranges from 1 to 12, providing an accurate and detailed tool for assessing the magnitude of the environmental impact. In this scale, the upper end, marked as 12, denotes the total destruction of the factor under study, which translates into an environmental impact of maximum intensity, classified as “Total”. In contrast, the minimum value of 1 represents a minimal and insignificant impact, characterized by a low and minimal intensity. Intermediate values on the scale, such as 8, indicate very high or noticeable intensity; 4 reflects high intensity, while 2 is associated with medium intensity. Figure 4 shows the graphic representation of the appearance of impact or manifestation at the moment any action is performed. This scaling approach provides a precise gradation that facilitates the assessment of the severity of the environmental impact, allowing for a detailed classification and a more complete understanding of the magnitude of the effects on the environment.
Table 3 displays the ratings for each level of intensity [83,84].

3.2. Extension (EX)

This indicator addresses the area of theoretical influence of the impact in relation to the environment of the project or activity [84].
  • Specific refers to the impacts generated in the area directly intervened by the project. The physical–biotic component corresponds to the area intervened directly during the construction, operation, and dismantling while, for the social element, it correlates to the properties where the said activities will be carried out;
  • Limited refers to those impacts that transcend the areas directly intervened by the project or activity without reaching the entire study area;
  • Extensive: when the impact covers the study area in its entirety and/or can transcend it until it reaches a larger order, municipal affectation, an account, or an ecosystem;
  • Total refers to the case in which the effect is punctual but occurs in a critical place.
The extent of the environmental impact is evaluated by the percentage of the affected area in relation to the total environment. In the case that the action that originates the impact is highly localized, affecting a minimal area in comparison with the total environment, it is classified as a punctual impact, designated with the value of 1. On the other hand, when the effect cannot be precisely localized within the project environment and has a generalized influence that covers the entire space, it is categorized as a total impact, assigning it the value of 8. Intermediate situations are also considered, which are graded according to the extent of the impact, being considered as partial impact (2) when they affect limited areas and as extensive impact (4) when the influence extends beyond the localized but does not reach the generalization of the total impact. This approach allows for a detailed and graded assessment of the extent of the environmental impact, providing a more complete understanding of the spatial distribution of the effects generated by the action in question.
Table 4 shows the criteria and the qualification range of the extension.

3.3. Moment (MO)

The “Manifestation or Moment” indicator represents the time gap between the initiation of an action and the commencement of its impact on the environment or the specific medium in question [85,88]. Likewise, the moment can be as follows:
  • Long-term: when the effect takes more than 5 years to manifest itself;
  • Medium-term: when the time elapsed between the effects caused by an action is between 1 and 5 years;
  • Immediate: when the elapsed time is zero and the time is less than one year;
  • Critical: results when the effect is immediate and occurs in the vicinity of populations or vulnerable elements;
  • Table 5 shows the criteria and the qualification range of the extension of moment.
The temporal relationship between the action and the manifestation of the impact plays a crucial role in the evaluation. When the time-lapse between the occurrence of the action and the onset of the effect is practically nil, reflecting an immediate manifestation, it is assigned a value of (4). On the other hand, if this time-lapse is less than one year, it is classified as a short-term manifestation, giving it a value of (3). If the period is between 1 and 10 years, it is considered a medium-term manifestation, represented by the value (2). In situations where the effect takes longer than 10 years to manifest itself, a value of (1) is assigned. This temporal approach to valuation allows for a detailed differentiation of impacts according to the speed with which they manifest themselves, providing a valuable tool for understanding and managing the temporal effects of environmental actions.
In the process of temporal quantification of environmental impacts, the fundamental concept of Time of Moment (tm) is introduced. This parameter is defined as the difference between the time of onset of the effect and the time at which the action occurs. In other words, the Time of Moment (tm) is calculated by subtracting the instant at which the action manifests (TCM) itself from the instant at which the effect starts (tii) (Equation (1)). This precise and specific approach makes it possible to accurately measure the time-lapse between the impact-generating action and the concrete manifestation of the environmental effect, providing a key tool for detailed temporal evaluation in the analysis of environmental impacts. Providing precise values for the quantification of the parameter.
tm = tII − tCM

3.4. Persistence (PE)

This indicator refers to the time that the alteration of the variable being assessed will theoretically remain from its appearance and from which its recovery process begins, with or without management measures.
Quantifying the permanence of an effect is essential for understanding the duration and magnitude of environmental impacts. In this context, a criterion has been established that assigns values according to the temporal duration of the effect. If the effect is ephemeral or fleeting, as in the case of noise pollution that lasts only for the duration of the sound emission, a value of (1) is assigned. In contrast, if the duration is in the range from 1 to 10 years, it is characterized as temporary or transitory, and a value of (2) is assigned. For effects that persist between 11 and 15 years, they are characterized as persistent or long-lasting and are assigned a value of (3). When the effect is permanent and irreversible, as in the case of the construction of roads or access roads to a project, the maximum value of (4) is assigned. This approach allows for an accurate assessment of the temporal persistence of environmental impacts, providing valuable information for decision-making and sustainable project management.
According to this criterion, the impact for its duration can be (Table 6) [83,89,90] as follows:
  • Fleeting: if the impact persists for less than one (1) year;
  • Temporary: if the impact persists for 1 to 10 years;
  • Permanent: if the impact persists for an indefinite period or for more than 10 years.

3.5. Reversibility (RV)

This indicator assigns the capacity of the environment to naturally assimilate a change or impact generated by one or several activities of the project under evaluation in such a way that it activates self-purification or self-recovery mechanisms without the implementation of management measures [83,91]. The criteria to define the reversibility of the socio-environmental environment are as follows (see Table 7):
  • Reversible in the Short-term: the natural recovery of the variable to its initial state, without management measures, can occur in less than 1 year;
  • Reversible in the Medium-term: the natural recovery of the variable to its initial state, without management measures, can occur between 1 and 10 years;
  • Irreversible: the natural recovery of the variable to its initial state without management measures is not possible.

3.6. Synergy (SY)

This indicator considers the amplification of two or more individual effects. The cumulative outcome of these effects, triggered by concurrent actions, surpasses what would be anticipated if the actions were to operate independently rather than concurrently. The emergence of new effects on the analyzed factor is integral to the modus operandi of synergism [83,92,93]. The synergistic nature of the resulting effects can be as follows (See Table 8):
  • Simple: when an action acting on a component does not present synergy with other actions on the same factor or component;
  • Synergistic: when an action acting on a component can present synergism with other actions on the same factor or component;
  • Very synergistic: when it is evident or highly likely that an action acting on a component presents synergy with other actions on the same factor or component.

3.7. Accumulation (AC)

This indicator accounts for the progressive increase in the manifestation of an alteration in the socio-environmental variable(s), considering a continuous and reiterated action. Accordingly, the impact can be single or cumulative (Table 9) [83,94].
  • Simple: it is the case in which the effect of the activity or impact does not produce cumulative effects;
  • Cumulative: it is the case in which, as the action generating an impact is prolonged over time, its severity progressively increases given the impossibility of the affected variable being able to recover in the same proportion as the action increases spatiotemporally.

3.8. Effect (EF)

This indicator refers to the cause–effect relationship or the manifestation of the effect on a socio-environmental variable because of activity (See Table 10) [83,95].
  • Indirect: occurs when the impact that is generated on a socio-environmental variable is a consequence of the interaction with another variable, in turn, affected by the activity that is being carried out;
  • Direct: occurs when the impact being evaluated is a consequence of the activity or action being carried out.
In the evaluation of environmental impacts, the distinction between direct and indirect effects plays an important role in assigning values. When an effect is direct or primary, i.e., it is produced immediately because of the action, it is assigned a value of (4). A clear example of this is the emission of carbon dioxide (CO2), which directly affects air quality in the environment.
On the other hand, indirect or secondary effects, which are more distant or mediate to the action, are assigned a value of (1). An illustrative case of an indirect effect could be the reduction in the index of native species in an area caused by the construction of surface oil installations. Although this impact does not arise immediately, its connection with the initial action is clear, justifying the assignment of a value that reflects its indirect character in relation to the main action. This differentiation in the assignment of values allows for a more precise and detailed evaluation of environmental impacts, considering their direct or indirect nature.

3.9. Frequency (FR)

This indicator deals with the consistency of the effect’s occurrence, whether it is cyclical, recurrent, unpredictable over time, or constant over time [83,96]. Consequently, the impacts, based on their periodic nature, can be as follows:
  • Irregular and discontinuous are those whose effect or impact due to an action or activity manifests itself through irregular alterations in its permanence (Discontinuous) or those whose effect or impact manifests itself unpredictably over time and whose alterations it is necessary to evaluate them based on the probability of occurrence (See Table 11);
  • Periodic: it is that effect or impact that, due to an action or activity, manifests itself with an intermittent mode of action and continues over time;
  • Continuous: is that effect or impact that, due to an action or activity, manifests itself through regular alterations in its permanence.
In assessing the permanence of environmental effects, specific values are assigned to reflect their temporal nature. Continuous effects are given a value of (4), indicating a constant presence over time. Those of a periodic nature, which manifest themselves at regular intervals, are given a value of (2). In the case of irregular effects, such as aperiodic and sporadic effects, an evaluation based on the probability of occurrence is introduced, assigning them a value of (1). However, when the relevance of the impact manifestation so requires, irregular effects may be rated with higher values, such as (2), (3), or even (4). The unpredictability of their occurrence can enhance the degree of manifestation of the effect, and this flexibility in assigning values allows for a more accurate assessment adapted to the temporal complexity of environmental impacts.

3.10. Recoverability (RE)

This indicator pertains to the potential for complete or partial restoration of the affected factor due to the project, construction, or activity. It specifically addresses the feasibility of returning to the initial conditions before the action, facilitated by the implementation of environmental management measures [83,97,98]. The criteria for defining recoverability are as follows (See Table 12):
  • Immediately recoverable: if the effects are recoverable through management measures, the affecting action immediately results;
  • Recoverable in the medium term: if the recovery can occur through management measures after the event occurred and in a period of no less than 1 year;
  • Mitigable: if the corrective actions used to mitigate the effects produced;
  • Irrecoverable: if the consequences produced by the activities cannot be recovered through environmental management measures.
Aggregated Importance (I)
The Conesa methodology, designed to evaluate environmental impacts, is based on the weighting and rating of specific variables in the evaluation equation. The weighting values and rating ranges associated with each variable are derived directly from the rating and percentage weighting assigned to that variable in the methodology framework. It is important to note that this methodology is based on adjustments of values from other widely used methodologies.
Then, in terms of the aggregated importance (I) and the rating system, this study aims at combining the rating criteria described above. Hence, this aggregated importance depends on the extent of the impact, its intensity, its persistence, the effect, etc. In our study, we propose that importance should be defined as the sum of all the indicators except the intensity, which should be multiplied by three (3), and the extension, which should be multiplied by two (2). This is because these two criteria are relevant in determining the significance of an impact. As the aim of this study is to stress environmental impacts, it highly weighs those indicators more related to them, considering that the first challenge is the intensity of an impact, then its extension [83].
In particular, the extent variable is characterized by having a multiplier factor of 2 since the severity weighting of this parameter represents up to 24% in the equation. On the other hand, the intensity variable has a multiplier factor of 3, as it triples the weighting percentages assigned to the rest of the variables studied. This strategic approach reflects the relative importance of each variable in the overall assessment of environmental impacts, thus allowing for a more accurate and realistic weighting of the environmental effects of a specific action (Table 13 shows the parameter weighting).
The numerical values assigned to the parameters (1–12), (1–8), and (1–4), in this case, represent the units of importance within the evaluation system. These values provide a quantitative scale that allows for weighting and ranking the relevance of each parameter in relation to others. The assignment of these numbers facilitates a more objective and structured evaluation, allowing for a clear comparison of the relative importance of different factors within the analysis framework.
The Conesa methodology equation for environmental impact assessment is based on key theoretical foundations of environmental impact assessment (EIA). First, it is based on the process of impact identification, where the possible adverse effects associated with a specific action are analyzed and recognized. Subsequently, it relies on the assessment and categorization of these impacts, evaluating their magnitude, importance, and nature.
The weighting of impacts constitutes another essential pillar of the methodology, assigning weighted values to each impact according to its relative relevance. The sum or aggregation of impacts is an integral process where a weighted combination of the identified impacts is made to obtain an overall assessment of the environmental impact.
The definition of ranges and categories provides a qualitative framework for classifying impacts, facilitating the interpretation of the results. In addition, Conesa’s methodology establishes correlations with other widely used methodologies, adapting and adjusting values based on previous experiences and accumulated knowledge in the field of environmental impact assessment.
The importance of the impact makes it possible to prioritize the impacts and, thus, determine the required environmental management actions. The formula used to determine the importance of the impacts is presented below (Equation (2)):
I M P O R T A N C E   ( I ) = 3 I N + 2 E X + M O + P E + R V + S Y + A C + E F + F R + R P
Table 14 summarizes the proposed indicators for the evaluation of the impacts. Within each qualification criterion, there is an assessment that oscillates between 1 and 12, where the values are assigned according to the quantitative characteristics determined for each of the impacts.
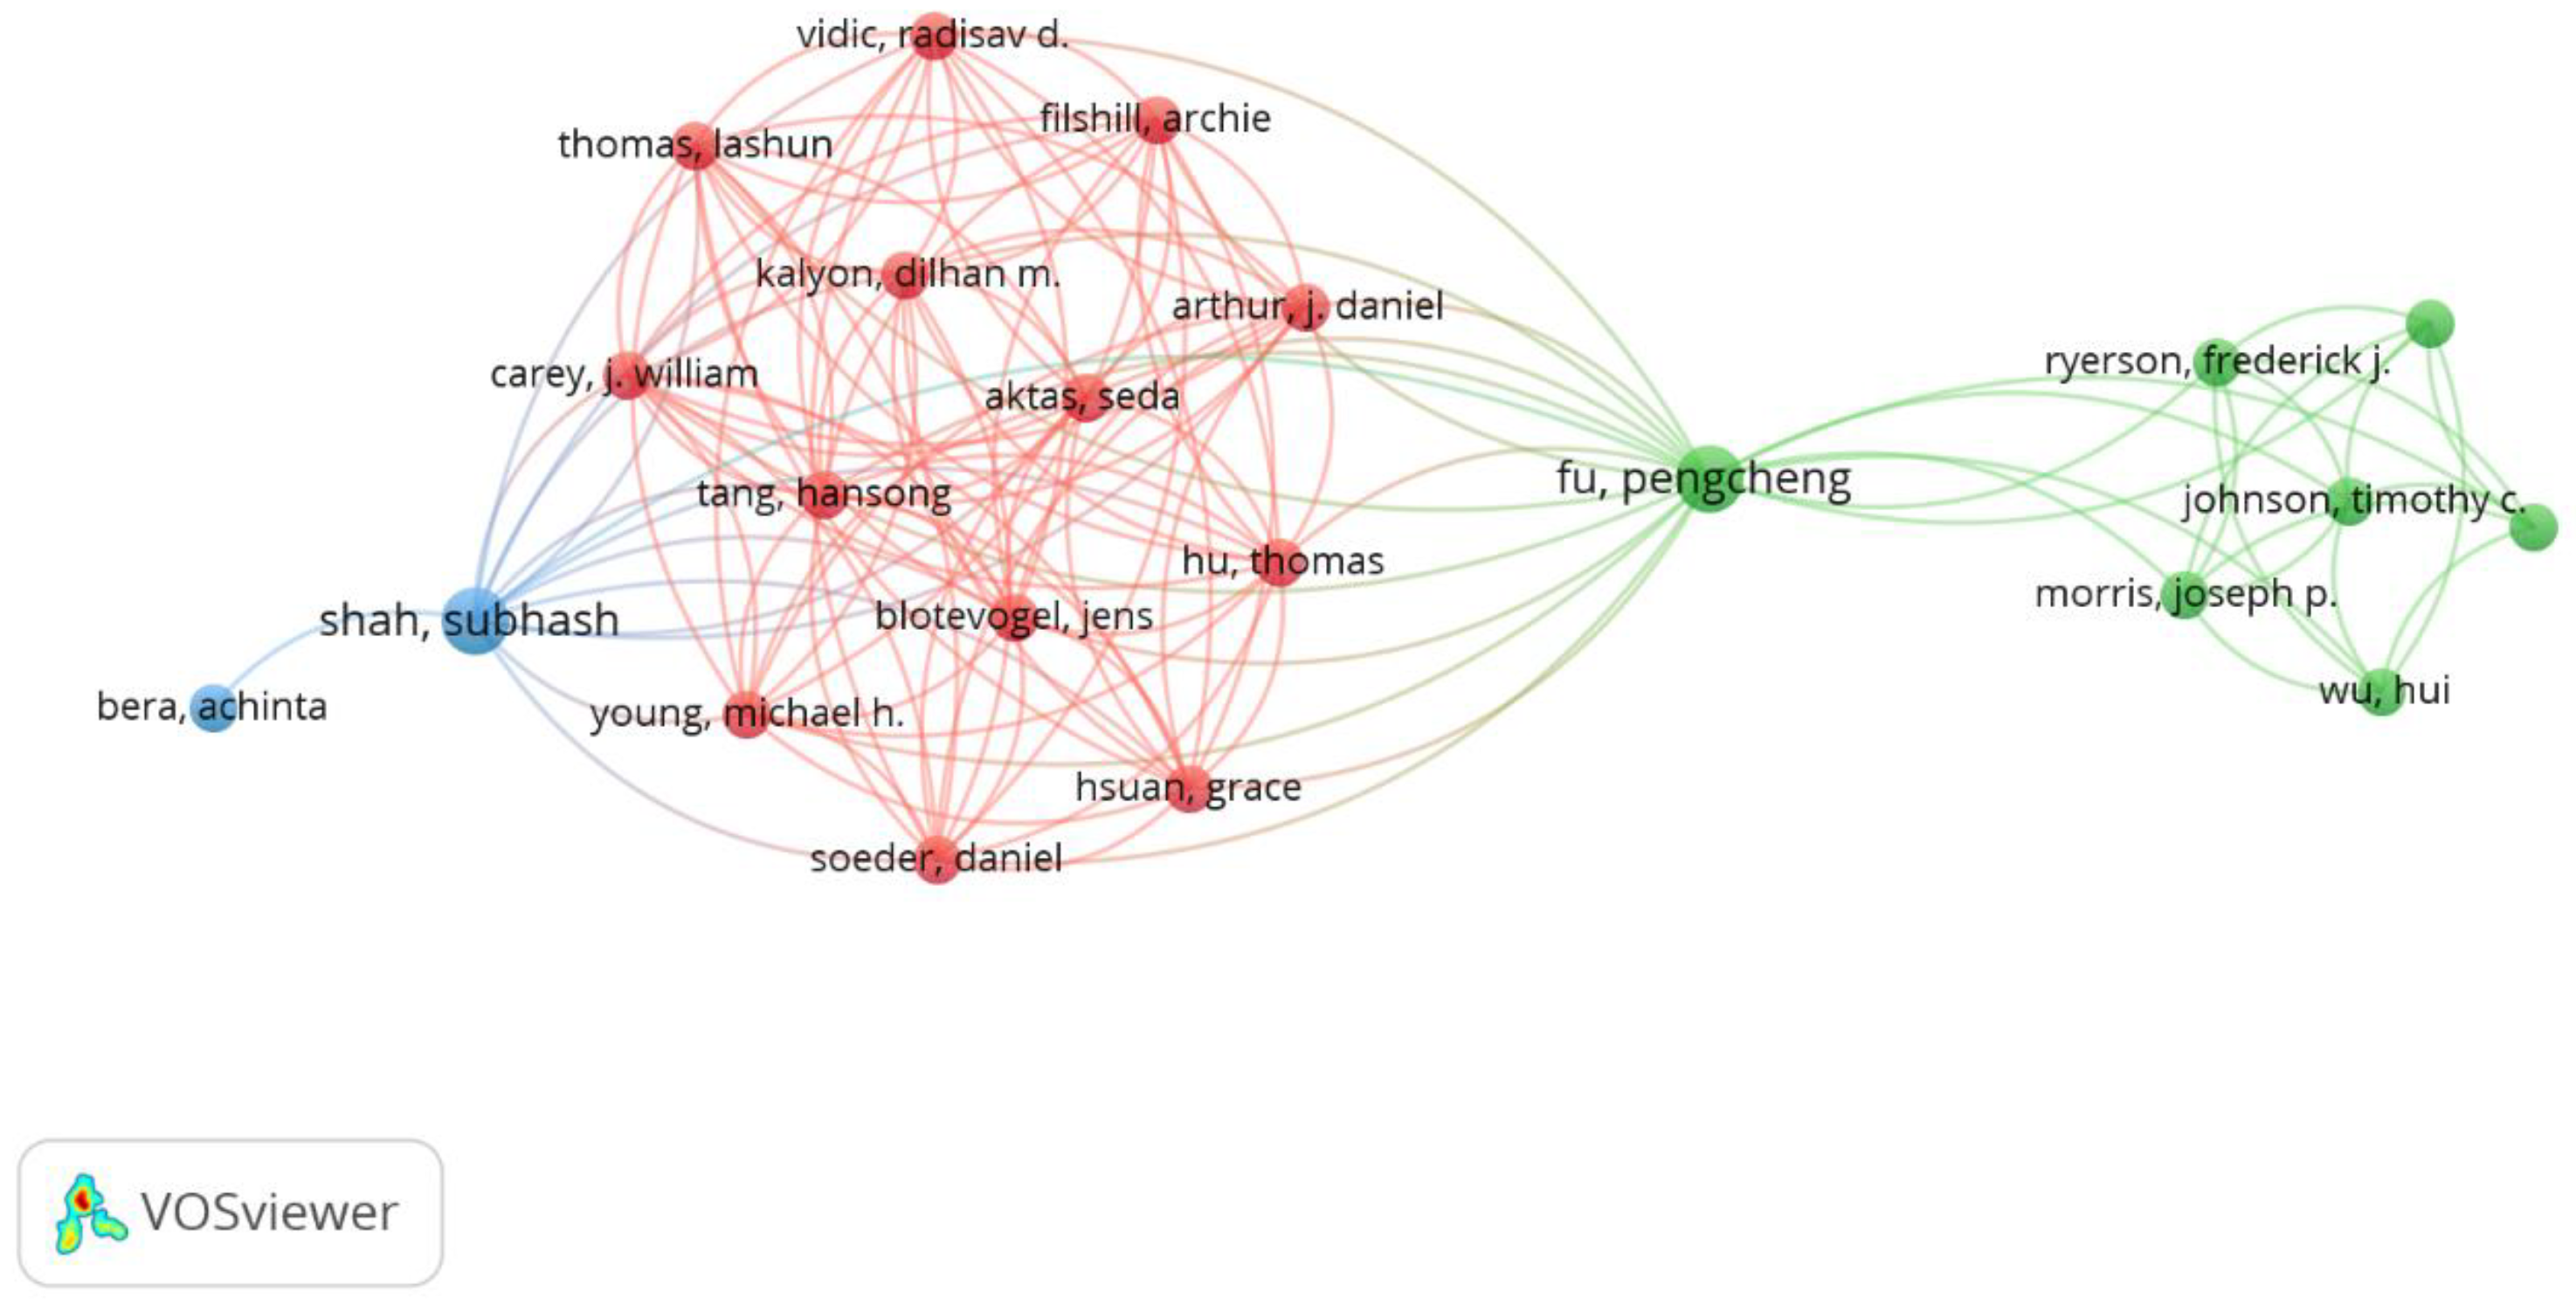
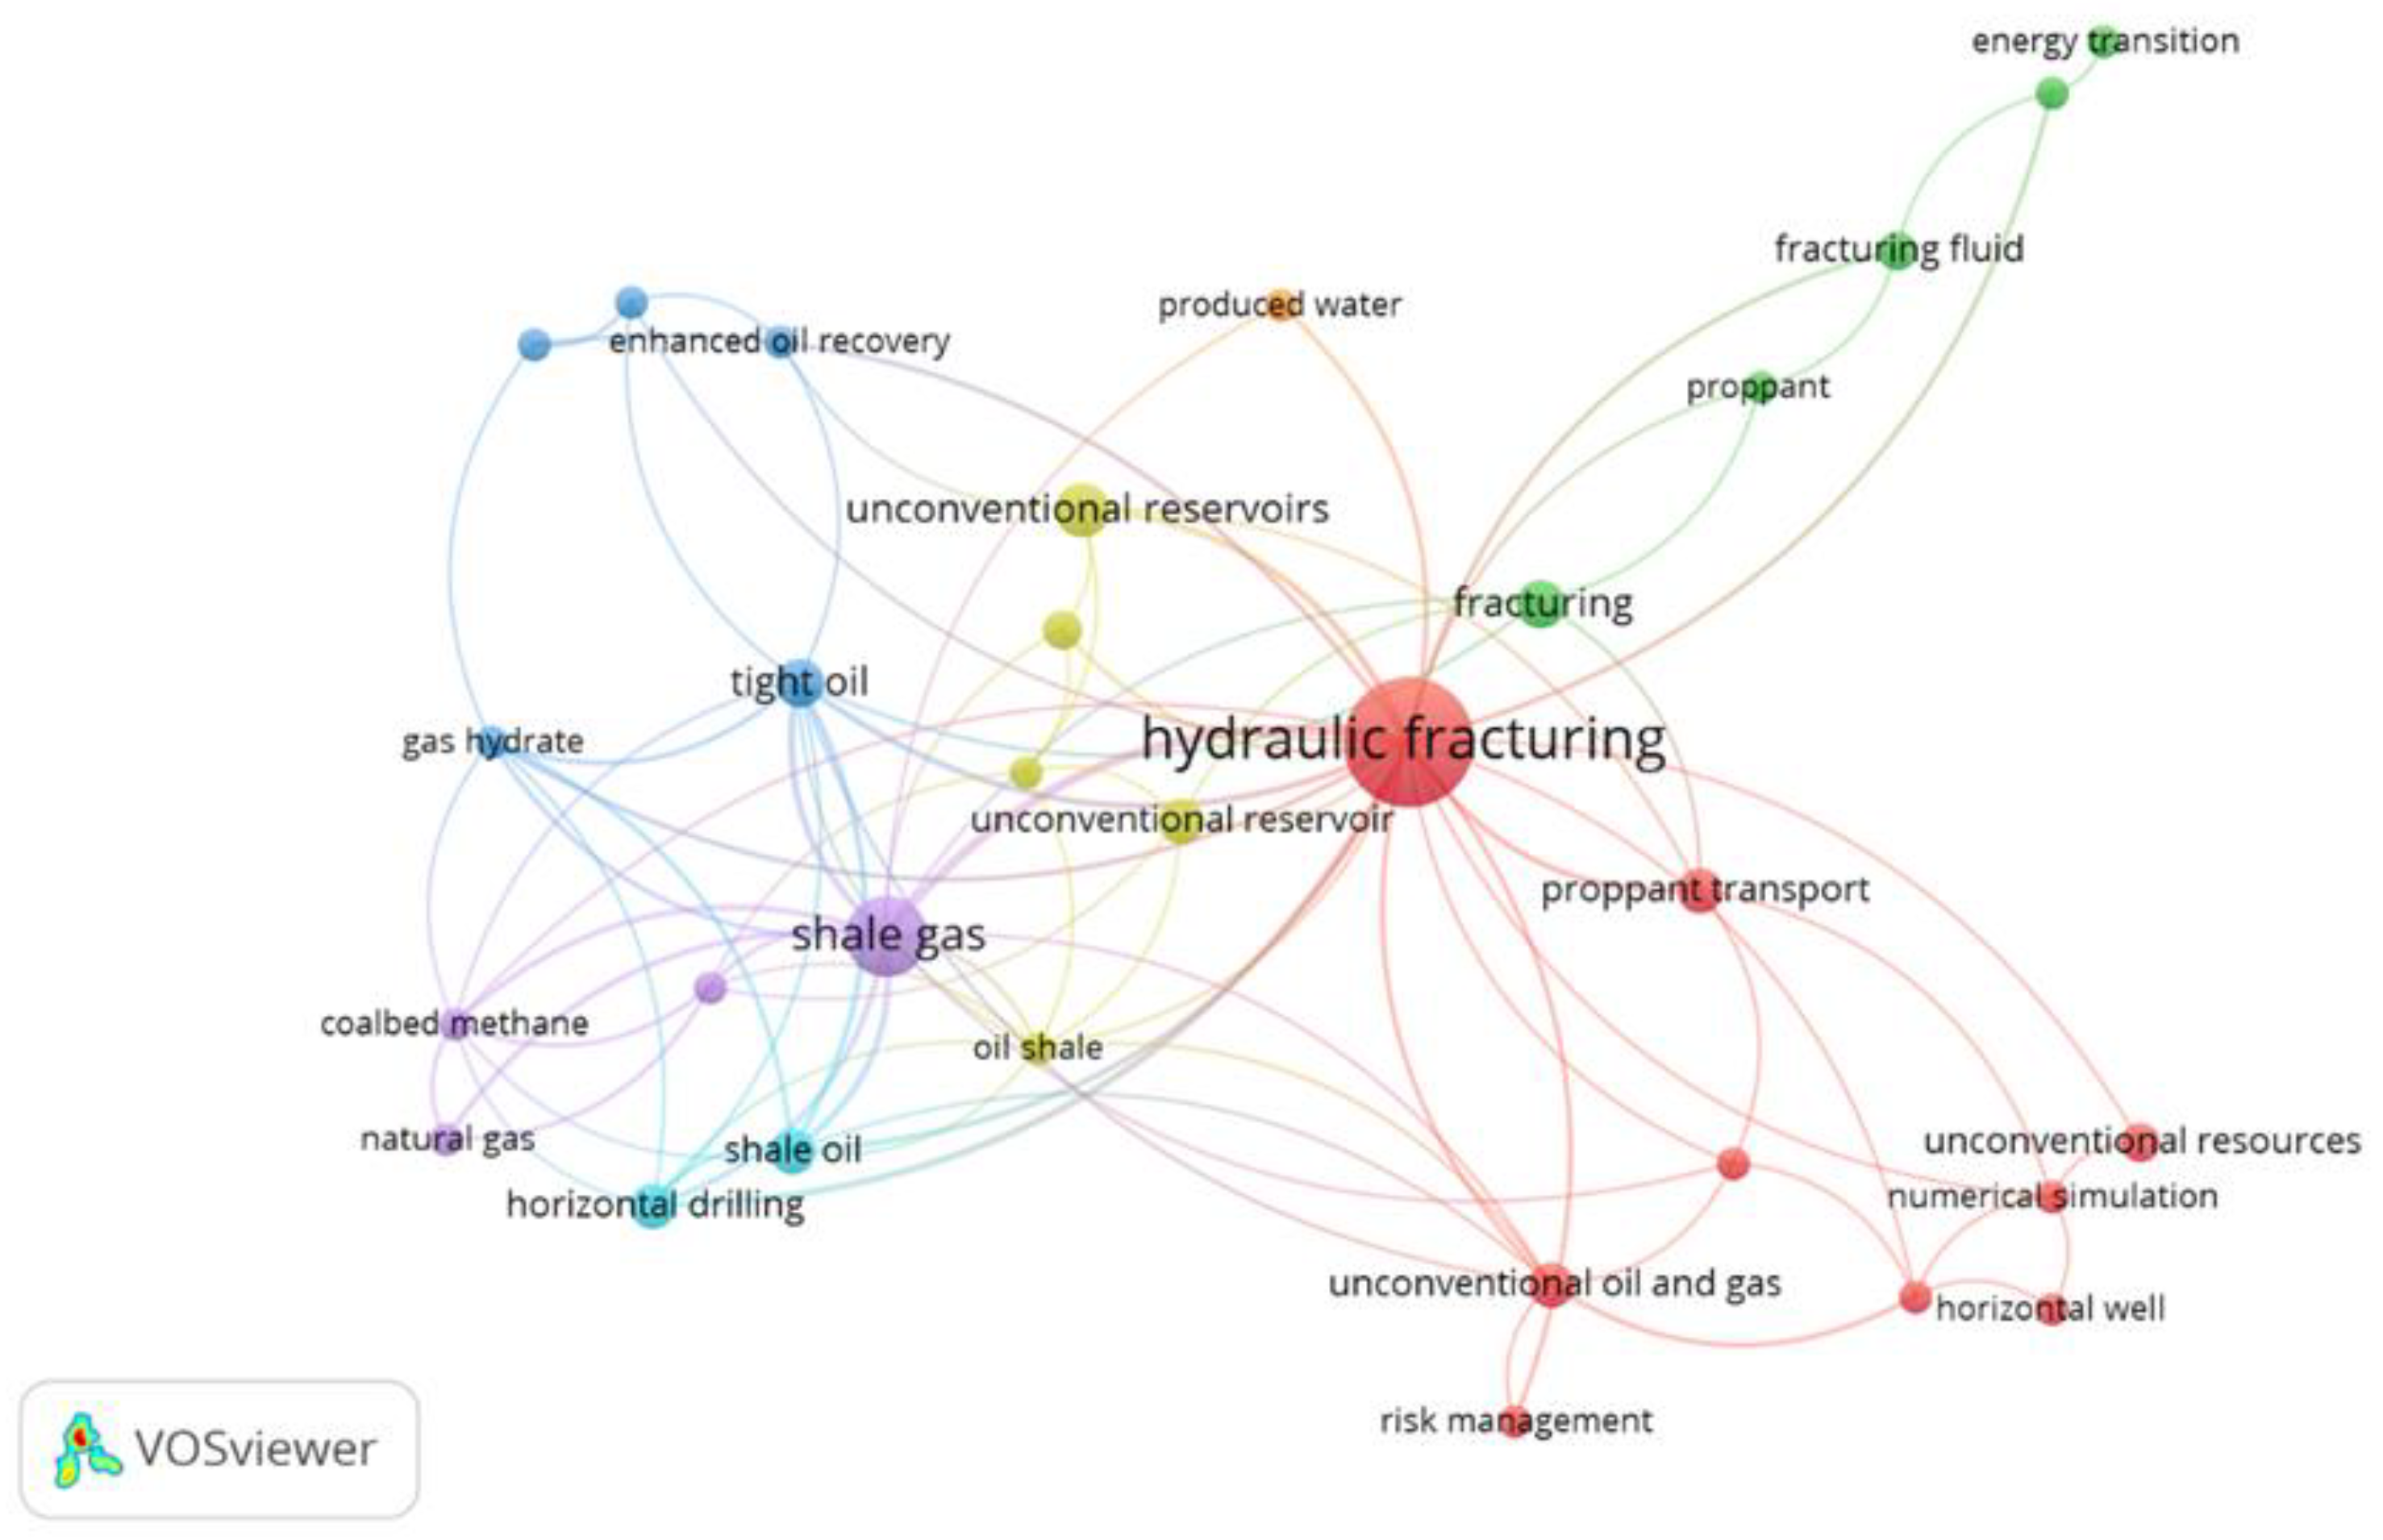
In order to quantify the indicators, initially, different sources of information were gathered, including scientific papers, field reports, and resolutions of State entities. To identify the most relevant literature contributions, a bibliometric analysis was performed using the VOSviewer tool of Scopus. VOSviewer is an analysis and visualization tool that is based on specialized network analysis and visualization techniques, providing the ability to graphically represent patterns and relationships within bibliometric and scientific datasets. The 100 most relevant references published from 2017 to 2023 were originally taken. The keywords used for this task were the environmental impact AND hydraulic fracturing AND unconventional reservoir, AND petroleum industry. The preliminary bibliographic study yielded the networks of the most prominent authors (Figure 8; also, in Figure 9 and Figure 10 the most common keyword interactions are observed. Once this information was filtered, 43 bibliographic references were studied to assign values to each parameter described in Tables 3 and 5 [97,98,99,100,101,102,103,104,105,106,107,108,109,110,111,112,113,114,115,116,117,118,119,120,121,122,123,124,125,126,127,128,129,130,131,132,133,134,135,136,137,138,139,140]. In turn, field reports and documents from governmental entities were evaluated to help in the numerical estimation.
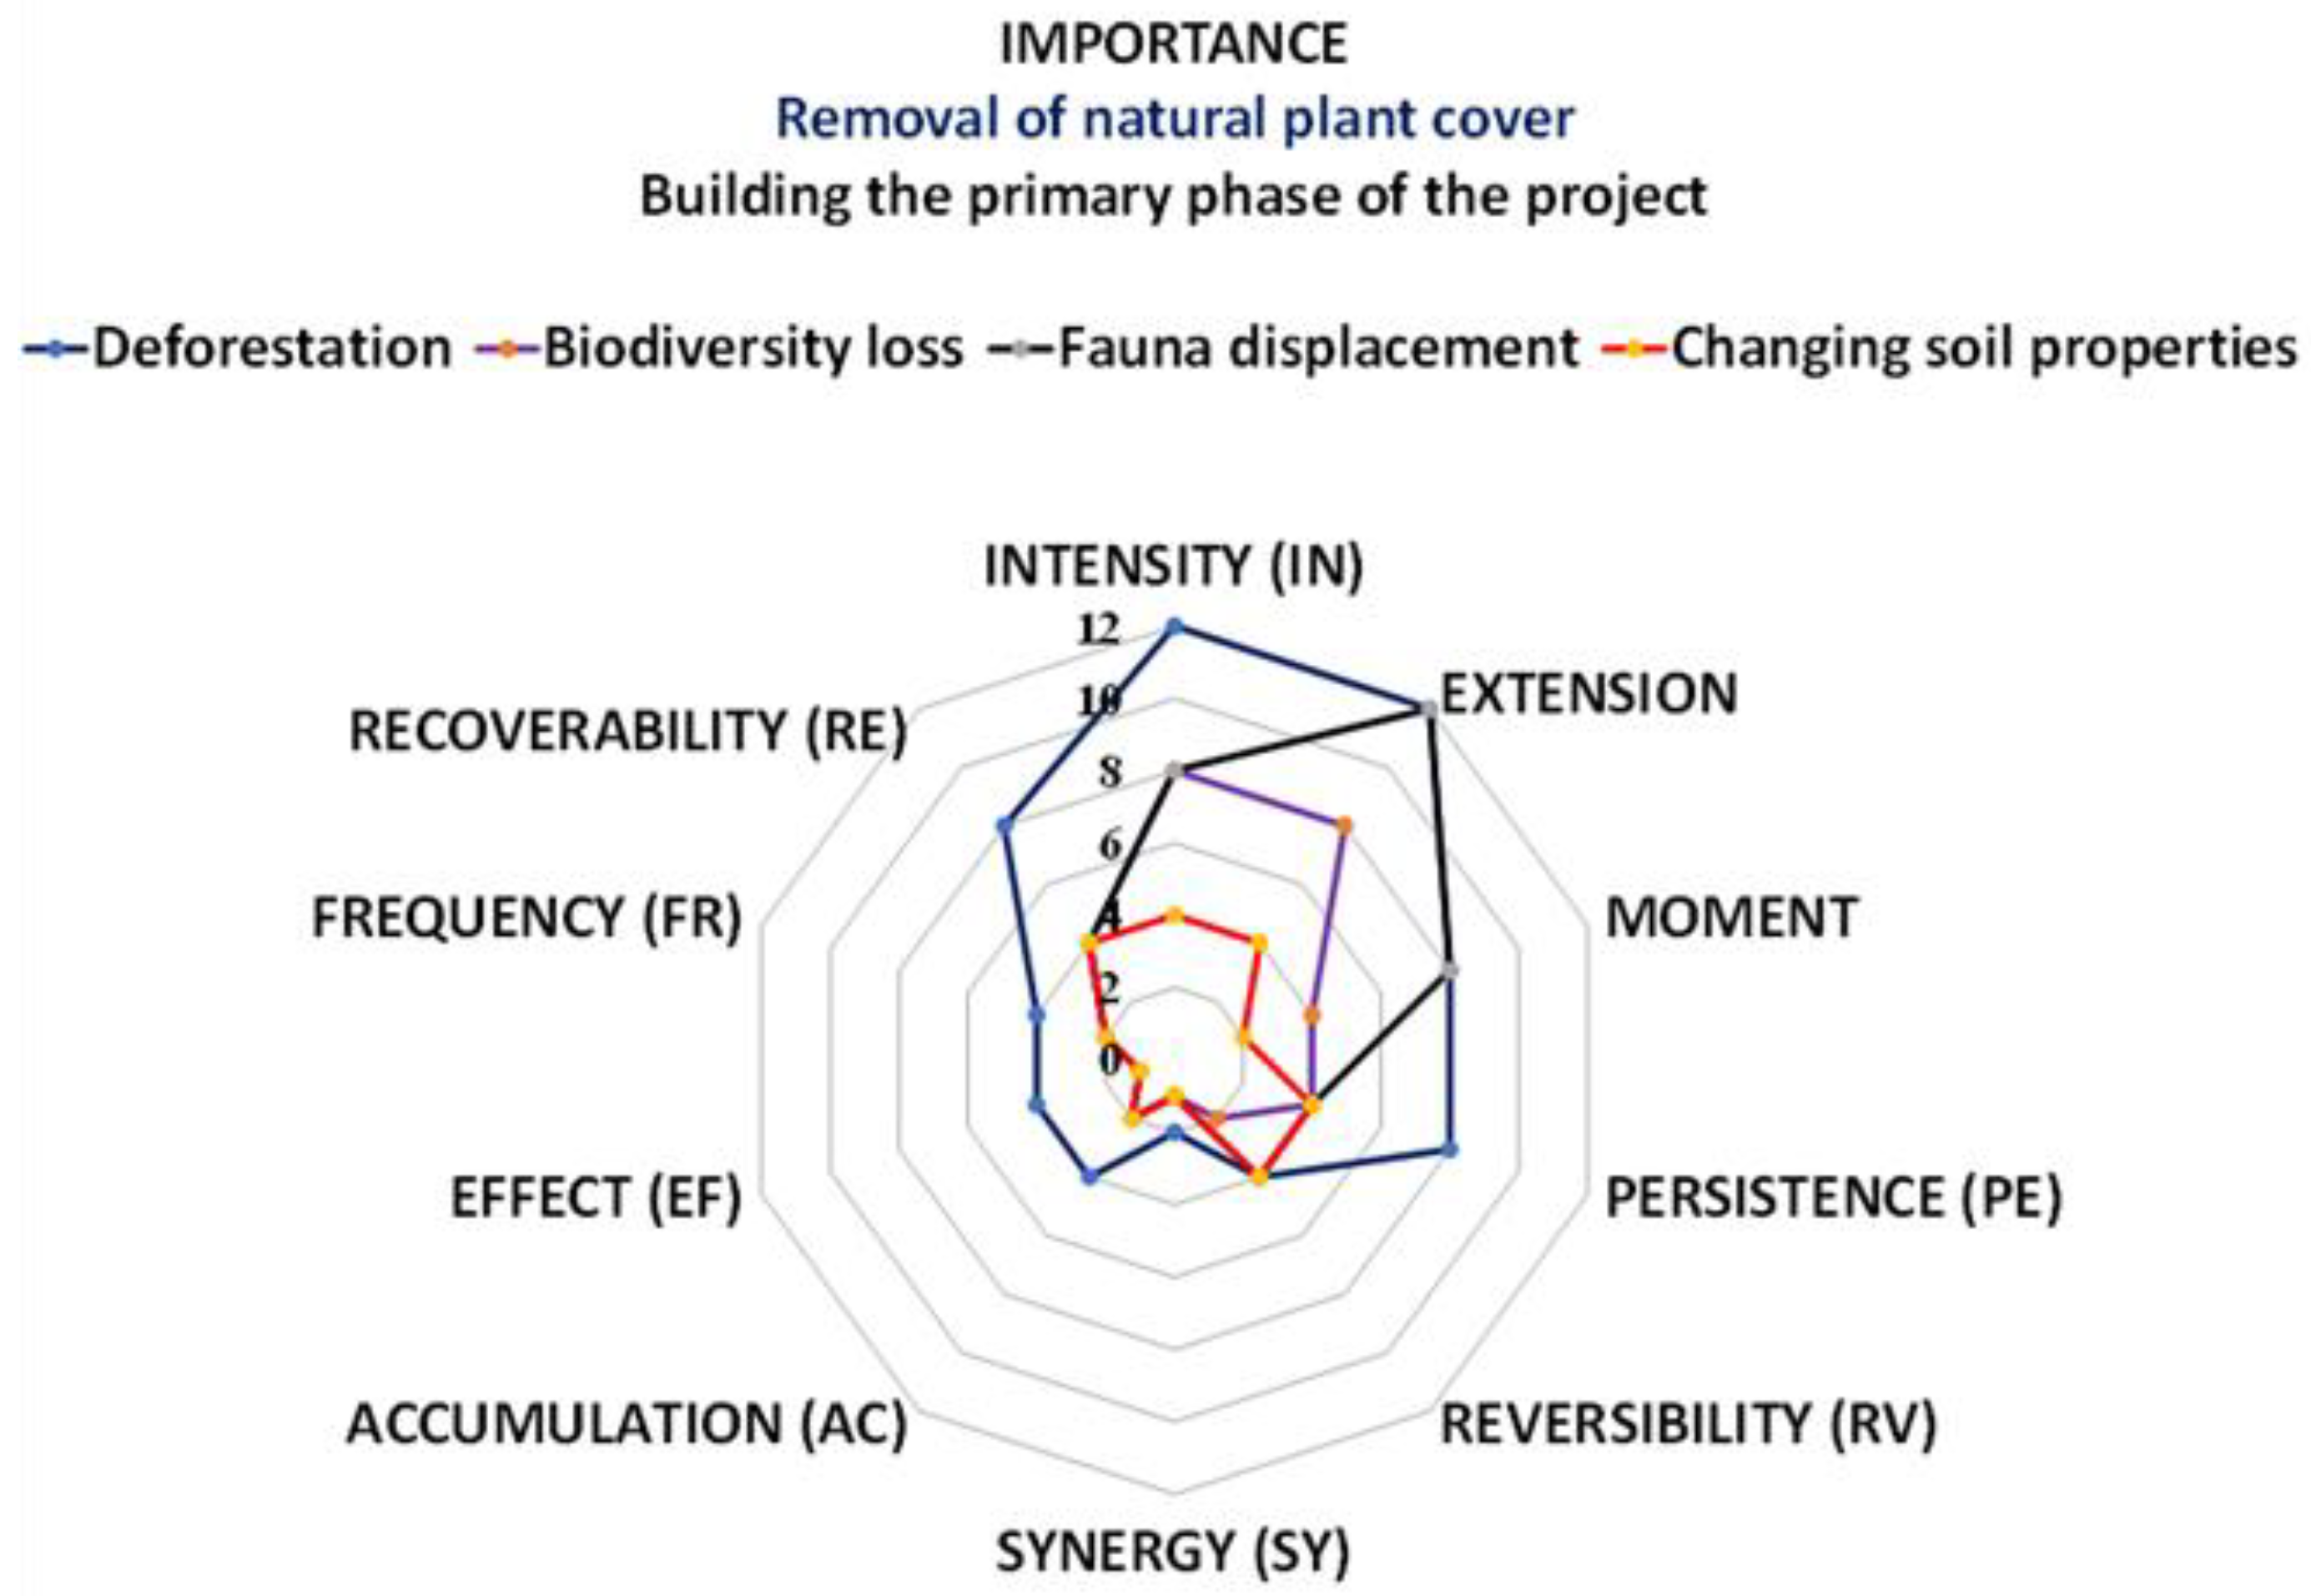
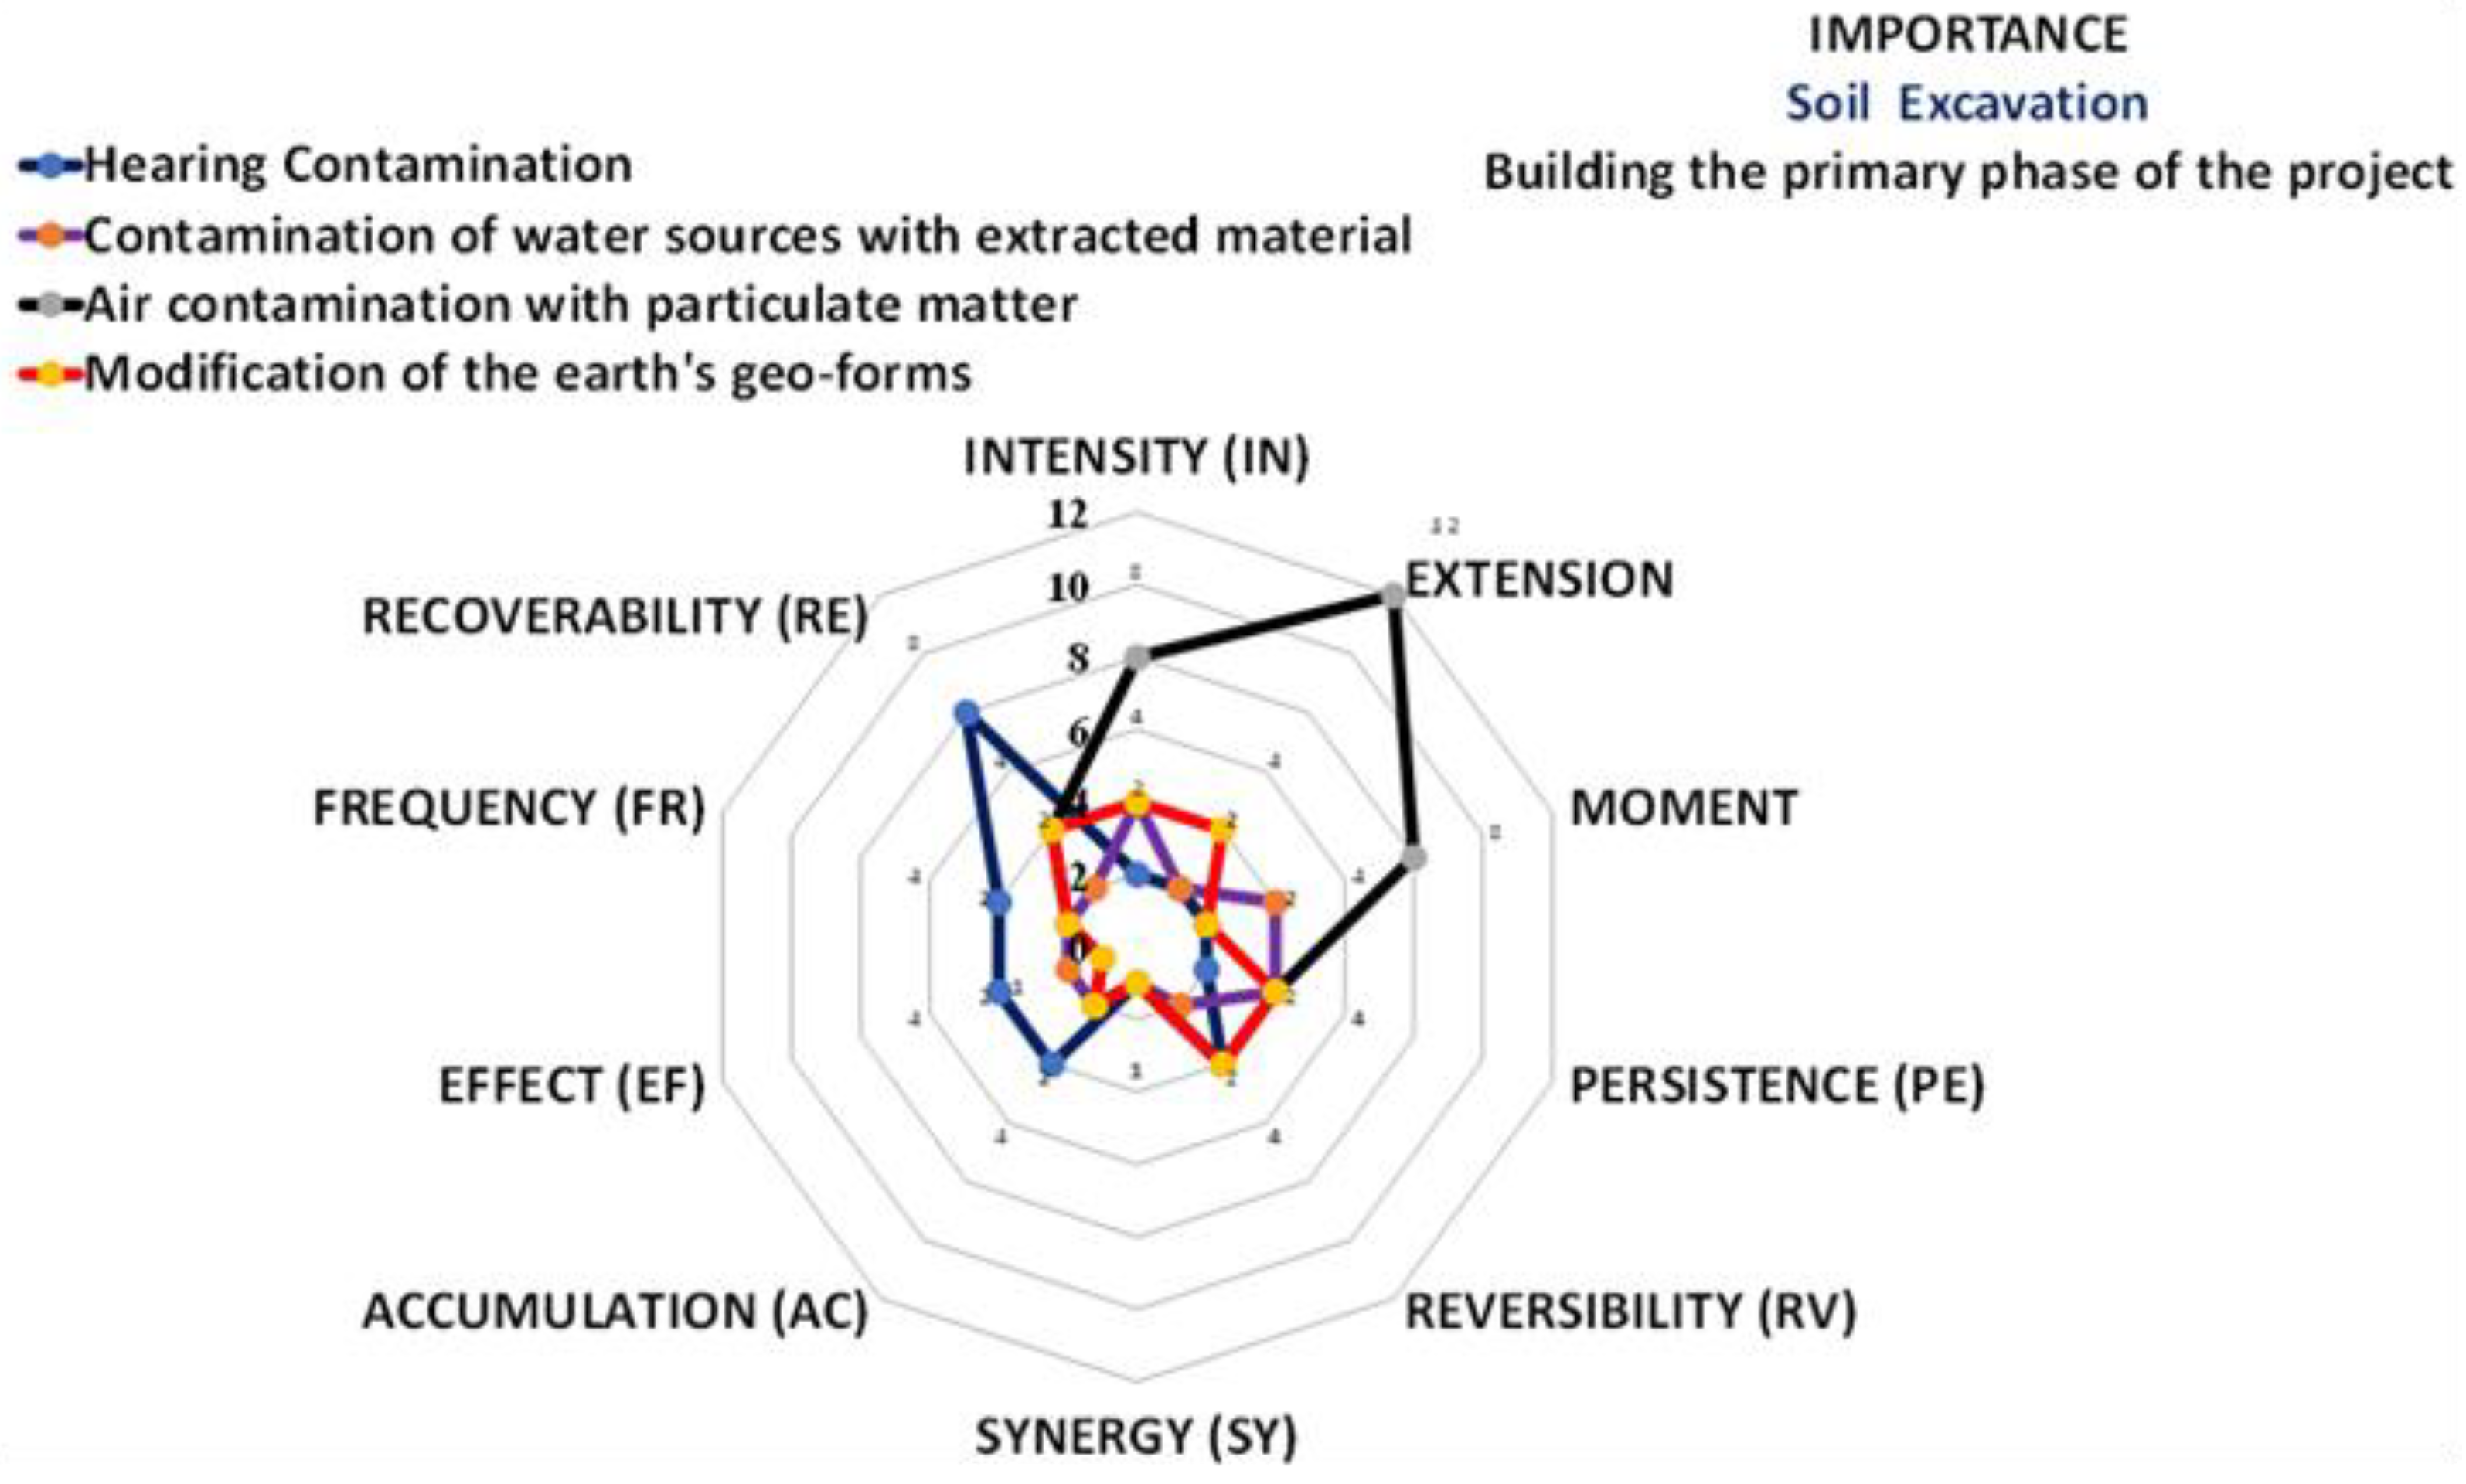
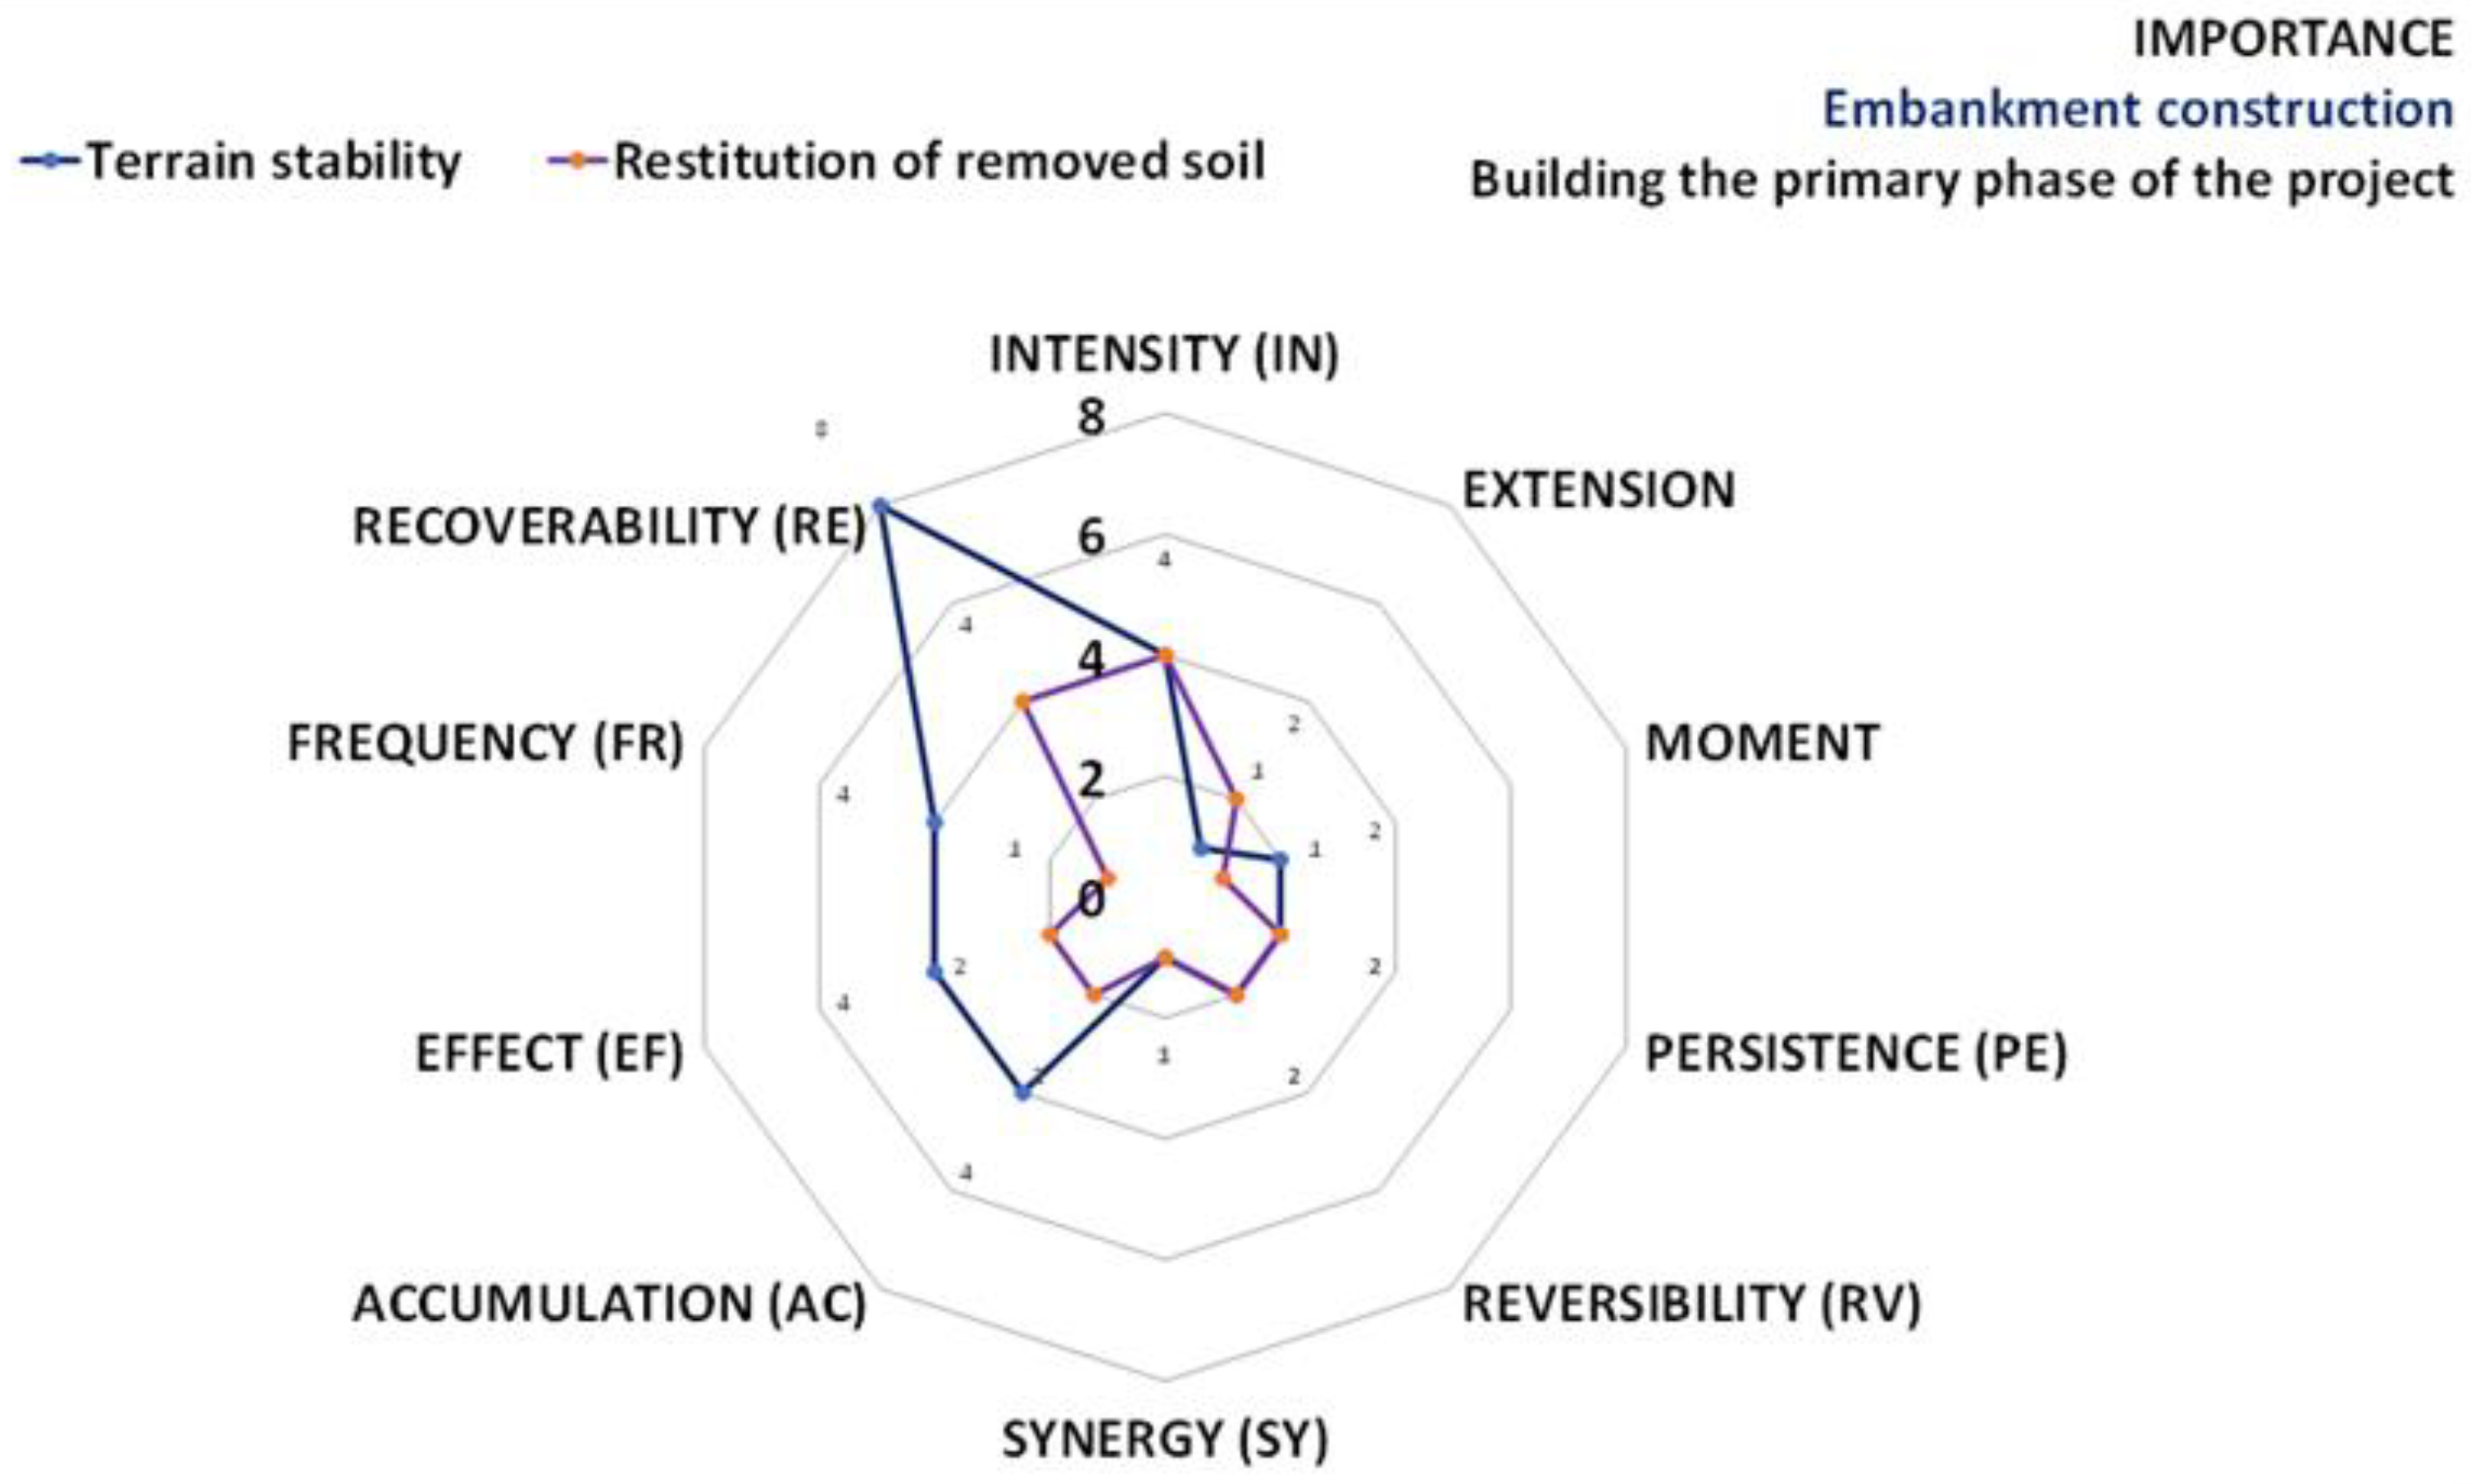
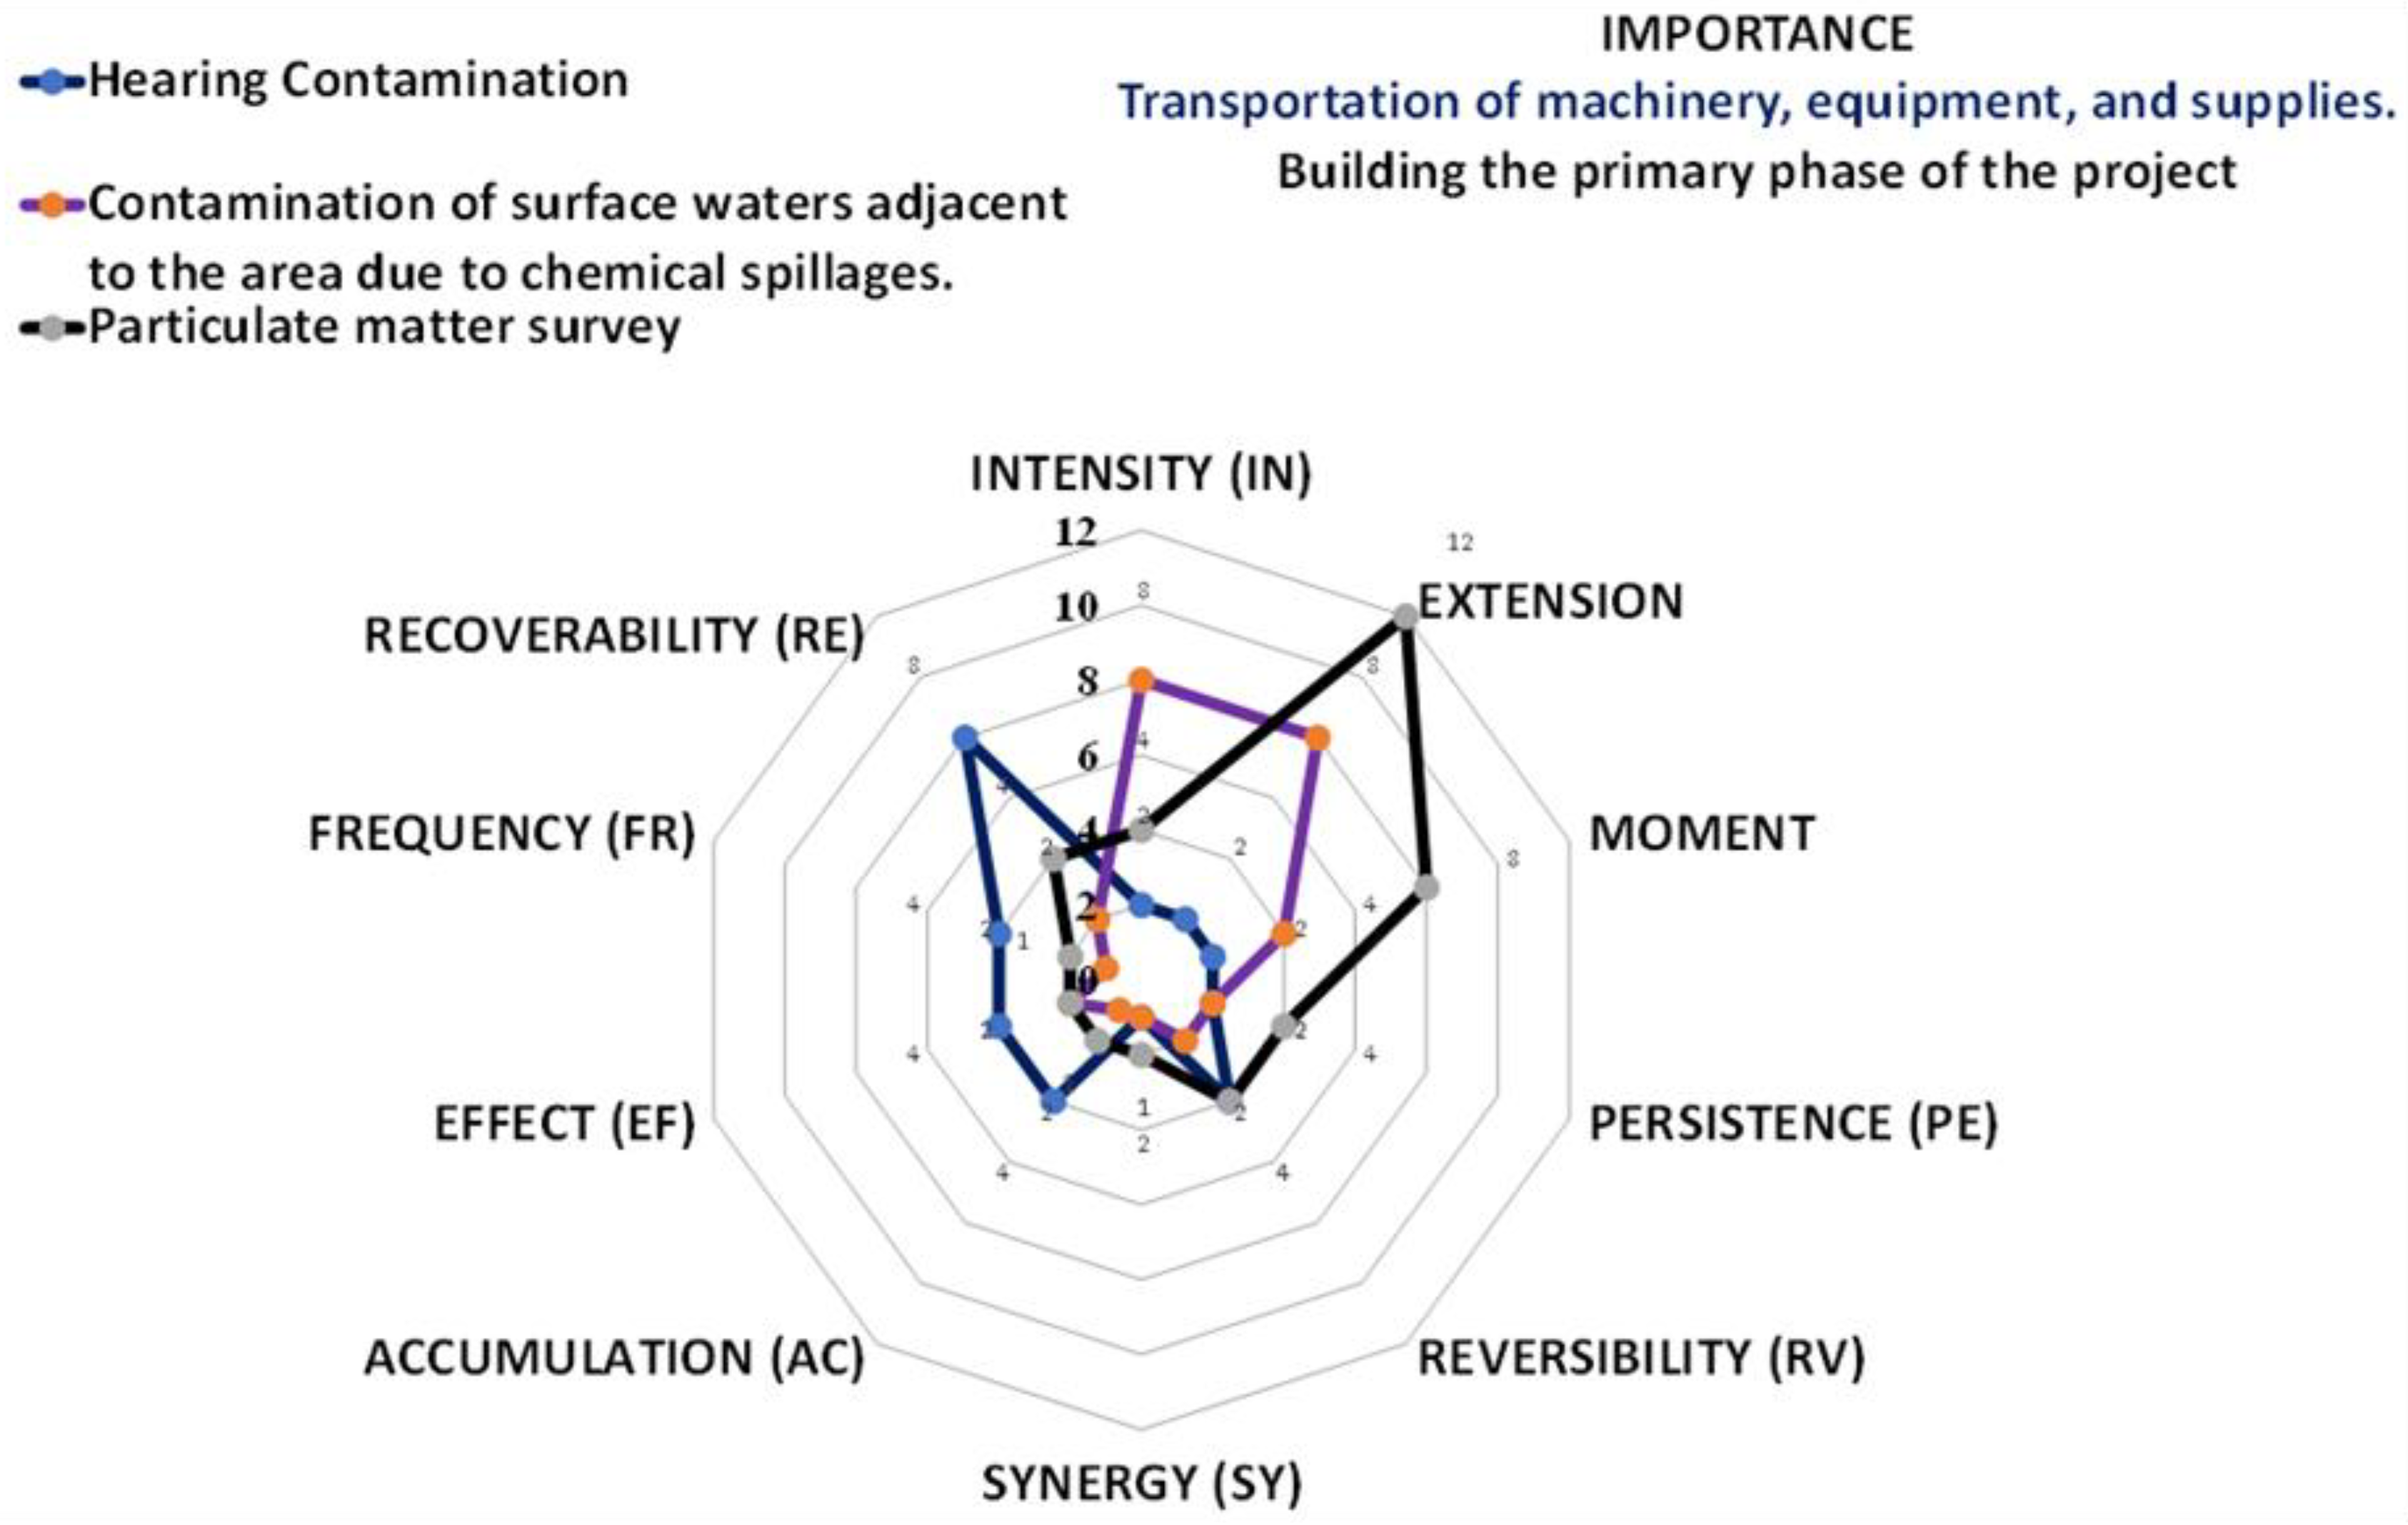
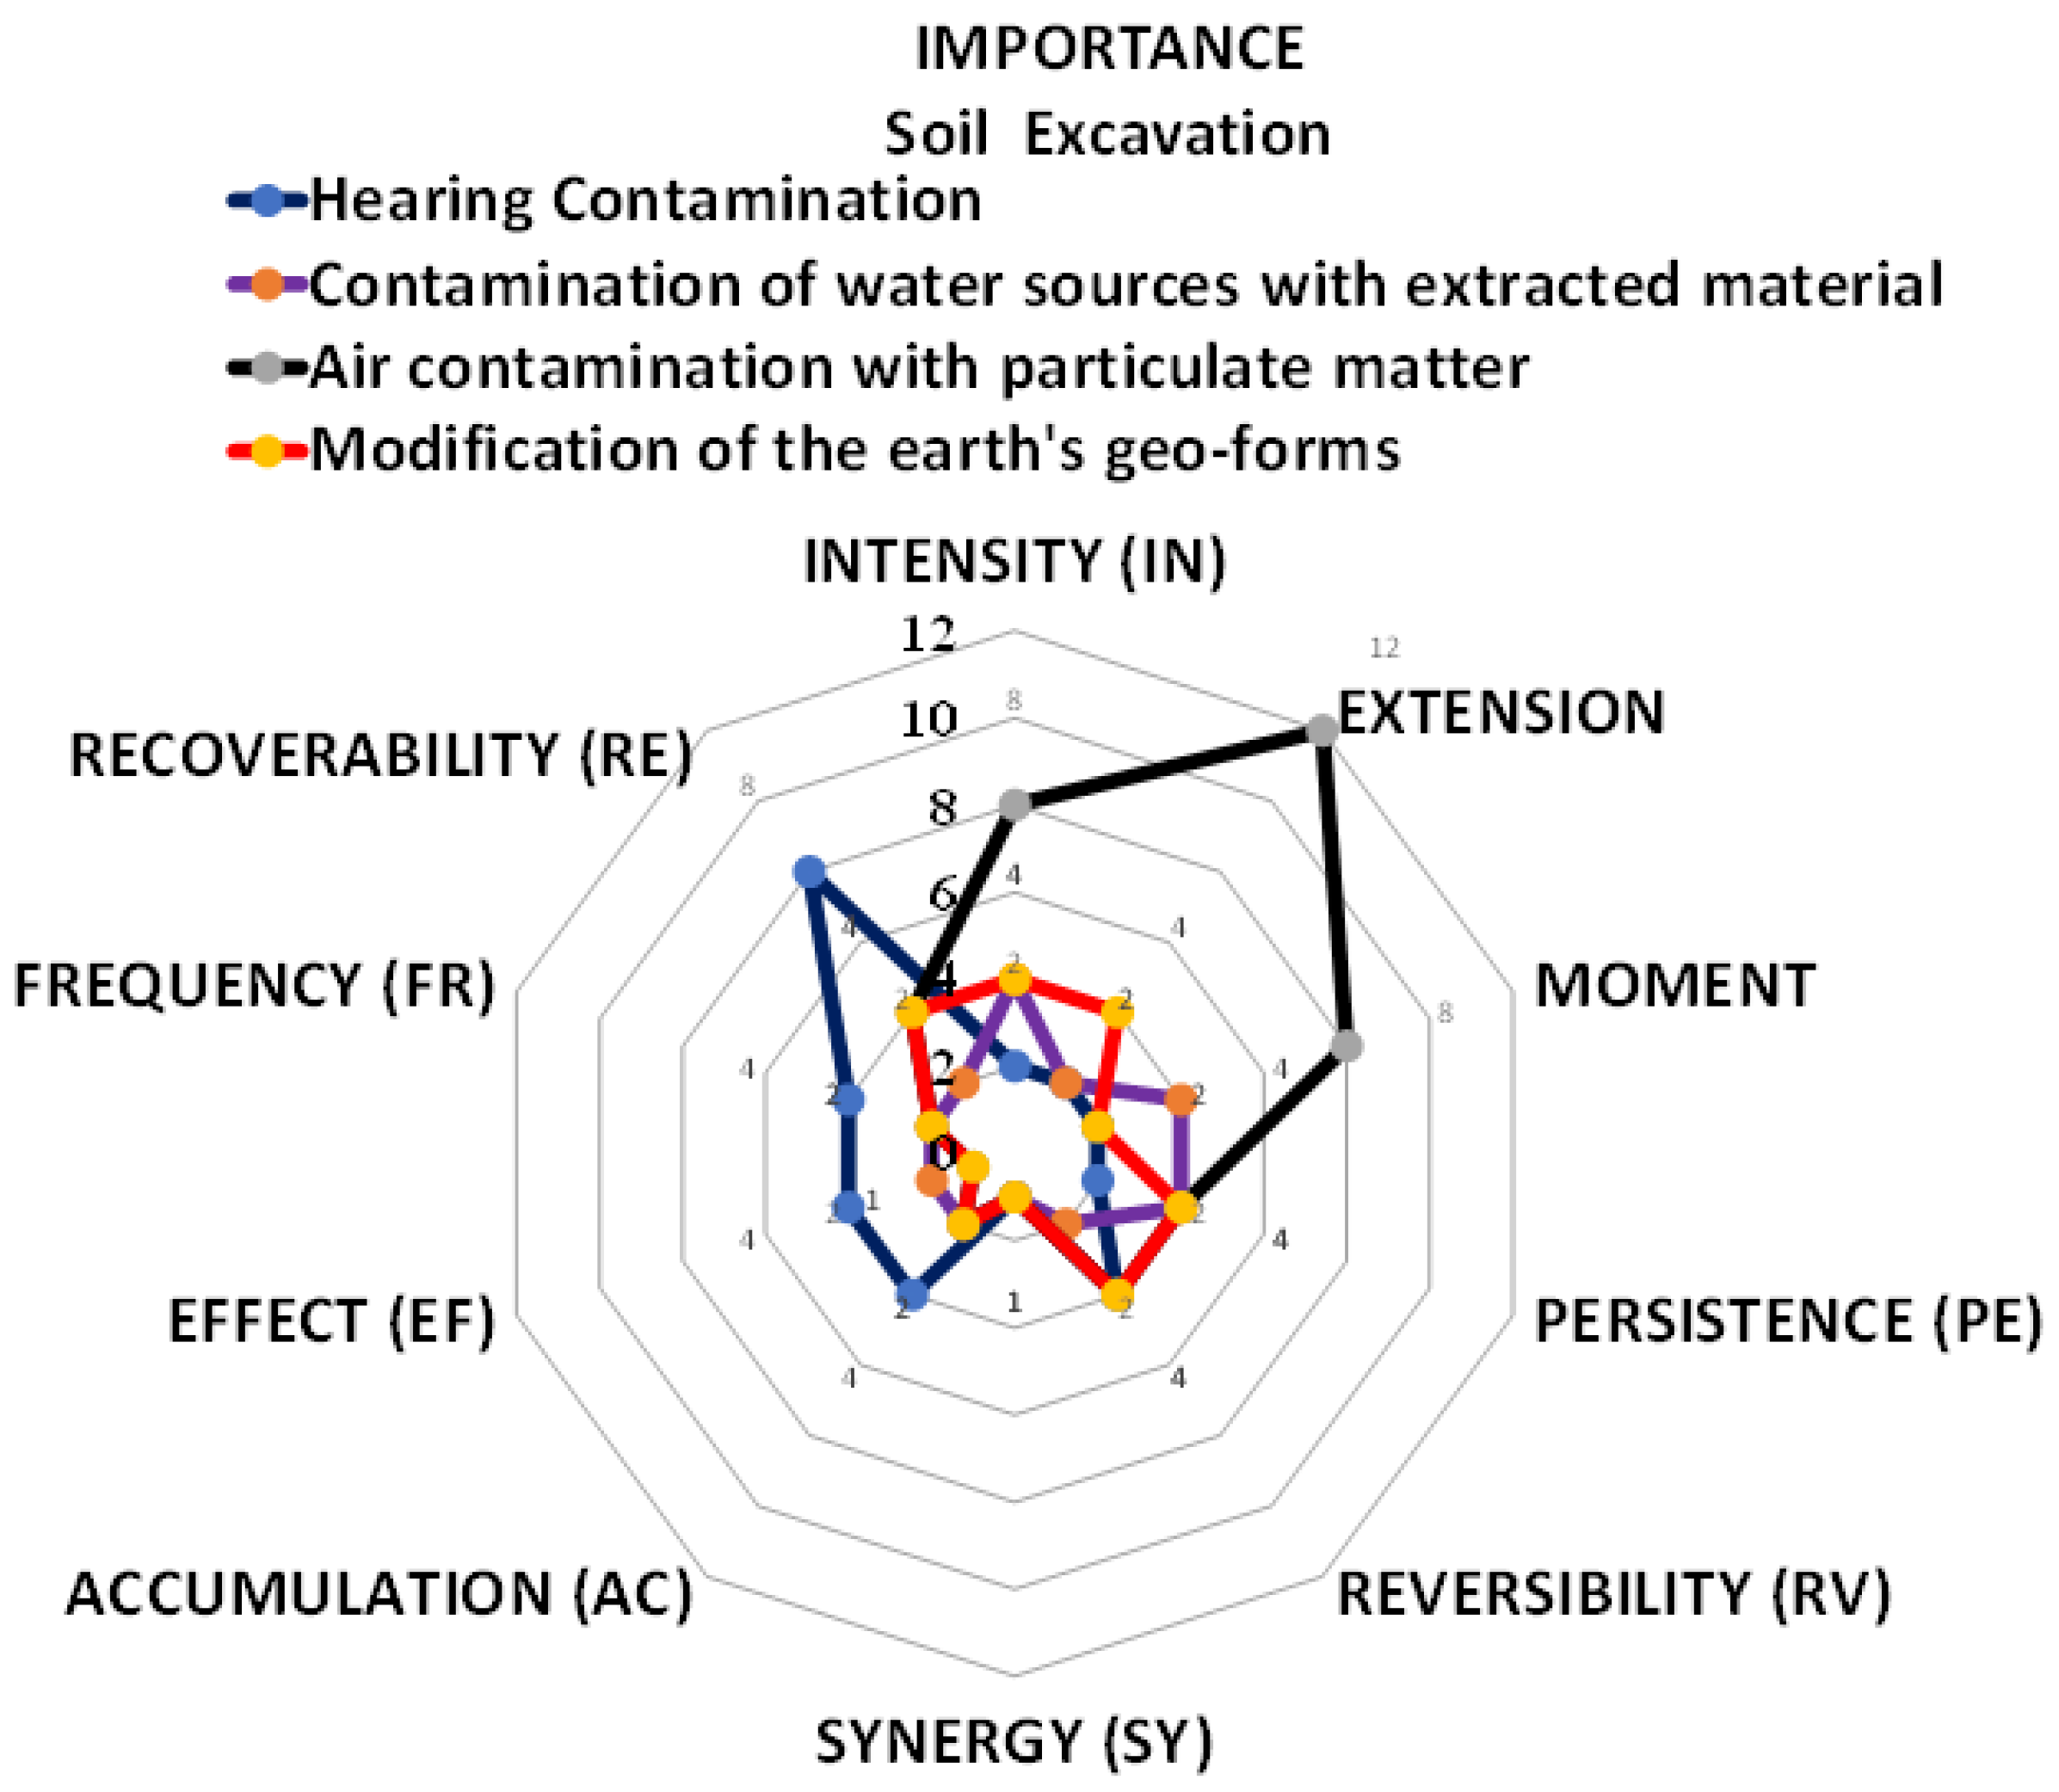
Subsequently, a score is given for each of the parameters that were discretized. Finally, a simple sum is applied to determine the importance of the occurrence. Similarly, a spider diagram (Figure 10) is prepared to visually identify the criticality of an impact. The spider graphs of the environmental impacts can be found in Appendix A.

4. Results and Discussions

Table 15 contains the environmental impact matrix for a possible unconventional petroleum production facility in the La Luna formation of Colombia.
The application of the CONESA methodology in the evaluation of unconventional reservoirs has proven to be an effective approach to measuring and evaluating the associated environmental impacts. Using this method, it was possible to break down the incidence of each effect into 10 specific variables, allowing for a detailed understanding of the critical aspects. This decomposition facilitated the identification and proposal of more appropriate mitigation plans to address the challenges of unconventional reservoirs. However, it is important to note that the CONESA methodology requires a significant volume of data to make informed decisions. In the case of unconventional reservoirs, the limitation in the availability of specific data may affect the ability of the methodology to provide accurate details on mitigation measures. While this may present some limitations in the development of specific measures, the preliminary study using the CONESA methodology is still valuable in providing an overview of the process, paving the way for environmental licensing, and highlighting key areas that require attention in future research and data collection.
Results show that the most serious environmental concerns and areas of significant attention are water contamination, greenhouse gas emissions, air quality impacts, and landscape and land use changes. One of the primary points of concern is groundwater contamination. During the fracking process, substantial quantities of water, sand, and chemicals are injected at high pressure into the ground to fracture the rocks and release the hydrocarbons. There is a risk that some of these chemicals and fracking fluids could migrate into underground aquifers, potentially contaminating drinking water supplies. Studies indicate concerns about water contamination associated with fracking, including the presence of toxic chemicals and heavy metals in groundwater [131,132,133,134,135,136]. Nevertheless, the magnitude and frequency of these occurrences vary depending on location and fracking practices. Mitigation measures for such impacts include return-flow fluid management, which involves the proper handling of return-flow fluids containing potentially contaminating chemicals and materials. Research suggests that reusing and treating these fluids can reduce the risk of water contamination [137,138,139,140,141,142]. Additionally, well monitoring, which entails the rigorous monitoring of wells before, during, and after the fracking operation, can help identify and prevent potential leaks and contamination [143,144,145,146,147].
Similarly, the hydraulic fracturing process and unconventional oil and gas production release greenhouse gases into the atmosphere, including carbon dioxide (CO2) and methane (CH4). Methane is significantly more potent than CO2 in the short term, making it a significant concern for climate change. The technical literature has shown that methane emissions associated with fracking can be considerably high if proper management practices are not implemented [148,149,150,151,152]. These emissions can result from leaks in wells, equipment, and pipelines, as well as intentional releases during well purging. Accurate quantification of these emissions is an evolving area of study. In terms of impact mitigation strategies, controlling leakage through the application of technologies and practices to reduce methane leakage from wells, equipment, and pipelines is fundamental. Early detection and repair of leaks can minimize emissions. Additionally, implementing emissions regulations, which involves adopting stricter regulations and standards to limit methane emissions, is essential. The technical documents provided for the construction of the matrix support the effectiveness of these actions in reducing greenhouse gases [86,153,154,155,156].
Fracking can also bring negative impacts on local air quality. The operation of heavy equipment, natural gas combustion, and fugitive emissions contribute to the release of air pollutants, such as nitrogen oxides (NOx) and volatile organic compounds (VOCs), which can have adverse effects on human health and the environment. The presence of air pollutants has been identified in areas near fracking operations, leading to concerns about the exposure of local communities to health risks [157,158,159,160]. In this case, impact mitigation strategies are divided into two categories. The first involves emission control technologies, such as low-emission burners and capture devices—for example, selective catalytic reduction options for NOx [13,14]. The second is minimum distances. Establishing minimum distances between fracking operations and populated areas can help reduce the exposure of local communities to air pollutants [87,161,162,163,164].
Regarding changes in landscape and land use, the development of infrastructure for unconventional oil and gas extraction, such as drilling platforms and roads, can have a significant impact on the landscape and land use. This can result in the fragmentation of natural habitats and the degradation of wilderness areas. To mitigate these environmental impacts, proper planning of fracking operations and infrastructure consolidation can minimize the fragmentation of natural habitats and reduce the impact on the landscape. Similarly, post-fracking restoration suggests that effective restoration of areas affected by fracking can help mitigate long-term impacts [165,166,167].
Flowback water management in hydraulic fracturing is an important element in environmental risk assessment and in the formulation of mitigation plans. This process involves the return to the surface of the water used during fracturing, bringing with it a complex mixture of chemical components, some of which are deliberately added during operation. The complexity of this fluid makes its treatment a challenging and costly task, especially considering that an in situ treatment plant is required. This significant investment highlights the importance that the industry must assign to the responsible management of flowback water, not only from an economic perspective but also from an environmental sustainability approach.
Also, one of the most critical and sensitive aspects of hydraulic fracturing is the possibility of contaminating aquifers. Aquifers, vital sources of drinking water, are resources that must be protected as a priority. Hydraulic fracturing involves the injection of pressurized fluids into the subsurface, raising concerns about the possible migration of chemicals into the water table. This risk is accentuated by geological variability, aquifer heterogeneity, and the complexity of subsurface flow. The prevention of aquifer contamination, therefore, becomes an imperative task that requires rigorous control and monitoring measures to ensure the protection of these vital resources.
It is important to highlight that the CONESA methodology, when applied in the evaluation of unconventional reservoirs, plays a central role in the identification and quantification of environmental risks associated with hydraulic fracturing. The creation of a matrix that encompasses the entire exploration and production chain facilitates a detailed understanding of the potential impacts at various stages of the process. In this context, flowback water management and prevention of aquifer contamination stand out as key elements assessed by the CONESA methodology. The results obtained from this matrix become fundamental inputs for environmental impact studies, providing detailed and specific information that will guide decision-making in policy formulation and environmental licensing processes.
The application of CONESA not only contributes to a deeper understanding of the risks associated with unconventional reservoirs but also establishes a basis for the adoption of more sustainable and responsible practices. The methodology not only addresses environmental challenges in isolation but integrates a holistic perspective that considers economic and social aspects. In the specific case of flowback water management, the CONESA matrix offers a framework for the identification of specific mitigation measures, thus providing practical guidance for the implementation of responsible flowback water treatment and management strategies.
In terms of environmental care, however, responsible water management stands out. The use of large quantities of water in the hydraulic fracturing process highlights the importance of its sustainable management, focusing on the reduction in consumption, reuse, and adequate treatment of flowback water.
In addition, the adoption of advanced technologies and the implementation of emission reduction practices are crucial to minimize these effects and preserve air quality in the surrounding areas.
Proper waste management is also an essential point. The generation of solid and liquid wastes during drilling and hydraulic fracturing operations requires rigorous measures for their management and disposal. The application of recycling practices, safe treatment, and responsible disposal are fundamental aspects to avoid negative impacts on the environment.

5. Final Remarks

The environmental impact matrix applied in this study allowed for the preliminary evaluation of the impacts associated with hydraulic fracturing projects in unconventional reservoirs. The information contained in the matrix can be used for other projects in Latin America and worldwide.
The main results of this study applied to La Luna in Colombia indicate that the most challenging impacts include water contamination, deforestation, and the emission of greenhouse gases. First, water contamination has emerged as one of the most worrisome issues related to oil development in the La Luna region. Unconventional oil extraction operations often involve the intensive use of chemicals and the generation of large volumes of contaminated wastewater, which can compromise groundwater and surface water quality, negatively affecting local flora and fauna, as well as nearby human communities.
In addition, deforestation and natural habitat degradation represent another critical environmental challenge. The expansion of infrastructure related to oil development, such as road construction and the installation of drilling rigs, has led to the loss of sensitive habitats and biodiversity in the La Luna watershed. This alteration of the natural environment can have lasting impacts on the local ecology and delicately balanced ecosystems.
Another challenging impact is the emission of greenhouse gases and their contribution to climate change. Oil extraction in the unconventional La Luna basin involves the release of greenhouse gases during extraction and processing operations, which can exacerbate global warming and its associated consequences, such as rising temperatures, changes in weather patterns, and extreme weather events.
The application of the CONESA methodology proves to be a comprehensive and effective tool to address the guiding questions of this work, providing a matrix of environmental impacts that highlights the negative risks associated with hydraulic fracturing in unconventional reservoirs. This matrix, resulting from the detailed analysis contemplated by CONESA, provides a holistic view of potential impacts along the exploration and production chain. In line with the questions posed, environmental risks are identified and quantified, with special attention to critical aspects such as flowback water management, possible contamination of aquifers, and other adverse effects.
The highlight of the CONESA methodology is its ability to go beyond the simple identification of risks by proposing general mitigation measures within the same environmental impact matrix. This proactive approach allows us not only to recognize environmental challenges but also to address them with specific strategies designed to minimize negative effects. The inclusion of these measures in the matrix consolidates the methodology as a comprehensive tool that not only assesses but also guides toward practical and applicable solutions.
Despite the lack of some important data, such as the quality of crude oil produced, CONESA demonstrates its usefulness in responding to the need to categorize the impacts of hydraulic fracturing. The ability of the methodology to adapt to scenarios where information may be limited highlights its versatility and its ability to provide meaningful results even under conditions of uncertainty. This translates into a valuable preliminary tool for environmental assessment, highlighting critical areas and allowing for informed decision-making even in situations where complete information may not be available.
In summary, it is important to recognize and address these challenging environmental impacts of oil development in the unconventional La Luna basin in Colombia. If the country’s energy plan prioritizes developing unconventional resources, careful planning and the implementation of sustainable practices are required to mitigate these negative effects and promote an appropriate balance between resource exploitation and environmental conservation for present and future generations.
However, it is worth stressing that the Conesa methodology has limitations related to its simplified methodological structure. In our case, the quantification of indicators was based on the literature, while on a more technical and bottom–up approach, it could have been based on specific studies for the La Luna formation. In addition, the aggregation of impacts could have been based on a more structured multicriteria analysis, for example, an AHP method. Therefore, this study should be viewed as a preliminary assessment that needs to be followed by in-field studies.

Author Contributions

Conceptualization, C.A.G.-M. and A.S.; funding acquisition, C.A.G.-M. and A.S.; methodology, A.S.; supervision, A.S.; visualization, C.A.G.-M.; writing—original draft, C.A.G.-M.; writing—review and editing, C.A.G.-M. and A.S. All authors have read and agreed to the published version of the manuscript.

Funding

This research received no external funding.

Informed Consent Statement

Not applicable.

Data Availability Statement

The data presented in this study are available on request from the corresponding author.

Acknowledgments

We would like to acknowledge the financial support of the Brazilian National Council for Scientific and Technological Development (CNPq) and the Coordination of Superior Level Staff Improvement (CAPES). The publication of this work was supported by PROPESP/UFPA (PAPQ).

Conflicts of Interest

The authors declare no conflicts of interest.

Appendix A

Sustainability 16 02063 i001
Sustainability 16 02063 i002
Sustainability 16 02063 i003
Sustainability 16 02063 i004
Sustainability 16 02063 i005

References

  1. Bp Statistical Review of World Energy, 71st Edition; 2022. Available online: https://www.biee.org/bp-statistical-review-of-world-energy-2022-71st-edition/ (accessed on 5 November 2023).
  2. Lyu, L.; Fang, L. A Study on EC Translation of BP Statistical Review of World Energy 2022 from the Perspective of Schema Theory. J. Linguist. Commun. Stud. 2023, 2, 10–14. [Google Scholar] [CrossRef]
  3. Moser, T. MNCs and sustainable business practice: The case of the Colombian and Peruvian petroleum industries. World Dev. 2001, 29, 291–309. [Google Scholar] [CrossRef]
  4. Ochoa, M.A.M.; Viloria, A.; Nieto, G.Y.C.; Ramírez, M.C. The Management of the Oil Sector as a Factor of Socioeconomic Control in Two Neighboring Countries: Colombia and Venezuela. Int. J. Control. Theory Appl. 2016, 9, 1–8. [Google Scholar]
  5. Dhuldhoya, K.; Dusterhoft, R. Investigation of the Economic Impact of Parent Well Protection Treatments in Unconventional Plays. In Proceedings of the SPE Europec Featured at 79th EAGE Conference and Exhibition, Paris, France, 12 June 2017. [Google Scholar]
  6. Rodriguez, J.; Heo, J.; Kim, K.H. The impact of hydraulic fracturing on groundwater quality in the Permian Basin, west Texas, USA. Water 2020, 12, 796. [Google Scholar] [CrossRef]
  7. Kuuskraa, V.; Stevens, S.H.; Moodhe, K.D. Technically Recoverable Shale Oil and Shale Gas Resources: An Assessment of 137 Shale Formations in 41 Countries Outside the United States; US Energy Information Administration, US Department of Energy: Washington, DC, USA, 2013. [Google Scholar]
  8. de Camargo, T.R.M.; Merschmann, P.R.D.C.; Arroyo, E.V.; Szklo, A. Major challenges for developing unconventional gas in Brazil–Will water resources impede the development of the Country’s industry? Resour. Policy 2014, 41, 60–71. [Google Scholar] [CrossRef]
  9. Eygun, C.; Belgaroui, J.; Wu, Y.; Pazos, F. Mitigating shale gas developments carbon footprint: Evaluating and implementing solutions in argentina. In Proceedings of the Unconventional Resources Technology Conference, Austin, TX, USA, 24–26 July 2017; pp. 2220–2233. [Google Scholar]
  10. Shcherba, V.A.; Butolin, A.P.; Zieliński, A. Current state and prospects of shale gas production. In IOP Conference Series: Earth and Environmental Science; IOP Publishing: Bristol, UK, 2019; Volume 272, p. 032020. [Google Scholar]
  11. Mauter, M.S.; Alvarez, P.J.; Burton, A.; Cafaro, D.C.; Chen, W.; Gregory, K.B.; Schnoor, J.L. Regional variation in water-related impacts of shale gas development and implications for emerging international plays. Environ. Sci. Technol. 2014, 48, 8298–8306. [Google Scholar] [CrossRef] [PubMed]
  12. Forero, C.A.; Forero, E.J.; Guerrero-Martin, L.; Szklo, A.; Rochedo, P.R.; Guerrero-Martin, C. Technical and economic assessment of the development of a Colombian Tight Oil reservoir: A simulation case study of Valle Medio del Magdalena basin. Dyna 2021, 88, 35–43. [Google Scholar] [CrossRef]
  13. Parada, L.; de los Angeles, A. Applied Petroleum Source Rock Evaluation and High-Resolution Sequence Stratigraphy for Unconventional Reservoirs in La Luna Formation (Cenomanian-Santonian) Northwest Maracaibo Basin, Venezuela 2019. Available online: https://shareok.org/handle/11244/319563 (accessed on 5 November 2023).
  14. Bello-Angulo, D.; Mantilla-Duarte, C.; Montes-Paez, E.; Guerrero-Martin, C. Box–Jenkins Methodology Application to Improve Crude Oil Production Forecasting: Case Study in a Colombian Field. Arab. J. Sci. Eng. 2022, 47, 11269–11278. [Google Scholar] [CrossRef]
  15. Moreno-Enriquez, A.; Vargas-Silva, D.; Gambús-Ordaz, M.; Calderón-Carrillo, Z.; Robles-Albarracín, E. Assessment of the original gas volume in situ in unconventional gas-shale reservoirs through multiple models worldwide and its analogy to a Colombian formation. Boletín Geol. 2022, 44, 109–123. [Google Scholar] [CrossRef]
  16. Guerrero-Martin, C.A.; Fernández-Ramírez, J.S.; Arturo-Calvache, J.E.; Milquez-Sanabria, H.A.; da Silva Fernandes, F.A.; Costa Gomes, V.J.; Silva, W.L.E.; Silva, W.L.E.; Duarte, E.D.V.; Guerrero-Martin, L.E.; et al. Exergy Load Distribution Analysis Applied to the Dehydration of Ethanol by Extractive Distillation. Energies 2023, 16, 3502. [Google Scholar] [CrossRef]
  17. Taherdangkoo, R.; Tatomir, A.; Anighoro, T.; Sauter, M. Modeling fate and transport of hydraulic fracturing fluid in the presence of abandoned wells. J. Contam. Hydrol. 2019, 221, 58–68. [Google Scholar] [CrossRef]
  18. Flores-Medina, P.W.; Sepp-Neves, A.A.; Coppini, G.; Morales-Caselles, C. Strategic environmental sensitivity mapping for oil spill contingency planning in the Peruvian marine-coastal zone. Sci. Total Environ. 2022, 852, 158356. [Google Scholar] [CrossRef] [PubMed]
  19. Spickert, A. Petroleum System Analysis: Middle Magdalena Valley Basin, Colombia, South America. Master’s Thesis, University of Washington, Washington, DC, USA, 2014. [Google Scholar]
  20. Moretti, I.; Charry, G.R.; Morales, M.M.; Mondragon, J.C. Integrated exploration workflow in the south Middle Magdalena Valley (Colombia). J. S. Am. Earth Sci. 2010, 29, 187–197. [Google Scholar] [CrossRef]
  21. Thompson, W.R. A Source Rock First Approach to Petroleum System Analysis in the Middle Magdalena Valley, Colombia; Stanford University: Stanford, CA, USA, 2019. [Google Scholar]
  22. Cooper, M.A.; Addison, F.T.; Alvarez, R.; Coral, M.; Graham, R.H.; Hayward, A.B.; Taborda, A. Basin development and tectonic history of the Llanos basin, Eastern Cordillera, and Middle Magdalena Valley, Colombia. AAPG Bull. 1995, 79, 1421–1442. [Google Scholar]
  23. Ríos, C.A.; Castellanos, O.M. Microstructural characterization of pore types in unconventional gas reservoirs utilizing FEG-SEM: An example from the Galembo Member of the Cretaceous La Luna Formation, Middle Magdalena Valley Basin (Colombia). Rev. Acad. Colomb. Cienc. Exactas Físicas Nat. 2016, 40, 161–175. [Google Scholar] [CrossRef]
  24. Reyes, C.A.R.; Amorocho-Parra, R.; Villarreal-Jaimes, C.A.; Meza-Ortíz, J.A.; Castellanos-Alarcón, O.M.; Madero-Pinzon, H.D.; Carvajal-Díaz, J.D. Geotourism in regions with influence from the oil industry: A study case of the Middle Magdalena Valley Basin (Colombia). Geoheritage 2021, 13, 1–26. [Google Scholar] [CrossRef]
  25. Mastalerz, M.; Drobniak, A.; Stankiewicz, A.B. Origin, properties, and implications of solid bitumen in source-rock reservoirs: A review. Int. J. Coal Geol. 2018, 195, 14–36. [Google Scholar] [CrossRef]
  26. Rangel, A.; Parra, P.; Niño, C. The La Luna formation: Chemostratigraphy and organic facies in the Middle Magdalena Basin. Org. Geochem. 2000, 31, 1267–1284. [Google Scholar] [CrossRef]
  27. Zumberge, J.E. Source rocks of the La Luna formation (Upper Cretaceous) in the middle magdalena valley, Colombia. In Petroleum Geochemistry and Source Rock Potential of Carbonate Rocks; American Association of Petroleum Geologists: Tulsa, OK, USA, 1984. [Google Scholar]
  28. Gomez, A. Integrated Geological Characterization and Distribution of the Salada Member, La Luna Formation in the Central Area of The Middle Magdalena Basin, Colombia. Master’s Thesis, The University of Oklahoma, Norman, OK, USA, 2014. [Google Scholar]
  29. Torres, E.J.; Slatt, R.M.; Philp, P.; OBrien, N.R.; Rodriguez, H.L. Unconventional Resources Assessment of La Luna Formation in the Middle Magdalena Valley Basin, Colombia. In Proceedings of the AAPG Annual Convention & Exhibition, Denver, CO, USA, 31 May–3 June 2015. [Google Scholar]
  30. Agencia Nacional de Hidrocarburos, Colombia. Catatumbo. Available online: https://www.anh.gov.co/es/hidrocarburos/oportunidades-disponibles/procesosde-seleccion/ronda-colombia-2010/tipo-1/catatumbo/ (accessed on 5 November 2023).
  31. Veiga, R.; Dzelalija, F. A Regional Overview of the La Luna Formation and the Villeta Group as Shale Gas/Shale Oil in the Catatumbo, Magdalena Valley and Eastern Cordillera Regions, Colombia. Am. Assoc. Pet. Geol. Search Discov. Artic. 2014, 10565, 21. [Google Scholar]
  32. Cabello, P.; Lopez, C.; Gamba, N.; Dussán, M.I.; Torres, E.; Ballesteros-Torres, C.I.; Ramos, E. An integrated approach to define new plays in mature oil basins: The example from the Middle Magdalena Valley basin (Colombia). AAPG Bull. 2018, 102, 2201–2238. [Google Scholar] [CrossRef]
  33. Memon, S.; Feng, R.; Ali, M.; Bhatti, M.A.; Giwelli, A.; Keshavarz, A.; Sarmadivaleh, M. Supercritical CO2-Shale interaction induced natural fracture closure: Implications for scCO2 hydraulic fracturing in shales. Fuel 2022, 313, 122682. [Google Scholar] [CrossRef]
  34. He, J.; Li, X.; Yin, C.; Zhang, Y.; Lin, C. Propagation and characterization of the micro cracks induced by hydraulic fracturing in shale. Energy 2020, 191, 116449. [Google Scholar] [CrossRef]
  35. Wilkins, R.W.; George, S.C. Coal as a source rock for oil: A review. Int. J. Coal Geol. 2002, 50, 317–361. [Google Scholar] [CrossRef]
  36. Ganat, T.A.A.O. Fundamentals of Reservoir Rock Properties; Springer: Cham, Switzerland, 2020; pp. 978–983. [Google Scholar]
  37. Zhang, Y.; Zhao, Y.; Long, A.; Wang, C.; Bi, J. Combined effects of bedding anisotropy and matrix heterogeneity on hydraulic fracturing of shales from Changning and Lushan, South China: An experimental investigation. J. Asian Earth Sci. 2024, 259, 105908. [Google Scholar] [CrossRef]
  38. Isaac, O.T.; Pu, H.; Oni, B.A.; Samson, F.A. Surfactants employed in conventional and unconventional reservoirs for enhanced oil recovery—A review. Energy Rep. 2022, 8, 2806–2830. [Google Scholar] [CrossRef]
  39. Gupta, I.; Rai, C.; Devegowda, D.; Sondergeld, C.H. Fracture hits in unconventional reservoirs: A critical review. SPE J. 2021, 26, 412–434. [Google Scholar] [CrossRef]
  40. Aslannezhad, M.; Kalantariasl, A.; You, Z.; Iglauer, S.; Keshavarz, A. Micro-proppant placement in hydraulic and natural fracture stimulation in unconventional reservoirs: A review. Energy Rep. 2021, 7, 8997–9022. [Google Scholar] [CrossRef]
  41. Wang, S.; Chen, S. Insights to fracture stimulation design in unconventional reservoirs based on machine learning modeling. J. Pet. Sci. Eng. 2019, 174, 682–695. [Google Scholar] [CrossRef]
  42. Liu, Y.; Wu, K.; Jin, G.; Moridis, G.; Kerr, E.; Scofield, R.; Johnson, A. Fracture-hit detection using LF-DAS signals measured during multifracture propagation in unconventional reservoirs. SPE Reserv. Eval. Eng. 2021, 24, 523–535. [Google Scholar] [CrossRef]
  43. Yekeen, N.; Padmanabhan, E.; Idris, A.K.; Chauhan, P.S. Nanoparticles applications for hydraulic fracturing of unconventional reservoirs: A comprehensive review of recent advances and prospects. J. Pet. Sci. Eng. 2019, 178, 41–73. [Google Scholar] [CrossRef]
  44. Gandossi, L.; Von Estorff, U. An overview of hydraulic fracturing and other formation stimulation technologies for shale gas production. Eur. Commisison Jt. Res. Cent. Tech. Rep. 2013, 1, 26347. [Google Scholar]
  45. Ibañez-Gómez, L.F.; Albarracín-Quintero, S.; Céspedes-Zuluaga, S.; Montes-Páez, E.; Ando Junior, O.H.; Carmo, J.P.; Ribeiro, J.E.; Moreira, M.M.A.; Siqueira, A.A.G.; Guerrero-Martin, C.A. Process optimization of the flaring gas for field applications. Energies 2022, 15, 7655. [Google Scholar] [CrossRef]
  46. Zhang, H.; Eaton, D. Source Mechanisms of Hydraulic-Fracturing Induced Event Sequences in the Fox Creek Area. Microseismic Ind. Consort. Annu. Res. Rep. 2017, 8, 391–396. [Google Scholar]
  47. Zhang, H.; Eaton, D.W.; Rodriguez, G.; Jia, S.Q. Source-Mechanism Analysis and Stress Inversion for Hydraulic-Fracturing-Induced Event Sequences near Fox Creek, Alberta. Bull. Seismol. Soc. Am. 2019, 109, 636–651. [Google Scholar] [CrossRef]
  48. Schultz, R.; Atkinson, G.; Eaton, D.W.; Gu, Y.J.; Kao, H. Hydraulic fracturing volume is associated with induced earthquake productivity in the Duvernay play. Science 2018, 359, 304–308. [Google Scholar] [CrossRef] [PubMed]
  49. Liu, Y.; Xu, H.; Tang, D.; Mathews, J.P.; Zhai, Y.; Hou, W.; Wang, W. The impact of the coal macrolithotype on reservoir productivity, hydraulic fracture initiation and propagation. Fuel 2019, 239, 471–483. [Google Scholar] [CrossRef]
  50. Del Petróleo, A.C. Los Yacimientos no Convencionales y su Importancia para Colombia; Mayo: Bogota, Colombia, 2014. [Google Scholar]
  51. Ahamed, M.A.A.; Perera, M.S.A.; Li, D.-Y.; Ranjith, P.G.; Matthai, S.K. Proppant damage mechanisms in coal seam reservoirs during the hydraulic fracturing process: A review. Fuel 2019, 253, 615–629. [Google Scholar] [CrossRef]
  52. Yao, S.; Chang, C.; Hai, K.; Huang, H.; Li, H. A review of experimental studies on the proppant settling in hydraulic fractures. J. Pet. Sci. Eng. 2022, 208, 109211. [Google Scholar] [CrossRef]
  53. Barboza, B.R.; Chen, B.; Li, C. A review on proppant transport modelling. J. Pet. Sci. Eng. 2021, 204, 108753. [Google Scholar] [CrossRef]
  54. Wanniarachchi, W.A.M.; Ranjith, P.G.; Perera, M.S.A.; Rathnaweera, T.D.; Zhang, C.; Zhang, D.C.; Li, L. An experimental study of two-phase flow behaviour through pipes and hydraulically fractured rock specimens. Exp. Therm. Fluid Sci. 2019, 102, 325–341. [Google Scholar] [CrossRef]
  55. Glossary, S.O. Oilfield Glossary. 2020. Available online: https://glossary.slb.com/ (accessed on 5 November 2023).
  56. Huang, Q.; Liu, S.; Wang, G.; Wu, B.; Zhang, Y. Coalbed methane reservoir stimulation using guar-based fracturing fluid: A review. J. Nat. Gas Sci. Eng. 2019, 66, 107–125. [Google Scholar] [CrossRef]
  57. Kang, W.; Mushi, S.J.; Yang, H.; Wang, P.; Hou, X. Development of smart viscoelastic surfactants and its applications in fracturing fluid: A review. J. Pet. Sci. Eng. 2020, 190, 107107. [Google Scholar] [CrossRef]
  58. Nygaard, K.J. Estimulación Hidráulica y Tecnología de Completamiento para Pozos no Convencionales de Lutitas; Agencia Nacional de Hidrocarburos: Bogotá, Colombia, 2012. [Google Scholar]
  59. Guerrero-Martin, C.A.; Montes-Pinzon, D.; Meneses Motta da Silva, M.; Montes-Paez, E.; Guerrero-Martin, L.E.; Salinas-Silva, R.; Camacho-Galindo, S.; Lucas, E.F.; Szklo, A. Asphaltene Precipitation/Deposition Estimation and Inhibition through Nanotechnology: A Comprehensive Review. Energies 2023, 16, 4859. [Google Scholar] [CrossRef]
  60. Li, S.; Zhang, D. How effective is carbon dioxide as an alternative fracturing fluid? SPE J. 2019, 24, 857–876. [Google Scholar] [CrossRef]
  61. McAdams, B.C.; Carter, K.E.; Blotevogel, J.; Borch, T.; Hakala, J.A. In situ transformation of hydraulic fracturing surfactants from well injection to produced water. Environ. Sci. Process. Impacts 2019, 21, 1777–1786. [Google Scholar] [CrossRef] [PubMed]
  62. Wang, D.; Li, S.; Zhang, D.; Pan, Z. Understanding and predicting proppant bedload transport in hydraulic fracture via numerical simulation. Powder Technol. 2023, 417, 118232. [Google Scholar] [CrossRef]
  63. Davoodi, S.; Al-Shargabi, M.; Wood, D.A.; Rukavishnikov, V.S. A comprehensive review of beneficial applications of viscoelastic surfactants in wellbore hydraulic fracturing fluids. Fuel 2023, 338, 127228. [Google Scholar] [CrossRef]
  64. Ishak, K.E.H.K.; Khan, J.A.; Padmanabhan, E.; Ramalan, N.H.M. Friction reducers in hydraulic fracturing fluid systems—A review. AIP Conf. Proc. 2023, 2682, 030004. [Google Scholar]
  65. Smilovich, D.; Baldini, M.; Celleri, H.M.; Gutiérrez, J.; Gallana, I.; Castez, M.F.; Serebrinsky, S. A pseudo-transient-based staggered algorithm for hydraulic fracturing simulations in the absence of a fluid lag. Comput. Geotech. 2023, 155, 105202. [Google Scholar] [CrossRef]
  66. Luo, M.; Yang, H.; Wang, K.; Song, F.; He, Y.; Zhang, Y.; Zhong, C. Coupling iron-carbon micro-electrolysis with persulfate advanced oxidation for hydraulic fracturing return fluid treatment. Chemosphere 2023, 313, 137415. [Google Scholar] [CrossRef]
  67. Shen, Y.; Sun, Y.; Zhang, G.; Qi, Y.; Shan, H.; Li, B. Numerical investigation of fracturing fluid invasion into hydrate reservoirs during hydraulic-fracturing stimulation. Energy Rep. 2023, 9, 3160–3176. [Google Scholar] [CrossRef]
  68. Awejori, G.; Jupudi, H.; Massion, C.; Radonjic, M. Study on Advanced Cementing Practices Using Inert Graphene Nanoplatelets and Hydraulic Fracturing Fluids for Wellbore Integrity and Sustainability. In TMS 2023 152nd Annual Meeting & Exhibition Supplemental Proceedings; Springer Nature: Cham, Switzerland, 2023; pp. 1225–1236. [Google Scholar]
  69. Zhang, D.; Yi, L.; Yang, Z.; Li, X.; Zhang, F. Phase field model for simulating hydraulic fracture propagation and oil–water two-phase flow in reservoir. Comput. Methods Appl. Mech. Eng. 2023, 404, 115838. [Google Scholar] [CrossRef]
  70. He, P.; Lu, Z.; Deng, Z.; Huang, Y.; Qin, D.; Ouyang, L.; Li, M. An advanced hydraulic fracturing technique: Pressure propagation and attenuation mechanism of step rectangular pulse hydraulic fracturing. Energy Sci. Eng. 2023, 11, 299–316. [Google Scholar] [CrossRef]
  71. Liu, Z.; Wang, S.; Ye, H.; Yang, L.; Feng, F.; Lian, H.; Yang, D. Experimental study on the effects of pre-cracks, fracturing fluid, and rock mechanical characteristics on directional hydraulic fracturing with axial pre-cracks. Geomech. Geophys. Geo-Energy Geo-Resour. 2021, 7, 29. [Google Scholar] [CrossRef]
  72. Tong, S.; Gu, M.; Singh, R.; Mohanty, K.K. Proppant transport in foam fracturing fluid during hydraulic fracturing. J. Pet. Sci. Eng. 2019, 182, 106279. [Google Scholar] [CrossRef]
  73. Thomas, L.; Tang, H.; Kalyon, D.M.; Aktas, S.; Arthur, J.D.; Blotevogel, J.; Young, M.H. Toward better hydraulic fracturing fluids and their application in energy production: A review of sustainable technologies and reduction of potential environmental impacts. J. Pet. Sci. Eng. 2019, 173, 793–803. [Google Scholar] [CrossRef]
  74. Wang, J.; Zhou, F.; Bai, H.; Li, Y.; Yang, H. A Comprehensive method to evaluate the viscous slickwater as fracturing fluids for hydraulic fracturing applications. J. Pet. Sci. Eng. 2020, 193, 107359. [Google Scholar] [CrossRef]
  75. Fu, C.; Liu, N. Waterless fluids in hydraulic fracturing—A review. J. Nat. Gas Sci. Eng. 2019, 67, 214–224. [Google Scholar] [CrossRef]
  76. Li, Q.; Jew, A.D.; Kohli, A.; Maher, K.; Brown, G.E., Jr.; Bargar, J.R. Thicknesses of chemically altered zones in shale matrices resulting from interactions with hydraulic fracturing fluid. Energy Fuels 2019, 33, 6878–6889. [Google Scholar] [CrossRef]
  77. Lozano, T.M.; McCutchan, A.L.; Krzmarzick, M.J. Hydraulic fracturing fluid compositions induce differential enrichment of soil bacterial communities. Environ. Eng. Sci. 2019, 36, 385–395. [Google Scholar] [CrossRef]
  78. Liu, J.; Sheng, J.J.; Emadibaladehi, H.; Tu, J. Experimental study of the stimulating mechanism of shut-in after hydraulic fracturing in unconventional oil reservoirs. Fuel 2021, 300, 120982. [Google Scholar] [CrossRef]
  79. Khan, H.J.; Spielman-Sun, E.; Jew, A.D.; Bargar, J.; Kovscek, A.; Druhan, J.L. A critical review of the physicochemical impacts of water chemistry on shale in hydraulic fracturing systems. Environ. Sci. Technol. 2021, 55, 1377–1394. [Google Scholar] [CrossRef] [PubMed]
  80. Liu, Z.; Zhao, J.; Li, Y.; Zeng, Z.; Mao, J.; Peng, Y.; He, Y. Low-temperature sintering of bauxite-based fracturing proppants containing CaO and MnO2 additives. Mater. Lett. 2016, 171, 300–303. [Google Scholar] [CrossRef]
  81. Ren, Q.; Ren, Y.; Li, H.; Wu, X.; Bai, W.; Zheng, J.; Hai, O. Preparation and characterization of high silicon ceramic proppants using low grade bauxite and fly ash. Mater. Chem. Phys. 2019, 230, 355–361. [Google Scholar] [CrossRef]
  82. Haque, M.H.; Saini, R.K.; Sayed, M.A. Nano-composite resin coated proppant for hydraulic fracturing. In Proceedings of the Offshore Technology Conference 2019, Houston, TX, USA, 9 May 2019. [Google Scholar]
  83. Fernandez, C.; Vicente, V. Auditorías Medioambientales. Guía Metodológica; Ediciones Mundi-Prensa: Madrid, Spain, 1997. [Google Scholar]
  84. Ramesh, M.; Deepa, C.; Kumar, L.R.; Sanjay, M.R.; Siengchin, S. Life-cycle and environmental impact assessments on processing of plant fibres and its bio-composites: A critical review. J. Ind. Text. 2022, 51, 5518S–5542S. [Google Scholar] [CrossRef]
  85. Gök, A.; Sodhi, N. The environmental impact of governance: A system-generalized method of moments analysis. Environ. Sci. Pollut. Res. 2021, 28, 32995–33008. [Google Scholar] [CrossRef] [PubMed]
  86. Thiel, C.L.; Woods, N.C.; Bilec, M.M. Strategies to reduce greenhouse gas emissions from laparoscopic surgery. Am. J. Public Health 2018, 108, S158–S164. [Google Scholar] [CrossRef]
  87. Johnston, J.E.; Enebish, T.; Eckel, S.P.; Navarro, S.; Shamasunder, B. Respiratory health, pulmonary function and local engagement in urban communities near oil development. Environ. Res. 2021, 197, 111088. [Google Scholar] [CrossRef]
  88. Ajide, F.M.; Soyemi, K.A.; Oladipupo, S.A. Business climate and environmental degradation: Evidence from Africa. Environ. Dev. Sustain. 2023, 1–27. [Google Scholar] [CrossRef]
  89. Kour, R.; Singh, S.; Sharma, H.B.; Naik, T.S.S.K.; Shehata, N.; Pavithra, N.; Ramamurthy, P.C. Persistence and remote sensing of agri-food wastes in the environment: Current state and perspectives. Chemosphere 2023, 317, 137822. [Google Scholar] [CrossRef]
  90. Bilal, M.; Iqbal, H.M.; Barceló, D. Persistence of pesticides-based contaminants in the environment and their effective degradation using laccase-assisted biocatalytic systems. Sci. Total Environ. 2019, 695, 133896. [Google Scholar] [CrossRef]
  91. Morero, B.; Rodriguez, M.B.; Campanella, E.A. Environmental impact assessment as a complement of life cycle assessment. Case study: Upgrading of biogas. Bioresour. Technol. 2015, 190, 402–407. [Google Scholar] [CrossRef] [PubMed]
  92. Li, C.; Liu, F.; Tan, X.; Du, Y. A methodology for selecting a green technology portfolio based on synergy. Int. J. Prod. Res. 2010, 48, 7289–7302. [Google Scholar] [CrossRef]
  93. Lemaire, G.; Franzluebbers, A.; de Faccio Carvalho, P.C.; Dedieu, B. Integrated crop–livestock systems: Strategies to achieve synergy between agricultural production and environmental quality. Agric. Ecosyst. Environ. 2014, 190, 4–8. [Google Scholar] [CrossRef]
  94. Talukdar, A.; Bhattacharya, S.; Bandyopadhyay, A.; Dey, A. Microplastic pollution in the Himalayas: Occurrence, distribution, accumulation and environmental impacts. Sci. Total Environ. 2023, 874, 162495. [Google Scholar] [CrossRef] [PubMed]
  95. Wiens, J.A.; Parker, K.R. Analyzing the effects of accidental environmental impacts: Approaches and assumptions. Ecol. Appl. 1995, 5, 1069–1083. [Google Scholar] [CrossRef]
  96. Kan, M.; Miller, S.A. Environmental impacts of plastic packaging of food products. Resour. Conserv. Recycl. 2022, 180, 106156. [Google Scholar] [CrossRef]
  97. Jackson, R.B.; Lowry, E.R.; Pickle, A.; Kang, M.; DiGiulio, D.; Zhao, K. The depths of hydraulic fracturing and accompanying water use across the United States. Environ. Sci. Technol. 2015, 49, 8969–8976. [Google Scholar] [CrossRef] [PubMed]
  98. Cheng, Y.; Zhang, Y. Hydraulic fracturing experiment investigation for the application of geothermal energy extraction. ACS Omega 2020, 5, 8667–8686. [Google Scholar] [CrossRef]
  99. Garavito, A.; Garavito-Acosta, A.L.; Montes-Uribe, E.; Toro-Córdoba, J.H.; Agudelo-Rivera, C.; Corredor-Alfonso, V.A.; Zárate-Solano, H.M. Ingresos externos corrientes de Colombia: Desempeño exportador, avances y retos. Rev. Ens. Sobre Política Económica 2020, 95, 1–81. [Google Scholar] [CrossRef]
  100. Hooghiemstra, H.; Pérez, G.S.; Torres Torres, V.; Berrío, J.C.; Lourens, L.; Flantua, S.G. 60 years of scientific deep drilling in Colombia: The North Andean guide to the Quaternary. Sci. Drill. 2022, 30, 1–15. [Google Scholar] [CrossRef]
  101. Barrero, D.; Pardo, A.; Vargas, C.; Martínez, J. Colombian Sedimentary Basins; Editorial Agencia Nacional de Hidrocarburos: Bogotá, Colombia, 2007. Available online: https://www.anh.gov.co/documents/12/colombian_sedimentary_basins.pdf (accessed on 5 November 2023).
  102. Colletta, B.; Hebrard, F.; Letouzey, J.; Werner, P.; Rudkiewicz, J. Tectonic style and crustal structure of the Eastern Cordillera (Colombia) from a balanced cross section. In Petroleum and Tectonics in Mobile Belts; Letouzey, J., Ed.; Technip: Paris, France, 1990; pp. 81–100. [Google Scholar]
  103. Agencia Nacional de Hidrocarburos. Informe de Gestión; 2022. Available online: https://www.anh.gov.co/documents/21271/Informe_de_gesti%C3%B3n_2022.pdf (accessed on 8 August 2019).
  104. Lopez, A.; Los Llanos Orientales, el Foco de la Reactivación Petrolera. El Portafolio. Available online: https://www.portafolio.co/economia/los-llanos-orientales-el-foco-de-la-reactivacion-petrolera-532402 (accessed on 8 August 2019).
  105. Agencia Nacional de Hidrocarburos. Informe de Gestión 2021; 186p. 2021. Available online: https://www.anh.gov.co/documents/1177/Informe_de_gesti%C3%B3n_2021.pdf (accessed on 13 January 2020).
  106. ANH. Estadísticas de Producción, Producción Mensual de Hidrocarburos. 2023. Available online: https://www.anh.gov.co/es/operaciones-y-regal%C3%ADas/sistemas-integrados-operaciones/estad%C3%ADsticas-de-producci%C3%B3n/ (accessed on 13 January 2020).
  107. Fox, K.A.; Lefsrud, L.M. The ecology of regulatory change: The security and exchange commission’s modernization of oil and gas reserves reporting. Resour. Policy 2021, 72, 102072. [Google Scholar] [CrossRef]
  108. Vicknair, D.; Tansey, M.; O’Brien, T.E. Measuring fossil fuel reserves: A simulation and review of the US Securities and Exchange Commission approach. Resour. Policy 2022, 79, 103028. [Google Scholar] [CrossRef]
  109. Ecopetrol. En 2022 con 2.011 MBPE, el Grupo Ecopetrol Logró las Reservas de Petróleo y Gas Más Altas en 8 Años. Bogotá, Columbia. 24 February 2023. Available online: https://www.ecopetrol.com.co/wps/portal/Home/es/noticias/detalle/en-2022-el-Grupo-Ecopetrol-incremento-sus-reservas-probadas-de-hidrocarburos#:~:text=Al%20cierre%20de%202022%2C%20las,equivale%20a%208%2C4%20a%C3%B1os (accessed on 13 January 2020).
  110. Hernández, J. Irene Vélez: “Queremos que Colombia Lidere la Integración Eléctrica Latinoamericana”. El País. Available online: https://elpais.com/america-colombia/2022-10-23/irene-velez-queremos-que-colombia-lidere-la-integracion-electrica-latinoamericana.html (accessed on 23 October 2022).
  111. Upme. Balance de Gas Natural en Colombia 2015–2023, Unidad de Planeación Minero-Energética. 29p, 2023. Available online: https://www1.upme.gov.co/Hidrocarburos/publicaciones/BALANCE_GAS_NATURAL_FINAL.pdf (accessed on 13 January 2020).
  112. ANH Agencia Nacional de Hidrocarburos de la República de Colombia. Informe de Reservas y Recursos Contingentes de Hidrocarburos. Available online: https://www.anh.gov.co/documents/21617/Informe_de_Reservas__y_Recursos_Contingentes_de_Hidrocarburos_2022_pfMyhzQ.pdf (accessed on 24 May 2023).
  113. Ríos-Ocampo, J.P.; Arango-Aramburo, S.; Larsen, E.R. Renewable energy penetration and energy security in electricity markets. Int. J. Energy Res. 2021, 45, 17767–17783. [Google Scholar] [CrossRef]
  114. Henao, F.; Dyner, I. Renewables in the optimal expansion of colombian power considering the Hidroituango crisis. Renew. Energy 2020, 158, 612–627. [Google Scholar] [CrossRef]
  115. Lee, C.C.; Xing, W.; Lee, C.C. The impact of energy security on income inequality: The key role of economic development. Energy 2022, 248, 123564. [Google Scholar] [CrossRef]
  116. Ecopetrol-ANH (Agencia Nacional de Hidrocarburos). Pronóstico de Producción de Petróleo. Available online: https://boletinmineroenergetico.uexternado.edu.co/analisis-tecnico-de-las-reservas-de-hidrocarburos-de-colombia/ (accessed on 13 January 2020).
  117. Sanz, J. ANH Señaló la Existencia de Otro Tipo de Yacimiento no Convencional en el País. 2021. Available online: https://www.elespectador.com/economia/anh-senalo-la-existencia-de-otro-tipo-de-yacimiento-no-convencional-en-el-pais-article/ (accessed on 13 January 2020).
  118. Tatomir, A.; McDermott, C.; Bensabat, J.; Class, H.; Edlmann, K.; Taherdangkoo, R.; Sauter, M. Conceptual model development using a generic Features, Events, and Processes (FEP) database for assessing the potential impact of hydraulic fracturing on groundwater aquifers. Adv. Geosci. 2018, 45, 185–192. [Google Scholar] [CrossRef]
  119. Zoback, M.D.; Kohli, A.H. Unconventional Reservoir Geomechanics; Cambridge University Press: Cambridge, UK, 2019. [Google Scholar]
  120. Ellafi, A.; Jabbari, H.; Tomomewo, O.S.; Mann, M.D.; Geri, M.B.; Tang, C. Future of hydraulic fracturing application in terms of water management and environmental issues: A critical review. In Proceedings of the SPE Canada Unconventional Resources Conference, Virtual, 28 September–2 October 2020; p. D053S011R001. [Google Scholar]
  121. Belyadi, H.; Fathi, E.; Belyadi, F. Hydraulic Fracturing in Unconventional Reservoirs: Theories, Operations, and Economic Analysis; Gulf Professional Publishing: Houston, TX, USA, 2019. [Google Scholar]
  122. Ali, M.; Jarni, H.H.; Aftab, A.; Ismail, A.R.; Saady NM, C.; Sahito, M.F.; Sarmadivaleh, M. Nanomaterial-based drilling fluids for exploitation of unconventional reservoirs: A review. Energies 2020, 13, 3417. [Google Scholar] [CrossRef]
  123. Zhang, Z.; Mao, J.; Yang, X.; Zhao, J.; Smith, G.S. Advances in waterless fracturing technologies for unconventional reservoirs. Energy Sources Part A Recovery Util. Environ. Eff. 2019, 41, 237–251. [Google Scholar] [CrossRef]
  124. Kurniadi, S.D.; Ryan, A.; Hamidon, Z.R. Strategy for Reducing Environmental Footprint of Hydraulic Fracturing Operations through Engineering Excellence and Operational Efficiency. In Proceedings of the SPE International Hydraulic Fracturing Technology Conference and Exhibition, Muscat, Oman, 12–14 September 2023. [Google Scholar]
  125. Wang, M.; Cheng, H.; Wei, J.; Zhang, K.; Cadasse, D.; Qin, Q. High-temperature-resistant, clean, and environmental-friendly fracturing fluid system and performance evaluation of tight sandstone. J. Environ. Public Health 2022, 2022, 5833491. [Google Scholar] [CrossRef]
  126. Essien, A.E.; White, K.; Mohammadi, M. Interrelationship study of the impacts of hydraulic fracturing on the environment and socioeconomic activities: A novel approach to finding sustainable solutions. Environ. Sci. Adv. 2022, 1, 305–319. [Google Scholar] [CrossRef]
  127. Caldwell, J.A.; Williams, C.K.; Brittingham, M.C.; Maier, T.J. A consideration of wildlife in the benefit-costs of hydraulic fracturing: Expanding to an E3 analysis. Sustainability 2022, 14, 4811. [Google Scholar] [CrossRef]
  128. Zhou, H.; Huang, X.; Jiang, L.; Shen, Q.; Sun, H.; Yi, M.; Tang, J. Improved degradation of petroleum contaminants in hydraulic fracturing flowback and produced water using laccase immobilized on functionalized biochar. Environ. Technol. Innov. 2023, 32, 103280. [Google Scholar] [CrossRef]
  129. Tao, Z.; Liu, C.; He, Q.; Chang, H.; Ma, J. Detection and treatment of organic matters in hydraulic fracturing wastewater from shale gas extraction: A critical review. Sci. Total Environ. 2022, 824, 153887. [Google Scholar] [CrossRef] [PubMed]
  130. Badjadi, M.A.; Zhu, H.; Zhang, C.; Naseem, M.H. Enhancing Water Management in Shale Gas Extraction through Rectangular Pulse Hydraulic Fracturing. Sustainability 2023, 15, 10795. [Google Scholar] [CrossRef]
  131. Vengosh, A.; Jackson, R.B.; Warner, N.; Darrah, T.H.; Kondash, A. A critical review of the risks to water resources from unconventional shale gas development and hydraulic fracturing in the United States. Environ. Sci. Technol. 2014, 48, 8334–8348. [Google Scholar] [CrossRef]
  132. Soeder, D.J. Groundwater quality and hydraulic fracturing: Current understanding and science needs. Groundwater 2018, 56, 852–858. [Google Scholar] [CrossRef]
  133. Chittick, E.A.; Srebotnjak, T. An analysis of chemicals and other constituents found in produced water from hydraulically fractured wells in California and the challenges for wastewater management. J. Environ. Manag. 2017, 204, 502–509. [Google Scholar] [CrossRef]
  134. Yazdan, M.M.S.; Ahad, M.T.; Jahan, I.; Mazumder, M. Review on the evaluation of the impacts of wastewater disposal in hydraulic fracturing industry in the United States. Technologies 2020, 8, 67. [Google Scholar] [CrossRef]
  135. Useche-Narvaez, C.; Montes-Páez, E.G.; Guerrero-Martin, C.A. Evaluation of the carbon footprint produced by conventional artificial lift systems in a Colombian field. J. Petrol. Sci. Eng. 2022, 208, 108865. [Google Scholar] [CrossRef]
  136. Elliott, E.G.; Ettinger, A.S.; Leaderer, B.P.; Bracken, M.B.; Deziel, N.C. A systematic evaluation of chemicals in hydraulic-fracturing fluids and wastewater for reproductive and developmental toxicity. J. Expo. Sci. Environ. Epidemiol. 2017, 27, 90–99. [Google Scholar] [CrossRef] [PubMed]
  137. Hwang, B.; Heo, J.; Lim, C.; Park, J. Environmental Implications of Shale Gas Hydraulic Fracturing: A Comprehensive Review on Water Contamination and Seismic Activity in the United States. Water 2023, 15, 3334. [Google Scholar] [CrossRef]
  138. Wang, X.; Utting, N.; Reid, M.S.; Jiang, C.; Alessi, D.S.; Han, J.; Sun, C. Spatial and temporal water chemistry variations of hydraulic fracturing flowback and produced waters from the Duvernay Formation. Appl. Geochem. 2023, 155, 105704. [Google Scholar] [CrossRef]
  139. Jin, B.; Han, M.; Huang, C.; Arp, H.P.H.; Zhang, G. Towards improved characterization of the fate and impact of hydraulic fracturing chemicals to better secure regional water quality. Environ. Sci. Process. Impacts 2022, 24, 497–503. [Google Scholar] [CrossRef]
  140. Shi, H.; He, X.; Zhou, C.; Wang, L.; Xiao, Y. Hydrochemistry, Sources and Management of Fracturing Flowback Fluid in Tight Sandstone Gasfield in Sulige Gasfield (China). Arch. Environ. Contam. Toxicol. 2023, 84, 284–298. [Google Scholar] [CrossRef] [PubMed]
  141. Wu, F.; Zhou, Z.; Zhang, S.; Cheng, F.; Tong, Y.; Li, L.; You, J. Toxicity identification evaluation for hydraulic fracturing flowback and produced water during shale gas exploitation in China: Evidence from tissue residues and gene expression. Water Res. 2023, 120170. [Google Scholar] [CrossRef] [PubMed]
  142. Jiang, W.; Xu, X.; Hall, R.; Zhang, Y.; Carroll, K.C.; Ramos, F.; Xu, P. Characterization of produced water and surrounding surface water in the Permian Basin, the United States. J. Hazard. Mater. 2022, 430, 128409. [Google Scholar] [CrossRef] [PubMed]
  143. Gholami, R.; Raza, A.; Iglauer, S. Leakage risk assessment of a CO2 storage site: A review. Earth-Sci. Rev. 2021, 223, 103849. [Google Scholar] [CrossRef]
  144. Guo, Y.; Li, P.; He, X.; Wang, L. Groundwater quality in and around a landfill in northwest China: Characteristic pollutant identification, health risk assessment, and controlling factor analysis. Expo. Health 2022, 14, 885–901. [Google Scholar] [CrossRef]
  145. Siddiqua, A.; Hahladakis, J.N.; Al-Attiya, W.A.K. An overview of the environmental pollution and health effects associated with waste landfilling and open dumping. Environ. Sci. Pollut. Res. 2022, 29, 58514–58536. [Google Scholar] [CrossRef]
  146. Preslo, L.; Miller, M.; Suyama, W.; McLearn, M.; Kostecki, P.; Fleischer, E. Available remedial technologies for petroleum contaminated soils. In Petroleum Contaminated Soils; CRC Press: Boca Raton, FL, USA, 2021; Volume I, pp. 115–125. [Google Scholar]
  147. Vaverková, M.D.; Elbl, J.; Koda, E.; Adamcová, D.; Bilgin, A.; Lukas, V.; Zloch, J. Chemical composition and hazardous effects of leachate from the active municipal solid waste landfill surrounded by farmlands. Sustainability 2020, 12, 4531. [Google Scholar] [CrossRef]
  148. Wilson, I.; Saini, S.; Sreenivasan, H.; Sahu, C.; Krishna, S.; Gupta, P. Review and Perspectives of Energy-Efficient Methane Production from Natural Gas Hydrate Reservoirs Using Carbon Dioxide Exchange Technology. Energy Fuels 2023, 37, 9841–9872. [Google Scholar] [CrossRef]
  149. Brauers, H. Natural gas as a barrier to sustainability transitions? A systematic mapping of the risks and challenges. Energy Res. Soc. Sci. 2022, 89, 102538. [Google Scholar] [CrossRef]
  150. Soeder, D.J. Fracking and the Environment: A Scientific Assessment of the Environmental Risks from Hydraulic Fracturing and Fossil Fuels. Springer: Berlin/Heidelberg, Germany, 2021; pp. 79–92. [Google Scholar]
  151. Zhang, Y.; Rupp, J.A.; Graham, J.D. Contrasting public and scientific assessments of fracking. Sustainability 2021, 13, 6650. [Google Scholar] [CrossRef]
  152. Meng, Q. The Impacts of Fracking on Climate Change. In Handbook of Climate Change Mitigation and Adaptation; Springer International Publishing: Cham, Switzerland, 2022; pp. 3225–3236. [Google Scholar]
  153. Kueppers, L.M.; Baer, P.; Harte, J.; Haya, B.; Koteen, L.E.; Smith, M.E. A decision matrix approach to evaluating the impacts of land-use activities undertaken to mitigate climate change. Clim. Chang. 2004, 63, 247–257. [Google Scholar] [CrossRef]
  154. Holz-Rau, C.; Scheiner, J. Land-use and transport planning—A field of complex cause-impact relationships. Thoughts on transport growth, greenhouse gas emissions and the built environment. Transp. Policy 2019, 74, 127–137. [Google Scholar] [CrossRef]
  155. Gillingham, K.; Stock, J.H. The cost of reducing greenhouse gas emissions. J. Econ. Perspect. 2018, 32, 53–72. [Google Scholar] [CrossRef]
  156. Mohsin, M.; Kamran, H.W.; Nawaz, M.A.; Hussain, M.S.; Dahri, A.S. Assessing the impact of transition from nonrenewable to renewable energy consumption on economic growth-environmental nexus from developing Asian economies. J. Environ. Manag. 2021, 284, 111999. [Google Scholar] [CrossRef]
  157. Allshouse, W.B.; McKenzie, L.M.; Barton, K.; Brindley, S.; Adgate, J.L. Community noise and air pollution exposure during the development of a multi-well oil and gas pad. Environ. Sci. Technol. 2019, 53, 7126–7135. [Google Scholar] [CrossRef]
  158. Johnston, J.; Cushing, L. Chemical exposures, health, and environmental justice in communities living on the fenceline of industry. Curr. Environ. Health Rep. 2020, 7, 48–57. [Google Scholar] [CrossRef]
  159. Bolden, A.L.; Schultz, K.; Pelch, K.E.; Kwiatkowski, C.F. Exploring the endocrine activity of air pollutants associated with unconventional oil and gas extraction. Environ. Health 2018, 17, 1–17. [Google Scholar] [CrossRef] [PubMed]
  160. Wollin, K.M.; Damm, G.; Foth, H.; Freyberger, A.; Gebel, T.; Mangerich, A.; Hengstler, J.G. Critical evaluation of human health risks due to hydraulic fracturing in natural gas and petroleum production. Arch. Toxicol. 2020, 94, 967–1016. [Google Scholar] [CrossRef] [PubMed]
  161. Madejski, P.; Różycki, S.; Banaś, M.; Pająk, T. Selected aspects of coal gasification for application in low-emission energy technologies. Min.–Inform. Autom. Electr. Eng. 2021, 59, 31–39. [Google Scholar] [CrossRef]
  162. Nemitallah, M.A.; Abdelhafez, A.A.; Ali, A.; Mansir, I.; Habib, M.A. Frontiers in combustion techniques and burner designs for emissions control and CO2 capture: A review. Int. J. Energy Res. 2019, 43, 7790–7822. [Google Scholar]
  163. Tran, K.V.; Casey, J.A.; Cushing, L.J.; Morello-Frosch, R. Residential proximity to hydraulically fractured oil and gas wells and adverse birth outcomes in urban and rural communities in California (2006–2015). Environ. Epidemiol. 2021, 5, e172. [Google Scholar] [CrossRef] [PubMed]
  164. Banan, Z.; Gernand, J.M. Emissions of particulate matter due to Marcellus Shale gas development in Pennsylvania: Mapping the implications. Energy Policy 2021, 148, 111979. [Google Scholar] [CrossRef]
  165. Holloway, M.D. Fracking: Further Investigations into the Environmental Considerations and Operations of Hydraulic Fracturing; John Wiley & Sons: Hoboken, NJ, USA, 2018. [Google Scholar]
  166. Selent, S. The Heterogeneous Impacts of Fracking on the Environmental Kuznets Curve. Ph.D. Thesis, Miami University, Miami, FL, USA, 2023. [Google Scholar]
  167. Xu, M. The Socioeconomic Consequences of the US Fracking Boom. Ph.D. Thesis, University of Illinois at Urbana-Champaign, Champaign, IL, USA, 2018. [Google Scholar]
Figure 1. Valle Magdalena Medio Basin (number 16 in yellow) [15,16].
Sustainability 16 02063 g001
Figure 2. Stages of the hydraulic stimulation process [49].
Sustainability 16 02063 g002
Figure 3. Effect of viscosity on fracture geometry and proppant positioning. (a) Entry of the proppant into the fracture created. (b) Expansion of the proppant in the generated permeable channel. Source: Schlumberger Oilfield Glossary [57,58].
Sustainability 16 02063 g003
Figure 4. Categorization of positive and negative impact.
Sustainability 16 02063 g004
Figure 5. Categorization of impact by degree of incidence.
Sustainability 16 02063 g005
Figure 6. Categorization of impact manifestation time.
Sustainability 16 02063 g006
Figure 7. Classification of environmental impacts according to their duration.
Sustainability 16 02063 g007
Figure 8. VOSviewer tool Scopus basic view.
Sustainability 16 02063 g008
Figure 9. Heat map: keywords searched concerning environmental impacts and environmental complexity of the exploration and production chain of unconventional reservoirs.
Sustainability 16 02063 g009
Figure 10. Spider graph of environmental impacts (Soil excavation), resulting from the Conesa methodology.
Sustainability 16 02063 g010
Table 1. Types of additives and their function [58,59,60].
AdditivesFunction
Gelling agentsThey increase viscosity, reduce formation creep, and decrease fluid friction.
Cross-linkersIncrease the viscosity of the gel formed.
Fluid-loss additivesOptimize the action of the gelling agents by reducing the infiltration of fracturing fluid into the formation.
Friction reducersDecrease fluid friction.
BreakersThey are responsible for breaking the gel formed and reducing the viscosity of the fluid, with the objective of helping in the next step of cleaning the fracture.
SurfactantsThey facilitate the cleaning treatment, reducing the wettability of the rock.
StabilizersAdditives such as sodium thiosulfate and methanol are used to avoid possible unwanted reactions.
FibersDecrease the settling velocity of the proppants, resulting in a better filling of the fracture interior and, consequently, in a higher conductivity.
Table 2. Propellant properties [76,77,78,79].
Type of PropellantDensity (g/cm3)Crush Resistance (psi)
Pure sand2.65<6000
Resin-coated sand (RCS)255<8000
Intermediate-strength proppants (ISP)2.7 a 3.35000 a 10,000
High-strength bauxite (HSB)3.4 ou superior>10,000
Bauxite2>7000
Table 3. Criteria of periodicity, associating rating range, and rating value.
CriteriaRating RangeRating Value
Intensity (IN)Low1
Half2
High4
Very High8
Total12
Table 4. Extension ranking range and rating value.
CriteriaRating RangeRating Value
Extension (EX)Punctual1
Partial2
Extensive4
Total8
Criticism12
Table 5. Value and range of qualification of the extension in the evaluation of environmental impacts.
CriteriaRating RangeRating Value
Moment (MO)Punctual1
Partial2
Extensive4
Total8
Criticism12
Table 6. Value and range of qualification of the Persistence in the evaluation of environmental impacts.
CriteriaRating RangeRating Value
Persistence (PE)Fleeting1
Temporary2
Permanent4
Table 7. Value and range of qualification of the Reversibility in the evaluation of environmental impacts.
CriteriaRating RangeRating Value
Reversibility (RV)Short-term1
Medium-term2
Irreversible4
Table 8. Value and range of qualification of Synergy in the evaluation of environmental impacts.
CriteriaRating RangeRating Value
Synergy (SY)Without synergism (simple)1
Synergist2
Very Synergic4
Table 9. The criteria, qualification range, and rating value of the accumulation (AC) of moment in Environmental Impact assessment.
CriteriaRating RangeRating Value
Accumulation (AC)Simple 1
Cumulative4
Table 10. The criteria, qualification range, and rating value of the effect (EF) of moment in Environmental Impact assessment.
CriteriaRating RangeRating Value
Effect (EF)Indirect 1
Cumulative4
Table 11. The criteria, qualification range, and rating value of the Accumulation of moment in Environmental Impact assessment.
CriteriaRating RangeRating Value
Frequency (FR)Irregular and discontinuos1
Periodic Continuous2
4
Table 12. The criteria, qualification range, and rating value of the Recoverability (RE) of moment in Environmental Impact assessment.
CriteriaRating RangeRating Value
Frequency (FR)Immediately recoverable1
Recoverable in the medium term2
Mitigable4
Irrecoverable8
Table 13. Weighting value of qualitative criteria in the Conesa methodology.
VariablesRating RangeWeighting Percentage
ININTENSITY1–1223.1–36%
EXEXTENSION1–1215.4–24%
MOMOMENT1–87.7–10%
PEPERSISTENCE1–47.7–10%
RVREVERSIBILITY1–4 7.7–10%
SYSYNERGY1–47.7–10%
ACACCUMULATION1–4 7.7–10%
EFEFFECT1–47.7–10%
FRFREQUENCY1–47.7–10%
RERECOVERABILITY1–87.7–10%
Table 14. Weighting of criteria for assigning environmental impact risks in energy projects.
Criteria Rating Value
INTENSITY (IN)Low1
Half2
High4
Very High8
Total12
EXTENSION (EX)Punctual1
Partial2
Extensive4
Total8
Criticism12
MOMENT (MO)Long-Term1
Medium-Term2
Immediate4
Critical8
PERSISTENC (PE)Fleeting1
Temporary2
Permanent4
REVERSIBILITY (RV)Short-Term1
Medium-Term2
Irreversible4
SYNERGY (SY)Without Synergism (Simple)1
Synergic2
Very Synergic4
ACCUMULATION (AC)Simple1
Cumulative4
EFFECT (EF)Indirect1
Direct4
FREQUENCY (FR)Irregular and discontinuous1
Periodic2
Continuous4
RECOVERABILITY (RE)Immediately recoverable1
Recoverable in the medium term2
Mitigable4
Irrecoverable8
AGGREGATED IMPORTANCE (I)Low<25
Moderate25 to <50
Severe50 to 75
Critical>−75
Table 15. Matrix of environmental impacts on hydraulic fracturing in the Middle Magdalena Valley basin in Colombia [97,98,99,100,101,102,103,104,105,106,107,108,109,110,111,112,113,114,115,116,117,118,119,120,121,122,123,124,125,126,127,128,129,130,131,132,133,134,135,136,137,138,139,140].
AreaActivitiesDescription of the ActivityPotential IMPACTSOccurrenceControl Measures
Building the primary phase of the project Deforestation Reforestation with local plants.
Removal of natural plant coverBiodiversity loss Sound contention wall.
Fauna displacement Re-faunalization of the area, creation of animal preservation areas.
Changing soil properties Organic matter filling, addition of carbonates and bentonites.
Construction of access roads Hearing contamination Temporary retaining walls.
Soil ExcavationContamination of water sources with extracted material Gutter construction.
Air contamination with particulate matter Periodic air quality measurements, installation of air purifiers in the region.
Modification of the Earth’s geo-forms Backfilling of sedimentary material in situ.
Embankment constructionTerrain stability Compensated and compacted fillings.
Restitution of removed soil
Construction of surface facilities Removal of vegetation coverForest involvement Forest restoration.
Fauna displacement Revegetation with native plants.
Habitat alteration Reforesting the area.
Soil ExcavationDestruction of the habitat of microorganisms Install the extracted soil in a green area to avoid damage.
Air contamination by particulate material Periodic measurement and air purification.
Soil instability Soil fills with material like the soil in the region.
Hearing Contamination Sound walls.
Transportation of machinery, equipment, and supplies.Contamination of surface waters adjacent to the area due to chemical spillages. Hydrological studies that indicate the effects on water dynamics and measures to correct the effects on them.
Particulate matter survey Periodic air quality measurements, installation of air purifiers in the region.
Hearing contamination Sound walls.
Mobilizing and assembling equipment on siteAssembling the derrick, containers, waste pools, and fluid storage tanks.Wildlife displacement Revegetation with native plants.
Solid waste generation Transport of materials preferably to inert recovery and recycling facilities.
Drilling and Completion Subsoil instability Containment Structures.
Hearing contamination Insulated walls.
Sand removalWildlife displacement Revegetation.
Well drillingWater consumptionPressure on water resources, increasing scarcity rates Reuse of urban wastewater with prior treatment.
Drilling Mud injectionPollution of water sources and soil Gutter construction. Pool of tailings and drill cuttings, for subsequent treatment and use as input for allowance.
Supply of wastewater boreholes and cutsSolid particle generationSoil pollution Monitoring the volume of fluid contained in swimming pools. Acting on a mitigation plan.
Generating wastewater with chemical contentResource pollution Implementation of more environmentally friendly chemicals.
Lining and cementing the well walls Air pollution Records to confirm cement adhesion.
Gas Leak
Groundwater pollution High-quality cement between the walls of the well and the pipe.
Hydraulic fracturingInjection of water mixed with chemicalsWater consumptionPressure on water resources, increase in the scarcity index Reuse of urban wastewater with prior treatment.
Presence of chemical substancesPollution of water resources Treatment plants.
Generation of heavy metals and radioactive materials of natural originPollution of groundwater resources Pipe integrity tests, cement, and cement adhesion to the formation.
Fracture fluid returnFiltering the fluid with chemical substancesAir and water pollution Records to confirm cement adhesion.
Generation of wastewater contaminated with chemical substancesPollution of water resources Location of treatment stations, periodic measurement of water pollutant values, and safety valve system to prevent flow of polluted fluid.
Waste disposal in pools and tanks Excess residual fluidPollution of soil and water sources adjacent to the area Monitoring the volume of fluid contained in pools. Methodology for the constant disposal of waste ponds.
Air pollution Gas emission control network; strategies for reducing natural gas emissions; Systems for converting natural gas into energy (GTW Gas-To-Wire technology).
Evaporation of minor constituents present in the fluidSurface water pollution Construction of gutters, water treatment for waste disposal, water treatment for livestock consumption and crops.
Disclaimer/Publisher’s Note: The statements, opinions and data contained in all publications are solely those of the individual author(s) and contributor(s) and not of MDPI and/or the editor(s). MDPI and/or the editor(s) disclaim responsibility for any injury to people or property resulting from any ideas, methods, instructions or products referred to in the content.

