Article

Sustainable Development of Mining Regions in the Arctic Zone of the Russian Federation

1
Department of Economic Theory, Empress Catherine II Saint Petersburg Mining University, 2, 21st Line, Saint Petersburg 199106, Russia
2
Organization and Management Department, Empress Catherine II Saint Petersburg Mining University, 2, 21st Line, Saint Petersburg 199106, Russia
*
Author to whom correspondence should be addressed.
Sustainability 2024, 16(5), 2060; https://doi.org/10.3390/su16052060
Submission received: 4 February 2024 / Revised: 25 February 2024 / Accepted: 27 February 2024 / Published: 1 March 2024
(This article belongs to the Special Issue Circular Economy and Mining Ecology Management)

Abstract

:
The Arctic’s specific conditions require increased attention to natural and human capital. Therefore, implementing the principles of the sustainable development concept, balancing economic, social, and environmental goals is of paramount importance. Mining is at the heart of the strategy for the socio-economic development of Russia’s Arctic territories. This study’s objective is topical: to justify measures lifting the restrictions on sustainable development of AZRF (the Arctic Zone of the Russian Federation) mining regions. The authors propose a method to identify AZRF regions where mining determines the socio-economic development level (Komi Republic, Nenets Autonomous District, Yamalo-Nenets Autonomous District, Yakutia, and Chukotka Autonomous District). The multi-factor regression analysis conducted confirms the hypothesis that living standards and achievement of social standards in the AZRF mining regions depend on the income and fiscal capacity levels, which makes the state more responsible for the region’s development. The authors prove the expediency of reconsidering the proportions of rental income redistributed between the budgets of the AZRF mining regions and the federal budget in favor of the former, until migration and natural population growth become positive and reach the target indicators of strategies of socio-economic development. The study’s results can be used to justify the state policy while elaborating strategies for AZRF development.

1. Introduction

The sustainable development concept has long been the focus of academic and applied research. R.K. Singh and his colleagues [1] list 80 indices for assessing sustainability in different aspects of development. The number of interpretations and methods of sustainability assessment is growing along with the development of countries’ socio-economic systems and new geopolitical and climatic challenges. Cultural differences between countries, large differentiation of countries by socio-economic development, demographic situation, industrial structure, and the position in the international division of labor result in various understandings of the sustainable development concept and different priorities in achievement of sustainable development goals (SDGs). Today, the humanization of ideology gives way to resources issues and the ability to access them. For example, in 2022, several coal-fired power stations resumed operation in Germany, the green energy “flagship”, in order to replace Russian gas (https://www.bloomberg.com/news/articles/2022-12-22/germany-returns-to-coal-as-energy-security-trumps-climate-goals?srnd=premium-europe (accessed on 13 January 2024). Austria, France, Germany, Greece, Hungary, Italy, the Netherlands, Spain, and the UK have taken measures to extend the service life of coal-fired power plants, re-commission shutdown power plants, and increase power generation (https://inosmi.ru/20230114/ugol-259681827.html, https://ria.ru/20230412/ugol-1864635228.html (accessed on 18 September 2023). However, coal is considered a “dirty fuel”, and its use is considered a sign of a brown economy.
Geopolitical events show that Russia’s natural resource potential ensures not only socio-economic development of the country but also safeguarding national interests under the changes in the existing world order [2]. The mining industry gives a basis to develop relations with the existing and potential partner countries to facilitate global negotiations and conclude long-term agreements on a wide range of cooperation areas.
Thus, AZRF (the Arctic Zone of the Russian Federation) sustainable development becomes a priority area for Russia’s state policy. The Arctic is a macro-region with the richest resource and military-strategic potential (https://www.interfax.ru/interview/722243, https://russtrat.ru/reports/20-dekabrya-2020-1614-2511, https://russiancouncil.ru/analytics-and-comments/analytics/voennye-aspekty-pozitsii-rossii-v-arktike/ (accessed on 10 September 2023)). Therefore, not only the Arctic states (Canada, Denmark, Finland, Iceland, Norway, Russia, Sweden, and the United States (The list of Arctic states was approved at a meeting of ministers and plenipotentiaries in Ottawa, Canada, in 1996. It resulted in signing the Declaration on the establishment of the Arctic Council. The Arctic (circumpolar) countries are countries whose territories are crossed by the 66th parallel north: Canada, Denmark, Finland, Iceland, Norway, Russia, and the USA.)) focus on the Arctic but so do 13 observer states including China, India, and Japan [3,4,5].
The mining industry determines the core of the strategy for socio-economic development of the Arctic territories of the Russian Federation [6]. Moreover, the development of the mining industry has a multiplicative effect contributing to development of technologies, processing facilities, machine building, shipbuilding, logistics, and all types of infrastructure.
The differences in climate in the AZRF regions, level of their socio-economic development, resource potential, and structure of industrial production determine the guidelines of the state policy for sustainable development. The Arctic’s specific conditions require increased attention to natural and human capital [7]. Therefore, implementing the provisions of the sustainable development concept and balancing economic, social, and environmental goals are of paramount importance.
Today, implementation of large long-term investment and infrastructure projects appears to be hampered amid the aggravating geopolitical situation and sanction restrictions. Therefore, the state policy should, first of all, aim at developing measures enabling medium- and short-term effects.
It is hypothesized that living standards and the achievement of social standards in the AZRF mining regions depend not only on the income level, but also on the fiscal capacity level, which makes the state more responsible for the development of regions.
Study objectives: to justify measures lifting the restrictions on sustainable development for the AZRF mining regions in the present-day conditions.
  • To achieve the objectives, the following tasks were defined:
  • To elucidate a method to determine the territories with high sectoral concentration of GRP structure, where the GRP (GRP means the gross regional product. It is a generalizing indicator of regional economic activity characterizing the process of production of goods and services for final consumption. Simultaneously, GRP is the gross value added generated by residents of a region and is defined as the difference between output and intermediate consumption. https://rosstat.gov.ru/statistics/accounts (accessed on 9 August 2023)) sectoral structure is not likely to change in the mid-term; and, as a result of the analysis, to identify the AZRF regions where the mining industry plays a decisive role in compiling GRP;
  • To determine the restrictions on sustainable development for the AZRF mining territories;
  • To test the hypothesis in order to conduct a multi-factor regression analysis of the impact of income and fiscal capacity on the poverty level in the AZRF regions.

2. Literature Review

The sustainable development concept is considered to have emerged in the 1970s and 1980s. However, the fundamentals of the sustainable development concept date back to the works of ancient philosophers. Since ancient times, mankind has been trying to understand and define the principles of human development, society, and justice. In the philosophy of Chinese Buddhism, the source of human “suffering” (dissatisfaction, fear) is the pursuit of pleasure; the way to get rid of it lies in the right action, right speech, and right way of life. Confucianism offers an ideal state system based on the moral qualities of a ruler-subordinate, father-son. The doctrine of Taoism assumes the unity of the world as a whole, of man, and of the cosmos. Many ancient philosophers like Democritus, Socrates, Plato, etc., put great emphasis on the interaction between nature and man, while cognition and knowledge was the way to safety. For the Cynics and Stoics, happiness can be reached through harmony with nature. Thus, already in Oriental and ancient philosophy, we can see the early stages of the sustainable development concept, where priority was given to moral attitudes, justice, and responsibility [8,9,10].
The emergence of the concept of sustainable development close to the modern interpretation is associated with the name of Thomas Robert Malthus (an English scientist and priest). In An Essay on the Principle of Population (1798), Thomas Robert Malthus considered the issue of population growth under conditions of limited resources, pointing out that the population grew in arithmetic progression, while the consumption of food and other resources increased in geometric progression [11]. The theory of overpopulation was developed in Marxist theory. In 1910, Karl Kautsky, a representative of Marxist theory, noted that “as man’s dominance over nature increases, so does the tendency to upset its equilibrium” [12]. Later ideas of Thomas Robert Malthus were reflected in the Club of Rome’s (The Club of Rome is an informal international public organization founded at the initiative of Aurelio Peccei in 1968. The Club of Rome is engaged in research on models of human development. Aurelio Peccei was an Italian industrialist, economist, and social activist) report “The Limits to Growth” (1972) [13].
Works of V.I. Vernadsky are rightly considered to have made a significant contribution to the development of the theoretical foundations of the sustainable development concept and Russian cosmism. Vladimir Vernadsky outlined the concept of stability of life (1926). His theory of the biosphere, later the noosphere (The noosphere concept was introduced by Édouard Le Roy and Pierre Teilhard de Chardin in 1920s), claimed that humans were a “geological force” transforming the planet and, as a consequence, should be responsible for its development and preservation [14,15,16,17]. The noospheric approach was further developed in the works of V.G. Gorshkov, A.D. Ursul, N.N. Moiseev, K.S. Losev, and others [18,19,20,21,22,23,24,25].
Traditional economic science sees economic growth as the key to achieving general welfare, both in a particular country and in the world. The economic system plays the central role in the shift to global prosperity and is the source of environmental and social issues. Therefore, the quality of the economic system development determines the possibilities of their settlement [26,27]. GDP indicates the level of economic development, which is essentially the level of consumption in each country. According to the World Bank, since the 1970s, the rate of world gross product has been sharply increasing. In the last 50 years (from 1970 to 2022), the world GDP increased almost 34-fold [28].
Increased production, progress in science and technology, and the emergence of new industries have not led to universal prosperity, thus widening the discrepancy in quality of life both among and within countries (Figure 1) [29].
High growth rates of the world economy required an ever greater consumption of natural resources, which resulted in an increase in the manmade impact and environmental concerns. According to NASA, human activity has increased atmospheric CO2 concentrations by 48% over the past 170 years from pre-industrial values reached by 1850. This is more than what occurred naturally over a period of 20,000 years [30].
By the middle of the 20th century, the economic system development based on the biosphere degradation, the limited capacity of the biosphere and, as a consequence, possible environmental and demographic disasters, created the prerequisites to revise the traditional development model, the goal of which would be quantitative economic growth. In 2010, Joseph E. Stiglitz, Amartya Sen, and Jean-Paul Fitoussi published the report “Mismeasuring Our Lives: Why GDP Doesn’t Add Up” of the Commission on the Measurement of Economic Performance and Social Progress (CMEPSP) and made a conclusion: “GDP is an inadequate metric to gauge well-being over time particularly in its economic, environmental, and social dimensions... Time has come to adapt our system of measurement of economic activity to better reflect the structural changes which have characterized the evolution of modern economies” [31].
At the first stage of its evolution, the concept of sustainable development was predominantly ecocentric. The 1972 United Nations Conference on the Human Environment in Stockholm can be considered the beginning of the transition to the sustainable development concept. The adopted Declaration focused on settlement of environmental issues, recognizing that humanity was responsible for the state of the environment. The 26 principles of the Declaration proclaimed the ideas of equality, the fight against poverty, the need to manage demographic processes, providing assistance to developing countries, and the preservation of natural resources. However, sustainable development of humanity had not yet been discussed [32].
An important stage in the evolution of the sustainable development concept was the publication of the report “Limits to Growth” in 1972 by Donella H. Meadows, Dennis L. Meadows, Jørgen Randers, and William W. Behrens III, commissioned by the Club of Rome. Based on the works of Jay Forrester, the American scientist and the author of the system dynamics theory, the authors of the Report proposed 12 scenarios of human development. The modeling results showed that humanity was threatened to face a global crisis as a result of overpopulation, increased production exceeding the capacity of the biosphere, and biosphere degradation. Donella Meadows and her colleagues noted that strict birth control was required in addition to technological breakthroughs and social changes for implementation of favorable development scenarios (Later, the authors adjusted the scenarios of the Limits to Growth report in their works: Model World3 1992, model World3 2004, and model World4 2012). The authors justified the need for “zero growth”, a theory according to which it was necessary to restrain industrial production and consumption, this stabilizing the population while reducing the exploitation of natural resources [13].
The theory of the “golden billion” appeared. It stated that stability and decent living standards could be ensured if the world population did not exceed 1 billion people [33].
In 1974, Eduard Pestel and Mihajlo Mesarovic presented the report Mankind at the Turning Point at the Club of Rome [34]. They proposed the theory of “organic growth” instead of “zero growth”. According to the new theory, each element of the world economic system, i.e., each country, should fulfill its organic function in a biological system. In fact, the theory consolidated the established architecture of the world division of labor, creating prerequisites for the development of neocolonialism implemented through transnational corporations [35].
Thus, the proponents of the ecocentric approach believed that natural capital (natural resources and environmental services) should be preserved/not diminished, and the limits of economic development were constrained by the biosphere capacity. Environmental sustainability could be reached through limiting consumption and, as a consequence, reducing or ceasing economic growth.
The anthropocentric approach was developed in response to environmental issues (increasing manmade impact, decreasing biodiversity, climate changes, etc.). Studies by the following scientists can be highlighted within the anthropocentric approach: N.D. Kondratyev [36], T. Page [37], D.W. Pearce, R.K. Turner [38,39,40], Robert Solow [41,42,43,44], Joseph E. Stiglitz [31,45], John M. Hartwick [46], and others. The anthropocentric paradigm was originally grounded in the philosophy of the consumer society, according to which: scientific and technological advancement was the core of economic growth and was the way to achieve sustainable development; and meeting the increasing demands of society was the first priority, regardless of the biosphere capacity and the need to preserve it for future generations. According to the representatives of the anthropocentric approach, non-renewable resources could be replaced with human and artificial capital and the reduction of one type of natural resource could be compensated with another, preserving the “critical value” of natural resources. N.D. Kondratyev’s studies showed that the economic system developed cyclically, and each subsequent growth phase was preceded by significant changes in the technosphere caused by innovation and scientific and technological advancements [36]. Robert Solow considered that technological changes were closely connected with the improvement of the quality of human capital by improving educational characteristics [41,42].
Environmental concerns, climate change, and the limited capacity of ecosystems remain global issues today. According to the Global Footprint Network (GFN), since the 1970s, the world economy has been using resources and producing waste in quantities that the planet cannot renew [47].
The present situation has resulted in awareness of the need to change the paradigm of humanity’s development, predetermining the transition to the triad approach to solving global challenges of mankind. The triad concept of sustainable development implies a regulated balanced development where the social and economic spheres and the biosphere are not opposed to each other but develop in a balanced way and are not competing goals.
In 1987, Edward Barbier published his study The Concept of Sustainable Economic Development. In it, he recognized that “goals of environmental conservation and economic development are not conflicting and can be reinforcing each other” [48]. In the same year, the Brundtland Commission (formerly the United Nations World Commission on Environment and Development founded in 1983) published its report “Our Common Future”, introduced the term “sustainable development” for the very first time, and gave the following definition: “sustainable development is development that meets the needs of the present generation without compromising the ability of future generations to meet their own needs”. In 1992, the term was institutionalized at the United Nations Conference on Environment and Development (UNCED), or Earth Summit, in Rio de Janeiro. This definition is the most quoted today. It was highlighted that the biosphere degradation was closely linked to the level of social and economic development of countries, emphasizing the responsibility to the future generations so as not to worsen their situation [49].
N. N. Moiseev wrote that “the future generations should have the same potential to use the planet’s resources as the generations now living” [24].
In 2000, the UN General Assembly adopted the Millennium Declaration, which defined the MDGs (Millennium Development Goals). The MDGs primarily aimed at eliminating disparities in the quality of life and helping the world’s poorest countries to eliminate hunger and poverty, ensure universal primary education and gender equality, reduce child mortality, fight diseases (AIDS, malaria, etc.), achieve environmental sustainability, and develop international cooperation in achieving the MDGs [50]. However, the MDGs “failed to consider the holistic nature of development as well as the root causes of global challenges such as poverty, gender inequality etc.” [51].
In 2015, the UN complemented and expanded the MDGs. In 2015, the UN adopted the development agenda “Transforming our world: the 2030 Agenda for Sustainable Development” [52]. The document proposed 17 interconnected sustainable development goals (SDGs), which could be divided into four groups: social (1–5, 10), environmental (6, 13–15), economic (7–9, 12), and institutional (11, 16, 17).
Unlike the MDGs, the SDGs are universal for all countries, disregarding their level of socio-economic development, technosphere development, industrial structure, and environmental situation.
The present stage of development of the sustainable development concept is characterized by the following trends: numerous agreements and strategies on sustainable development, environmental protection; climate change issues have been adopted and are being adopted at the international and national levels, and social movements and non-profit organizations are emerging. A vast experience of international cooperation has been accumulated, and appropriate mechanisms and institutions have been established.
The number of published materials on sustainable development in the Arctic has increased. Analysis of publications in the Scopus database shows that as of 26 January 2024, 56% of works were published in the period from 2020 to present.
Leading Arctic research centers publish papers on a variety of issues connected with the region’s development: the Federal Research Center “Kola Science Center of the Russian Academy of Sciences” (Russia), Luzin Institute for Economic Studies (Russia), Ohio State University (Columbus, OH, USA), David Taylor Research Center (Annapolis, MD, USA), University of Lapland (Rovaniemi, Finland), Norwegian Polar Institute (Tromsø, Norway), University of Stavanger (Stavanger, Norway), Center for Autonomous Marine Operations and Systems (Trondheim, Norway), The Center for Ships and Ocean Structures (Trondheim, Norway), Norwegian University of Science and Technology (NTNU, Trondheim, Norway), Acadia University (Wolfville, NS, Canada), University of Ottawa (Canada), etc.
Among the papers on issues of sustainable development of the Russian Arctic, it is worth highlighting the works by S. A. Dyatlov, Ye. G. Yefimova, V. P. Zhuravel, L. V. Ivanova, F. D. Larichikin, V. S. Selin, D. F. Skripnyuk, S. V. Fedoseyev, V. A. Zuckerman, V. I. Cherenkov, and A. Ye. Cherepovitsyn.
The efficient transition to sustainable development greatly depends on international cooperation and implementation of the concept of provisions by all countries. The provisions of the sustainable development concept, which constitute an ideology defining the goals and directions of human development, require further development and study [53,54,55,56,57,58].

3. Materials and Methods

The following methods were used for studying conditions and restrictions on sustainable development of the AZRF mining regions: a systematic approach to analyze and compare the results, methods of economic and statistical analysis, synthesis, induction and deduction, and quantitative methods of data collection.
Statistical processing and graphical data representation were done using the software Statistica 12.0 (software: Statistica 12 64-bit (version 12.5.192.7), StatSoft Inc.; Windows Server 2012 R2 Standard operating system, 64-bit (Microsoft Corporation), 2013; equipment: Lenovo, 10110, X86-Based PC; location: St. Petersburg, Russia).
Adherence to the principles of objectivity and systematicity of the study and the principle of reproducibility of the results meant that the temporal analysis should be limited to the data of the Federal State Statistics Service of the Russian Federation for the period 2012–2021. The method of scientific abstraction was used to study and generalize the materials of fundamental and applied research of Russian and foreign authors on sustainable development issues, materials of relevant agencies, ministries, and information Internet portals of the studied regions.
Information Internet portals of the AZRF regions (accessed on 15 August 2023):
The method choice was based on the study objectives: to identify regions with a high sectoral concentration of GRP structure and to identify the AZRF regions where the mining industry plays a key role in the strategies of socio-economic development; and to find the restrictions on sustainable development of the AZRF mining regions and to justify the measures lifting those restrictions, which would accelerate transition to a sustainable development model within intensified natural resource development in the AZRF.
The main documents defining the strategies and directions of the AZRF public policy are as follows:
  • The President of Russia’s decree No. 164 “Basic Principles of Russian Federation State Policy in the Arctic to 2035”, dated 5 March 2020;
  • The President of Russia’s decree No. 645 “On the Development Strategy of the Arctic Zone of the Russian Federation and Ensuring National Security for the Period until 2035”, dated 26 October 2020;
  • The Resolution of the Government of the Russian Federation No. 326 “On the approval of the State Program of the Russian Federation ‘Environmental Protection’”, dated 15 April 2014;
  • The Resolution of the Government of the Russian Federation No. 316 “On the approval of the State Program of the Russian Federation ‘Economic Development and Innovative Economy’”, dated 15 April 2014;
  • The Resolution of the Government of the Russian Federation No. 304“On the approval of the State Program of the Russian Federation ‘Development of Shipbuilding and Technology for the Development of Offshore Fields’”, dated 15 April 2014;
  • The Resolution of the Government of the Russian Federation No. 314 “On the approval of the State Program of the Russian Federation ‘Development of the Fisheries Complex’”, dated 15 April 2014;
  • The Resolution of the Government of the Russian Federation No. 506-12 “On the approval of the State Program of the Russian Federation ‘Development of Nuclear Power and Industry Complex’”, dated 2 June 2014;
  • The Resolution of the Government of the Russian Federation No. 321 “On the approval of the State Program of the Russian Federation ‘Energy Efficiency and Energy Development’”, dated 15 April 2014;
  • The Resolution of the Government of the Russian Federation No. 1596 “On the approval of the State Program of the Russian Federation ‘Development of the Transport System’”, dated Wednesday, 20 December 2017;
  • And others.
The AZRF territory is characterized by a great differentiation of natural-climatic, socio-economic, cultural, and living conditions, development of all types of infrastructure, dispersion of settlement pattern in the regions, and the structure of industrial production. The mining industry creates added value in all regions but has variable effects on GRP, regional development, and quality of life.
The Herfindahl–Hirschman Sectoral Index (HHIo) can be used to identify areas where the mining industry will play a defining role in income generation in the short and medium term.
The Herfindahl–Hirschman Index (HHI) is used in economics to measure market monopolization (i.e., concentration). The HHI is calculated by squaring the market share of each company operating in a market and then summarizing the resulting numbers. A market with an HHI over 1800 is considered to be a highly concentrated market, an HHI of 1000 to 1800 is moderately concentrated, and an HHI of less than 1000 indicates low concentration.
The authors believe that the same principle can be applied to identify regions with a high sectoral concentration of GRP structure, where the sectoral structure of GRP is not likely to change in the medium term, by modifying the HHI as follows:
H H I o = i = 1 n S i 2
where HHIo is the Herfindahl–Hirschman Sectoral Index and
Si is a share of i industry (activity type by the Russian National Classifier of Types of Economic Activity (OKVED), data of the Federal State Statistics Service of the Russian Federation) in GRP, %.
The proposed methodology allows us to identify regions with a high sectoral concentration of GRP structure, where the sectoral structure of the regional income is not likely to change in the medium term. Therefore, the state policy directions should focus on the potential of the key industry as the latter determines the level of the regional socio-economic development in the current period. Application of the methodology developed by the authors has restrictions: it can be used as an auxiliary since the system of measures proposed by the analysis results should not contradict the long-term strategies of regional socio-economic development.

4. Results

Today, the AZRF is a region whose development is of strategic importance both for the country’s economy and for national interests in general. This is due to a number of reasons. 1. The region has the richest resource base: minerals (oil, gas, rare earth minerals, gold, diamonds, etc.) and forest and water resources. 2. The reduction of the Arctic Ocean ice cover triggers development not only for fisheries but also for the Northern Sea Route (NSR) [59]. High-latitude transportation and communication routes in the Arctic, including the NSR, will prevail. According to the Integrated Development Plan for the Northern Sea Route up to 2035, cargo traffic by the NSR will total 80 million tons by 2024, 150 million tons by 2030, and 220 million tons by 2035. 3. Military and strategic importance of the Arctic. The current geopolitical situation does not guarantee further protection by international conventions and the UN rules.
Climate change brings a wide range of new development opportunities and risks to the AZRF. Over the last 60 years, air temperature in the Arctic increased 2.5 times faster than the Earth’s average (Figure 2).
In 1961–2021, the increase in air temperature totaled 1.08 °C for the globe as a whole and 2.49 °C for above 60 degrees north latitude [60]. Climate mitigation gives the potential for NSR development with respective consequences: increased cargo transportation, development of all types of infrastructure, job creation, logistic advantages over the Suez Canal and related geopolitical and economic effects, strengthening of the region’s military-strategic potential [59], and easier access to Arctic mineral resources (https://nauka.tass.ru/nauka/6816897 (accessed on 18 September 2023)) [61].
However, climate change also leads to negative outcomes [62]:
  • The damage from permafrost degradation and related processes now exceeds 300 billion rubles per year (USD 3.27 bn) (The international forum “Russian Energy Week 2023” https://rg.ru/2023/10/24/reg-szfo/kak-v-arktike-adaptiruiutsia-k-izmeneniiam-klimata.html (accessed on 04 January 2024)).
  • Permafrost thawing has caused damage to 22–100% of buildings and structures in the AZRF [63]. In addition, extraction of mineral resources becomes riskier as extractive infrastructure built at high sunk costs gets into a rundown condition [64]. Permafrost thawing damages agriculture. For example, negative phenomena are observed on 60% of all agricultural land in Sakha Republic (Yakutia) [65];
  • The rapidly changing cryosphere negatively affects ecosystems throughout the Arctic by altering productivity, seasonality, distribution, and species interactions in terrestrial, coastal, and marine ecosystems [66];
  • Risk of release of methane, frozen viruses, and radioactive materials (https://www.hse.ru/news/603865629.html (accessed on 10 September 2023));
  • For indigenous peoples, climate change is leading to reduced food security due to difficulties in accessing traditional foods, difficulties in reindeer breeding, and reduced hunting and fishing opportunities [67,68,69];
  • Melting ice leads to the loss of a huge amount of information from expeditions that have been working in the Arctic since the 16th century (https://ria.ru/20130923/965318168.html (accessed on 10 September 2023)).
Arctic resource development and NSR development have led to an increase in the manmade impact, which results in increased attention to the issues of rational use of land resources and environmental protection. Thus, “the ecological module of the Arctic spatial development becomes particularly relevant due to the biosphere’s limited capacity, the high vulnerability of Arctic landscapes, and their low recovery rate. It should be primarily considered upon elaborating scenarios for the Arctic space development” [70].
All Arctic states focus on the environmental and economic issues in the Arctic as they benefit most from regional development and therefore bear the primary responsibility for the results. The Arctic policies of the circumpolar countries share common goals for international cooperation on the economic development of the region and its environmental protection. However, countries implement environmental policies taking into account their national interests.
The Arctic states, international observers from non-Arctic countries, and a number of international public organizations are members of the Arctic Council. The latter coordinates international cooperation in ecology and environmental protection. In 2016, the European countries adopted the EU Arctic Policy, reflecting the interests of European countries.
There is a system of international conventions and declarations governing international cooperation in the Arctic in the following areas:
  • Hydrocarbon resource development: International Convention on Civil Liability for Oil Pollution Damage, International Convention on the Establishment of an International Fund for Compensation for Oil Pollution Damage, Convention on the Prevention of Marine Pollution by Dumping of Wastes and Other Matter, International Convention for the Prevention of Pollution from Ships, Convention on Civil Responsibility for Oil Pollution Damage from seabed mineral exploration and development. In 1992, the International Fund for Compensation for Oil Pollution Damage was established to accumulate funds from companies transporting oil by sea;
  • Law of the Sea: United Nations Convention on the Law of the [71];
  • Use and protection of Arctic marine waters: The Ilulissat Declaration [72];
  • Waste and fuel discharges: Polar Code [73].
Some Arctic territories and waters have no clear jurisdiction. The absence of a settled legal regime for the Arctic results in non-binding compliance with international treaties, while international cooperation becomes sensitive to geopolitical processes. Today, the Russian Federation cooperates with other circumpolar countries only within joint activities in international organizations responsible for environmental protection and rational use of land resources [74].
It is worth noting that the main achievement of international cooperation in the Arctic is the fact that all Arctic countries have recognized the global level of the issues of ecosystem degradation and resource base depletion.
The authors considered the institutional climate, the issues of harmonization of the system of socio-economic interests in the AZRF, and the negative effect of industrial and transport development on the environment and the traditional way of life of the Arctic indigenous peoples in [7].
The mining industry is the backbone of the economy of the constituent entities of the Russian Federation entering the AZRF [6]. Table 1 provides information about the main types of minerals in AZRF, their reserves, and production.
For AZRF development, the following state programs and measures were adopted: environmental protection, economic development and innovation economy, development of shipbuilding and equipment for offshore fields, development of the fishery complex, the nuclear power industry, the energy sector, and development of the transport system.
The following documents and decrees were adopted in 2020–2022: the President of Russia’s decree No. 164 “Basic Principles of Russian Federation State Policy in the Arctic to 2035”, dated 5 March 2020; the President of Russia’s decree No. 645 “On the Development Strategy of the Arctic Zone of the Russian Federation and Ensuring National Security for the Period until 2035”, dated 26 October 2020, which, in fact, establish the raw material nature of AZRF development; the federal act on state support for entrepreneurial activity in the Arctic Zone of the Russian Federation; the State Program “Social and Economic Development of the Arctic Zone of the Russian Federation”; and the Integrated Development Plan for the Northern Sea Route up to 2035. AZRF regulatory control continues to improve, but is characterized by a lack of harmonization of norms and laws (https://www.dvfu.ru/schools/engineering/structure/research-and-education-centers/international_scientific_educational_center_r_d_center_arktika/foresight-study-of-the-development-of-arctic-offshore-industry-up-to-2030/?show_desktop_mode=true#_Toc448776185 (accessed on 4 November 2023)).
The region is developing rapidly: 4 out of 9 AZRF regions are included in the group of regions with a high level of investment attractiveness (Table 2) [75]. Six out of nine Arctic regions are in the group of regions leading active and moderately active sustainable development policies (Table 3). GRP, average wages, and average income are growing; and industrial, logistics, and infrastructure projects are also being implemented. Table 4, Table 5, Table 6, Table 7 and Table 8 show data on GRP, average wages, average income, poverty level, and population.
Since 2018, the Project Office for Arctic Development (PORA) and the Faculty of Economics of Lomonosov Moscow State University have published the “Polar Index. Regions” rating. The rating methodology considers the sustainable development theory. The calculation considers indicators for three blocks: socio-economic, ecological-economic, and socio-environmental. The value of each of the three blocks in the final index is the same. The Polar Index is calculated using more than 20 indicators, including the level of public satisfaction with the authorities’ efforts to ensure social guarantees, the share of reclaimed land, the existence of regional and municipal programs to adapt the population and economic systems to climatic changes, and others. The socio-economic block includes the following criteria:
  • The ratio of per capita average monetary income of the population to the subsistence minimum;
  • The regional rich/poor income ratio;
  • Migration outflow of the population;
  • Share of the population with monetary income below the regional subsistence minimum;
  • Per capita GRP output;
  • Level of public satisfaction with the various authorities’ efforts to ensure social guarantees;
  • Provision of transport infrastructure of all types;
  • Respect for the rights of representatives of small indigenous peoples;
  • Provision of housing for the population;
  • Share of the population who use the Internet, as a percentage of the total population;
  • Share of the employed and unemployed in the total population.
The data in Table 4 show that over a decade (2012–2021), the GRP of the AZRF increased by 185% (from 105% to 249%, by region). The average pay grew from 65% to 120%, exceeding by 87–228% the average pay in Russia in 2021 (Table 5). The average income rose from 30% to 80% (Table 6). While the AZRF accounted for 15% of GRP of all constituent entities of the Russian Federation (Table 4), its population accounted for only 5% of Russia’s population (as of 2021) (Table 7). The intensive development of the region, growth of GRP, wages and income should have led to an increase in population and a reduction in the poverty level. However, a paradoxical situation is observed. In 2012–2021, the overall population decreased by 6.8%, totaling 15–17% in some regions (Table 8), while the poverty level varied from 42% to 153% of the average value in Russia in 2021 (Table 7). The main reasons for the depopulation were not only severe climatic conditions, but also underdevelopment of all types of infrastructure and low level of accessibility to high-quality social services [76,77,78].
The differences in climatic conditions, level of socio-economic development, resource potential, and structure of industrial production in the AZRF regions determine the directions of the government policy for sustainable development. The HHIo was calculated for the AZRF regions using the methods proposed by the authors (Table 9). It allowed the authors to identify regions with a high sectoral concentration of GRP structure, where the GRP sectoral structure was not likely to change in the medium term; and to select the regions where mineral extraction was the key industry.
For the possible reproducibility of the analysis results, the calculation of HHIo for the Komi Republic is given below as an example (Table 10).
H H I o 2021 K o m i R . = 1.6 2 + 48 2 + 9.8 2 + 1.8 2 + 0.7 2 + 4.4 2 + 4.2 2 + 5.1 2 + 0.6 2 + 1 2 + 0.2 2 + 4.9 2 + 1.3 2 + 3 2                                                   + 5.9 2 + 2.7 2 + 4 2 + 0.5 2 + 0.3 2 = 2563.88
The calculations showed (Table 9) that the mining industry played a determining role in compiling the regions’ GRP (HHIo > 1800) in the Komi Republic, Nenets Autonomous Okrug (District), Yamalo-Nenets Autonomous Okrug (District), Sakha Republic (Yakutia), and Chukotka Autonomous Okrug (District). The strategy of socio-economic development focused on mineral resource development. Thus, rental income is the main type of income in these regions.
Among tax and non-tax rental income transferred to the budgets and ensuring, among other things, the implementation of socio-economic development programs, the main ones are the mineral extraction tax (MET) and royalties. The mineral extraction tax (MET) is a federal tax and, according to the budgetary legislation of Russia, 60% is transferred to the budgets of Russia’s constituent entities. However, this rate stands at 17% for a larger part of the list of mineral resources in the Komi Republic, Nenets Autonomous Okrug (District), Yamalo-Nenets Autonomous Okrug (District), and Chukotka Autonomous Okrug (District). The rate for MET on hydrocarbon raw materials totals 0%. The rate stands at 5% for royalties under production-sharing agreements (PSA) for hydrocarbons (except for flammable natural gas) and at 0% for flammable natural gas (Budget Code of Russia, Article 56 Tax Revenues of the Budgets of the Subjects of the Russian Federation, paragraph 2. https://www.consultant.ru/document/cons_doc_LAW_19702/0f3dd11480b2a82098ac79197ac977ee50a2f983/; Budget Code of Russia, Article 50 Tax Revenues of the Federal Budget https://www.consultant.ru/document/cons_doc_LAW_19702/c347478b850fb7c4a92141cb188a76d83ac72e0f/ (accessed on 13 November 2023)). Thus, a large part of rental income is transferred to the federal budget. The exception is the Sakha Republic (Yakutia). A traditional basic industry of the Sakha Republic (Yakutia) is diamond mining. Yakutia accounts for 90% of Russia’s balance reserves of diamonds, with production reaching 20% of the world’s total results [76]; 100% of MET on natural diamonds is transferred to the budget of the Sakha Republic (Yakutia) (Budget Code of Russia, Article 56 Tax Revenues of the Budgets of the Subjects of the Russian Federation, paragraph 2. https://www.consultant.ru/document/cons_doc_LAW_19702/0f3dd11480b2a82098ac79197ac977ee50a2f983/; Budget Code of Russia, Article 50 Tax Revenues of the Federal Budget https://www.consultant.ru/document/cons_doc_LAW_19702/c347478b850fb7c4a92141cb188a76d83ac72e0f/ (accessed on 13 November 2023)).
Government and business programs facilitated a quantitative growth of the AZRF’s GRP (Table 4), while the conditions of business operation were complicated by the natural and climatic factors: technology, materials, logistics, and energy infrastructure, etc. [79,80,81,82,83,84]. The active development of the AZRF resource potential and persistent exploitation of the region’s resources leads to an increase in manmade impact, and Arctic ecosystems are subjected to a wide range of impacts [85].
The authors believe that a colonial model of development is observed in the AZRF [86,87]. This is proven by the high poverty level, lack of direct correlation between the dynamics of GRP, pay growth, average income, and population size (Table 4, Table 5, Table 6, Table 7 and Table 8). Migration outflow and reduced reproduction of labor force may become the main restrictions on the development of the AZRF territories.
According to Table 3, the top three AZRF regions in terms of sustainable development include two mining regions: Yamalo-Nenets Autonomous Okrug (District) and Sakha Republic (Yakutia). However, the highest poverty level was recorded in Sakha Republic (Yakutia) (Table 7), while the negative dynamics of population change persisted in Yamalo-Nenets Autonomous Okrug (District) (Table 8), as well as in other mining regions, indicating a low standard of living and quality of life. Clearly, the development of the AZRF mining regions can hardly be described as sustainable, and the insufficient level of the social segment is compensated by the economic and environmental segments. The main issues of demographic development in the mining regions are as follows: development of housing, social and transportation infrastructure, and accessibility and quality of medical services in the Komi Republic, Nenets Autonomous Okrug (District), Yamalo-Nenets Autonomous Okrug (District), the Sakha Republic (Yakutia), and Chukotka Autonomous Okrug (District) (According to the Strategies of socio-economic development of the listed regions.). The listed sectors are the areas of state responsibility. Thus, the state is highly responsible for financing economic and social tasks.
The authors believe that not only the level of per capita average income but also the level of fiscal capacity plays a determining role in ensuring the standard of living of the AZRF regions. To test the hypothesis, a multivariate regression analysis was conducted for two groups: for all AZRF regions (total group) and for the AZRF mining regions in 2015–2021. The poverty level was taken as the main indicator characterizing the living standards of the AZRF regions.
The fiscal capacity level is the ratio of the index of tax potential of a municipal entity (a relative assessment of average per capita tax revenues that a local budget can receive based on the economic opportunities of a territory) to the index of budget expenditures (a relative assessment of expenditure commitments of a local budget per capita, taking into account cost and structural cost-raising factors). The data for 2015–2021 were taken for the analysis as the Ministry of Finance of Russia has been providing the information on the fiscal capacity level since 2015 (The official website of the Ministry of Finance of Russia: https://minfin.gov.ru/).
Multivariate regression analysis for all AZRF regions (total group).
Table 11 presents the results of descriptive statistics of the variables of the total group (for all AZRF regions).
Linear regression analysis method with inclusion of all independent variables was used to find a regression model to predict the response “Poverty level”: “Average income level” and “Fiscal capacity level”. Sample size: N = 63 (nine regions, period of 2015–2021). After the study, residuals were analyzed (the differences between the actual and predicted response values).
The analysis results show that together, the predictors under study have a statistically significant effect (F = 99.5; p < 0.001) on the Poverty Level value. At the same time, the predictive power of the obtained regression model is high because the value of the adjusted determination coefficient is greater than 0.7 (R2 = 0.76). The determination coefficient shows that the factors (predictors) of this model determine the value of the outcome (dependent variable) by 76%. That is, the explained variance of the dependent variable is 76%. The remaining 24% of the variance is random, i.e., determined by unaccounted factors.
The adjusted determination coefficient is used in cases of multiple regression with large sample sizes when an adjustment for the number of predictors must be made. Table 12 summarizes the general characteristics of the total group regression model.
However, the variables were found to have a significant effect on the response (p < 0.001).
The mathematical adequacy of the regression model is also suggested by the normal probability plot of the residuals. It is clearly seen that on the probability plot, most of the residual values are concentrated close to the theoretical straight line of the predicted response values (Figure 3).
The regression analysis shows that both predictors have a statistically significant effect on the dependent variable “Poverty Level” (p < 0.05). The regression analysis results are presented in Table 13.
Thus, the parameters of the linear regression equation were obtained as follows:
Poverty   level   = a 0 + b 1 x 1 + b 2 x 2 + + b n ,   where :
Poverty level is a predicted response value;
a0 is an intercept term;
b1, b2bn are weighting coefficients of the regression (B).
The calculation formula to predict the response value in a particular case was as follows:
Poverty level = 21.17 − 4.71 × Average income level − 1.56 × Fiscal capacity level
The table also shows the relative effect of each predictor on the response. This effect is estimated by the absolute values of the standardized regression coefficients (beta). The predictors are arranged in descending order considering the effect size of the predictors on the response “Poverty level”: “Average income level” and “Fiscal capacity level”. Given the coefficient signs, it should be recognized that an increase in the values of predictors with negative coefficients leads to a decrease in the predicted value of the “Poverty Level” response.
Multivariate regression analysis for AZRF mining regions.
Table 14 shows the results of descriptive statistics for the variables of the AZRF mining regions.
Linear regression analysis method with inclusion of all independent variables was used to find a regression model to predict the response “Poverty level”: “Average income level” and “Fiscal capacity level”. Sample size: N = 35 (five regions, period of 2015–2021). After the study, residuals were analyzed (the differences between the actual and predicted response values).
The analysis results show that together the predictors under study have a statistically significant effect (F = 209.9; p < 0.001) on the Poverty Level value. At the same time, the predictive power of the obtained regression model is high because the value of the adjusted determination coefficient is greater than 0.7 (R2 = 0.92). The determination coefficient shows that the factors (predictors) of this model determine the value of the outcome (dependent variable) by 92%. Thus, the explained variance of the dependent variable is 92%. The remaining 8% of the variance is random, i.e., determined by unaccounted factors.
The adjusted determination coefficient is used in cases of multiple regression with large sample sizes when an adjustment for the number of predictors must be made. Table 15 summarizes the general characteristics of the regression model for the mining region group.
However, the variables were found to have a significant effect on the response (p < 0.001).
The mathematical adequacy of the regression model is also suggested by the normal probability plot of the residuals. It is clearly seen that on the probability plot, most of the residual values are concentrated close to the theoretical straight line of the predicted response values (Figure 4).
The regression analysis shows that both predictors have a statistically significant effect on the dependent variable “Poverty Level” (p < 0.05). The regression analysis results are given in Table 16.
Thus, the parameters of the linear regression equation were obtained as follows:
Poverty   level   = a 0 + b 1 x 1 + b 2 x 2 + + b n ,   where :
Poverty level is a predicted response value;
a0 is an intercept term;
b1, b2bn are weighting coefficients of the regression (B).
The calculation formula to predict the response value in a particular case was as follows:
Poverty level = 24.00 − 5.78 × Average income level − 1.70 × Fiscal capacity level
The table also shows the relative effect of each predictor on the response. This effect is estimated by the absolute values of the standardized regression coefficients (beta). The predictors are arranged in descending order considering the effect size of the predictors on the response “Poverty level”: “Average income level” and “Fiscal capacity level”. Given the coefficient signs, it should be recognized that an increase in the values of predictors with negative coefficients leads to a decrease in the predicted value of the “Poverty Level” response.
The analysis has shown that the poverty level depends on the average income level and fiscal capacity both in the AZRF mining regions and in the Arctic regions in general. This fact should be reflected in state programs for regional development and state policies for fiscal capacity alignment in the Arctic regions. Determination coefficients of the regression models show that the average income level and the fiscal capacity level determine the poverty level for the total group (all AZRF regions) and the group of mining regions by 76% and 92%, respectively.
Today, it is difficult for the state to ensure the implementation of large long-term infrastructure projects amid the aggravating geopolitical situation and sanction restrictions. Therefore, emphasis should be made on measures, the implementation of which will contribute to a rise in the quality and standard of living in the short and medium term. For the AZRF mining regions, the state policy should focus on the implementation of measures both common to all Arctic regions and specific measures considering that mining companies are systemically important and determine the development of the regions:
  • Regarding fiscal policy, in the current situation, it seems reasonable to reconsider ratios of rental income redistributed between the budgets of the constituent entities of the Russia and the federal budget for the Komi Republic, Nenets Autonomous Okrug (District), Yamalo-Nenets Autonomous Okrug (District), the Sakha Republic (Yakutia), and Chukotka Autonomous Okrug. This should be executed in favor of the regions’ budgets until migration and natural population growth become positive and meet the target indicators of the strategies of socio-economic development. Determining the ratios will be the subject of further research.
    Moreover, it is advisable to increase the flow of inter-budgetary transfers to the budgets of the mining regions, revise the system of the Northern guarantees and compensations, and implement measures to support representatives of small indigenous peoples in order to improve the welfare of the population and equalize incomes.
  • Regarding average income, the high per capita average income is generated mainly from extra-budgetary resources. It is necessary to continue developing and implementing measures to reduce risks and increase profitability of investments in Arctic projects: tax preferences, subsidies when businesses invest in infrastructure projects, public–private partnerships, creation of clusters and technology parks, etc. State regulation of the mining industry should create conditions for companies to participate in solving a wide range of socio-economic tasks. Today, corporate social responsibility (CSR) programs are not mandatory, but many mining companies integrate social programs into their projects on the territories of their operation [7,65].
Industrial and transport development of the region lead to a complicated system of controversial socio-economic interests of business, state, and local population, including the indigenous peoples. The proposed system of measures in the fiscal policy will allow to equalize and increase the welfare of the population in the short term and to improve the balance between the interests of all economic agents. At the same time, the level of corporate responsibility is decreasing, which is important today when the business operating environment is complicated by sanction restrictions. It is worth noting that the implementation of the system of measures proposed by the authors requires serious rule making, since the transfer of rental income to the federal budget is related to the fact that subsoil is state property according to the Law of the Russian Federation “On Subsoil Resources” (Law N 2395-1 of the Russian Federation; adopted on 21 February 1992; On Subsoil Resources. Available online: http://www.consultant.ru/document/cons_doc_LAW_343/ (accessed on 12 September 2023)).

5. Discussion and Conclusions

Sustainable development is not a theory but a concept, i.e., “a system of views expressing a certain way of seeing, understanding, interpretation of any subjects, phenomena, processes and presenting a leading idea or constructive principle, fulfilling a certain idea in this or that theoretical knowledge practice” [88]. This is due to the fact that unlike a theory based on axioms and theorems, the concept of sustainable development, like any concept, is an ideology defining the goals and directions of human development.
Today, the triad approach is the main paradigm on which the concept of sustainable development is grounded. The triad approach is complemented by the provisions of green economy, circular economy, and digital economy. Digitalization affects all spheres of human development, transforming not only the economy but also social relations as well as human psychology and behavior patterns [89]. On the one hand, digital technologies become a development driver; they increase productivity, reliability, and energy efficiency and reduce transaction costs. On the other hand, the establishment of the global information space (GIS) leads to new global threats (cybercrimes, cyberterrorism). The World Economic Forum’s Global Risks Report for 2021 states: the digitalization difficulties mean that governments are facing different battles: “more frequent and impactful dissemination of disinformation on issues of geopolitical importance such as elections, humanitarian crises, public health, security and cultural issues” [90]. According to McAfee, cybercrimes cost the world more than USD 1 trillion in 2020, more than 1% of the global GDP [91]. A number of studies [92,93] added the fourth element—culture—into the triad model of sustainable development in addition to the economic, social, and environmental segments. In the triad approach, the SDGs emphasize the need to preserve cultural stability, but culture is included in the social block and is not treated separately. The search for mechanisms of interconnection between countries and international cooperation in solving global issues leads to understanding that culture, as a set of values determining the motivation of human behavior, is the most important element of the sustainable development concept in promoting the SDGs (The 2023 United Cultures Forum https://unitedcultures.ru/ (accessed on 4 January 2024)) [92,93,94,95].
In the author’s opinion, the current geopolitical events show that it is necessary to introduce an equal segment into the triad model of sustainable development in addition to the economic, social, and environmental segments. The fourth segment will include the quality of political and social institutions, etc., allowing to reach compromises in the system of multi-directional vectors of the countries’ interests [96]. Jeffrey D. Sachs, an American economist, defining sustainable development as “socially inclusive and environmentally sustainable [economic] growth”, noted that the quality of political institutions and the decisions they made determined the implementation of the SDGs [97].
The sustainable development concept continues to evolve. The authors agree with the opinion of A.D. Ursul: the number of interpretations of “sustainable development” will grow because “there is a process of realizing the future development, which in general is uncertain and multivariant” [21].
Many studies have focused on the issues of sustainable development in the Arctic [3,4,5,86,87,98,99,100,101,102,103,104,105]. However, it is not possible to define a single system of measures allowing to move away from the resource and raw material model. This is due to the differentiation of the socio-economic space of the Arctic region, climatic conditions, resource potential, industrial production structure, and differences in the directions of state policies of the Arctic states. Social and environmental conflicts in the Arctic predominantly affect the territories of indigenous peoples, creating a complex system of subordinate and contradictory interests of indigenous and non-indigenous populations, business and the state, and international actors [5,7,102].
The authors believe that the resource and raw material model of development is not a dead end for the AZRF. Moreover, the mining industry fulfills the region’s development potential. The question is how the positive and negative impacts of implementing this potential are distributed.
The research undertaken has led to the following conclusions:
  • The sustainable development concept has a long history and continues to evolve. In addition to the economic, social, and environmental segments, it is necessary to introduce an equal segment—political—which should cover the quality of political and social institutions, etc., allowing to reach compromises in the system of multi-directional vectors of the countries’ interests.
  • The AZRF is of strategic importance both for social and economic development of Russia and for national interests. However, a colonial development model is observed in the region. It is proven with a reduction in population, high poverty level, and simultaneous growth of salaries, average income, and the regions’ GRP.
  • The strategy of the Arctic regions’ socio-economic development is based on the development of mineral resources. The authors propose a method to identify territories with a high sectoral concentration of the Gross Regional Product (GRP) structure and identify regions where the mining industry plays a decisive role in GRP formation; as a result, rental income is the main income type. The mining regions are as follows: Komi Republic, Nenets Autonomous Okrug (District), Yamalo-Nenets Autonomous Okrug (District), Sakha Republic (Yakutia), and Chukotka Autonomous Okrug (District).
  • The analysis has shown that the poverty level depends on the average income level and fiscal capacity both in the AZRF mining regions and in the Arctic regions in general. This fact should be reflected in state programs for regional development and state policies for fiscal capacity alignment in the Arctic regions.
  • Together with the implementation of general measures effective for all AZRF regions, in order to improve the demographic situation in mining regions, it seems reasonable to reconsider ratios of rental income redistributed between the budgets of the constituent entities of the Russian Federation and the federal budget. It should be executed in favor of the mining regions’ budgets until migration and natural population growth become positive and meet the target indicators of the strategies of socio-economic development because the population decrease is the most serious restriction on sustainable development of the regions.
  • Application of the methodology developed by the authors to identify regions with a high sectoral concentration of GRP structure has restrictions: it can be used as an auxiliary since the system of measures proposed by the analysis results should not contradict the long-term strategies of regional socio-economic development.

Author Contributions

Conceptualization, N.K.; methodology, N.K. and M.N.; software, S.R.; validation, N.K., M.N. and S.R.; formal analysis, N.K. and M.N.; investigation, N.K. and M.N.; resources, S.R.; data curation, S.R.; writing—original draft preparation, M.N.; writing—review and editing, N.K.; visualization, S.R.; supervision, N.K.; project administration, N.K. and M.N. All authors have read and agreed to the published version of the manuscript.

Funding

This research received no external funding.

Institutional Review Board Statement

Not applicable.

Informed Consent Statement

Not applicable.

Data Availability Statement

Data are contained within the article.

Conflicts of Interest

The authors declare no conflict of interest.

References

  1. Singh, R.K.; Murty, H.R.; Gupta, S.K.; Dikshit, A.K. An overview of sustainability assessment methodologies. Ecol. Indic. 2009, 9, 189–212. [Google Scholar] [CrossRef]
  2. Tsvetkova, A.; Katysheva, E. Present problems of mineral and raw materials resources replenishment in Russia. In Proceedings of the International Multidisciplinary Scientific Geo Conference Surveying Geology and Mining Ecology Management SGEM, Albena, Bulgaria, 28 June–7 July 2019; Volume 19, pp. 573–578. [Google Scholar] [CrossRef]
  3. Tysiachniouk, M.S. Disentangling Benefit-Sharing Complexities of Oil Extraction on the North Slope of Alaska. Sustainability 2020, 12, 5432. [Google Scholar] [CrossRef]
  4. Zhiltsov, S.S. The Arctic Vector of the Foreign Policy of the European Union. Sovrem. Evropa 2022, 3, 49–61. [Google Scholar]
  5. Li, X.; Zhu, S.; Li, Y.; Chang, R. What is the asymmetric influence of natural resource rent and green innovation on the ecological sustainability of the ARCTIC region. Resour. Policy 2022, 79, 103051. [Google Scholar] [CrossRef]
  6. Russian Geological Research Institute (VSEGEI). The Report on the State and Prospects for the Use of Mineral Basis of the Arctic Zone of the Russian Federation. 15 March 2021. Available online: https://www.rosnedra.gov.ru/data/Fast/Files/202104/45bb8bcc7b844220954744c0149a86f4.pdf (accessed on 2 September 2023).
  7. Kirsanova, N.Y.; Lenkovets, O.M. Assessment of Accountability in State Regulation of Arctic Zone of the Russian Federation in Current Institutional Environment. Sev. Rynok Form. Ekon. Porad. 2022, 75, 47–57. [Google Scholar] [CrossRef]
  8. Abykeeva-Sultanalieva, T.B. Early Stages of Society Sustainable Development Concept in Ancient Philosophy. Probl. Sci. 2016, 8, 50. Available online: https://cyberleninka.ru/article/n/zachatki-idei-ustoychivogo-razvitiya-obschestva-v-drevney-filosofii (accessed on 10 September 2023).
  9. Rudi, A.S. “Stable” and “Variable” in Ancient Philosophy. Russ. J. Soc. Sci. Humanit. 2014, 2, 16. Available online: https://cyberleninka.ru/article/n/ustoychivoe-i-izmenchivoe-v-antichnoy-filosofii (accessed on 2 September 2023).
  10. Chuchukalova, R.A. Background of Sustainable Development Concept. RGGU Bull. Ser. Philos. Sociol. Art Hist. 2011, 3, 65. Available online: https://cyberleninka.ru/article/n/predystoriya-kontseptsii-ustoychivogo-razvitiya-1 (accessed on 3 September 2023).
  11. Malthus, T.R.; Malthus, T.R. An Essay on the Principle of Population; Reproduced from the Edition: Malthus, T.R. “An Essay on the Principle of Population” St. Petersburg, 1868 ed.; Direct-Media Publishing: Moscow, Russia, 2008. [Google Scholar]
  12. Kautsky, K. Propagation and Evolution in Nature and Society; Ryazanov, D., Ed.; State Publishing House of the RSFSR: St. Petersburg, Russia, 1919. [Google Scholar]
  13. Meadows, D.H.; Meadows, D.L.; Rand, J.; Behrens, W.W., III. Limits to Growth; Moscow University Press: Moscow, Russia, 1991. [Google Scholar]
  14. Vernadsky, V.I. Biosphere: Selected Works on Biogeochemistry; Mysl Publishing House: Moscow, Russia, 1967. [Google Scholar]
  15. Vernadsky, V.I. Biosphere and Noosphere; Iris Press: Moscow, Russia, 2002. [Google Scholar]
  16. Vernadsky, V.I. The Beginning and Eternity of Life; Sovremennaya Rossiya: Moscow, Russia, 1989. [Google Scholar]
  17. Vernadsky, V.I. Chemical Structure of the Earth’s Biosphere and Its Surrounding; Nauka: Moscow, Russia, 1965. [Google Scholar]
  18. Gorshkov, V.G. Limits to Biosphere Sustainability and the Environment; Leningrad Nuclear Physics Institute: Saint Petersburg, Russia, 1987. [Google Scholar]
  19. Gorshkov, V.G.; Kondratyev, K.Y.; Danilov-Danilyan, V.I.; Losev, K.S. Environment: From New Technologies to New Thinking; Without a Publishing House: Moscow, Russia, 1994. [Google Scholar]
  20. Gorshkov, V.G. Physical and Biological Bases of Life Stability; VINITI: Moscow, Russia, 1995. [Google Scholar]
  21. Ursul, A.D. Conceptual Issues of Sustainable Development. Bull. Russ. Acad. Sciences. Use Prot. Nat. Resour. Russ. 2005, 1, 30–38. [Google Scholar]
  22. Ursul, A.D.; Ursul, T.A. Vectors of Achieving Sustainable Future. Russ. J. Philos. Sci. 2017, 7, 139–149. [Google Scholar]
  23. Moiseev, N.N. “Sustainable Development” or “Transition Strategy”. Ecology and Education. 1996. Available online: http://www.teacher-edu.ru/wmc/arts/1074784948 (accessed on 2 August 2023).
  24. Moiseev, N.N. Time to Define National Goals; IIUEPS/MNEPU: Moscow, Russia, 1997. [Google Scholar]
  25. Losev, K.S. Ecological Issues and Sustainable Development Perspectives of Russia at the XXI Century; Kosmosinform: Moscow, Russia, 2001. [Google Scholar]
  26. Munasinghe, M.; Cruz, W. Economywide Policies and the Environment: Lessons from Experience. In World Bank Environment Paper; The International Bank for Reconstruction and Development/THE WORLD BANK: Washington, DC, USA, 1995. [Google Scholar]
  27. Fedorenko, N.; Reimers, N.F. Ecology and Economics—The Evolution of Relationships. From “Saving Nature” to “Big” Ecology. Philos. Issues Glob. Ecol. 1983, 230–277. [Google Scholar]
  28. The World Bank. GDP (Current US$). Available online: https://data.worldbank.org/indicator/NY.GDP.MKTP.CD (accessed on 3 September 2023).
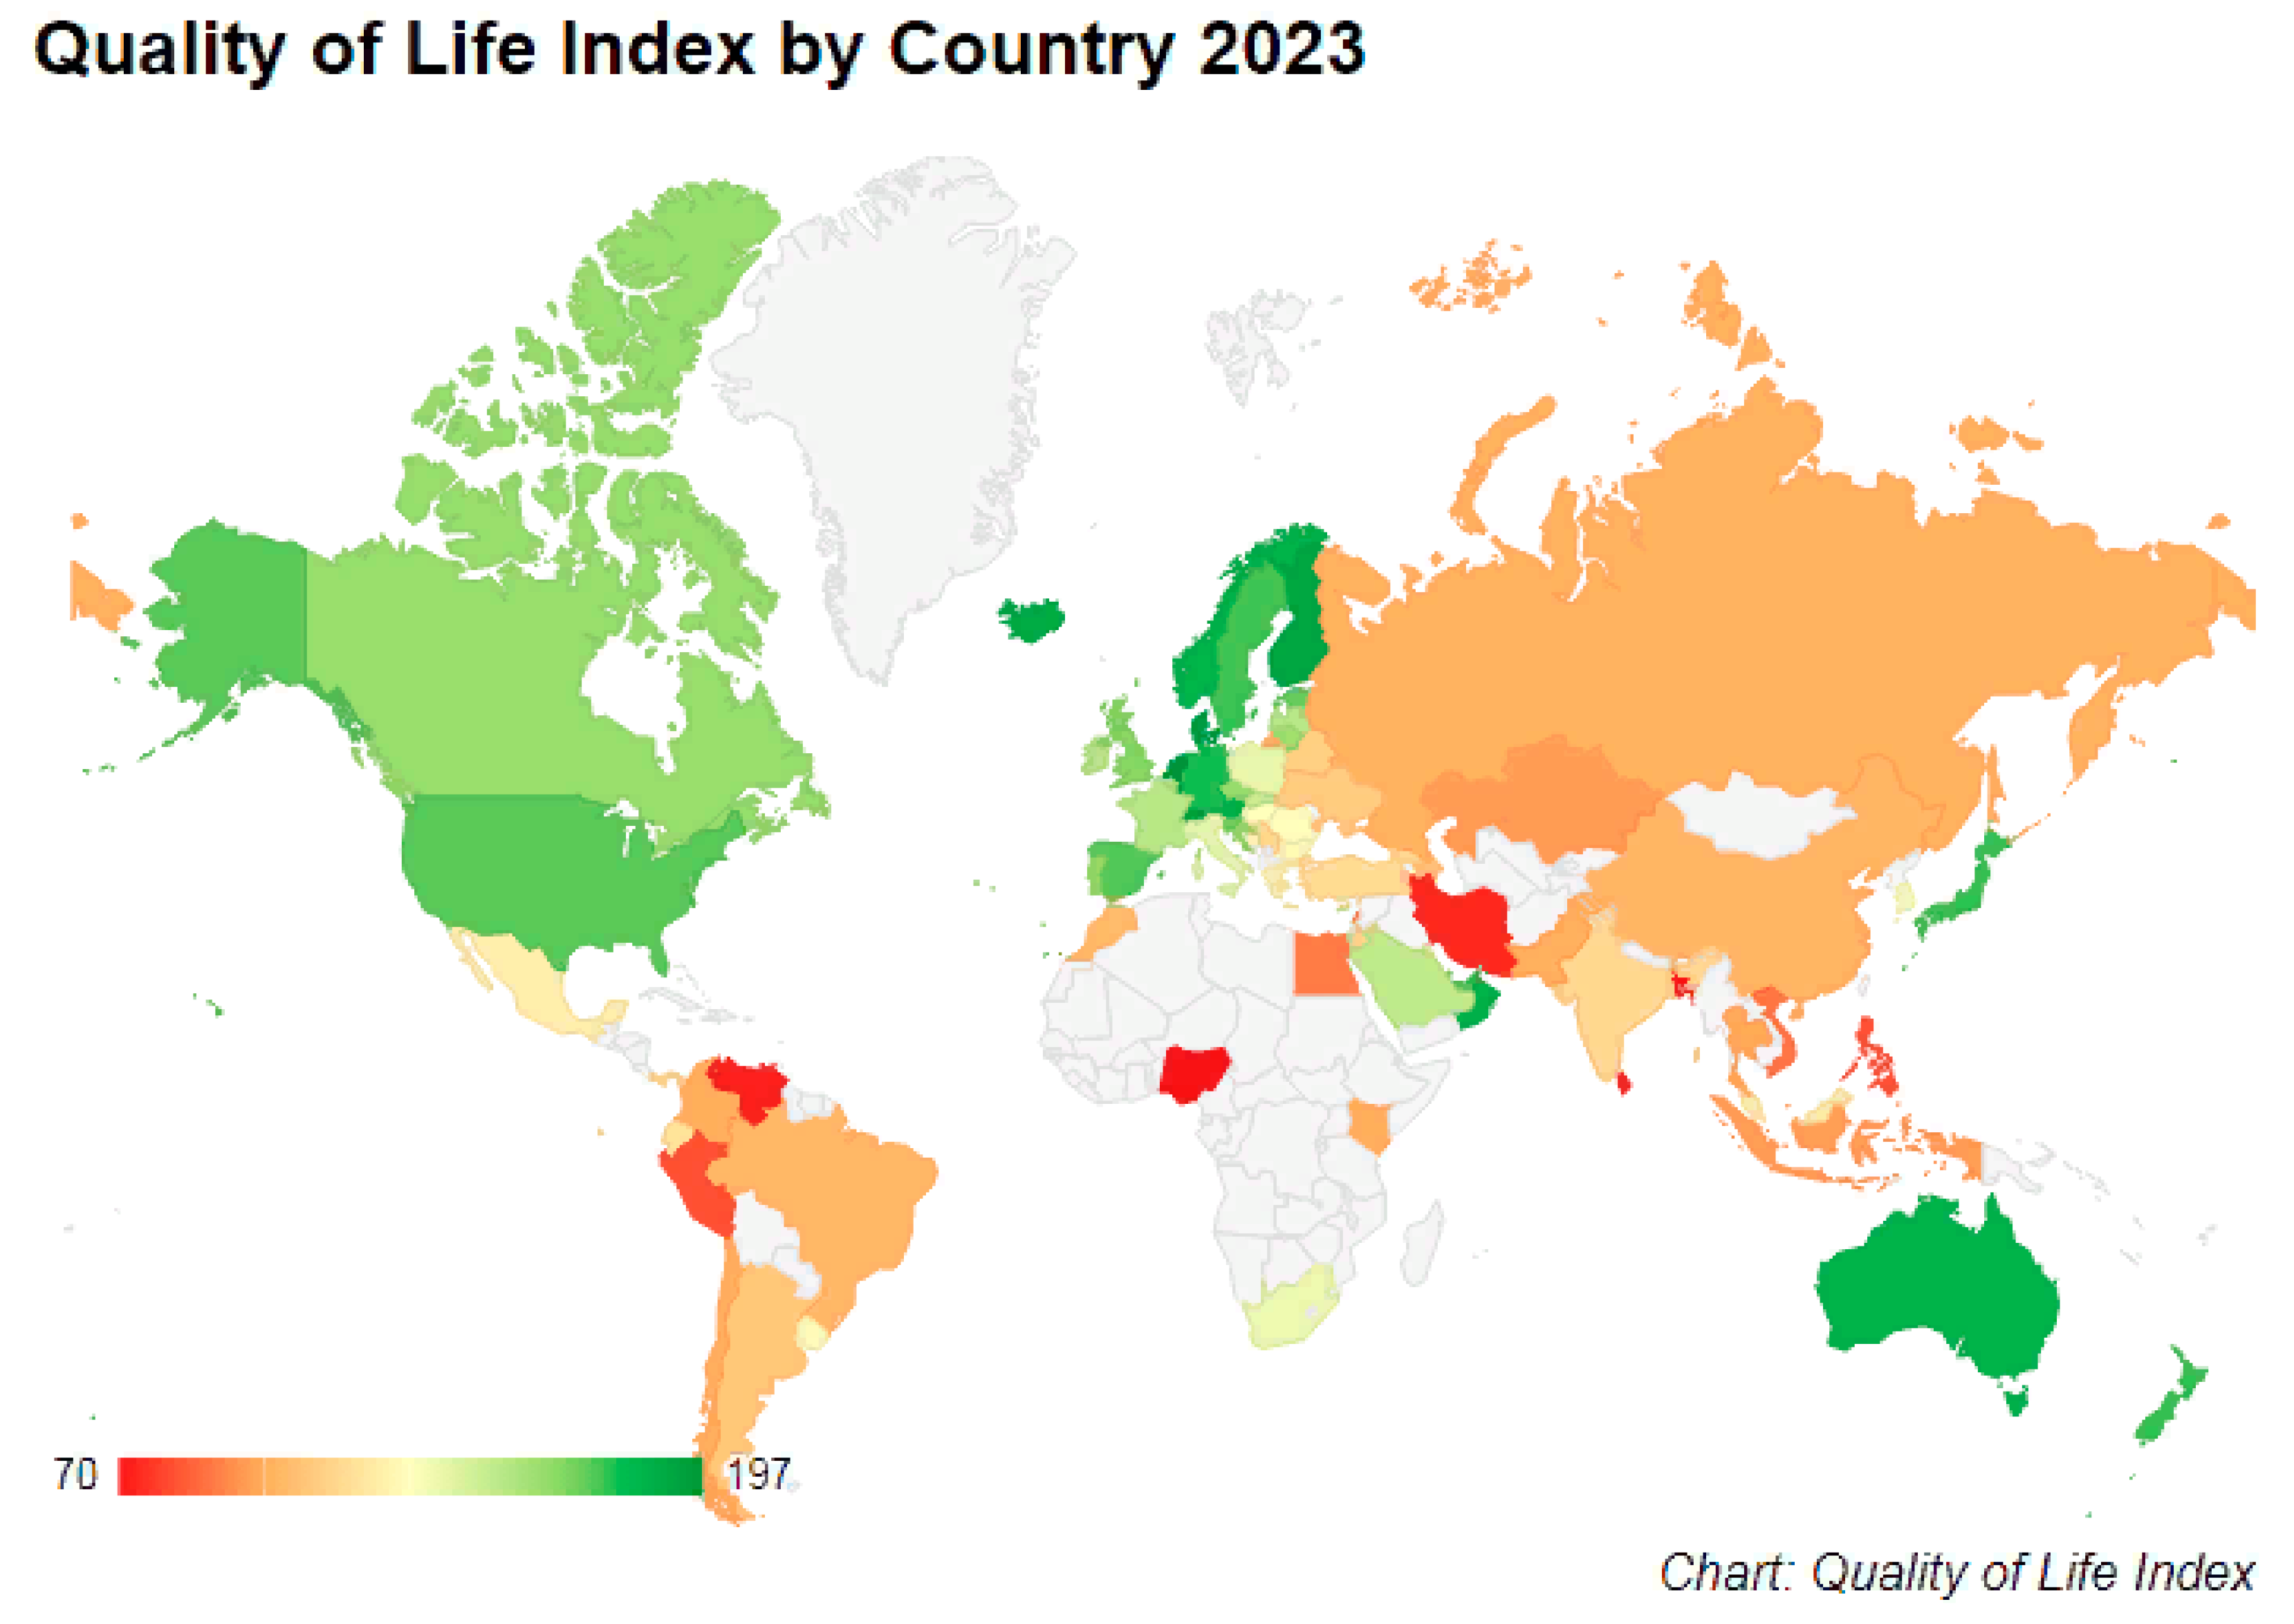
  29. NUMBEO. Quality of Life Index by Country 2023. Available online: https://www.numbeo.com/quality-of-life/rankings_by_country.jsp?title=2023 (accessed on 4 January 2024).
  30. NASA. Global Climate Change. Available online: https://climate.nasa.gov/ (accessed on 9 November 2023).
  31. Stiglitz, J.E.; Sen, A.; Fitoussi, J.-P. Mismeasuring Our Lives: Why GDP Doesn’t Add Up. In Report of Commission on the Measurement of Economic Performance and Social Progress (CMEPSP); Drobyshevskaya, T., Ed.; The Gaidar Institute Publishing House: Moscow, Russia, 2016; p. 216. [Google Scholar]
  32. Declaration of the 1972 United Nations Conference on the Human Environment. (n.d.). Available online: https://www.un.org/ru/documents/decl_conv/declarations/declarathenv.shtml (accessed on 2 September 2023).
  33. Coleman, J. Conspirators’ Hierarchy: The Story of the Committee of 300; Vityaz: Moscow, Russia, 2005; Available online: https://karpovo.0o.ru/forum2/files/Comitee_300.pdf (accessed on 2 January 2024).
  34. Mesarovic, M.; Pestel, E. Mankind at the Turning Point: The Second Report to the Club of Rome; E. P. Dutton and Co. Inc.: New York, NY, USA, 1974. [Google Scholar]
  35. Krasnoshchekov, G.P.; Rozenberg, G.S. From Extraction of Oysters to Sustainable Development (Chronology of the Basic Events). Samar. Luka 2008, 17, 221–288. Available online: https://cyberleninka.ru/article/n/hronologiya-kalendar-sobytiy-svyazannyh-so-stanovleniem-predstavleniy-ob-ustoychivom-razvitii (accessed on 12 August 2023).
  36. Kondratyev, N.D. Large Cycles of Conjuncture and the Theory of Foresight; Ekonomika: Moscow, Russia, 2002. [Google Scholar]
  37. Page, T. Intergenerational equity and the social rate of discount. In Environmental Resources and Applied Welfare Economics; Smith, V.K., Ed.; Routledge: London, UK, 1988; pp. 71–89. [Google Scholar] [CrossRef]
  38. Pearce, D.W.; Turner, R.K. Economics of Natural Resources and the Environment; Dialog-MGU: Moscow, Russia, 1992. [Google Scholar]
  39. Turner, R.K.; Kerry, R. Sustainability, Resource Conservation and Pollution Control: An Overview. In Sustainable Environmental Management; Belhaven Press: London, UK, 1988; 292p. [Google Scholar]
  40. Turner, R.K. Sustainability: Principles and practice. In Sustainable Environmental Economics and Management: Principles and Practice; Belhaven Press: London, UK, 1993; pp. 3–36. [Google Scholar]
  41. Solow, R. Technical Change and the Aggregate Production Function. Rev. Econ. Stat. 1957, 39, 312–320. [Google Scholar] [CrossRef]
  42. Solow, R. A Contribution to the Theory of Economic Growth. Q. J. Econ. 1956, 70, 65–94. [Google Scholar] [CrossRef]
  43. Solow, R.M. Intergenerational equity and exhaustible resources. Rev. Econ. Stud. 1974, 41, 29–45. [Google Scholar] [CrossRef]
  44. Solow, R.M. On the intergenerational allocation of natural resources. Scand. J. Econ. 1986, 88, 141–156. [Google Scholar] [CrossRef]
  45. Stiglitz, J.E. Growth with exhaustible natural resources: Efficient and optimal growth paths. Rev. Econ. Stud. 1974, 41, 123–137. [Google Scholar] [CrossRef]
  46. Hartwick, J.M. Intergenerational equity and the investing of rents from ex-haustible resources. Am. Econ. Rev. 1977, 67, 972–974. [Google Scholar]
  47. Global Footprint Network. Global Footprint Network among Researchers Recognized with AASHE Sustainability Award. Available online: https://www.footprintnetwork.org/ (accessed on 3 October 2023).
  48. Barbier, E. The Concept of Sustainable Economic Development. Environ. Conserv. 1987, 14, 101–110. [Google Scholar] [CrossRef]
  49. Our Common Future. Report of the United Nations World Commission on Environment and Development. 1987. Available online: https://www.un.org/ru/ga/pdf/brundtland.pdf (accessed on 8 September 2023).
  50. United Nations Millennium Declaration. United Nations General Assembly (8 September 2000). Available online: https://www.ohchr.org/EN/ProfessionalInterest/Pages/Millennium.aspx (accessed on 2 October 2023).
  51. Kruglov, A.Y. Emphasizing Transition: Sustainable Development Goals as Problem-Based Approach to Implementing Millennium Development Goals. In Sustainable Development: Challenges and Opportunities: Collection of Scientific Articles; Viktorova, Y.V., Ed.; SPbSUE Publishing House: St. Petersburg, Russia, 2020; pp. 156–162. [Google Scholar]
  52. Sustainable Development Goals, UN. Transforming Our World: The 2030 Agenda for Sustainable Development. 2015. Available online: https://www.un.org/sustainabledevelopment/ru/about/development-agenda/ (accessed on 28 September 2023).
  53. Ponomarenko, T.; Marinina, O.; Nevskaya, M.; Kuryakova, K. Developing Corporate Sustainability Assessment Methods for Oil and Gas Companies. Economies 2021, 9, 58. [Google Scholar] [CrossRef]
  54. Cherepovitsyn, A.; Tsvetkova, A.; Komendantova, N. Approaches to Assessing the Strategic Sustainability of High-Risk Offshore Oil and Gas Projects. J. Mar. Sci. Eng. 2020, 8, 995. [Google Scholar] [CrossRef]
  55. Marinina, O.; Nechitailo, A.; Stroykov, G.; Tsvetkova, A.; Reshneva, E.; Turovskaya, L. Technical and Economic Assessment of Energy Efficiency of Electrification of Hydrocarbon Production Facilities in Underdeveloped Areas. Sustainability 2023, 15, 9614. [Google Scholar] [CrossRef]
  56. Fadeev, A.; Komendantova, N.; Cherepovitsyn, A.; Tsvetkova, A.; Paramonov, I. Methods and priorities for human resource planning in oil and gas projects in Russia and OPEC. OPEC Energy Rev. 2021, 45, 365–389. [Google Scholar] [CrossRef]
  57. Pashkevich, M.A.; Danilova, A.S. Ecological Security and Sustainability. J. Min. Inst. 2023, 260, 153–154. [Google Scholar]
  58. Litvinenko, V.S.; Petrov, E.I.; Vasilevskaya, D.V.; Yakovenko, A.V.; Naumov, I.A.; Ratnikov, M.A. Assessment of the Role of the State in the Management of Mineral Resources. J. Min. Inst. 2023, 259, 95–111. [Google Scholar] [CrossRef]
  59. Katysheva, E. Analysis of the Interconnected Development Potential of the Oil, Gas and Transport Industries in the Russian Arctic. Energies 2023, 16, 3124. [Google Scholar] [CrossRef]
  60. Research Laboratory of Geoecology of the North, Faculty of Geography of Lomonosov Moscow State University. Current Dynamics of Permafrost Conditions and its Impact on the Infrastructure of the Russian Arctic; Research Laboratory of Geoecology of the North, Faculty of Geography of Lomonosov, Moscow State University: Moscow, Russia, 2021; Available online: https://mk.rgo.ru/sites/default/files/documents/article-2699-mkrgovmgu2021maslakov.pdf (accessed on 6 September 2023).
  61. Brigida, V.S.; Kozhiev, K.K.; Saryan, A.A.; Dzhioeva, A.K. Time-space problems in geoecology: An inter-disciplinary approach. Min. Informational Anal. Bull. 2020, 4, 20–32. [Google Scholar] [CrossRef]
  62. Anisimov, O.; Badina, S.; Belolutskaya, M.; Volodin, Y.; Lavrov, S. Climate Change in the Russian Arctic: Risks and New Opportunities; Federal State Budgetary Organization “State Hydrological Institute”, Energy Center of Skolkovo Moscow School of Management, 2022; Available online: https://www.researchgate.net/publication/362791657_Climate_change_in_the_Russian_Arctic_risks_and_new_opportunities_Assesment_report (accessed on 8 October 2023).
  63. Ledyaeva, M. From 22% to 100% of Buildings Damaged due to Thawing Permafrost in the Arctic Zone of the Russian Federation. Rossiyskaya Gazeta. Available online: https://rg.ru/2022/05/17/reg-szfo/k-2025-godu-infrastrukturu-arktiki-nuzhno-adaptirovat-k-taianiiu-merzloty.html (accessed on 17 May 2023).
  64. Kröger, M. Socio-ecological crises and global climate tipping points as difficulties for expanding extractivisms: Prognoses on the Arctic. Globalizations 2023, 20, 465–481. [Google Scholar] [CrossRef]
  65. Kodaneva, S.I. Sustainable development of the Russian Arctic: Main directions, problems and prospects. Econ. Soc. Probl. Russ. 2022, 2, 80–100. [Google Scholar]
  66. Working Group of the Arctic Council. Climate Change in Arctic. Update 2021: Key Trends and Impacts. Summary for Management Authorities; Arctic Monitoring and Assessment Program. Available online: https://www.amap.no/documents/download/6887/inline (accessed on 15 October 2023).
  67. Aksenova, O.V.; Bocharnikov, V.N.; Borovichev, Y.A.; Danilov, A.F.; Denisov, D.B.; Zatsarinny, I.V. Nature and Indigenous Peoples of the Arctic under the Influence of Climate Change and Industrial Development: The Murmansk Oblast; Borovichev, Y.A., Vronsky, N.V., Eds.; Grafit: Moscow, Russia, 2020; Available online: https://www.ksc.ru/docs/news/book_screen.pdf (accessed on 24 October 2023).
  68. Zhilina, I.Y. Warming in the Arctic: Opportunities and Risks. Econ. Soc. Probl. Russ. 2021, 1, 45. Available online: https://cyberleninka.ru/article/n/poteplenie-v-arktike-vozmozhnosti-i-riski (accessed on 26 October 2023). [CrossRef]
  69. Golovina, Y.I.; Khloponina, V.S. Problems of modern legislation in the sphere of underground waters extraction management. Geol. Miner. Resour. Sib. 2020, 1, 106–114. [Google Scholar] [CrossRef]
  70. Gubina, O.V.; Provorova, A.A. Approaches and Principles for Scenarios of Spatial Ecological and Economic Development of the Russian Arctic Regions. Bull. Altai Acad. Econ. Law 2019, 11, 39–47. [Google Scholar] [CrossRef]
  71. Available online: https://www.un.org/depts/los/convention_agreements/texts/unclos/unclos_e.pdf (accessed on 8 September 2023).
  72. Available online: https://cil.nus.edu.sg/wp-content/uploads/2017/07/2008-Ilulissat-Declaration.pdf (accessed on 8 September 2023).
  73. Available online: https://maritimecyprus.com/wp-content/uploads/2019/07/the_polar_code_a_regulatory__interpretation_guide.pdf (accessed on 8 September 2023).
  74. Skufyina, T.P.; Korchak, Y.A. Socio-Economic Dynamics and Development Prospects of Russian Arctic Considering Geopolitical, Macroeconomic, Environmental, and Mineral and Raw Material Factors; Publishing House of Kola Science Center of the Russian Academy of Sciences: Apatity, Russia, 2021. [Google Scholar]
  75. Konstantinidi, K.A.; Pakhalov, A.M.; Yakovleva, Y.Y. Evaluating the Investment Attractiveness of Russian Regions within Switching to Sustainable Development; XI Annual Analytic Report; Moscow, Russia, 2023. Available online: https://www.econ.msu.ru/sys/raw.php?o=102269&p=attachment (accessed on 18 January 2024).
  76. Reference and Analytical Collection. Comprehensive Study of the Arctic Zone Regions of the Russian Federation. Main Areas of St. Petersburg’s Cooperation in the Arctic. Available online: https://www.gov.spb.ru/gov/otrasl/arkt/kompleksnoe-issledovanie-regionov-arkticheskoj-zony-rossijskoj-federac/ (accessed on 13 June 2023).
  77. Lenkovets, O.M. Housing renovation in Russia and engineering and environmental aspects of renovation programs. J. Adv. Res. Dyn. Control. Syst. 2020, 12, 1060–1068. [Google Scholar] [CrossRef]
  78. Nevskaya, M.A.; Raikhlin, S.M.; Vinogradova, V.V.; Belyaev, V.V.; Khaikin, M.M. A Study of Factors Affecting National Energy Efficiency. Energies 2023, 16, 5170. [Google Scholar] [CrossRef]
  79. Ilyushin, Y.V. Development of a Process Control System for the Production of High-Paraffin Oil. Energies 2022, 15, 6462. [Google Scholar] [CrossRef]
  80. Vasilev, Y.; Cherepovitsyn, A.; Tsvetkova, A.; Komendantova, N. Promoting Public Awareness of Carbon Capture and Storage Technologies in the Russian Federation: A System of Educational Activities. Energies 2021, 14, 1408. [Google Scholar] [CrossRef]
  81. Makhovikov, A.B.; Kryltsov, S.B.; Matrokhina, K.V.; Trofimets, V.Y. Secured Communication for a Metallurgical Company. Non-Ferr. Met. 2023, 4, 5–13. [Google Scholar] [CrossRef]
  82. Shklyarskiy, Y.E.; Skamyin, A.N.; Carrizosa, J. Energy Efficiency in the Mineral Resources and Raw Materials Complex. J. Min. Inst. 2023, 261, 323–324. Available online: https://pmi.spmi.ru/pmi/article/view/16289 (accessed on 12 January 2024).
  83. Shishlyannikov, D.I.; Zverev, V.Y.; Zvonareva, A.G.; Frolov, S.A.; Ivanchenko, A.A. Evaluation of the Energy Efficiency of Functioning and Increase in the Operating Time of Hydraulic Drives of Sucker-Rod Pump Units in Difficult Operating Conditions. J. Min. Inst. 2023, 261, 349–362. Available online: https://pmi.spmi.ru/pmi/article/view/16187 (accessed on 10 January 2024).
  84. Shchirova, E.; Tsvetkova, A.; Komendantova, N. Analysis of the possibility of implementing carbon dioxide sequestration projects in Russia based on foreign experience. In Proceedings of the 21st International Multidisciplinary Scientific GeoConference SGEM 2021, Albena, Bulgaria, 26 June–5 July 2021; Volume 21, pp. 203–210. [Google Scholar] [CrossRef]
  85. Townhill, B.L.; Reppas-Chrysovitsin, E.; Sühring, R.; Halsall, C.J.; Mengo, E.; Sanders, T.; Dahnke, K.; Crabeck, O.; Kaiser, J.; Birchenough, S.N. Pollution in the Arctic Ocean: An overview of multiple pressures and implications for ecosystem services. Ambio 2022, 51, 471–483. [Google Scholar] [CrossRef]
  86. Wilson, E. What is Benefit Sharing? Respecting Indigenous Rights and Addressing Inequities in Arctic Resource Projects. Resources 2019, 8, 74. [Google Scholar] [CrossRef]
  87. Fadeev, A.M.; Vopilovskiy, S.S.; Fedoseev, S.V.; Zaikov, K.S.; Kuprikov, N.M.; Kuprikov, M.Y.; Avdonina, N.S. Industrial Support of the Energy Projects as a Part of the Blue Economy Development in the Arctic. Sustainability 2022, 14, 15346. [Google Scholar] [CrossRef]
  88. Gritsanov, A.A. (Ed.) World Encyclopedia: Philosophy of the Twentieth Century; AST, Harvest: Moscow, Russia, 2002. [Google Scholar]
  89. Kudryavtseva, K.V.; Skliar, M.A.; Vakhitova, L.R.; Shapiro, N.A. Economics of industry 4.0 in the political economy paradigm. Ind. 4.0 Implications. Implic. Manag. Econ. Law 2021, 4, 115–121. [Google Scholar] [CrossRef]
  90. World Economic Forum. The Global Risks Report 2021; World Economic Forum. 2021. Available online: https://www.weforum.org/reports/the-global-risks-report-2021 (accessed on 3 January 2024).
  91. Smith, Z.M.; Lostri, E.; Lewis, J.A. REPORT: The Hidden Costs of Cybercrime. Available online: https://www.mcafee.com/enterprise/en-us/assets/reports/rp-hidden-costs-of-cybercrime.pdf (accessed on 3 January 2024).
  92. Hawkes, J. The Fourth Pillar of Sustainability: Culture’s Essential Role in Public Planning; Cultural Development Network Publ.: Melbourne, Australia, 2001. [Google Scholar]
  93. Nikonorova, E.V. Culture and Sustainable Development: The Grounds for Interaction and Contours of Integration. Obs. Cult. J. 2016, 13, 644–651. [Google Scholar] [CrossRef]
  94. Intergovernmental Conference on Cultural Policies for Development in Stockholm. Action Plan on Cultural Policies for Development. 1998. Available online: http://old.duma.tomsk.ru/files2/8280_plan_deistvii.pdf (accessed on 24 August 2023).
  95. The Committee on culture of the World Organization of United Cities and Local Governments (UCLG). Agenda 21 for Culture. Available online: https://www.agenda21culture.net/documents/agenda-21-for-culture (accessed on 3 January 2024).
  96. Zhang, B.; Ma, J.; Khan, M.A.; Repnikova, V.; Shidlovskaya, K.; Barykin, S.; Ahmad, M.S. The Effect of Economic Policy Uncertainty on Foreign Direct Investment in the Era of Global Value Chain: Evidence from the Asian Countries. Sustainability 2023, 15, 6131. [Google Scholar] [CrossRef]
  97. Sachs, J.D. The Age of Sustainable Development; Columbia University Press: New York, NY, USA, 2015; p. 544. [Google Scholar]
  98. Semenova, T. Value Improving Practices in Production of Hydrocarbon Resources in the Arctic Regions. J. Mar. Sci. Eng. 2022, 10, 187. [Google Scholar] [CrossRef]
  99. Gulas, S.; Downton, M.; D’Souza, K.; Hayden, K.; Walker, T.R. Declining Arctic Ocean oil and gas developments: Opportunities to improve governance and environmental pollution control. Mar. Policy 2017, 75, 53–61. [Google Scholar] [CrossRef]
  100. Wårell, L. Mineral Deposits Safeguarding and Land Use Planning—The Importance of Creating Shared Value. Resources 2021, 10, 33. [Google Scholar] [CrossRef]
  101. McCauley, D.; Pettigrew, K.A.; Bennett, M.M.; Todd, I.; Wood-Donnelly, C. Which states will lead a just transition for the Arctic? A DeePeR analysis of global data on Arctic states and formal observer states. Glob. Environ. Change 2022, 73, 102480. [Google Scholar] [CrossRef]
  102. Hanaček, K.; Kröger, M.; Scheidel, A.; Rojas, F.; Martinez-Alier, J. On thin ice—The Arctic commodity extraction frontier and environmental conflicts. Ecol. Econ. 2022, 191, 107247. [Google Scholar] [CrossRef]
  103. Mitin, A.N.; Voronin, B.A.; Donnik, I.M. Economic and Legal Mechanisms for Harnessing Natural Resource Potential of the Arctic in the Context of Food and Environmental Security. Econ. Reg. 2018, 14, 408–419. [Google Scholar] [CrossRef]
  104. Cherepovitsyn, A.; Rutenko, E.; Solovyova, V. Sustainable Development of Oil and Gas Resources: A System of Environmental, Socio-Economic, andInnovation Indicators. J. Mar. Sci. Eng. 2021, 9, 1307. [Google Scholar] [CrossRef]
  105. Stroykov, G.; Vasilev, Y.N.; Zhukov, O.V. Basic Principles (Indicators) for Assessing the Technical and Economic Potential of Developing Arctic Offshore Oil and Gas Fields. J. Mar. Sci. Eng. 2021, 9, 1400. [Google Scholar] [CrossRef]
Figure 1. Quality of life index by country; 2023 [29].
Sustainability 16 02060 g001
Figure 2. Warming in the Arctic, 1961–2021. (NASA GISTEMP https://data.giss.nasa.gov/gistemp/maps/) [60].
Sustainability 16 02060 g002
Figure 3. Normal probability plot of the residuals; the total group.
Sustainability 16 02060 g003
Figure 4. Normal probability plot of the residuals; the mining region group.
Sustainability 16 02060 g004
Table 1. The main types of minerals in AZRF, share of their reserves and production in reserves, and production in the Russian Federation.
Mineral Group and TypeGroup of Important Minerals *Number of Mineral DepositsUnitsReserves (A + B + C1, for Raw Hydrocarbons A + B1 + C1)% of Russia’s ReservesC2, for Raw Hydrocarbons B2 + C2Outbalance ReservesProduction in 2020% of Production in Russia
Fossil fuels
Liquid and gaseous mineral resources
Oil2282million tons3879214201 6913
Combustible gases (non-associated gas)1204billion m337,4177616,898 60887
Combustible gases (dissolved gas)1264billion m339125646 987
Condensate 157billion m31352581303 2171
Solid fossil fuels
Coal145million tons716342063573682
Metallic minerals
Ferrous metals
Iron ore122thousand tons1,700,81131,127,994777,55028,0568
Chrome iron ores318thousand tons6811375380-26144
Titanium (TiO2)310thousand tons78,7333051,63820,377446100
Non-ferrous metals
Copper131thousand tons30,2394111,253653944146
Lead23thousand tons5816509173 0
Zinc21thousand tons132531163531 0
Molybdenum12tons188,45913111,228106,299 0
Tungsten143tons59,716636,89427,840 0
Tin1124thousand tons80251164208 0
Beauxites31thousand tons12,07912174- 0
Antimony22tons44,0202743,6058637 0
Rare metals
Zirconium32thousand tons1039171162766519100
Trace elements
Gallium 9tons74,522729963-72888
Indium 4tons--619200
Rubidium (rubidium oxide) 10tons273,8245743,007-261698
Caesium (caesium oxide) 10tons154322630-845
Rhenium31tons--1287300
Selenium 14tons310.131,5661166312
Scandium11tons973694021391200
Tellurium 14tons10 12,9704894
Rare earth metals
Rare earth metals311thousand tons14,7097169896709112100
Precious metals
Gold2591kg1,109,12613592,312379,44232,7657
Silver244tons14,6672512,78636351195
Platinum-group metals135kg8,977,758793,568,662856,245141,13496
Non-metalliferous minerals
Apatite ores114thousand tons479,13368103,10546,280583499
Diamonds224thousand carats261,1872918,84748,67018,27540
Impact diamonds 2thousand carats10,035,270100167,627,34043,090,20000
*—Numbers 1, 2, 3 indicate that the minerals belong to one of the 3 groups of minerals important for the economy of the Russian Federation, in accordance with the “Strategy for the Development of the Mineral Resource Base of the Russian Federation until 2035” approved by the Government Executive Order No. 2914-r on 22 December 2018. Source: [6].
Table 2. Assessment of investment attractiveness of the RF constituent entities entering the AZRF, 2023.
Arctic RegionsRanking among Regions of RussiaLevel of Investment
Attractiveness
High investment attractiveness
Yamalo-Nenets Autonomous Okrug (District)4IC2
Chukotka Autonomous Okrug (District)12IC3
Murmansk region15IC3
Nenets Autonomous Okrug (District)21IC3
Medium investment attractiveness
Krasnoyarsk region *35IC4
Sakha Republic (Yakutia) *37IC4
Karelia Republic *42IC5
Moderate investment attractiveness
Arkhangelsk region *67IC7
Komi Republic *72IC7
*—Regions that are partially included in the AZRF. In Table 2 and thereafter, data are presented for these regions as a whole. Source: [75].
Table 3. Polar Index (the sustainable development index), 2023.
Arctic RegionsSustainable Development Index
Active sustainable development policy
Murmansk region0.768
Sakha Republic (Yakutia)0.766
Yamalo-Nenets Autonomous Okrug (District)0.764
Moderate sustainable development policy
Arkhangelsk region0.682
Krasnoyarsk region0.664
Chukotka Autonomous Okrug (District)0.619
Insufficiently active sustainable development policy
Nenets Autonomous Okrug (District)0.592
Komi Republic0.591
Karelia Republic0.587
Source: https://polarindex.ru/ratings/polar-index-regions/ (accessed on 10 September 2023).
Table 4. GRP of the RF constituent entities entering the AZRF.
Arctic Regions2012, Billion Rubles2021, Billion RublesChange in 2012–2021, %% of Russia’s GRP in 2021
In all the AZRF regions4357.7
(USD 48.06 bn)
12,421.4
(USD 137.01 bn)
+185.015.0
Arkhangelsk region315.4
(USD 3.48 bn)
648.6
(USD 7.15 bn)
+105.60.8
Karelia Republic160.8
(USD 1.77 bn)
447.1
(USD 4.93 bn)
+178.00.2
Komi Republic479.1
(USD 5.23 bn)
857.0
(USD 9.45 bn)
+78.90.1
Murmansk region283.8
(USD 3.13 bn)
1083.8
(USD 11.95 bn)
+281.80.3
Nenets Autonomous Okrug (District)157.1
(USD 1.73 bn)
406.8
(USD 4.49 bn)
+159.00.2
Yamalo-Nenets Autonomous Okrug (District)1191.3
(USD 13.14 bn)
4161.5
(USD 45.9 bn)
+249.30.3
Krasnoyarsk region1183.2
(USD 13.05 bn)
3064.8
(USD 33.8 bn)
+159.00.2
Sakha Republic (Yakutia)541.3
(USD 5.97 bn)
1615.5
(USD 17.82 bn)
+198.40.2
Chukotka Autonomous Okrug (District)45.6
(USD 0.50 bn)
136.2
(USD 1.5 bn)
+198.40.2
Source: compiled by the authors using the data of the Federal State Statistics Service of the Russian Federation.
Table 5. Average pay in the RF constituent entities entering the AZRF.
Arctic Regions2012, Rubles2021, RublesChange in 2012–2021, %% of Russia’s Level in 2021
Arkhangelsk region26,400
(USD 291.19)
58,000
(USD 639.73)
+119.8101.3
Karelia Republic24,800
(USD 273.54)
49,600
(USD 547.08)
+99.886.6
Komi Republic34,000
(USD 375.02)
60,800
(USD 670.62)
+78.9106.2
Murmansk region36,200
(USD 399.28)
76,600
(USD 844.89)
+111.6133.8
Nenets Autonomous Okrug (District)57,800 (USD 637.53)95,700
(USD 1055.56)
+65.6167.2
Yamalo-Nenets Autonomous Okrug (District)63,700
(USD 702.6)
116,400
(USD 1283.88)
+82.7203.3
Krasnoyarsk region28,700
(USD 316.56)
60,600
(USD 668.41)
+111.4105.9
Sakha Republic (Yakutia)39,900
(USD 5.91bn)
84,500
(USD 932.03)
+111.6147.6
Chukotka Autonomous Okrug (District)60,800
(USD 670.62)
130,700
(USD 1441.61)
+115.0228.4
Source: compiled by the authors considering the data of the Federal State Statistics Service of the Russian Federation.
Table 6. Per capita monetary income in the RF constituent entities entering the AZRF.
Arctic Regions2013, Rubles2021, RublesChange in 2013–2021, %% of Russia’s Level in 2021
Arkhangelsk region23,800
(USD 262.51)
37,800
(USD 416.93)
+58.993.82
Karelia Republic22,100
(USD 243.76)
35,400
(USD 390.46)
+60.387.77
Komi Republic28,700
(USD 316.56)
39,100
(USD 431.27)
+36.297.06
Murmansk region31,900
(USD 351.85)
51,200
(USD 564.73)
+60.4126.99
Nenets Autonomous Okrug (District)66,900
(USD 737.9)
86,400
(USD 952.98)
+29.2214.45
Yamalo-Nenets Autonomous Okrug (District)58,800
(USD 648.56)
96,800
(USD 769.89)
+64.6240.21
Krasnoyarsk region24,300
(USD 268.03)
36,100
(USD 398.18)
+48.889.54
Sakha Republic (Yakutia)30,600
(USD 337.51)
50,400
(USD 555.91)
+64.6124.97
Chukotka Autonomous Okrug (District)55,600
(USD 613.26)
99,900
(USD 1101.89)
+79.6247.90
Source: compiled by the article authors according to the data of the Federal State Statistics Service of the Russian Federation.
Table 7. Poverty level * in the RF constituent entities entering the AZRF.
Arctic Regions2012, %2021, %Change in 2012–2021, %% of Russia’s Level in 2021
Arkhangelsk region1311.7−10.0106.4
Karelia Republic13.614.4+5.9130.9
Komi Republic13.415.3+14.2139.1
Murmansk region11.19.3−16.284.5
Nenets Autonomous Okrug (District)6.59.3+43.184.5
Yamalo-Nenets Autonomous Okrug (District)6.44.6−28.141.8
Krasnoyarsk region15.615.9+1.9144.5
Sakha Republic (Yakutia)16.716.8+0.6152.7
Chukotka Autonomous Okrug (District)7.77.3−5.266.4
* Poverty level is the number of people with monetary income below the subsistence minimum, %. Source: compiled by the authors using the data of the Federal State Statistics Service of the Russian Federation.
Table 8. Population in the RF constituent entities entering the AZRF.
Arctic Regions2012, Thousand People2021, Thousand PeopleChange in 2012–2021, %% of Russia’s Population in 2021
In all the AZRF regions7955.27411.1−6.85.0
Arkhangelsk region1213.51020.3−15.90.7
Karelia Republic639.7533.1−16.70.4
Komi Republic889.8737.9−17.10.5
Murmansk region787.9667.7−15.30.5
Nenets Autonomous Okrug (District)42.441.4−2.40.03
Yamalo-Nenets Autonomous Okrug (District)536.6510.5−4.90.3
Krasnoyarsk region2838.42857.0+0.71.9
Sakha Republic (Yakutia)955.9995.7+4.20.7
Chukotka Autonomous Okrug (District)51.047.5−6.90.03
Source: compiled by the authors considering the data of the Federal State Statistics Service of the Russian Federation.
Table 9. The HHIo of the RF constituent entities entering the AZRF.
Arctic RegionsMajor Minerals *Type of Activity (Industry) with the Largest Share in the GRP Structure (2021)/% **HHIo
Arkhangelsk regionDiamonds, beauxites, limestone, clay, lead-zinc ores, basalts, gas, and oilManufacturing/27.31229
Karelia RepublicVanadium, iron, gold, copper ores, molybdenum, nickel ores, tin, titanium, uranium, and chromeMineral extraction/30.71457
Komi RepublicOil, gas, bituminous coal, limestone, clay, manganese ores, oil shale, aluminum ores, titanium ores, gold, rock crystal, rock and potassium salts, copper ores, and ironMineral extraction/48.02563
Murmansk regionRare metal ores, iron ores, nickel ores, copper ores, and apatitesManufacturing/33.61605
Nenets Autonomous Okrug (District)Oil, gas, barytes, oil shale, gold, manganese ores, bituminous coal, and fluoriteMineral extraction/86.07426
Yamalo-Nenets Autonomous Okrug (District)Oil, gas, brown coal, iron, gold, copper ores, molybdenum, niobium, tantalum, lead-zinc ores, phosphorites, and chromeMineral extraction/73.95585
Krasnoyarsk regionDiamonds, beauxites, nepheline ores, brown coal, gas, gold, bituminous coal, oil, platinum, copper-nickel ores, and lead-zinc oresManufacturing/33.41804
Sakha Republic (Yakutia)Diamonds, gold, gas, bituminous coal, oil, iron, niobium, scandium, tin, tungsten, mercury, lead-zinc ores, silver, and uraniumMineral extraction/59.03643
Chukotka Autonomous Okrug (District)Gold, silver, gas, bituminous coal, copper ores, oil, tin, and tungstenMineral extraction/41.62220
Source: * [76], ** Data of the Federal State Statistics Service of Russia.
Table 10. Gross added value at base prices by the OKVED types of activities, the Komi Republic, 2021.
OKVED Type of Activity%OKVED Type of Activity%
Section A. Agriculture, forestry, hunting, fishing and fish farming1.6Section K. Financial and insurance activities0.2
Section B. Mineral extraction48Section L. Real estate activities4.9
Section C. Manufacturing9.8Section M. Professional, scientific, and technical activities1.3
Section D. Supply of electricity, gas and steam; air conditioning1.8Section N. Administrative activities and related additional services3.0
Section E. Water supply; wastewater disposal, waste collection and utilization, and pollution elimination activities0.7Section O. Public administration and military security; as well as social security5.9
Section F. Construction4.4Section P. Education2.7
Section G. Wholesale and retail trade; repairing motor vehicles and motorcycles4.2Section Q. Health care activities and social services4.0
Section H. Transportation and storage5.1Section R. Cultural, sports, leisure, and entertainment activities0.5
Section I. Activities of hotels and catering companies0.6Section S. Provision of other services0.3
Section J. Information and communication activities1.0All types of OKVED activities, the Komi Republic100.0
Source: compiled by the authors considering the data of the Federal State Statistics Service of the Russian Federation.
Table 11. Results of descriptive statistics of the variables of the total group.
ParametersAverage Income LevelFiscal Capacity LevelPoverty Level
Number of observations636363
Average value1.471.0312.64
Median value1.230.9112.70
Lower quartile0.950.699.30
Upper quartile2.291.0416.20
Standard deviation0.630.553.99
Standard error0.080.070.50
Skewness0.622.09−0.33
Kurtosis−1.463.49−1.20
Table 12. Characteristics of the total group regression model.
ParametersValues
Multiple R0.88
Multiple R-squared0.77
Adjusted R-squared0.76
Fisher’s criterion F (2.60)99.5
Statistical significance of the model, p<0.001
Standard error of the estimate1.95
Table 13. Regression analysis results; the total group.
ParametersRegression Analysis Results
BetaStandard Errors of BetaB CoefficientsB Standard ErrorStudent’s t-Testp
Intercept term--21.170.6632.3<0.001
Per capita income index−0.740.07−4.710.47−10.0<0.001
Fiscal capacity level−0.210.07−1.560.54−2.90.005
Table 14. Results of descriptive statistics for the variables of the group of the AZRF mining regions.
ParametersAverage Income LevelFiscal Capacity LevelPoverty Level
Number of observations353535
Average value1.851.211.25
Median value2.241.019.4
Lower quartile1.250.688
Upper quartile2.361.3115.7
Standard deviation0.60.684.3
Standard error0.10.120.73
Skewness−0.431.290.14
Kurtosis−1.770.28−1.59
Table 15. Characteristics of the regression model for the mining region group.
ParametersValues
Multiple R0.96
Multiple R-squared0.93
Adjusted R-squared0.92
Fisher’s criterion F (2.32)209.9
Statistical significance of the model, p<0.001
Standard error of the estimate1.18
Table 16. Regression analysis results; the mining region group.
ParametersRegression Analysis Results
BetaStandard Errors of BetaB CoefficientsB Standard ErrorStudent’s t-Testp
Intercept term--24.000.6636.5<0.001
Per capita income index−0.810.05−5.780.37−15.4<0.001
Fiscal capacity level−0.270.05−1.700.33−5.2<0.001
Disclaimer/Publisher’s Note: The statements, opinions and data contained in all publications are solely those of the individual author(s) and contributor(s) and not of MDPI and/or the editor(s). MDPI and/or the editor(s) disclaim responsibility for any injury to people or property resulting from any ideas, methods, instructions or products referred to in the content.

