Article

Monitoring of Ventilation, Portable Air Cleaner Operation, and Particulate Matter in California Classrooms: A Pilot Study

1
Environmental Health Laboratory Branch, Center for Laboratory Sciences, California Department of Public Health, Richmond, CA 94804, USA
2
Occupational Health Branch, Center for Healthy Communities, California Department of Public Health, Richmond, CA 94804, USA
3
Business, Facilities & Operations Division, Santa Clara County Office of Education, San Jose, CA 95131, USA
*
Author to whom correspondence should be addressed.
Sustainability 2024, 16(5), 2052; https://doi.org/10.3390/su16052052
Submission received: 28 December 2023 / Revised: 20 February 2024 / Accepted: 21 February 2024 / Published: 1 March 2024
(This article belongs to the Topic Indoor Air Quality and Built Environment)

Abstract

:
Interest in improving ventilation and indoor air quality (IAQ) in California schools has grown since the COVID-19 pandemic. This paper presents a field protocol for simultaneous monitoring of usage patterns of in-room portable air cleaners (PACs), indoor and outdoor concentrations and composition of particulate matter (PM), and CO2 as an indicator of outdoor air ventilation rates (VRs). This protocol was implemented for a 7-week pilot study in four occupied California classrooms in 2022. Monitoring results showed that VRs and indoor PM were generally well maintained in the classrooms studied. One classroom had much higher overall VRs, as well as higher average indoor PM2.5 concentrations compared to similar classrooms, suggesting a possible strong impact of window/door opening behavior on both VRs and indoor PM. The actual use patterns of PACs in these classrooms varied significantly. No clear correlations were observed between PAC use patterns and indoor PM2.5 concentrations in this pilot study, possibly due to low outdoor PM2.5 concentrations and already efficient central filtration (i.e., MERV 13 filters in central ventilation systems). Information gathered through such field monitoring can help schools to understand the actual classroom ventilation and IAQ conditions and best allocate resources to classrooms that need further IAQ improvements.

1. Introduction

Good indoor air quality (IAQ) is vital to public health because people spend most of their time indoors [1]. Indoor air pollutants, including particulate matter (PM), can have significant adverse health effects and contribute significantly to the global burden of disease [2]. The devastation caused by the COVID-19 pandemic further highlighted how poor ventilation and filtration in buildings can increase the transmission risk and severity of airborne respiratory diseases [3,4]. This is particularly important in schools, given the heightened vulnerability of children to air pollution.
Outdoor air ventilation in buildings dilutes indoor concentrations of multiple indoor-generated pollutants. Ensuring sufficient outdoor air ventilation is one of the most important measures for maintaining adequate IAQ. In California, the California Building Standards Code (Title 24) requires all buildings, including educational facilities, to have ventilation systems capable of providing at least the minimum outdoor air ventilation rates (VRs) specified in the code at the time that their building permit (for new construction or major innovation) was issued [5]. In addition, the California Education Code requires school districts to maintain schools in good repair, including providing heating, ventilation, and air conditioning (HVAC) systems that are functional and supply an adequate amount of air to all classrooms [6]. The California Code of Regulations (Title 8, §§ 5142–5143) also includes ventilation provisions that apply to schools and other public workplaces for the protection of workers [7,8]. Despite all these requirements, studies have shown that the actual ventilation in many California classrooms is less than the minimum VR specified in California building codes [9,10,11,12]. For example, one study estimated VRs in 162 California elementary school classrooms in three school districts using real-time carbon dioxide (CO2) monitoring results. They found that all school districts had median classroom VRs below the current California minimum VR standard of 7 L/s-person (i.e., more than half the classrooms in each district provided inadequate ventilation). For air-conditioned classrooms specifically, 25% had VRs less than 2 L/s-person [11]. Another more recent study of 94 California classrooms with recently retrofitted HVAC equipment estimated VRs using daily maximum 15 min CO2 concentrations. They observed that the mean VR across 94 classrooms was 5.2 L/s-person, which is also below the California minimum VR standard [12].
Beyond code-required minimum outdoor VR air flows, a broader definition of “equivalent outdoor” (or “clean”) air flow rates is now more commonly used in considering removal of virus-laden airborne particles [13,14]. Equivalent clean air flow rates are calculated as a combination of the outdoor air provided by mechanical or natural ventilation, recirculated HVAC air that has been filtered, and air that has been filtered by portable air cleaners (PACs). Studies have shown that the use of PACs can help to remove particles and pathogens indoors to reduce the risk of airborne transmission [15,16,17] and to reduce indoor exposure to outdoor pollution (e.g., due to wildfire smoke or heavy traffic) [18,19]. Many classrooms in California are now equipped with PACs intended to provide supplemental clean air. Online tools are now available to assist schools in sizing PACs and estimating their effectiveness [20,21]. However, these tools provide only theoretical estimates and assume ideal conditions (e.g., continuous PAC operation at the highest speed), which can differ significantly from actual operating conditions. Park et al. (2020) conducted an observational study of 34 elementary schools in Korea that did or did not use PACs, to evaluate the effect of using air cleaners on concentrations of indoor PM. They found that school location, classroom occupant density, and ambient PM levels could all significantly affect classroom PM concentrations, and the adjusted PM levels in classrooms using PACs were approximately 35% lower than in classrooms not using them [22]. To the best of our knowledge, there is no large-scale published study available on simultaneously monitored PAC in-use operations, outdoor VRs, and corresponding indoor and outdoor PM in California classrooms under various conditions of classroom ventilation and outdoor air quality. Since the COVID pandemic could have influenced the ways in which school facility staff and teachers operate classroom HVAC system ventilation and PAC settings [23,24], it is important to conduct studies that monitor the state of ventilation and IAQ conditions in California K-12 schools.
This paper reports a pilot monitoring study of classroom outdoor air VRs, PAC operation, indoor and outdoor PM, and indoor temperature and relative humidity (RH) over a 7-week period in 2022 in four mechanically ventilated classrooms in California. Indoor CO2 concentrations were continuously monitored and used to estimate VRs based on the mass-balance equation, an approach commonly used because directly measuring outdoor VR airflows can be difficult in many classrooms [11,12,25]. The concentrations of indoor and outdoor PM were also continuously monitored. Qualitative information on the morphology and elemental composition of indoor and outdoor particles, integrated over the entire study period, was also obtained. During the study period, facility staff and teachers were asked to maintain their usual operation of classroom HVAC systems, PAC, and opening/closing windows/doors.
The study was observational, with the primary goals of (1) testing a field protocol for simultaneous monitoring of VRs, PAC operation, and the correlation between indoor and outdoor PM, and (2) gaining an initial understanding of how teachers actually operate PACs in classrooms when they are not given specific operation instructions. Although limited by a small sample size, this study provides useful data on the actual ventilation and PAC operation conditions and their impact on IAQ in California classrooms already equipped with mechanical ventilation systems and efficient filters (Minimum Efficiency Reporting Value (MERV) 13). Additionally, this study provides insights on factors to consider in designing an effective larger study about the real-world use and effects of PACs in California classrooms.
The protocol proposed in this study combines existing methods previously used separately (low-cost sensors for PM monitoring, passive air samplers for PM morphology and composition, CO2 measurement as a ventilation rate indicator, and power measurement for PACs), and links the data together to gain overall insights into how a school’s ventilation and air cleaning systems are operated and performing on a daily basis. Traditionally, sustainable buildings often place more emphasis on the efficiency of resource use (e.g., energy efficiency), greenhouse gas emission reduction, and decarbonization. Building operations intended to ensure good IAQ, although acknowledged for the importance of enhancing health and student learning performance, have sometimes been associated with concerns of higher energy consumption. However, an important aspect of sustainability for buildings is the direct impact on occupants’ health and well-being. Sustainability requires a balance between immediate human impacts and larger environmental impacts. For this reason, it is important to fully understand the implications of specific building operation practices on both the welfare of the occupants and on energy use. The insights gained though the combined IAQ, ventilation, and air cleaner monitoring reported in this study can help schools to operate their ventilation and air cleaning systems more efficiently and effectively, and to optimize the balance of human and environmental effects. Schools can both maintain good IAQ and achieve their building sustainability goals if they make prompt system and behavior adjustments based on monitoring data.

2. Materials and Methods

2.1. Classroom Selection

This pilot study includes measurements in four classrooms in a California K-8 school (i.e., serving kindergarten to 8th grade students). The school site is in San Jose, California, and was selected based on availability. The nearest fixed ambient air monitoring site operated by the U.S. Environmental Protection Agency (EPA) is about 3 miles from the school site. Within this school, we purposely selected four similar mechanically ventilated classrooms based on the following considerations:
  • Elementary classrooms usually have a fixed group and number of students, which implies a more consistent total generation rate of CO2 and allows for more accurate estimation of daily VRs from CO2 measurements.
  • Having classrooms of the same mechanical ventilation system design and floor plans and within the same building helps to minimize the effects of variation in these factors on IAQ measurement results. The remaining influencing factors are mainly related to operational behaviors (e.g., HVAC maintenance and operation by school facility workers; classroom PAC operation, thermostat setting, and window/door opening by teachers), which were not altered in this observational study.

2.2. Classroom Characterization and Occupancy

Table 1 summarizes information about classroom characteristics and occupancy. Each classroom has its own separate but identical packaged rooftop unit providing mechanical ventilation. According to the school maintenance staff, the HVAC systems are programmed to operate from 2 h before classes start and then continuously until 2 h after classes end. The filters installed in the HVAC systems, all with a Minimum Efficiency Reporting Value (MERV) of 13, are replaced every 3 months. According to the school’s HVAC contractor, the outdoor air dampers were set at a fixed opening that could provide about 15–18% outdoor air fraction (i.e., outdoor air supply was about 15–18% of the total supply air flow rate) for all classrooms during the study period. Additionally, each classroom had already been equipped with a PAC. We conducted field visits before and after the study period and obtained characteristics of each classroom, including classroom dimensions, floor material, and PAC type and model. During the field visits, we also measured the classroom supply and return air flow rates using a balometer (CH-15D Standard Hood, Evergreen Telemetry, Mesa, AZ, USA) and then converted the measurements to air changes per hour (ACH). As for occupancy, the selected classrooms were either Grade 1 or 2 and expected to have a fixed group of students daily. We obtained daily records of the number of students in attendance from the school office.

2.3. Portable Air Cleaner Characteristics

Two brands/models of PAC were used in these classrooms (see Table 1). Both PAC models are based on a high-efficiency particulate air (HEPA) filter with an optional ionizer (i.e., a selection button turns it on or off). During the field visits, all ionizers were turned off. We assumed that the ionizers were kept off during the whole study period, and that our results reflect the effect of only the HEPA filters.
Before the study period, by measuring the power consumption at different speed settings for each PAC, we established a link between the power usage and specific PAC speed level settings (see Table 2).

2.4. Air Sampling and Monitoring of Indoor Environmental Parameters

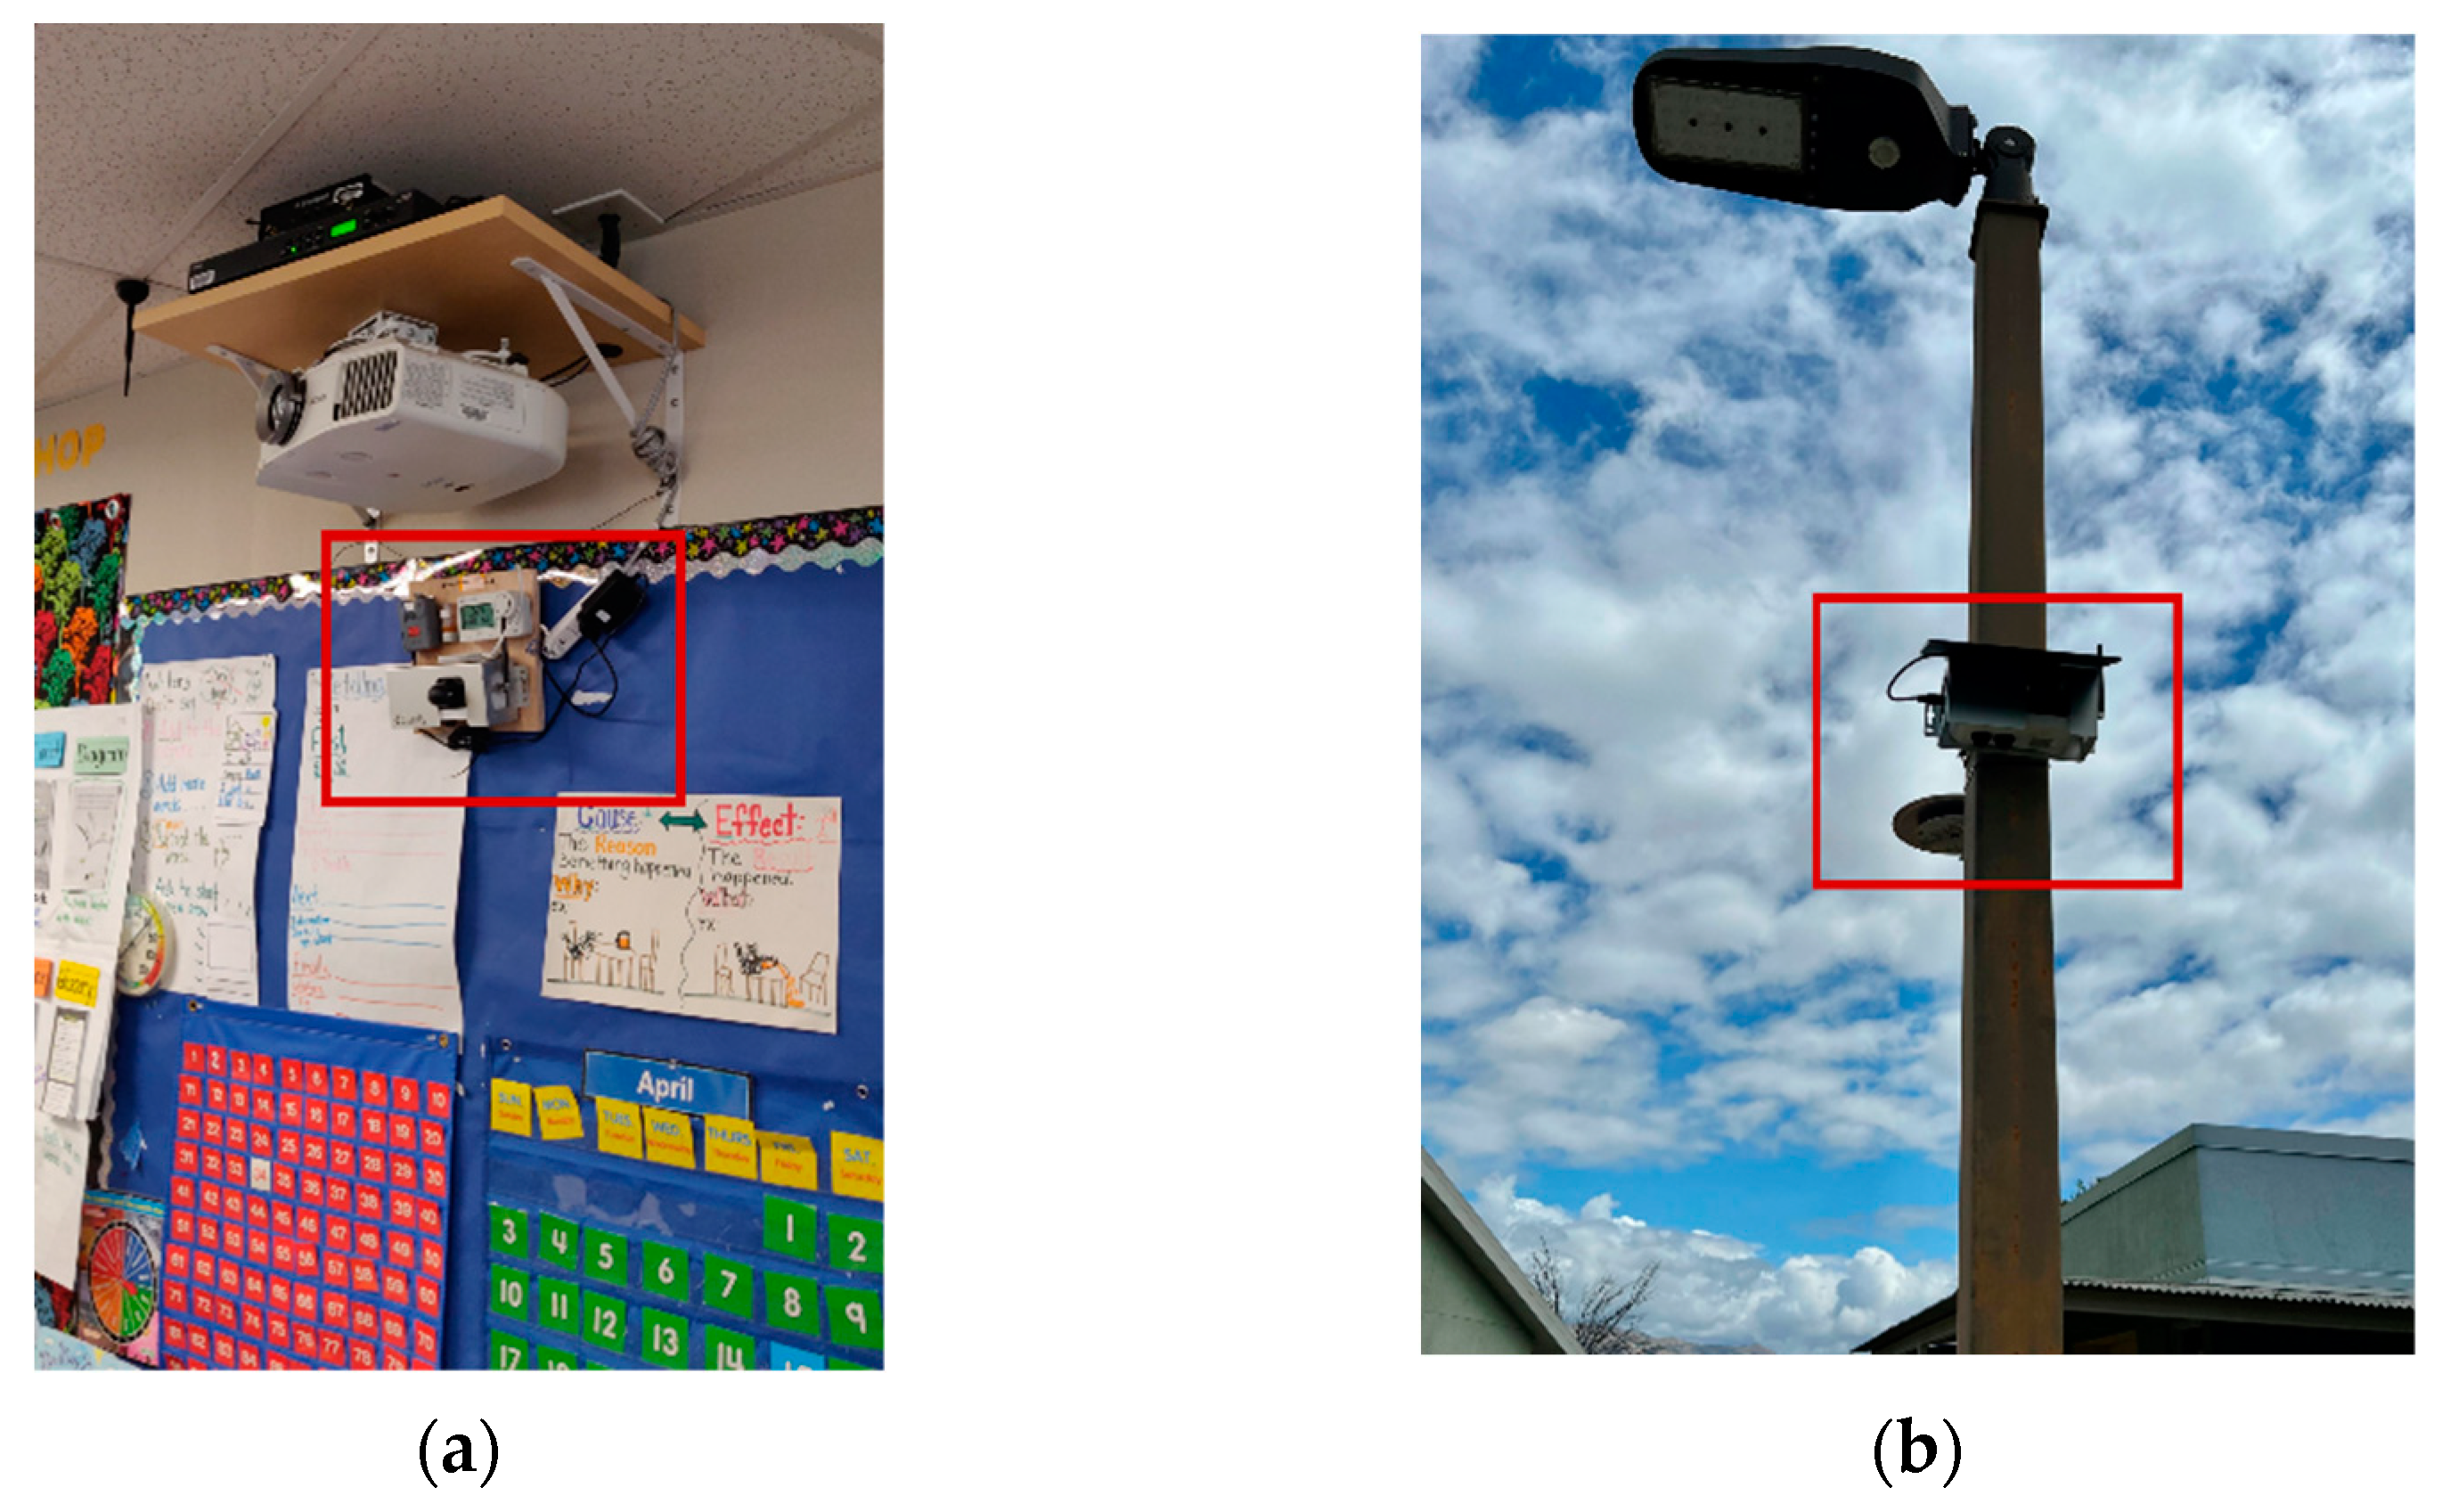
2.4.1. Real-Time Measurements and Instruments/Sensors

The PAC operation and selected IAQ parameters were continuously monitored over a 7-week period (25 April 2022–9 June 2022). All monitors were installed during the week of school spring break (18 April 2022–22 April 2022). Table 3 summarizes the parameters that were measured, the instruments/sensors used for each, and their specifications. All the sensors and dataloggers were newly purchased before the study. Sampling boards were preassembled containing a low-cost PM sensor, a passive aerosol sampler, and a datalogger with sensors for CO2, temperature, and relative humidity (RH). For each classroom, a sampling board was hung on a side wall about 1.6–1.8 m above the floor and at least 2 m away from the door and operable windows (Figure 1a). The PM sensor is based on light scattering technology with remote calibration by the sensor company. The CO2 sensor is based on nondispersive infrared (NDIR) detection technology. A plug load data recorder was connected to each PAC to record its power consumption, allowing us to track both PAC operation and fan speed level.
For outdoor air quality monitoring, a PM sensor and a passive aerosol sampler were installed on poles at a height of about 3 m above the ground at the school site (Figure 1b). The simultaneous indoor and outdoor monitoring allowed assessment of the relationship between indoor and outdoor PM.
No further operation instructions were given to school facility staff and teachers, so that measured results would reflect normal HVAC operation, PAC use, and window/door operation in each classroom.

2.4.2. Open-Face Passive Aerosol Samplers

The morphology and chemical composition of PM are important information for understanding toxicity and identifying the sources and types of PM. In this study, we collected PM using open-faced passive samplers (OPS) both outdoors and inside each classroom. The in-house-developed passive samplers were left open to the air during the entire study period, and later analyzed using scanning electron microscopy (SEM) (Tescan MIRA3 field emission SEM (Tescan, Brno, Czech Republic) with Bruker Quantax EDS (Bruker corporation, Billerica, MA, USA)) to measure qualitative PM morphology and elemental composition for particles sizes of 1–100 μm. The SEM was operated in high-vacuum mode, at 20 KV accelerating voltage and a working distance of 10 mm. The samples were not coated to avoid introducing unnecessary interference. To avoid charging effects, the analysis used either back scattering electron (BSE) mode or a combined imaging mode of 50% secondary electrons (SE) + 50% BSE. The same samplers have been used in our previous study for IAQ in childcare facilities [26].

2.5. Estimation of Daily Average Outdoor Air Ventilation Rate (VR)

The steady-state CO2 method was used to estimate daily VRs. Several previous school studies used a similar approach to estimate classroom VRs [11,12,27,28,29]. The underlying assumptions for using a steady-state approach, as outlined by Kabirikopaei and Lau (2020) [27], include:
  • The classroom can be reasonably regarded as a well-mixed single zone.
  • The number of students, the outdoor VR, and the outdoor CO2 concentration can be approximated as constants during the analysis period.
  • The student cumulative occupied hours are sufficiently long and the outdoor VRs are sufficiently high that a true (or near) steady-state can be reached within a school day.
In this study, since the number of students was fixed, the cumulative student-occupied hours were mostly over 5 h, and the classrooms were all mechanically ventilated with the aim of providing at least the minimum VRs required by the building code, we assume that the classrooms were well mixed and could reach near steady-state CO2 concentrations during a school day.
All VR estimations using CO2 concentrations were limited to school hours according to the official bell schedule (i.e., 8:10 a.m. to 2:35 p.m. for Monday/Tuesday/Thursday/Friday; 8:10 a.m. to 12:35 p.m. for Wednesday/Minimum Day). Using the steady-state mass balance model, the VR per person can be estimated for each school day by Equation (1).
Q = 10 6 G C S S C o u t d o o r
where
  • Q—outdoor air ventilation rate per person (L/s per person).
  • G—average CO2 generation rate per person in classroom (L/s per person).
  • Css—steady-state CO2 concentration in classroom (ppm).
  • Coutdoor—outdoor CO2 concentration (ppm).
The CO2 generation rate (G) is affected by factors such as the student age group, gender, body mass, and activity level. The choice of the average CO2 generation rate per person could lead to uncertainties in the estimated VRs. In this study, we used the value for age group 6–8 (i.e., 0.0031 L/s-person) from Batterman (2017) [30].
For the steady-state CO2 concentration (Css), we used the 95th percentile of CO2 values during school hours as an estimate. Based on the manufacturer’s specifications, the measurement accuracy of the CO2 sensors used in this study (HOBO MAX 1102A, ONSET, Bourne, MA, USA) was ±50 ppm or ±5% of the reading at 25 °C. This level of uncertainty is common for indoor CO2 sensors available in the market today.
For the outdoor CO2 concentration (Coutdoor), we assumed 400 ppm. Even though 400 ppm is often used as a reasonable estimate, actual outdoor values vary by location and may often be higher. Therefore, the assumed value of Coutdoor can be another source of uncertainty in VR estimates.
Due to the uncertainties discussed above for each input parameter, the estimated VRs based on the steady-state CO2 method were provided here only as an approximate indicator of classroom daily VRs.

2.6. Characterization of Indoor–Outdoor PM Relationships

The PM sensors report both PM2.5 (i.e., fine particles with a diameter of 2.5 µm or less) and PM10 (i.e., particles with a diameter of 10 µm or less). However, existing studies [31,32] and communications with the sensor company suggest that such low-cost sensors may not provide accurate readings for PM10. Therefore, we only focused on the analysis of PM2.5 concentrations.
The 1 h mean PM2.5 calibrated mass concentrations obtained from the sensor data platform were used. All analyses were limited to school hours according to the official bell schedule (i.e., using 1 h mean concentration data from 8 a.m. to 3 p.m. for Monday/Tuesday/Thursday/Friday, and from 8 a.m. to 1 p.m. for Wednesday/Minimum Day). The average daily PM2.5 concentrations (for school hours only) were calculated for outdoors and for each classroom. The indoor/outdoor (I/O) ratios and the percent indoor reductions from outdoor PM 2.5 concentrations (i.e., [(Outdoor Concentration − Indoor Concentration)/Outdoor Concentration]) were then calculated for each classroom.
The average indoor and outdoor particle morphology and elemental composition (i.e., integrated over the entire study period) were also compared through analysis of the passive aerosol samplers. Since the analysis was conducted qualitatively (rather than quantitatively), we report only the qualitative differences between indoor and outdoor PM types in Section 3.3 and Appendix A as additional information to support the general study findings.

3. Results

3.1. Classroom PAC Use Pattern

Table 4 summarizes classroom PAC use patterns based on the continuous power usage measurements and our prior determination of power usage for each fan speed level (see Table 2).
For the PAC operation time, we observed three general patterns, with some variation:
  • Continuous operation (i.e., including days/nights/weekends).
  • Operation during occupied hours only (i.e., turned on when teacher arrived in the morning and turned off when teacher left in the afternoon).
  • Sporadic/random operation with no clear pattern.
For the speed level settings, we observed PAC operation at all speed levels (i.e., Levels 1–4 but not Turbo), although the mid-level speeds (i.e., Level 2 or 3) seemed to be used more often.
These results suggest a lack of standardized direction in the operation of PACs, as teachers used them in a wide variety of ways.

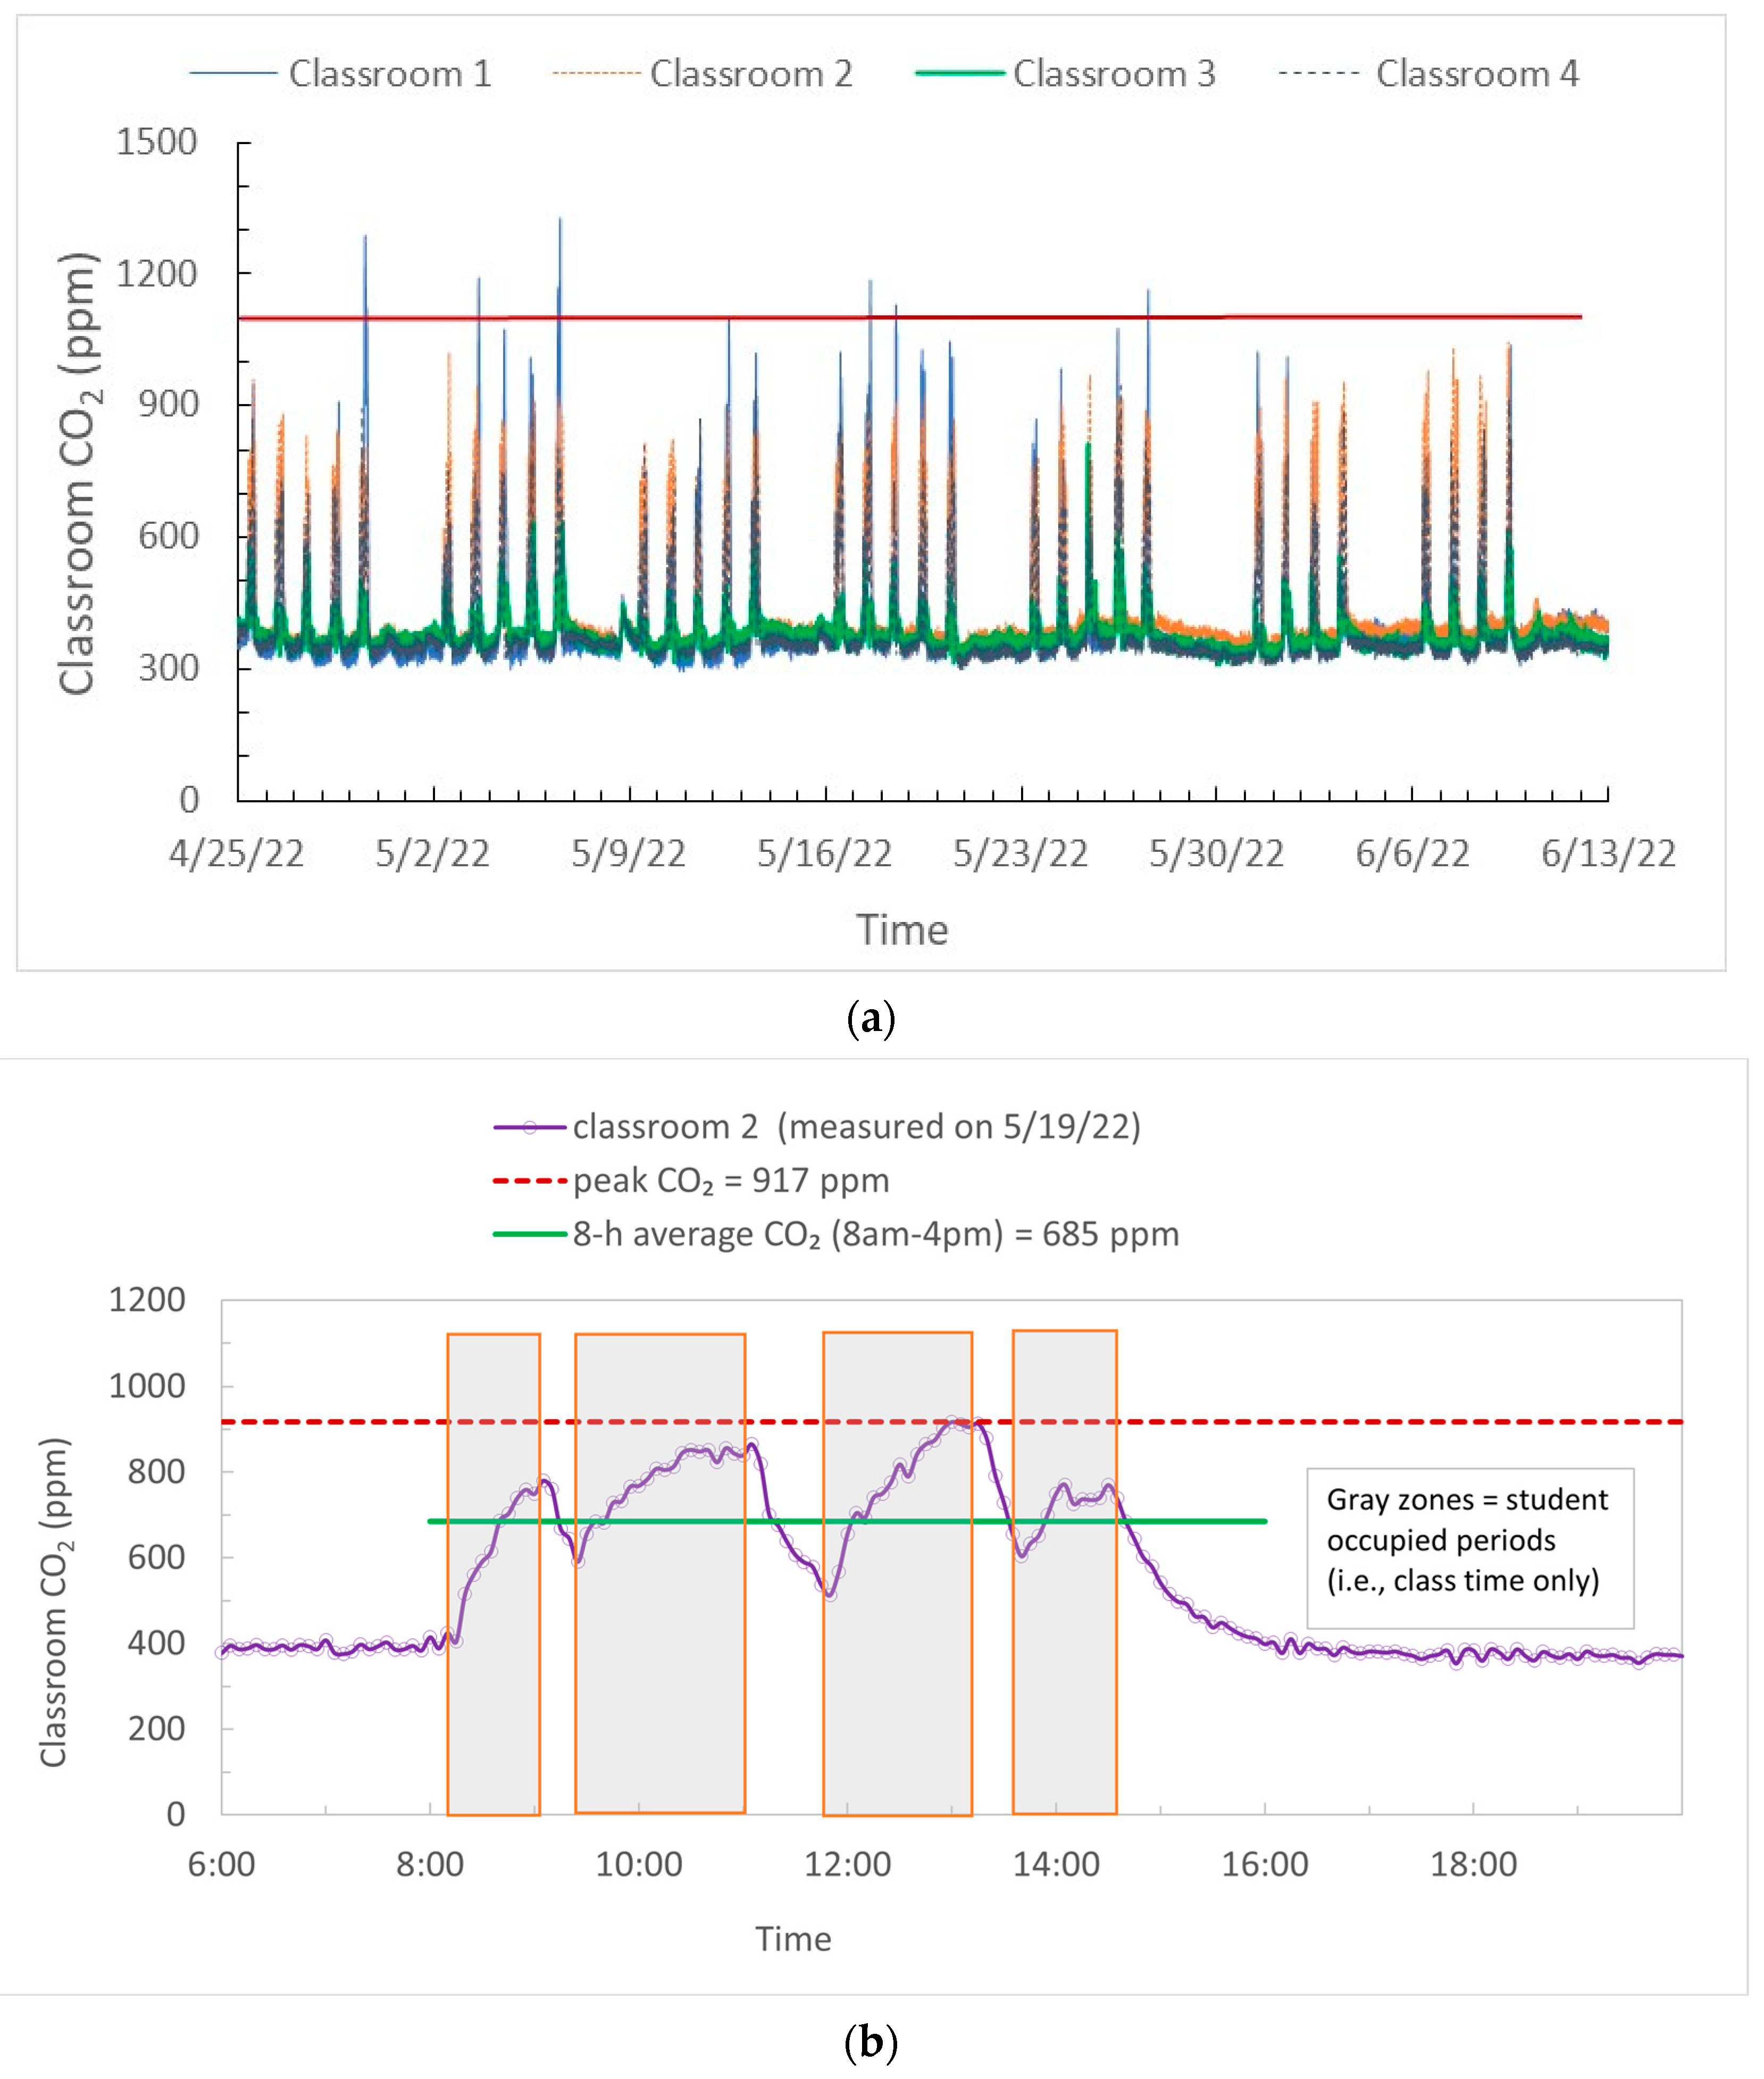
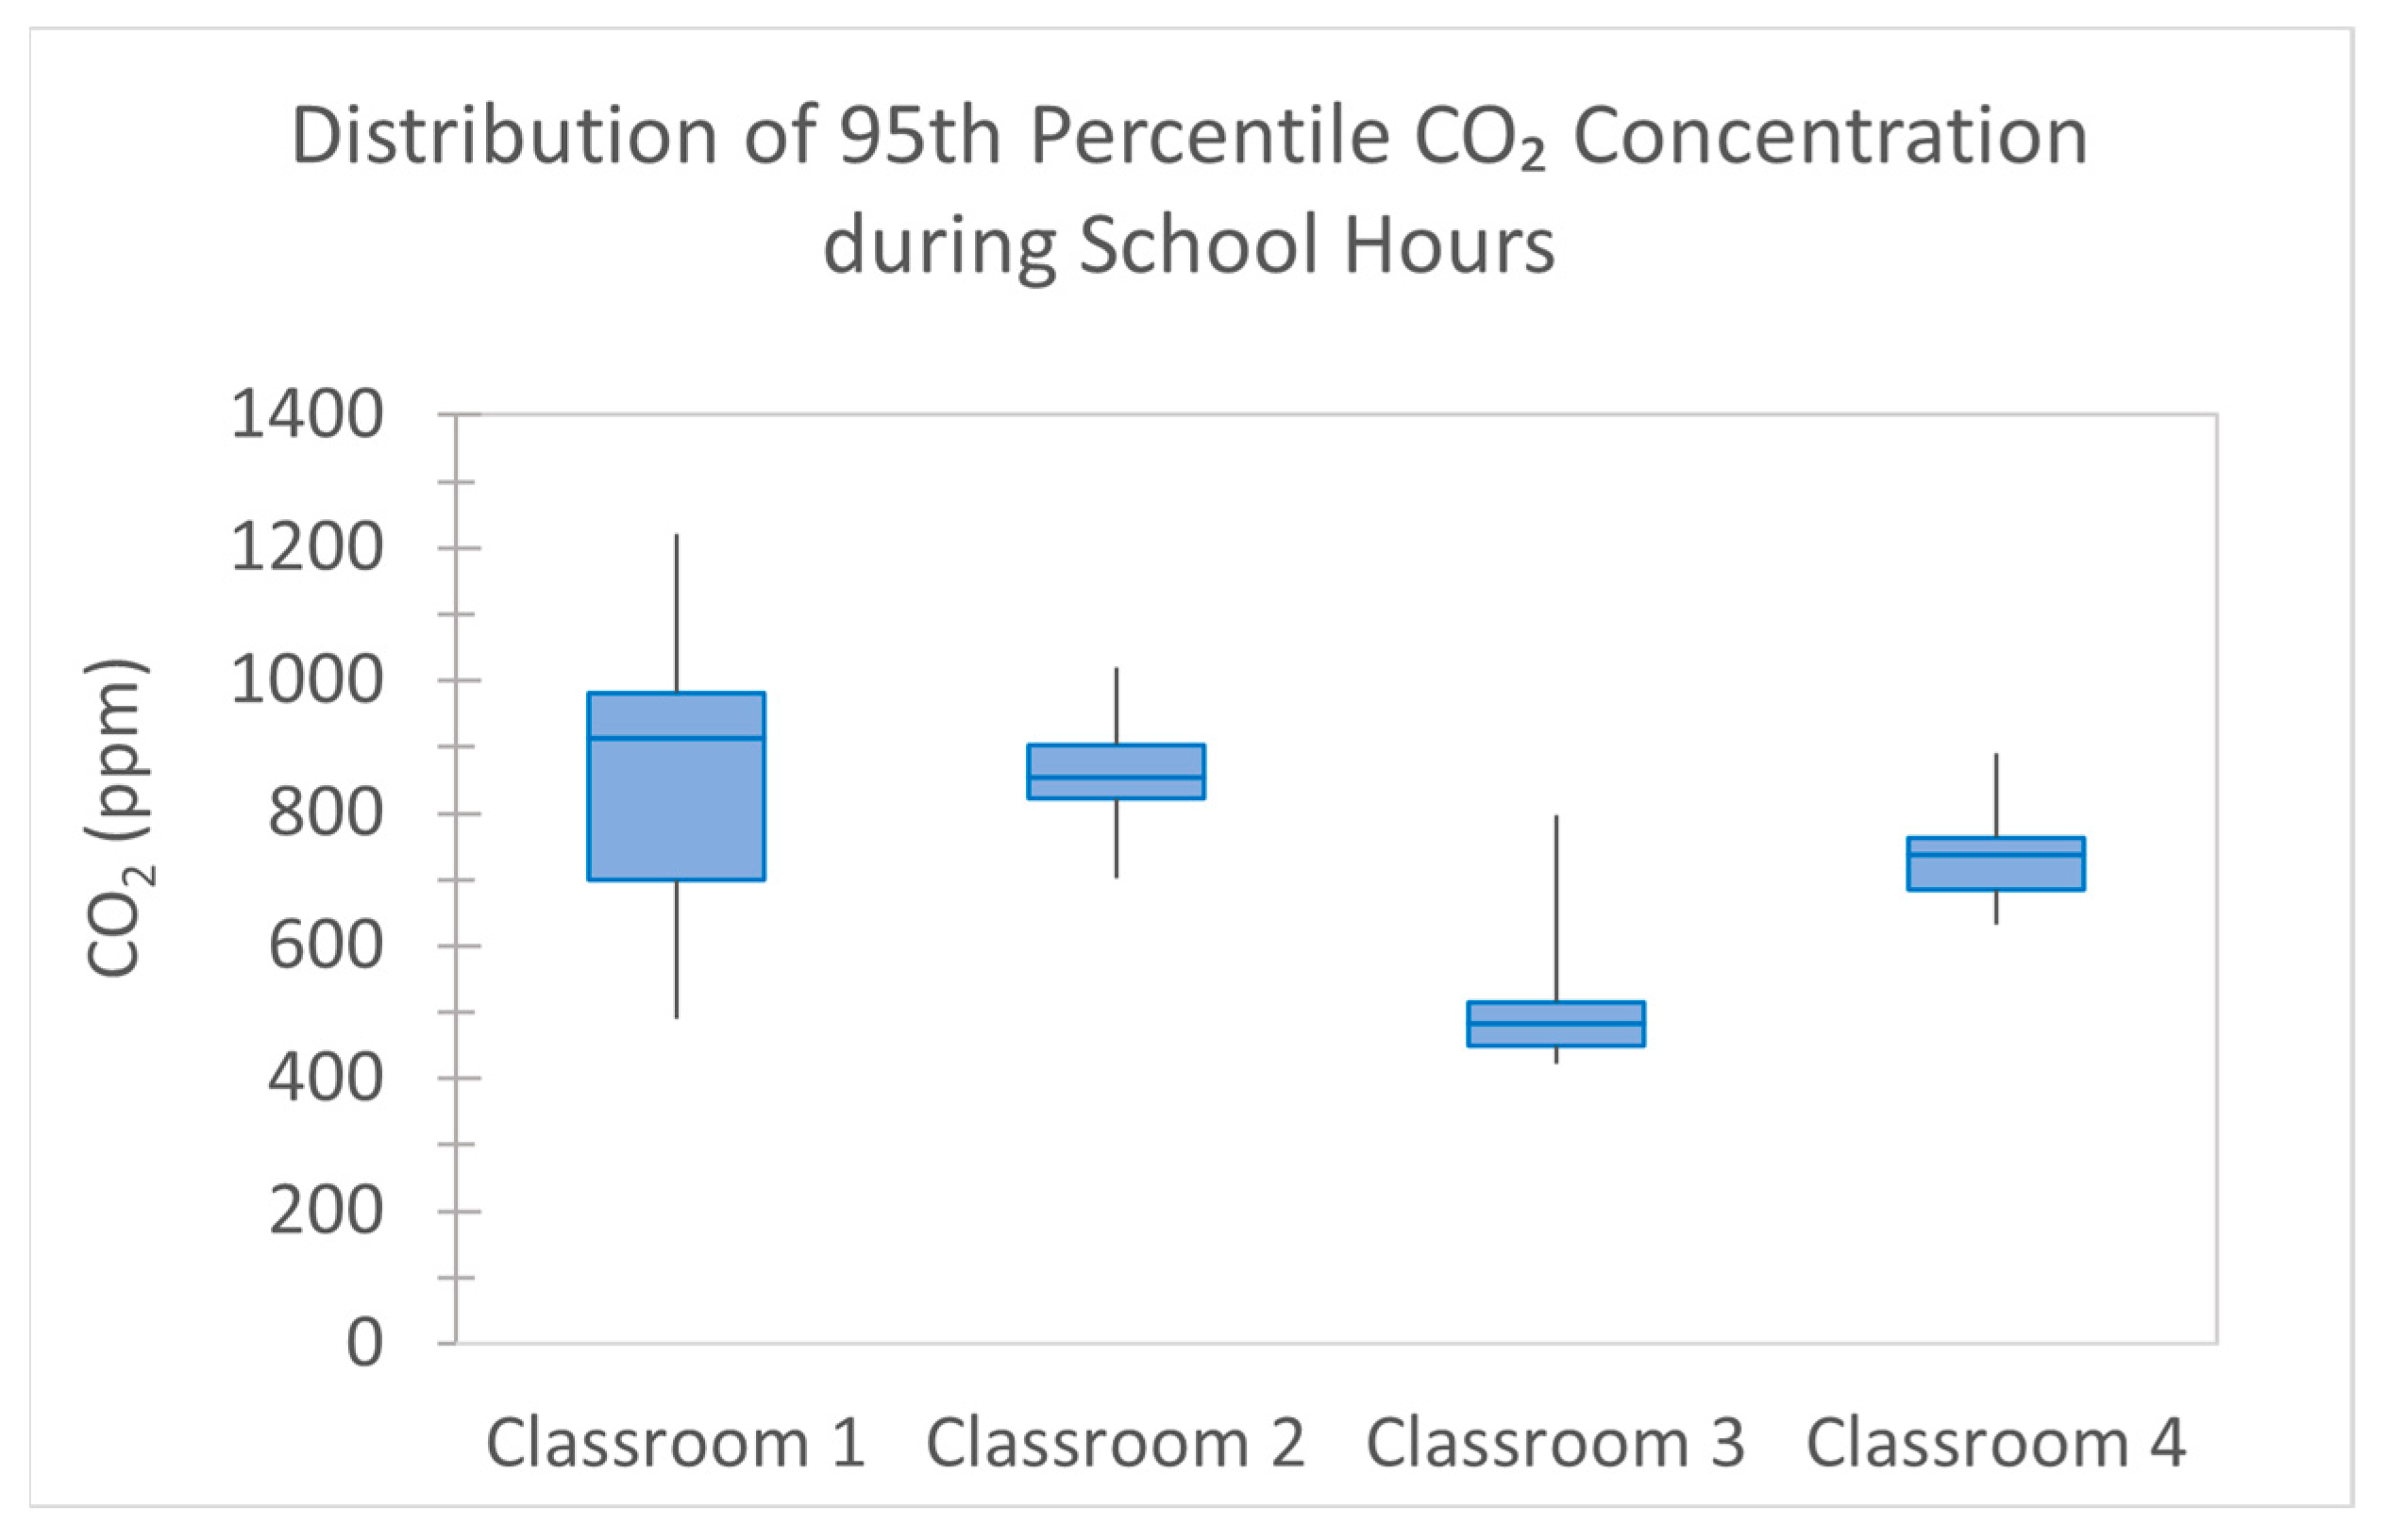
3.2. Classroom CO2 Concentrations

Figure 2a shows the classroom CO2 concentrations over the 7-week study period. A typical classroom CO2 concentration profile during a school day that further illustrates daily details is shown in Figure 2b. The CO2 pattern is clear. The background CO2 concentrations during unoccupied times (e.g., nighttime and weekend) were stable. There were apparent increases in CO2 concentration in all classrooms during the occupied school hours. For each school day, the indoor CO2 concentration began to increase at the beginning of the day when students entered the classroom. Indoor CO2 had a dynamic increase or decrease corresponding to the class bell schedule during the day. After dismissal of the students, it gradually decreased to near background level. Except for a few days in classroom 1, the peak CO2 concentrations were all below 1100 ppm. Although no CO2 guideline value exists for current California classrooms, the 2022 California Green Building (CalGREEN) Code has set an indoor CO2 threshold of 1100 ppm for triggering notification to the facility staff or the teacher in newly constructed K-12 classrooms.
Figure 3 presents box plots comparing the distribution of daily 95th percentile CO2 concentrations during school hours among the four classrooms studied. The results indicate that although these four classrooms have the same mechanical ventilation systems by design, the 95th percentile daily CO2 concentrations varied for different days in each classroom and among different classrooms. The 95th percentile CO2 concentrations in classroom 1 had larger daily variations compared to the other classrooms, as shown by the larger interquartile range. The 95th percentile CO2 concentrations were less than 600 ppm on most days in classroom 3, which is substantially lower than in other classrooms.

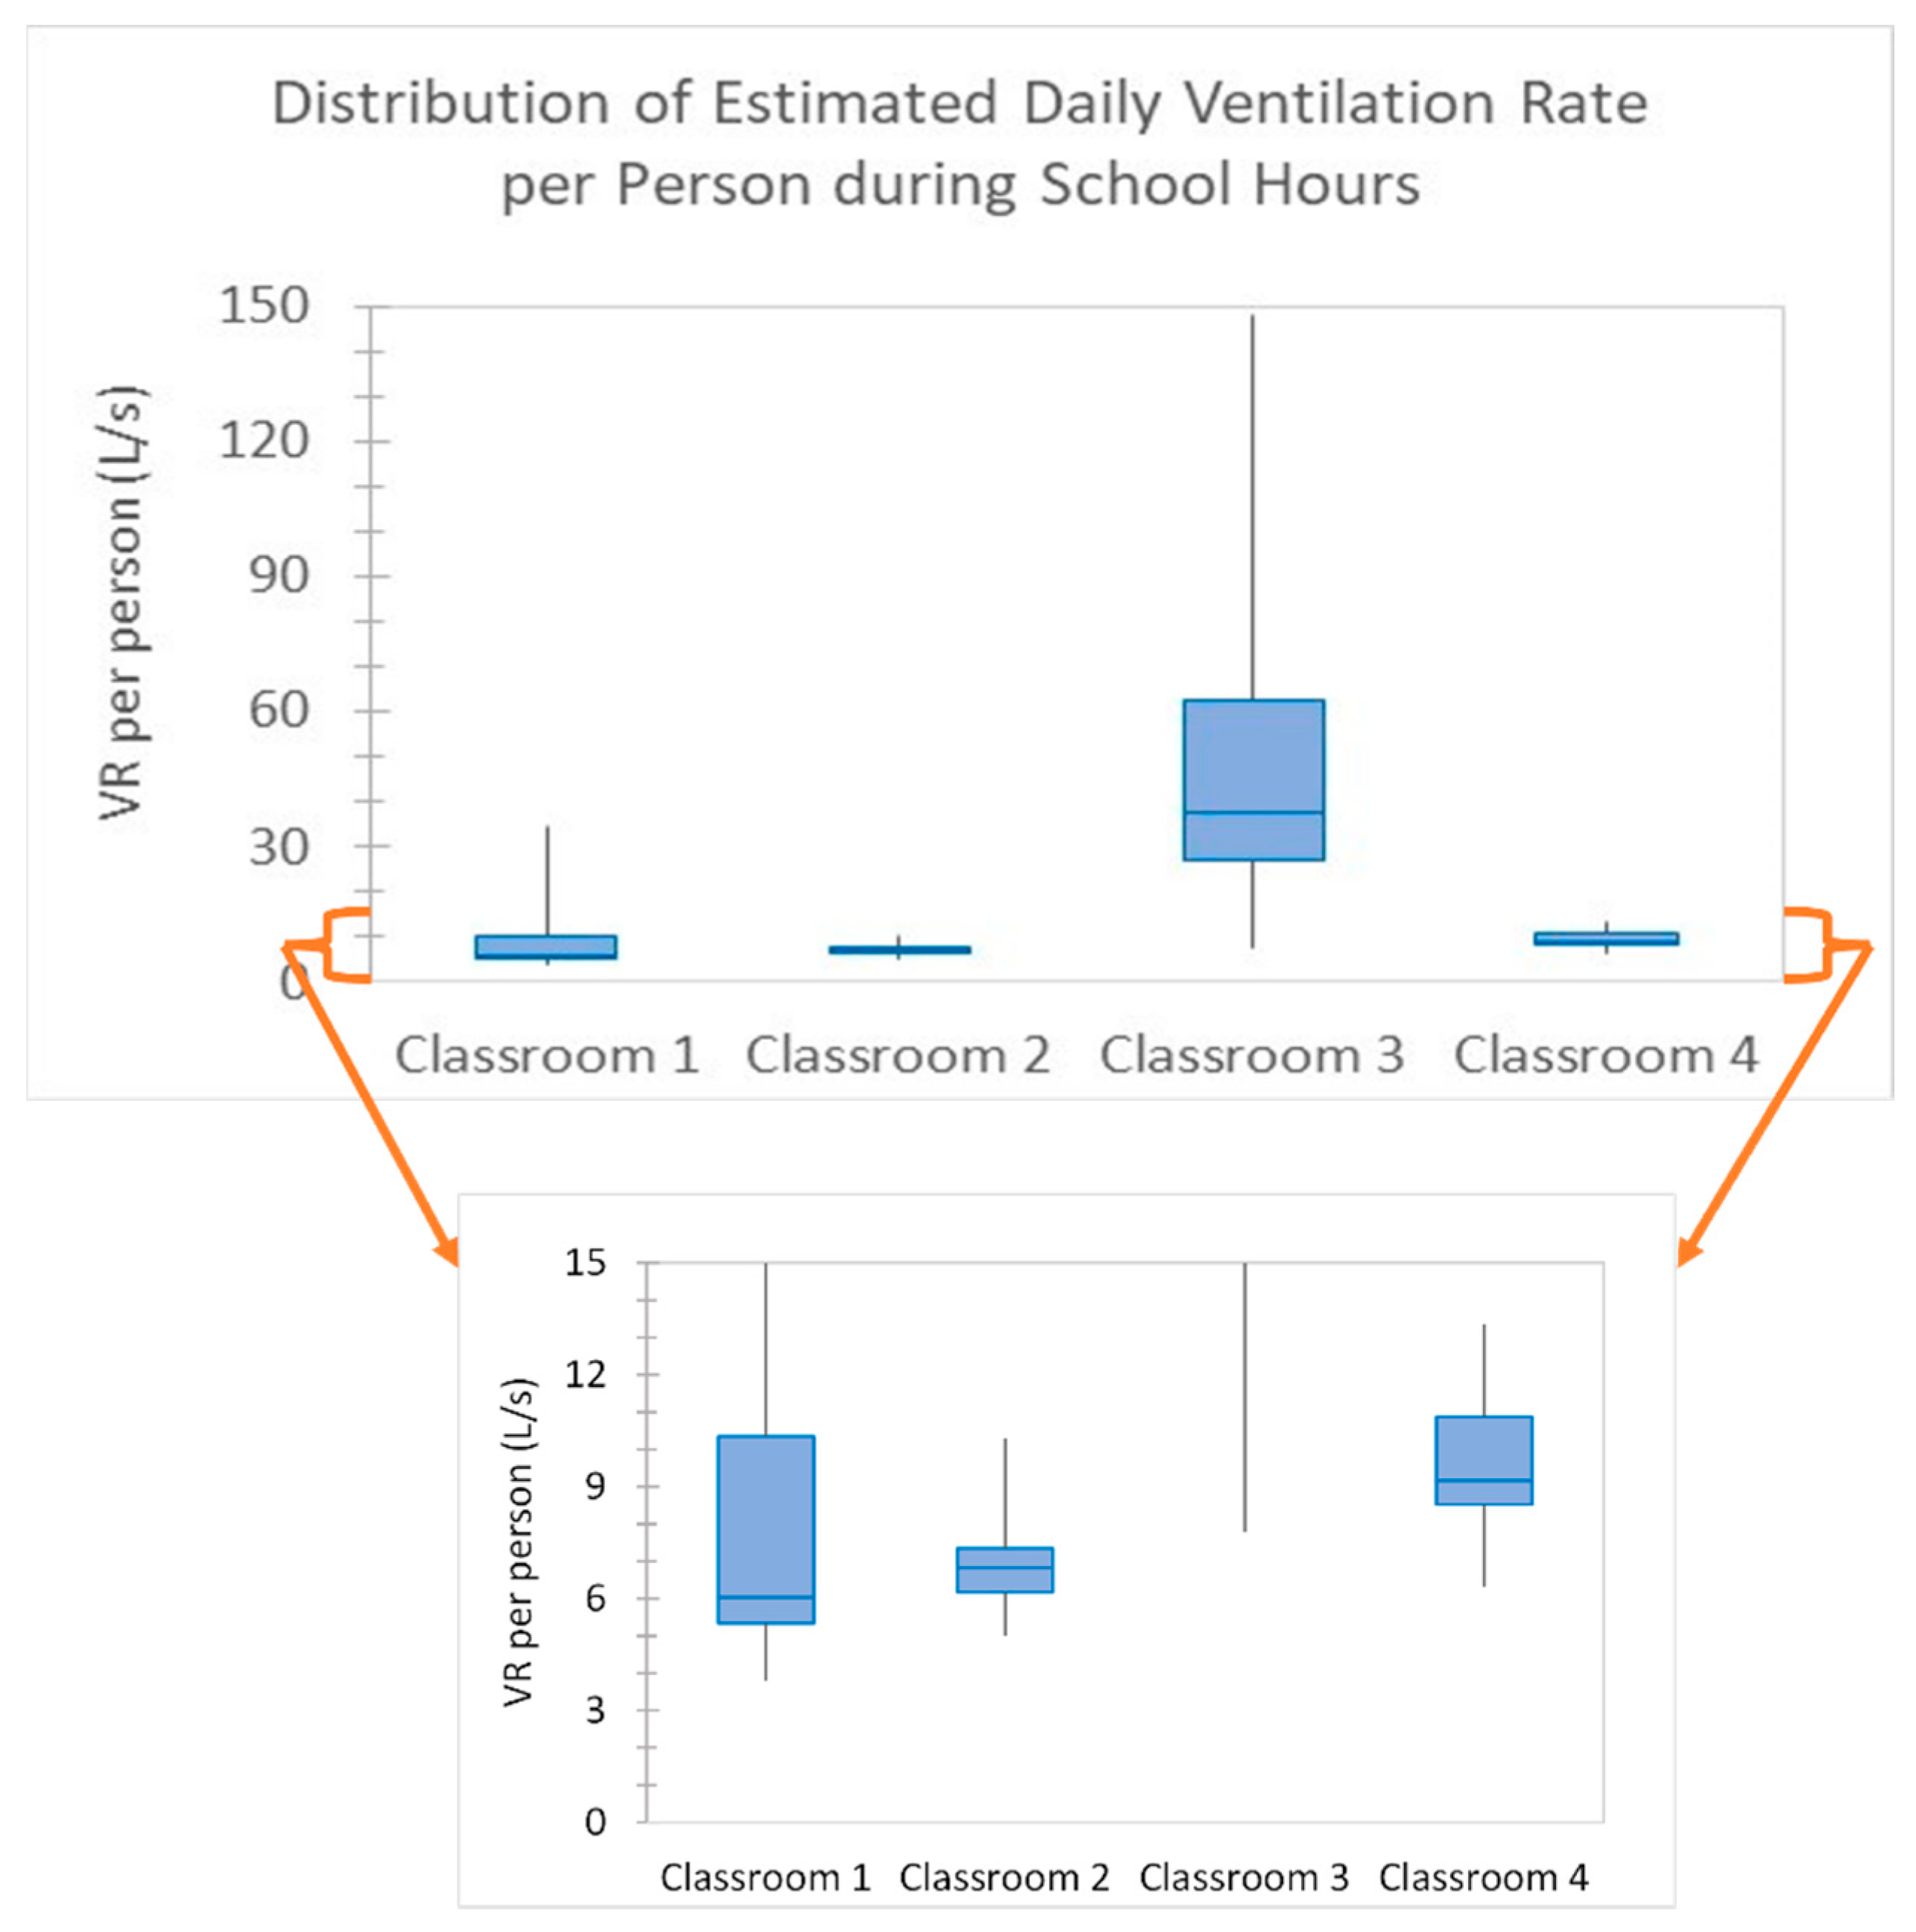
3.3. Estimated Classroom Outdoor Air Ventilation Rates (VRs)

Figure 4 presents the box plot of estimated daily VRs per person using the method described in Section 2.5. Similar to the CO2 concentration measurement results, the estimated VRs varied for different days in each classroom and among different classrooms. It is important to note that the VRs estimated based on CO2 measurements reflect the total amount of outdoor air entering indoors (i.e., the sum of outdoor air entering through the mechanical HVAC system, open windows and doors, as well as infiltration through the building envelope), not only from mechanical ventilation.
The median values of estimated daily VRs during school hours were 6.0, 6.8, 37.4, and 9.2 L/s-person for classrooms 1 to 4, respectively. The mean values of estimated daily VRs over the study period were 8.8, 6.9, 48.8, and 9.5 L/s-person for classrooms 1 to 4, respectively. The median and mean values were close for classrooms 2 and 4. The larger difference between the median and mean value of estimated daily VRs in classroom 1 was consistent with the larger daily variations of 95th percentile CO2 concentrations measured in this classroom. From the one-time measurement during the field visit day, we observed a substantially larger difference between the total supply air flow rates and return air flow rates measured using the balometer in this classroom compared to classrooms 2 and 4, suggesting that the mechanical ventilation system in this classroom might not be well balanced and thus led to more variation in providing daily outdoor air ventilation. As for classroom 3, the estimated daily VRs were much higher (i.e., with a mean almost six times as high as the overall mean of the other three classrooms, and substantially above the minimum 7 L/s-person VR required by the California building code) compared to the other three classrooms. This was consistent with the much lower 95th percentile CO2 concentrations measured in this classroom, suggesting that outdoor air other than that from the mechanical ventilation alone was entering indoors during the study period (such as from open windows/doors). The low indoor CO2 concentrations also led to larger uncertainties in the estimated VRs, which will be discussed in more detail in Section 4.3.

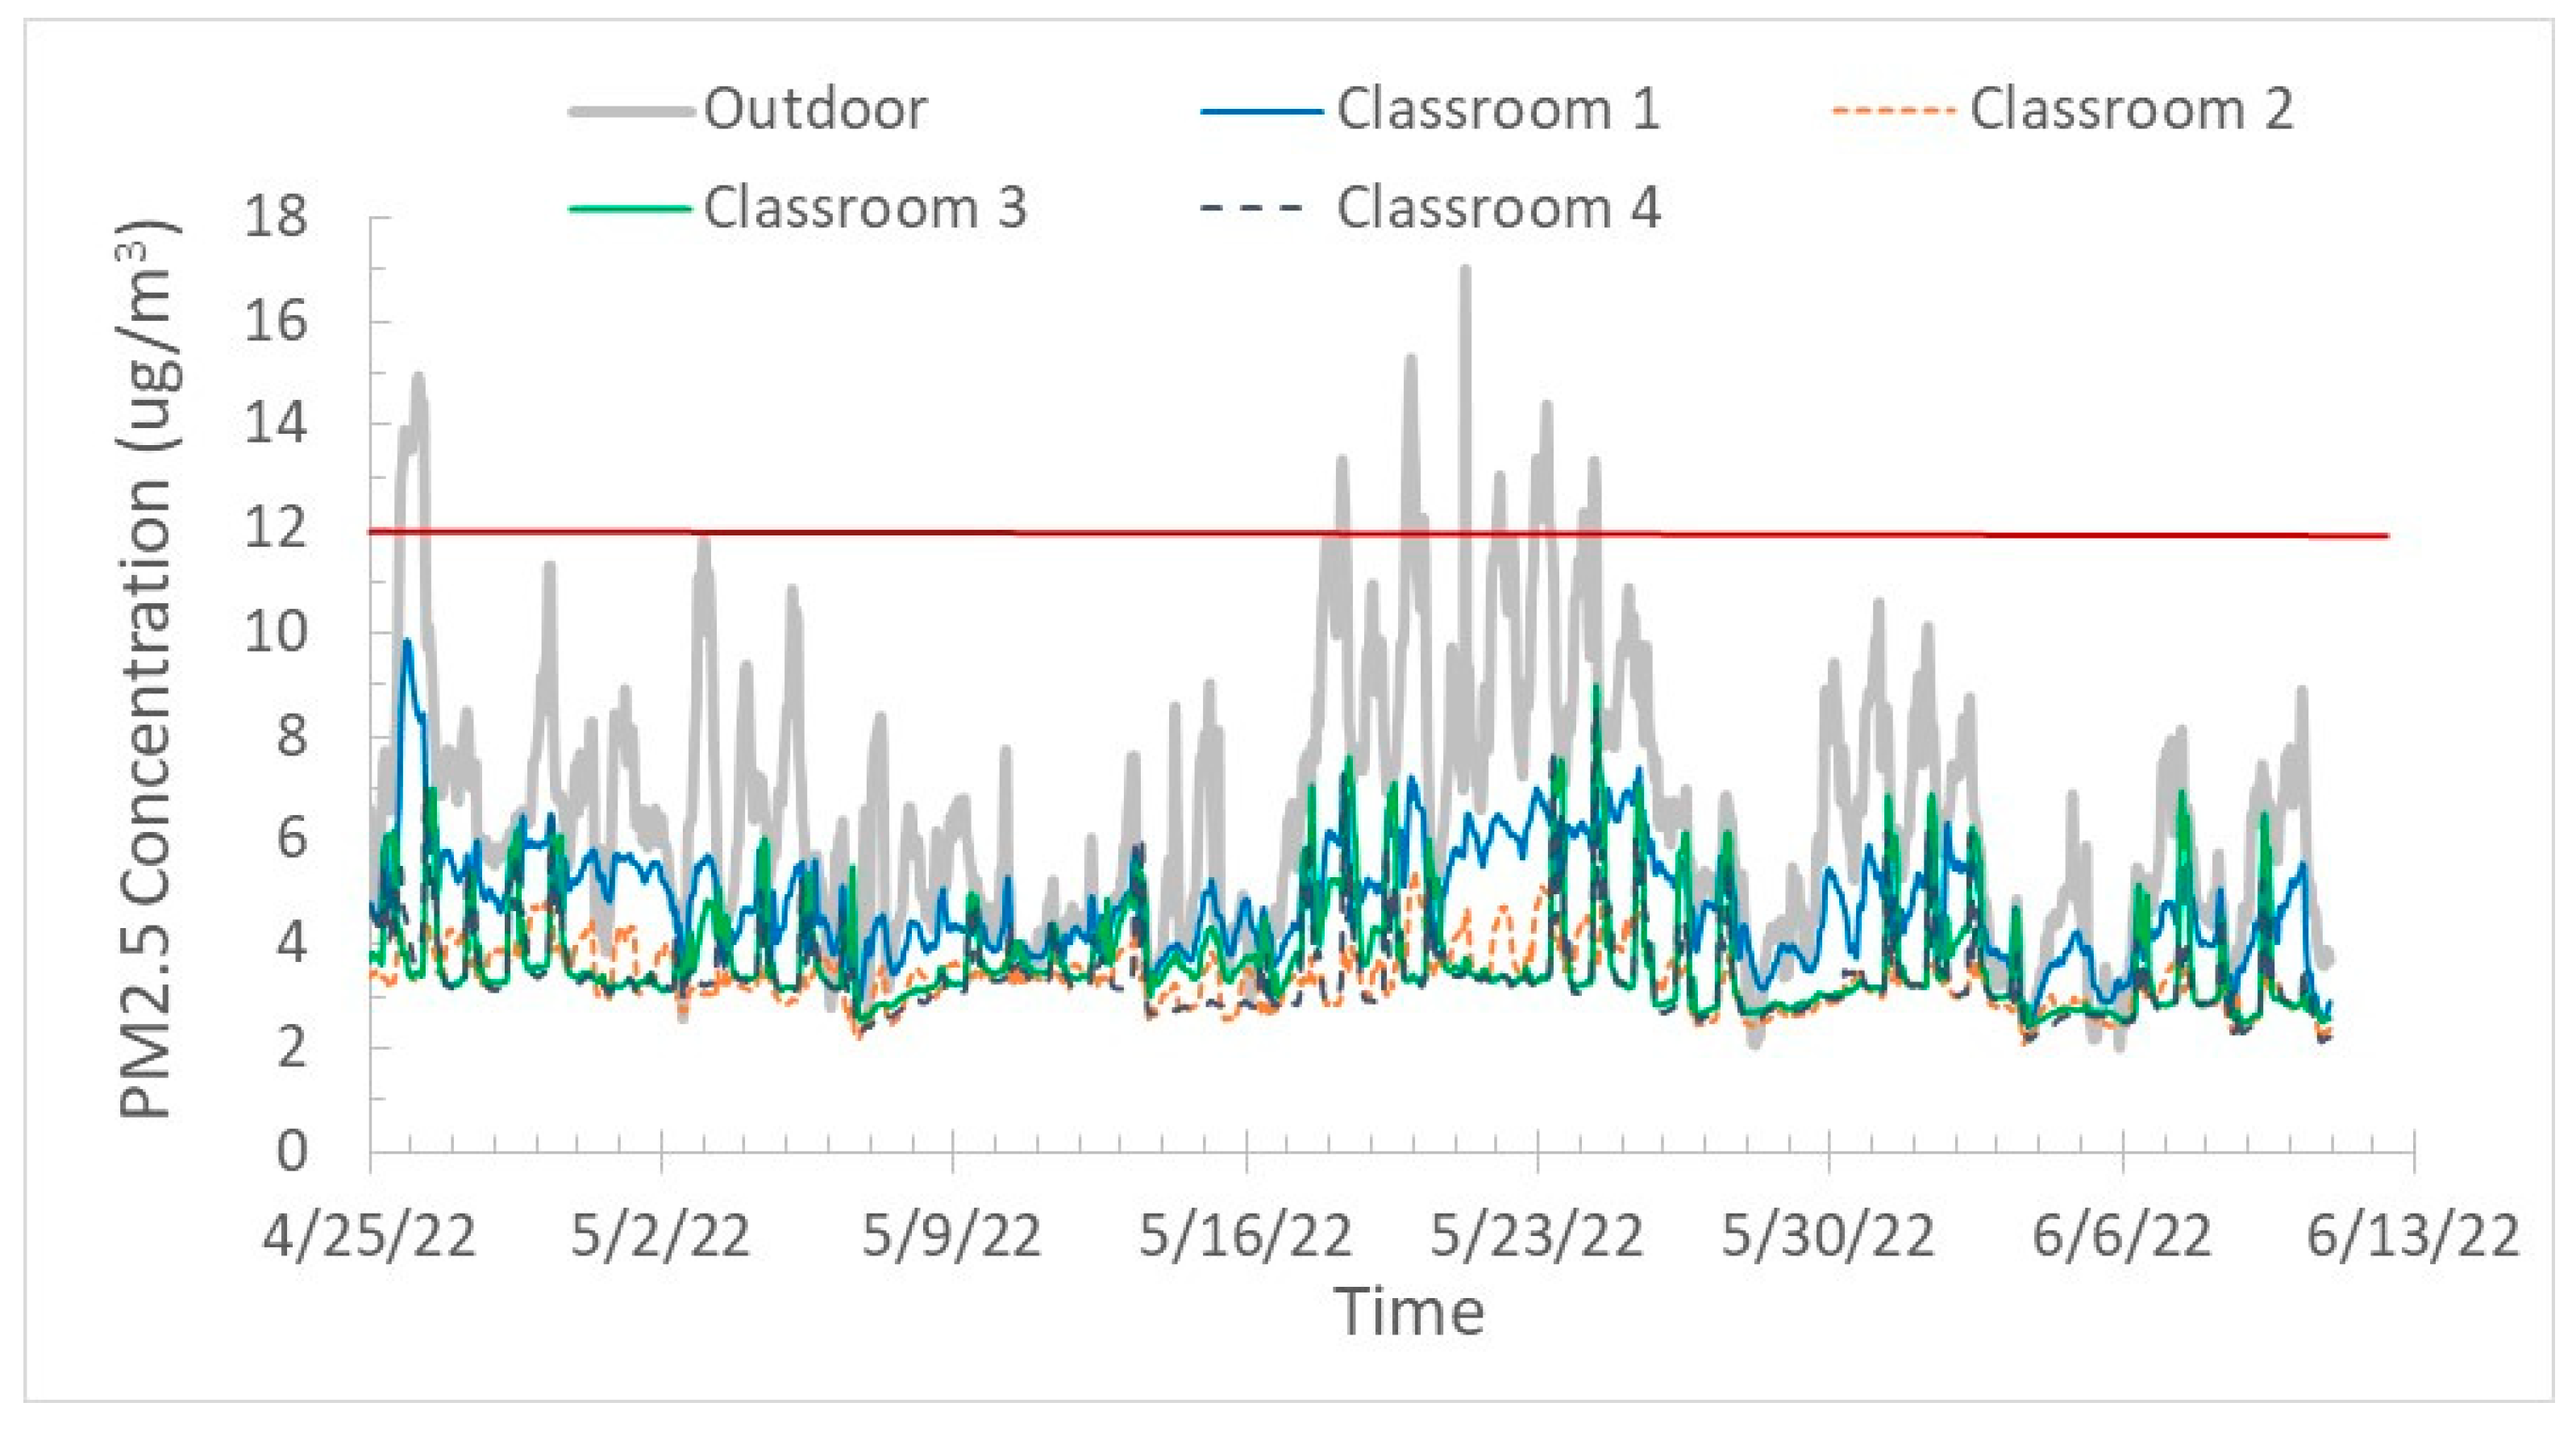
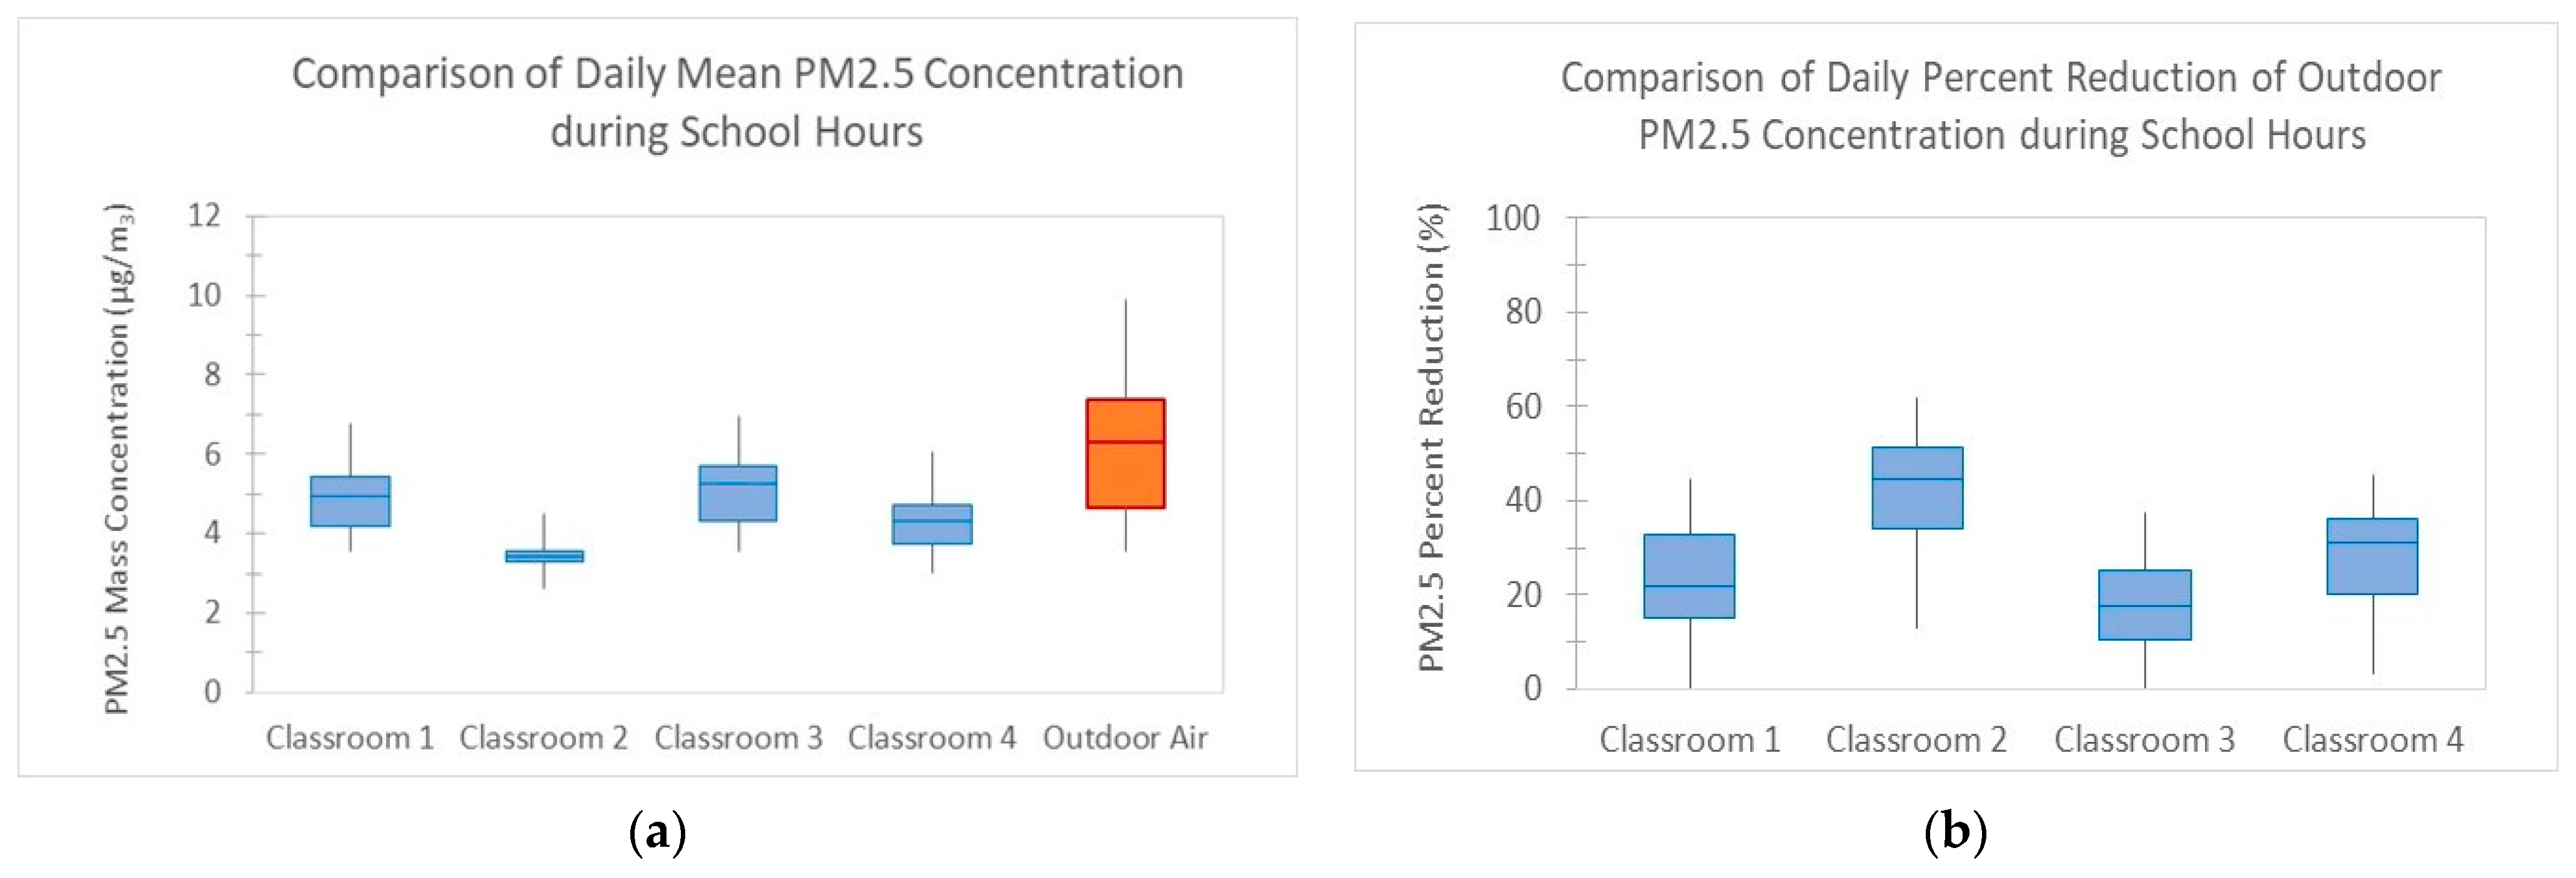
3.4. Indoor–Outdoor PM Relationship

3.4.1. PM2.5 Mass Concentration

Figure 5 shows the measured classroom as well as outdoor PM2.5 calibrated mass concentrations. Currently, there is no IAQ standard that specifically regulates indoor PM2.5 concentrations in the U.S. For ambient (outdoor) air, the US Environmental Protection Agency (EPA) regulates both 24 h and annual PM2.5 concentrations. The 24 h standards (35 µg/m3) are designed to protect the public from short-term exposure, and annual standards (12 µg/m3) are designed to protect the public from long-term exposure. 12 µg/m3 is also the upper end of the range for the “Good” Air Quality Index (AQI) category defined by the U.S. EPA. The results indicate that the outdoor air quality at the school site during the study period was mostly good (PM2.5 < 12 µg/m3), with only a few days listed as moderate (PM2.5 between 12.1–35.4 µg/m3). The classroom indoor PM2.5 concentrations were all lower than 12 µg/m3, and were lower than outdoor concentrations whenever the outdoor concentrations were relatively high (>10 µg/m3), suggesting the effectiveness of the filtration strategies used in these classrooms (e.g., PACs and MERV 13 filters) for removing fine particles.
Figure 6a presents box plots of daily mean PM2.5 concentrations during school hours in classrooms, as well as corresponding outdoor values. The distribution of the daily percent indoor reductions from outdoor PM2.5 concentrations is plotted in Figure 6b. The median percent indoor reductions from outdoor PM2.5 concentrations range from 15% to 45% among the four classrooms. Classroom 3 had the lowest median percent reduction (15%). This lower reduction is consistent with the observation of substantially lower indoor CO2 concentrations and higher estimated daily VRs compared to other classrooms, suggesting that an extra amount of unfiltered outdoor air might be entering indoors through open windows or doors.

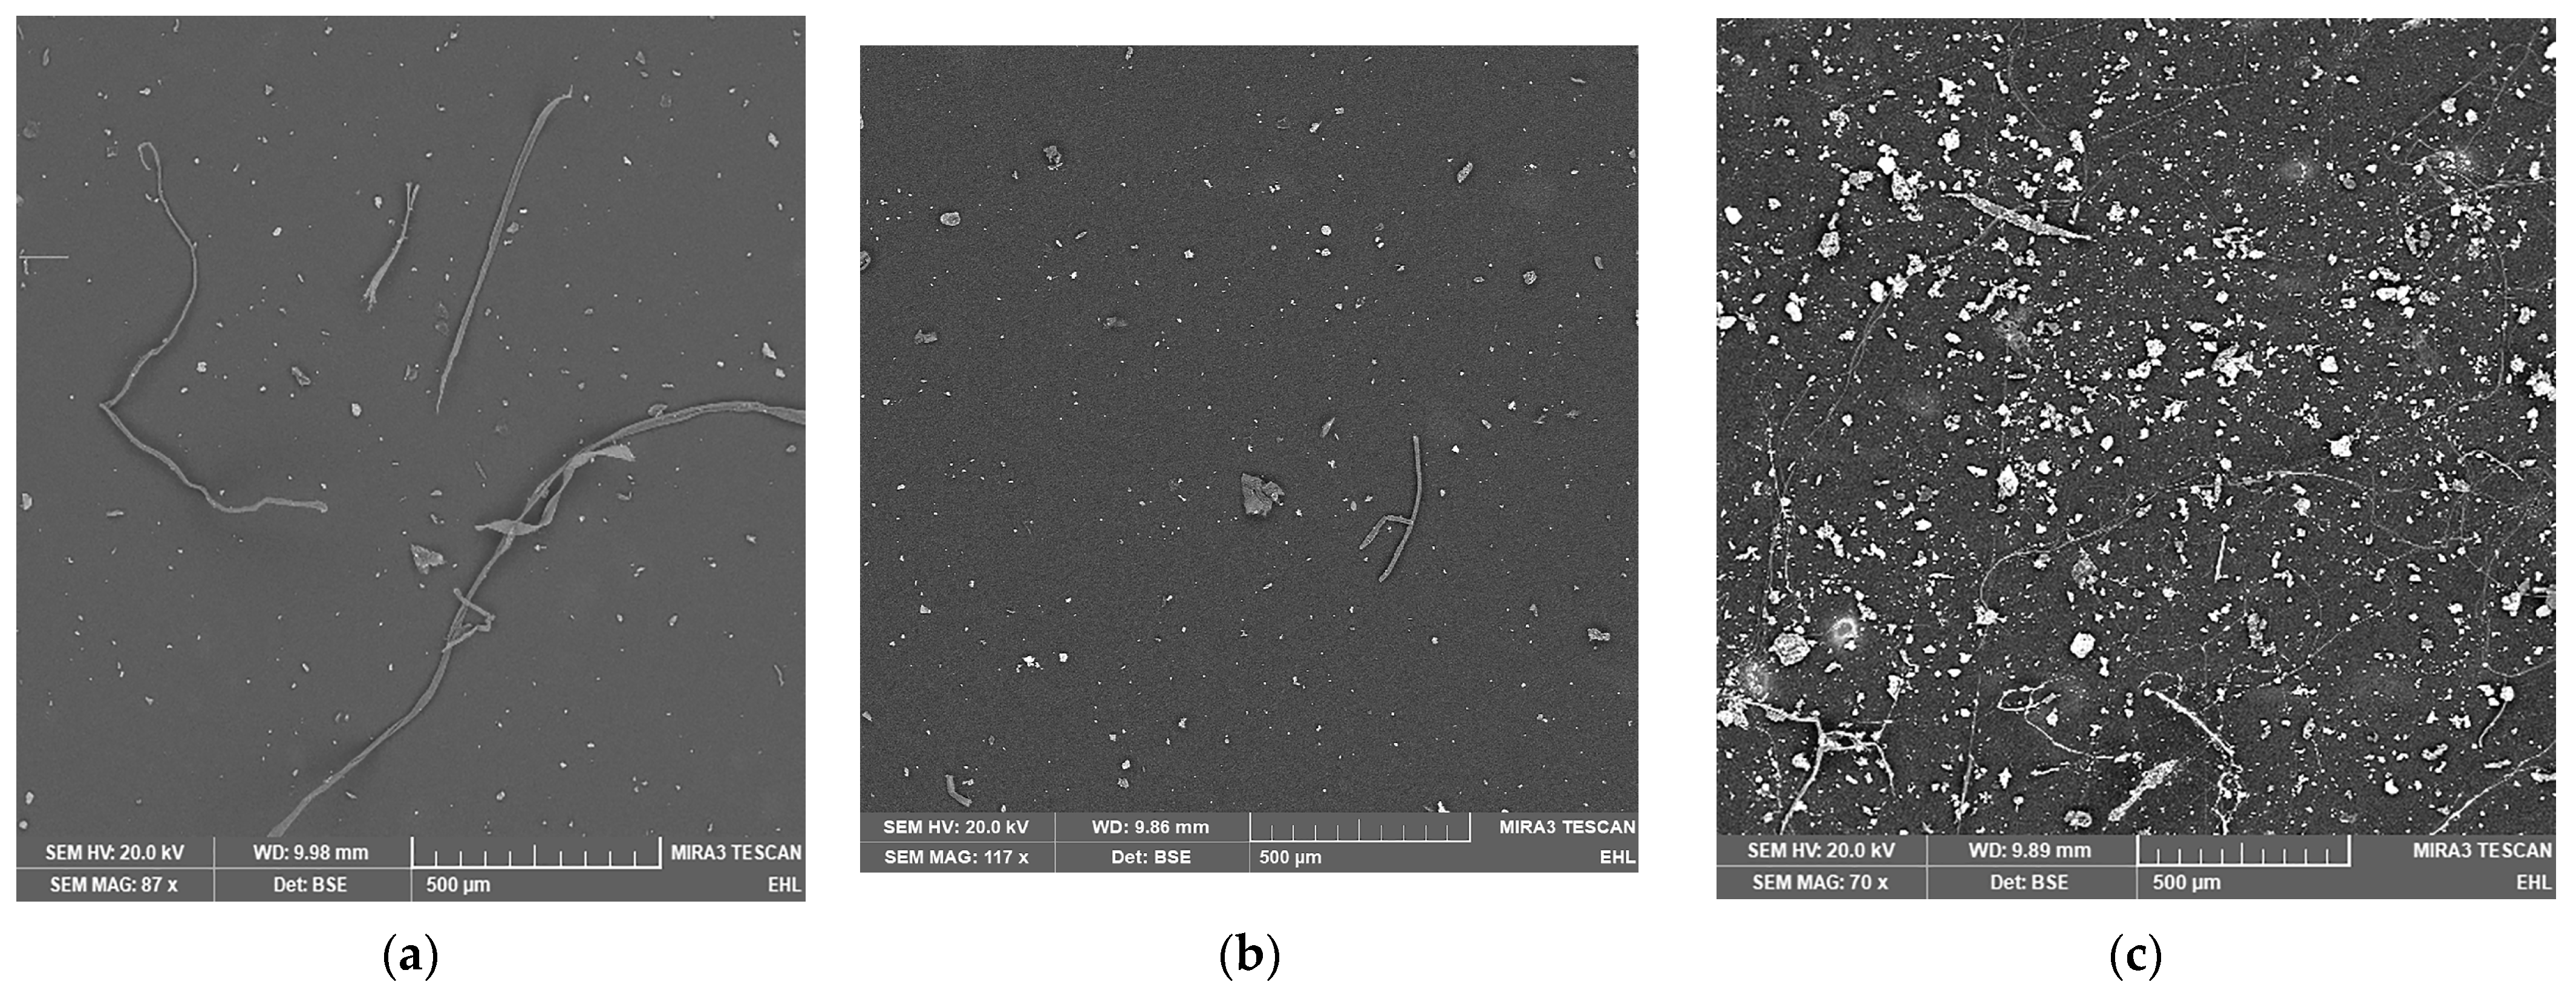
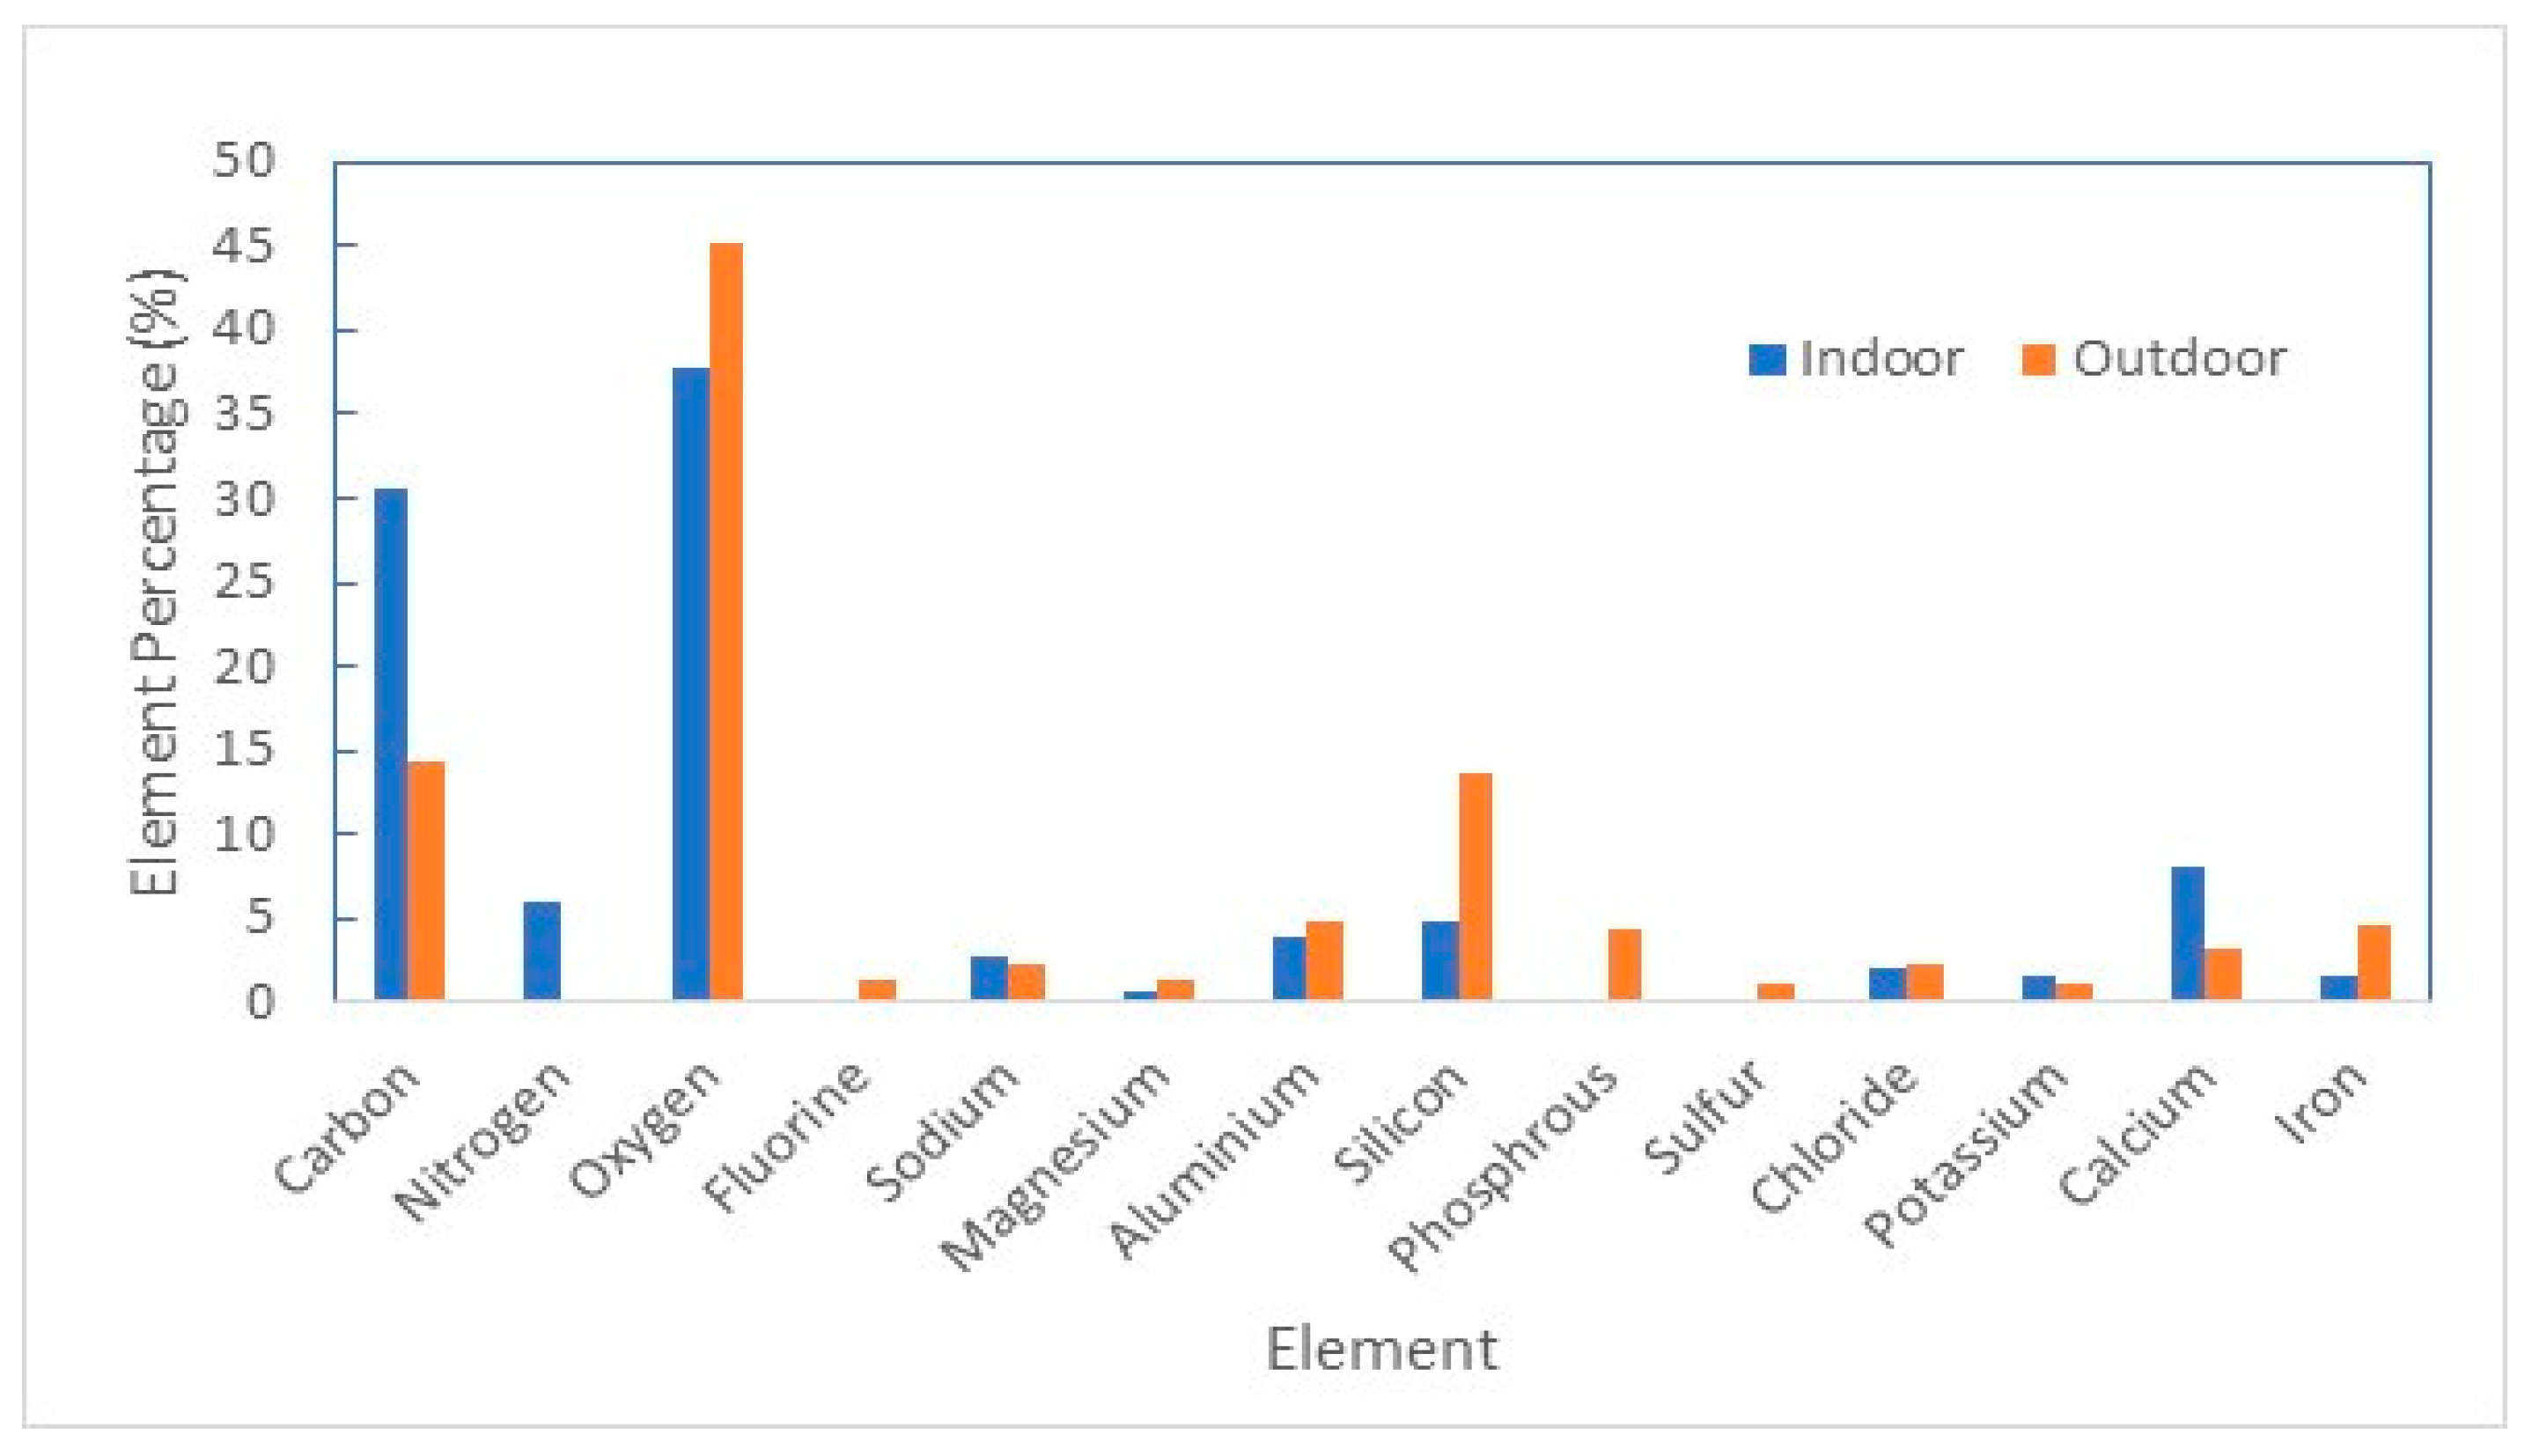
3.4.2. Qualitative PM Morphology and Elemental Composition

Figure 7 compares the morphology of PM indoors and outdoors collected by passive samplers. The SEM results for indoor passive samplers from classrooms 1, 2, and 4 were very similar. A typical SEM image from classroom 1 is shown in Figure 7a. The SEM images from classroom 3 and outdoors are shown in Figure 7b and Figure 7c, respectively. Results indicated that qualitatively more particles were deposited on the passive sampler in classroom 3 compared to those in other classrooms. The results also suggested that there were some differences between indoor and outdoor PM types. The indoor PM contained a higher proportion of carbon-rich fibers. Our previous study suggested that this particle type mainly originates from carpets and possibly from students’ clothes [26], which could be made of either cotton or microplastic fibers. The outdoor air sample exhibited greater total numbers of particles, generally larger particles, and fewer textile fibers. The higher concentrations of larger PM collected outdoors were possibly generated from resuspension caused by activities in the nearby school playground. The unique fiber morphologies shown in Figure 7c are consistent with spider webs deposited on the open-face sampler due to the long-term outdoor deployment. More details about the relative elemental profiles for indoor and outdoor PM can be found in Appendix A.

4. Discussion

4.1. Ventilation and Air Quality in the Studied Classrooms

For the four classrooms we studied, the results indicate that classroom overall outdoor VRs and IAQ (in terms of PM) were generally well maintained.
The mean values of estimated daily VRs per person over the 7-week study period ranged from 6.9 to 48.8 L/s-person, a range from close to, to far above the minimum VR requirement of 7 L/s-person. The much higher estimated VRs in classroom 3 (i.e., mean value of 48.8 L/s-person) imply that additional outdoor air was entering through open windows or doors. Based on the number of students and the classroom volume information collected (see Table 2), 48.8 L/s-person converts to an estimated air change rate (ACH) of 13.5, which is within the ACH ranges (i.e., 5–37 ACH) observed in some Southern California schools with HVAC operating in addition to open windows [33]. Further investigation would be needed to confirm the HVAC system operation status and window/door operation behavior in this classroom during the study period.
All classrooms had lower daily mean indoor PM2.5 concentrations during school hours compared to outdoors, demonstrating the overall effectiveness of the strategies the school used to control indoor particle concentrations. It should be noted that this study monitored only indoor PM concentrations, without attempting to measure or estimate the virus concentrations in those particles. The generation and dynamics of infectious particles in indoor environments are very complex and have multiple uncertainties [34]. Although it is generally believed that lowering airborne particle and pathogen concentrations indoors helps to reduce COVID transmission, it is beyond the scope of this pilot study to explicitly link the measured indoor PM concentrations to classroom COVID transmission risk levels. Additionally, classroom 3 had the highest estimated overall VRs but the lowest percent indoor reductions relative to outdoor PM 2.5 concentrations. This suggests that although higher VRs are desired for reducing indoor transmission of airborne viruses, they could bring in more outdoor contaminants if outdoor air is not filtered.

4.2. PAC Operation and Its Impact on Measured Indoor PM

This pilot study demonstrated that classroom use patterns of PACs can vary significantly in field applications. Operating schedules for PACs largely depend on the operators’ underlying concerns. A school using PACs mainly for COVID risk management would, in theory, operate PACs at their highest speed during all occupied hours to achieve a maximum reduction in exposure risk. On the other hand, schools using PACs mainly for reducing wildfire smoke exposure indoors might operate them only during wildfire events when outdoor air quality is poor. Other factors that could potentially affect schools’ and teachers’ decisions on PAC operation add further complexity. For example, energy costs related to PAC operation can be a barrier preventing schools from continuously operating PACs [24]. Also, because excessive noise levels may interfere with students’ learning and have been a concern in classroom environments [35], teachers may turn off PACs or set them at lower fan speed levels to reduce the noise. More guidance is therefore needed to help schools standardize and optimize classroom PAC use (placement, operating time, speed level setting, noise considerations, etc.).
Previous field studies that demonstrated the effectiveness of PACs in reducing classroom PM concentrations have mostly been conducted in areas of heavier outdoor pollution, or during short-term events with elevated outdoor pollution (e.g., wildfire smoke) [19,22,36]. In this study, indoor PM2.5 concentrations were generally low in all classrooms. We observed no clear relationship between PAC use pattern and indoor PM2.5 concentrations. One possible reason is that each of these classrooms had a mechanical ventilation system that used an efficient MERV 13 filter to remove particles from the air supplied to the classroom (a mixture of outdoor air and recirculated air), which provides a large equivalent outdoor (clean) air flow rate. This could make any additional cleaning of air delivered by the PAC less detectable. Other contributing factors include the generally low background PM2.5 concentrations during the study period, and the limited ability of low-cost PM sensors to precisely measure low concentrations of particles.
This study demonstrated a specific set of conditions in which continuous operation of PACs may not be fully necessary under nomral situations, i.e., in classrooms with well-maintained, continuously operating HVAC systems with MERV 13 filters, when the outdoor air quality is good. Optimization of daily PAC operation considering classroom characteristics and environmental conditions is desirable because it helps schools reduce energy use related to PACs. Other existing studies have also demonstrated the effectiveness of high-efficiency HVAC filters alone in improving classroom IAQ [37,38,39]. It should be noted that our study observations only apply to normal operation periods. When a school building is operating in “infectious risk management mode” as described in the recently introduced Standard for Control of Infectious Aerosols [14], PACs would need to be continuously operated at the highest speed level setting in order to provide their nominal clean air delivery rate (CADR). In this case, control of indoor-generated pathogens (i.e., emitted from infectious persons) would be the goal rather than reducing the indoor levels of PM originating outdoors.

4.3. Uncertainties in Interpreting CO2 Data and Estimating Outdoor Air VRs

Kabirikopaei and Lau (2020) conducted CO2 measurements in 220 classrooms in the Midwestern region of the U.S. and analyzed the uncertainties of three commonly used methods for estimating VRs based on CO2 concentrations, including steady-state, decay rate, and build-up method [27]. They found that the steady-state method has the least uncertainty in estimating classroom VRs. The calculated uncertainty for estimated VRs based on the steady-state method was 6–23% for the 220 classrooms they studied. They also showed the steady-state CO2 concentration (Css) contributes to the largest portion of uncertainty for this method, followed by outdoor CO2 concentration (Coutdoor) and then the average CO2 generation rate per person (G).
In our study, we estimated VRs per person based on the 95th percentile CO2 concentration from real-time monitoring using the steady-state method. We observed that the uncertainty of estimated VRs could be bigger than the range shown by Kabirikopaei and Lau (2020) [27] and the largest contributor to uncertainty could vary depending on the level of measured CO2 concentration. Firstly, the uncertainty related to CO2 generation rate can be bigger depending on how age groups are lumped together and other assumptions about occupants (i.e., physical activity level, gender, and body mass). For example, for classrooms of age 8, the average CO2 generation rate per person used in various previous school studies range from 0.00285 L/s to 0.0047 L/s [12,27,28,30,40], a relative difference of 50% and therefore a potential uncertainty as large as ±25%. Secondly, we found that the uncertainty related to the measurement or assumption of Coutdoor cannot be neglected when the measured Css is low and relatively close to Coutdoor. Consider an example scenario in which Css is 500 ppm and Coutdoor is 400 ppm. If both Css and Coutdoor have an uncertainty of ±50 ppm, the uncertainty related to (CssCoutdoor) (which is equal to 100 ppm) would be 71 ppm, a relative uncertainty as large as 71%. Finally, the peak observed CO2 may not reach the steady-state level if the classroom has low VRs or short class time periods. If Equation (1) is applied to CO2 concentrations measured before reaching steady state, or if steady state is never reached, the VR could be overestimated [40,41]. More research is needed to analyze various classroom scenarios and better quantify the range of systematic errors and uncertainty for estimating VRs using CO2 monitoring data.

4.4. Limitations of the Study

This pilot study had a small sample size of four classrooms and only included classrooms that have mechanical ventilation systems equipped with MERV 13 filters. The study collected purely observational and measurement data without conducting interviews or surveys on the behaviors of the school facility staff and teachers related to HVAC system operation and window/door opening. The monitoring campaign was for a 7-week period during which the outdoor air quality was mostly good with only a few days listed as moderate. Additionally, this study monitored only the indoor and outdoor PM concentrations, without attempting to estimate the specific generation and removal rate of potential virus-laden particles from indoor sources.
Other limitations include the limited particle size distribution information due to the use of low-cost PM sensors and the assumed outdoor CO2 concentration instead of actual measurements.

5. Conclusions

Adequate ventilation and good IAQ are important for schools. In this pilot study, we successfully demonstrated a feasible field protocol and data analysis procedure by applying them to simultaneously monitor classroom CO2, PAC usage patterns, indoor and outdoor PM concentrations, and composition during a 7-week period in four occupied classrooms. The results indicate that the overall outdoor VRs and indoor PM2.5 levels were generally good in the studied classrooms, which were equipped with mechanical ventilation and MERV 13 filters. Although the four classrooms had the same type of mechanical ventilation system, we were able to detect the evident impact of operational behavior on ventilation and IAQ in one classroom through the real-time monitoring of CO2 and PM concentrations, demonstrating the benefit of setting up real-time IAQ monitors in classrooms in additional to the periodic professional assessment of the HVAC system and IAQ. Our study also revealed that the uncertainty related to interpreting CO2 data and estimating VRs can be significant, which needs to be properly communicated to the school community.
As for PAC operation patterns, the results indicate that teachers used PACs in a wide variety of ways in actual classrooms. We observed no clear correlations between PAC use patterns and indoor PM2.5 concentrations or PM types in this specific pilot study, most likely due to low outdoor concentrations and efficient central HVAC filtration. When suitable additional school sites for study are identified and can be accessed, we plan to repeat these measurements under different classroom conditions (e.g., during wildfire events, in higher outdoor pollution areas, and in classrooms with no central ventilation and/or air filtration) and to investigate teachers’ operational behaviors (e.g., window/door opening, PAC setting preference) in order to provide more evidence-based guidance to schools/teachers on the optimization of PAC use and IAQ in classrooms.

Author Contributions

Conceptualization, W.C., M.J.M., K.K. and J.W.; methodology, W.C. and Z.-M.W.; formal analysis, W.C. and Z.-M.W.; investigation, W.C., Z.-M.W., K.P. and E.U.; resources, D.P., K.K. and J.W.; data curation, W.C. and Z.-M.W.; writing—original draft preparation, W.C. and Z.-M.W.; writing—review and editing, all authors; visualization, W.C. and Z.-M.W.; supervision, K.K. and J.W.; project administration, W.C.; funding acquisition, W.C., K.K. and J.W. All authors have read and agreed to the published version of the manuscript.

Funding

This research was supported by the US Centers for Disease Control and Prevention funds (#CDC-RFA-TP18-1802 Cooperative Agreement for Emergency Response: Public Health Crisis Response) via the CDPH Emergency Preparedness Office.

Institutional Review Board Statement

The study proposal was submitted to the Committee for the Protection of Human Subjects (CPHS) of California Health and Human Services Agency for review (Project Number: 2021-175). It is determined by the Committee that the project met qualifications for “Exempt”.

Informed Consent Statement

Not applicable.

Data Availability Statement

Data used to form conclusions are contained within the paper.

Acknowledgments

The authors thank Superintendent Jeff Bowman and other staff of Orchard School District for coordinating the school visits and supporting the study.

Conflicts of Interest

The authors declare no conflicts of interest. The funders had no role in the design of the study; in the collection, analyses, or interpretation of data; in the writing of the manuscript, or in the decision to publish the results. The findings and conclusions in this paper are those of the authors and do not necessarily represent the views or opinions of the California Department of Public Health or the California Health and Human Services Agency.

Appendix A

Figure A1 compares relative elemental profiles for indoor and outdoor PM. The results were obtained from EDS analyses of particles smaller than 2.5 μm from randomly selected images. The percentage of carbon content shown in Figure A1 has been corrected for the portion of the carbon content that comes from the sampler substrate using a similar analysis method to that described in a previous study [26]. The results show that indoor PM had much higher carbon content (i.e., more than double) compared to outdoor PM. The calcium content of indoor PM was also higher compared to that of outdoor PM. On the other hand, the amount of silicon, phosphorus, sulfur, and iron was higher for outdoor PM than indoor. It is possible the high silicon concentrations were from school playground sand outdoors where students were playing or having PE classes. The phosphorus and sulfur in outdoor PM possibly originated from biological materials, including spider webs and other small insect parts deposited on the sampler surface.
Figure A1. Example typical element weight percentages of indoor and outdoor PM.
Sustainability 16 02052 g0a1

References

  1. Klepeis, N.E.; Nelson, W.C.; Ott, W.R.; Robinson, J.P.; Tsang, A.M.; Switzer, P.; Behar, J.V.; Hern, S.C.; Engelmann, W.H. The National Human Activity Pattern Survey (NHAPS): A resource for assessing exposure to environmental pollutants. J. Expo. Sci. Environ. Epidemiol. 2000, 11, 231–252. [Google Scholar] [CrossRef] [PubMed]
  2. Landrigan, P.J.; Fuller, R.; Acosta, N.J.R.; Adeyi, O.; Arnold, R.; Basu, N.; Baldé, A.B.; Bertollini, R.; Bose-O’Reilly, S.; Boufford, J.I.; et al. The Lancet Commission on pollution and health. Lancet 2018, 391, 462–512. [Google Scholar] [CrossRef] [PubMed]
  3. Piscitelli, P.; Miani, A.; Setti, L.; De Gennaro, G.; Rodo, X.; Artinano, B.; Vara, E.; Rancan, L.; Arias, J.; Passarini, F.; et al. The role of outdoor and indoor air quality in the spread of SARS-CoV-2: Overview and recommendations by the research group on COVID-19 and particulate matter (RESCOP commission). Environ. Res. 2022, 211, 113038. [Google Scholar] [CrossRef] [PubMed]
  4. Peng, Z.; Rojas, A.P.; Kropff, E.; Bahnfleth, W.; Buonanno, G.; Dancer, S.; Kurnitski, J.; Li, Y.; Loomans, M.; Marr, L.; et al. Practical indicators for risk of airborne transmission in shared indoor environments and their application to COVID-19 outbreaks. Environ. Sci. Technol. 2022, 56, 1125–1137. [Google Scholar] [CrossRef] [PubMed]
  5. CEC. 2022 Building Energy Efficiency Standards. 2019, California Energy Commission. Available online: https://www.energy.ca.gov/programs-and-topics/programs/building-energy-efficiency-standards/2022-building-energy-efficiency (accessed on 10 October 2023).
  6. State of California, California Education Code-Section 17000-17009.5: Article 1. General Provisions Article 1. General Provisions. 2010. Available online: https://law.justia.com/codes/california/2009/edc/17000-17009.5.html (accessed on 10 October 2023).
  7. California Department of Industrial Relations. California Code of Regulations: General Requirements of Mechanical Ventilation Systems, in Title 8, Section 5143. 1976. Available online: https://www.dir.ca.gov/title8/5143.html (accessed on 10 October 2023).
  8. California Department of Industrial Relations. California Code of Regulations: Mechanically Driven Heating, Ventilating and Air Conditioning (HVAC) Systems to Provide Minimum Building Ventilation, in Title 8, Section 5142. 1987. Available online: https://www.dir.ca.gov/title8/5142.html (accessed on 10 October 2023).
  9. Shendell, D.G.; Winer, A.M.; Weker, R.; Colome, S.D. Evidence of inadequate ventilation in portable classrooms: Results of a pilot study in Los Angeles County. Indoor Air 2004, 14, 154–158. [Google Scholar] [CrossRef] [PubMed]
  10. Jenkins, P.L.; Phillips, T.J.; Waldman, J.; Environmental Health Conditions in California’s Portable Classroooms, A.R. Board, Editor. 2004. Available online: https://ww2.arb.ca.gov/sites/default/files/2020-05/pcs_r2l.pdf (accessed on 10 October 2023).
  11. Mendell, M.J.; Eliseeva, E.A.; Davies, M.M.; Spears, M.; Lobscheid, A.; Fisk, W.J.; Apte, M.G. Association of classroom ventilation with reduced illness absence: A prospective study in California elementary schools. Indoor Air 2013, 23, 515–528. [Google Scholar] [CrossRef] [PubMed]
  12. Chan, W.R.; Li, X.; Singer, B.C.; Pistochini, T.; Vernon, D.; Outcault, S.; Sanguinetti, A.; Modera, M. Ventilation rates in California classrooms: Why many recent HVAC retrofits are not delivering sufficient ventilation. Build. Environ. 2020, 167, 106426. [Google Scholar] [CrossRef]
  13. The Lancet COVID-19 Commission. Task Force on Safe Work, Safe School, and Safe Travel. 2022. Proposed Non-infectious Air Delivery Rates (NADR) for Reducing Exposure to Airborne Respiratory Infectious Diseases. Available online: https://covid19commission.org/commpub/lancet-covid-commission-tf-report-nov-2022 (accessed on 10 October 2023).
  14. ASHRAE Standard 241; Control of Infectious Aerosols. American Society of Heating, Refrigerating and Air-Conditioning Engineers (ASHRAE): Atlanta, GA, USA, 2023.
  15. Curtius, J.; Granzin, M.; Schrod, J. Testing mobile air purifiers in a school classroom: Reducing the airborne transmission risk for SARS-CoV-2. Aerosol Sci. Technol. 2021, 55, 586–599. [Google Scholar] [CrossRef]
  16. Duill, F.F.; Schulz, F.; Jain, A.; Krieger, L.; van Wachem, B.; Beyrau, F. The impact of large mobile air purifiers on aerosol concentration in classrooms and the reduction of airborne transmission of SARS-CoV-2. Int. J. Environ. Res. Public Health 2021, 18, 11523. [Google Scholar] [CrossRef]
  17. Porto, R.D.; Kunz, M.N.; Pistochini, T.; Corsi, R.L.; Cappa, C.D. Characterizing the performance of a do-it-yourself (DIY) box fan air filter. Aerosol Sci. Technol. 2022, 56, 564–572. [Google Scholar] [CrossRef]
  18. Joseph, G.; Schramm, P.J.; Vaidyanathan, A.; Breysse, P.; Goodwin, B. Evidence on the Use of Indoor Air Filtration as an Intervention for Wildfire Smoke Pollutant Exposure; Centers for Disease Control and Prevention: Atlanta, GA, USA, 2020. [Google Scholar]
  19. Carmona, N.; Seto, E.; Gould, T.R.; Rasyid, E.; Shirai, J.H.; Cummings, B.; Hayward, L.; Larson, T.V.; Austin, E. Indoor Air Quality Intervention in Schools: Effectiveness of a Portable HEPA Filter Deployment in Five Schools Impacted by Roadway and Aircraft Pollution Sources. Atmosphere 2022, 13, 1623. [Google Scholar] [CrossRef]
  20. The Harvard Healthy Buildings Portable Air Cleaner Sizing tool (PACS). Harvard School of Public Health. Available online: https://forhealth.org/tools/portable-air-cleaner-calculator/ (accessed on 10 October 2023).
  21. Portable Air Cleaner Calculator. University of Washington. Available online: https://ischool.uw.edu/capstone/projects/2021/portable-air-cleaner-calculator (accessed on 10 October 2023).
  22. Park, J.-H.; Lee, T.J.; Park, M.J.; Oh, H.; Jo, Y.M. Effects of air cleaners and school characteristics on classroom concentrations of particulate matter in 34 elementary schools in Korea. Build. Environ. 2020, 167, 106437. [Google Scholar] [CrossRef] [PubMed]
  23. Pampati, S.; Rasberry, C.N.; McConnell, L.; Timpe, Z.; Lee, S.; Spencer, P.; Moore, S.; Mead, K.R.; Murray, C.C.; Deng, X.; et al. Ventilation Improvement Strategies Among K–12 Public Schools—The National School COVID-19 Prevention Study, United States, February 14–March 27, 2022. MMWR. Morb. Mortal. Wkly. Rep. 2022, 71, 770–775. [Google Scholar] [CrossRef] [PubMed]
  24. de Mesquita, P.J.B.; Chan, W.R.; Heming, A.; Shannon, C. Managing Air Quality during the Pandemic: How K-12 Schools Addressed Air Quality in the Second Year of COVID-19. 2022. Available online: https://www.usgbc.org/resources/managing-air-quality-during-pandemic-how-k-12-schools-addressed-air-quality-second-year (accessed on 10 October 2023).
  25. ASTM D6245-18; Standard Guide for Using Indoor Carbon Dioxide Concentrations to Evaluate Indoor Air Quality and Ventilation. American Society for Testing and Materials (ASTM): West Conshohocken, PA, USA, 2018.
  26. Wang, Z.-M.; Zhou, Y.; Gaspar, F.W.; Bradman, A. Using low cost open-face passive samplers to sample PM concentration and elemental composition in childcare facilities. Environ. Sci. Process. Impacts 2020, 22, 1502–1513. [Google Scholar] [CrossRef] [PubMed]
  27. Kabirikopaei, A.; Lau, J. Uncertainty analysis of various CO2-Based tracer-gas methods for estimating seasonal ventilation rates in classrooms with different mechanical systems. Build. Environ. 2020, 179, 107003. [Google Scholar] [CrossRef]
  28. Andamon, M.M.; Rajagopalan, P.; Woo, J. Evaluation of ventilation in Australian school classrooms using long-term indoor CO2 concentration measurements. Build. Environ. 2023, 237, 110313. [Google Scholar] [CrossRef]
  29. Ding, E.; Zhang, D.; Hamida, A.; García-Sánchez, C.; Jonker, L.; de Boer, A.R.; Bruijning, P.C.; Linde, K.J.; Wouters, I.M.; Bluyssen, P.M. Ventilation and thermal conditions in secondary schools in the Netherlands: Effects of COVID-19 pandemic control and prevention measures. Build. Environ. 2023, 229, 109922. [Google Scholar] [CrossRef] [PubMed]
  30. Batterman, S. Review and extension of CO2-based methods to determine ventilation rates with application to school classrooms. Int. J. Environ. Res. Public Health 2017, 14, 145. [Google Scholar] [CrossRef]
  31. Karagulian, F.; Barbiere, M.; Kotsev, A.; Spinelle, L.; Gerboles, M.; Lagler, F.; Redon, N.; Crunaire, S.; Borowiak, A. Review of the Performance of Low-Cost Sensors for Air Quality Monitoring. Atmosphere 2019, 10, 506. [Google Scholar] [CrossRef]
  32. Wang, Z.; Delp, W.W.; Singer, B.C. Performance of low-cost indoor air quality monitors for PM2.5 and PM10 from residential sources. Build. Environ. 2020, 171, 106654. [Google Scholar] [CrossRef]
  33. McNeill, V.F.; Corsi, R.; Huffman, J.A.; King, C.; Klein, R.; Lamore, M.; Maeng, D.Y.; Miller, S.L.; Ng, N.L.; Olsiewski, P.; et al. Room-level ventilation in schools and universities. Atmospheric Environ. X 2022, 13, 100152. [Google Scholar] [CrossRef] [PubMed]
  34. Wagner, J.; Sparks, T.L.; Miller, S.; Chen, W.; Macher, J.M.; Waldman, J.M. Modeling the impacts of physical distancing and other exposure determinants on aerosol transmission. J. Occup. Environ. Hyg. 2021, 18, 495–509. [Google Scholar] [CrossRef] [PubMed]
  35. Woolner, P.; Hall, E. Noise in schools: A holistic approach to the issue. Int. J. Environ. Res. Public Health 2010, 7, 3255–3269. [Google Scholar] [CrossRef] [PubMed]
  36. Choe, Y.; Shin, J.-S.; Park, J.; Kim, E.; Oh, N.; Min, K.; Kim, D.; Sung, K.; Cho, M.; Yang, W. Inadequacy of air purifier for indoor air quality improvement in classrooms without external ventilation. Build. Environ. 2021, 207, 108450. [Google Scholar] [CrossRef]
  37. McCarthy, M.C.; Ludwig, J.F.; Brown, S.G.; Vaughn, D.L.; Roberts, P.T. Filtration effectiveness of HVAC systems at near-roadway schools. Indoor Air 2013, 23, 196–207. [Google Scholar] [CrossRef]
  38. Zee, S.C.; Strak, M.; Dijkema, M.B.A.; Brunekreef, B.; Janssen, N.A.H. The impact of particle filtration on indoor air quality in a classroom near a highway. Indoor Air 2017, 27, 291–302. [Google Scholar] [CrossRef] [PubMed]
  39. Martenies, S.E.; Batterman, S.A. Effectiveness of using enhanced filters in schools and homes to reduce indoor exposures to PM2.5 from outdoor sources and subsequent health benefits for children with asthma. Environ. Sci. Technol. 2018, 52, 10767–10776. [Google Scholar] [CrossRef]
  40. Persily, A. Development and application of an indoor carbon dioxide metric. Indoor Air 2022, 32, e13059. [Google Scholar] [CrossRef]
  41. Persily, A. Evaluating building IAQ and ventilation with indoor carbon dioxide. ASHRAE Trans. 1997, 103, 193–204. [Google Scholar]
Figure 1. Example photos of deployed monitors/devices: (a) the sampling board (indicated by red rectangular box) installed on a side wall in one classroom, and (b) the low-cost PM sensor and passive air sampler (indicated by red rectangular box) installed outdoors at the school site.
Sustainability 16 02052 g001
Figure 2. Classroom CO2 concentrations: (a) Over entire study period. The red line corresponds to a CO2 concentration of 1100 ppm, the level for triggering a notification to the facility staff or the teacher in new K-12 classrooms as required in the 2022 CalGREEN code. (b) Example typical daily profile (for classroom 2 on 19 May 2022).
Sustainability 16 02052 g002
Figure 3. Summary of 95th percentile CO2 concentrations by classroom.
Sustainability 16 02052 g003
Figure 4. Summary of estimated VR per person by classroom. The expanded plot at the bottom shows VR over the range of 0–15 L/s/person for better comparison with the minimum VR required in the California building code.
Sustainability 16 02052 g004
Figure 5. Classroom and outdoor PM2.5 concentrations. The red line corresponds to a PM2.5 concentration of 12 µg/m3, the upper end of the range for the “Good” Air Quality Index (AQI) category defined by the U.S. EPA.
Sustainability 16 02052 g005
Figure 6. Summary of indoor vs. outdoor PM2.5 concentrations: (a) distribution of daily mean PM2.5 concentrations during school hours, and (b) distribution of daily percent indoor reduction of outdoor PM2.5 concentrations by classroom.
Sustainability 16 02052 g006
Figure 7. Comparison of the morphology of indoor and outdoor PM from the analysis of passive air samplers: (a) classroom 1, (b) classroom 3, and (c) outdoors. Images were obtained using scanning electron microscopy and shown using the same scale.
Sustainability 16 02052 g007
Table 1. Characterization of studied classrooms.
ParameterClassroom 1Classroom 2Classroom 3Classroom 4
Room volume a260 m3
(9180 ft3)
260 m3
(9180 ft3)
260 m3
(9180 ft3)
260 m3
(9180 ft3)
Floor materialCarpetCarpetCarpetCarpet
Grade level1121
Number of students b19 (14–19)19 (15–19)22 (17–22)20 (17–20)
PAC type/model cABAA
Ventilation system dMechanical, HVAC systemMechanical, HVAC system Mechanical, HVAC system Mechanical, HVAC system
HVAC Filter MERV 13MERV 13MERV 13MERV 13
Total supply air changes per hour during school field visit day(s) (ACH) e12.212.9 ± 0.3n/a11.8 ± 0.1
Total return air changes per hour during school field visit day(s) (ACH) e3.510.3 ± 0.3n/a9.5 ± 0.2
a All classrooms have similar floor plans, with a floor area of 95 m2 (1020 ft2) and ceiling height of 2.74 m (9 ft). b This row shows, in each classroom, the expected number of students (range of actual daily attendance of students during the study period). c PAC type A is Alen Breathesmart 75i True HEPA Air Purifier (Alen Corporation, Austin, TX, USA), and type B is Medify Air MA-112 (Medify Air, Boca Raton, FL, USA). d We did not monitor the classroom window/door opening conditions. Some classroom(s) might have kpt them open during the study period, thus also providing natural ventilation. e School field visits were conducted on days without student presence (i.e., during spring break or after the semester ended). For classroom #1, results were based on measurements conducted during the 2nd school visit (i.e., on 15 June 2022 after study period) since the HVAC system in the classroom was not turned on during the 1st school visit (i.e., on 18 April 2022 before study period). For classrooms #2 and #4, results were average ± one standard deviation of measurements conducted during 1st and 2nd visits. For classroom #3, the HVAC system was not operating during both field visit days and therefore no measurements could be made. The reason why the HVAC system in classroom #3 was not on during the school field visit days was not clear.
Table 2. PAC fan speed level setting and corresponding power usage.
PAC Setting Levels aPower Usage (Watts) b
Classroom 1Classroom 2Classroom 3 Classroom 4
PAC Model APAC Model BPAC Model APAC Model A
Level 163.110.766.166.1
Level 276.720.180.180.6
Level 392.139.895.295.3
Level 4101.885.0104.7105.1
a PAC type A has four fan speed levels (Level 1–4) and an additional Turbo level (higher speed than Level 4); PAC type B has four fan speed levels (Level 1–4). b Power usage was measured and recorded using a plug load datalogger (HOBO UX 120-018, ONSET, Bourne, MA, USA). Power usage at Turbo level for PAC type A was not reported because it was not observed in actual PAC use monitoring.
Table 3. Summary of parameters measured and measurement instruments/sensors.
Parameter Measured aInstrument/SensorAccuracy Specifications
PAC power usage (watts)Onset HOBO UX120-018 Plug load datalogger (ONSET, Bourne, MA, USA)0.5% up to 14 Amp continuous
Indoor PM concentration (µg/m3) bClarity Node-S (Clarity, Berkeley, CA, USA)±10 µg/m3 from 0 to <100 µg/m3;
within ±10% of measured value from 100 µg/m3 to 1000 µg/m3
Outdoor PM concentration (µg/m3) bClarity Node-S
Indoor CO2 concentration (ppm)Onset HOBO MX1102 datalogger (ONSET, Bourne, MA, USA)CO2: ±50 ppm or ±5% of reading at 25 °C from 0 to 5000 ppm;
Temperature: ±0.21 °C from 0° to 50 °C;
RH: ±2% from 20% to 80% typical to a maximum of ±4.5% including hysteresis at 25 °C
Indoor thermal conditions (temperature, RH)Onset HOBO MX1102 datalogger
a Measurement conducted in real time, with data logged/recorded every 1–5 min. b Raw concentration data are reported for PM1, PM2.5, and PM10. Calibrated concentration data are for PM2.5 only. Accuracy specifications are based on PM2.5 calibrated mass concentrations.
Table 4. Summary of PAC use patterns.
Classroom No.PAC TypePAC Operation TimeFan Speed Setting a
Classroom 1 ADuring occupied school hours only bLevel 2
Classroom 2BSporadic/random operation cLevel 1, 2, or 3
Classroom 3AMostly continuous 24/7 operation d Level 4
Classroom 4AContinuous 24/7 operation e Level 2 or 3
a PAC type A has four fan speed levels (Level 1–4, with Level 1 as lowest) and an additional Turbo level (which was not used during this study); PAC type B has four fan speed levels (Level 1–4, with Level 1 as lowest). b The PAC was turned on only during the occupied hours each school day. c The PAC operation pattern seemed random. On many days, the PAC was not turned on. When it was turned on, the fan speed level was set at either 1, 2, or 3, with no apparent pattern. d The PAC was operated continuously most days (including days, nights, and weekends). However, there were a few days in which the PAC was turned on only during occupied hours or not turned on at all. e The PAC was operated continuously every day (including days, nights, and weekends) with a fan speed setting initially at 2 and later (after 11 May 2022) at 3.
Disclaimer/Publisher’s Note: The statements, opinions and data contained in all publications are solely those of the individual author(s) and contributor(s) and not of MDPI and/or the editor(s). MDPI and/or the editor(s) disclaim responsibility for any injury to people or property resulting from any ideas, methods, instructions or products referred to in the content.

