Article

The Influence of New Energy Industry Agglomeration on Regional Green Innovation Performance—Evidence from China

Business School, Hohai University, Nanjing 211100, China
*
Author to whom correspondence should be addressed.
Sustainability 2024, 16(5), 2029; https://doi.org/10.3390/su16052029
Submission received: 21 January 2024 / Revised: 21 February 2024 / Accepted: 27 February 2024 / Published: 29 February 2024
(This article belongs to the Section Economic and Business Aspects of Sustainability)

Abstract

:
The advance of the new energy industry and the promotion of green innovation are both important ways to solve environmental pollution and achieve economic green transformation, and there may be a non-negligible intrinsic connection between the two. Utilizing panel data covering the period from 2011 to 2021, encompassing 30 provinces and cities in China, this study measures agglomeration levels of the new energy sector and green innovation performance in each region. Via the application of the fixed-effect model and spatial Durbin model, this study empirically examines the impact mechanism of green innovation performance resulting from the agglomeration of the new energy industry. This investigation discloses that there is regional heterogeneity in China’s new energy industry agglomeration level, with the highest level observed in the western region. The distribution of green innovation performance forms an “East–Middle–West” ladder pattern, with both the central and western regions falling below the national average. Agglomeration of the new energy sector exerts a non-linear, “U-shaped” influence on green innovation performance, demonstrating conspicuous regional heterogeneity; opening up positively moderates the “positive U-shaped” correlation between new energy agglomeration and green innovation performance. A clear spatial spillover effect characterizes the agglomeration of the new energy industry, demonstrating a non-linear “inverted U-shaped” influence on the green innovation performance of surrounding regions. This paper aims to offer policy insights into the establishment of developmental layouts for the new energy industry in China while simultaneously providing practical references for enhancing regional green innovation performance.

1. Introduction

As the Chinese economy experiences rapid growth, it has led to the massive consumption of traditional energy sources, resulting in severe ecological issues like atmospheric contamination and energy depletion. To realize sustainable development and solve the conflict between escalating energy demand and the ecological environment, countries worldwide have explored two paths: First, the advance of a new energy sector and the transformation of pollution reduction from end-to-end governance to source prevention and control. New energy stands out as a significant avenue for diminishing greenhouse gas emissions and substituting conventional fossil fuels [1,2]. The linchpin for achieving the green transformation of energy lies in advancing the scale and cluster development of the new energy industry [3,4]. Secondly, green innovation is advocated to mitigate pollution emissions in the industrial production process from the technical level. Green innovation is instrumental in optimizing the efficiency of natural resource utilization and allocation [5,6], reducing pollution emissions in the product life cycle [7], and attempting to obtain the maximum economic and ecological benefits with the minimum environmental costs [8]. It is worth noting that the new energy industry is marked by its green, knowledge-intensive, and innovative characteristics [9], and there may be an intrinsic link between its agglomeration and green innovation that cannot be neglected. As crucial means for fostering the green transformation of the economy, whether the two can play a synergistic effect needs to be further studied.
In 1981, new energy was formally defined at the United Nations Conference on New and Renewable Energy, but with the progression of time and advancements in technology, the types of energy encompassed by new energy have been constantly improving [10]. According to the “Thirteenth Five-Year Plan for the Development of Strategic Emerging Industries” issued by the State Council in 2016, it can be considered that China’s new energy includes wind energy, solar energy, nuclear energy, biomass energy, geothermal energy, and ocean energy. Industries related to developing, utilizing, and operating new energy are called the new energy industry [11]. As the world’s largest energy consumer, China is actively constructing a clean, low-carbon, and efficient modern energy system, and a series of policy measures have been formulated to promote the development of the new energy industry [12]. Additionally, China benefits from natural resource endowments, with solar energy resources covering approximately two-thirds of the country [13], particularly abundant in regions such as Xinjiang and Inner Mongolia. Wind energy resources, on the other hand, are most abundant in North China and southeastern coastal areas [14,15]. This lays a solid foundation for the development of China’s new energy industry. Research indicates that the clustering of the new energy industry has gradually emerged in certain regions of China [16], leading to the formation of four new energy industry clusters in the Bohai Rim, Yangtze River Delta, central, and western regions [17]. As of 2022, the proportion of non-fossil energy consumption in China reached 17.5%. It is projected to surpass 25% by 2030, suggesting the potential for further development and clustering of the new energy industry in China.
From the perspective of industrial development, industrial clustering is an essential path for developing the new energy industry. However, the effects of industrial agglomeration on green innovation performance are complex. On one hand, industrial agglomeration facilitates infrastructure sharing, technological talents, and the spillover of innovative knowledge [18,19], which enhances regional green innovation performance. On the flip side, industrial agglomeration could result in unfavorable outcomes, such as the overconsumption of resources and overcrowded markets [20,21], impeding the development of green innovation in the region. The new energy sector has different characteristics from other industries, resulting in a more complex relationship with green innovation performance. Firstly, both green and high-tech attributes define the nature of the new energy industry [22], and its agglomeration should be more conducive to green innovation; secondly, a substantial scale of investment in the early developmental phase characterizes the new energy industry, coupled with a high rate of capital investment [23], which may crowd out the green innovation resources. Consequently, what impact does the clustering of new energy industries exert on regional green innovation performance? Is there an analogous effect on the green innovation performance in neighboring areas as well? What is the regulating mechanism between the two? Answering these questions will help clarify the correlation between the clustering of new energy industries and the progress of green innovation on a regional scale and then formulate more reasonable industrial support policies and more scientific innovation strategies, which have important theoretical significance and practical value.
The potential contributions of this paper are as follows: (1) By examining the nonlinear relationship between new energy industry agglomeration and green innovation performance, not only does it reveal the intrinsic connection between the development of new energy industry and green innovation but it also provides new theoretical support for the complex relationship between industry agglomeration and green innovation performance. (2) It expands the research on influencing factors of green innovation performance by introducing external openness as a moderating variable, investigating the mechanism of influence between new energy industry agglomeration and green innovation performance. (3) It explores the spatial spillover effect of new energy industry agglomeration on green innovation performance, addressing the inadequacies in existing research on the new energy industry and its spatial agglomeration.

2. Literature Review

2.1. Industrial Agglomeration and Green Innovation Performance

Built upon existing investigation, factors affecting green innovation performance could be grouped into internal driving forces and external environmental elements [22]. Internal driving forces predominantly rely on factors such as firm size, research and development funding, personnel investment, executive capabilities, and organizational culture [24,25,26,27]. External driving forces encompass infrastructure development, policy support, market competition, and industrial agglomeration [28,29,30,31,32]. Among these, industrial agglomeration stands out as a crucial factor affecting green innovation performance, effectively promoting the movement of innovative components like resources and technological knowledge within a region. Prior studies have discussed the association between industrial clustering and green innovation performance, coupled with influencing factors between them, from both theoretical and empirical perspectives. However, there is still no unified conclusion on how industrial agglomeration affects green innovation performance. Present research primarily falls into two viewpoints regarding the relationship between the two: The first perspective posits a simple linear correlation between industrial clustering and green innovation performance. Industrial agglomeration significantly enhances the degree to which green innovation in enterprises via knowledge and technology spillover effects, as well as specialization effects [18]. Not only does industrial agglomeration positively impact the local green development level but it also generates favorable spatial spillover effects on neighboring areas, thereby enhancing their green development [33]. The second viewpoint posits an intricate association between industry agglomeration and green innovation performance. Scholars hold diverse views on this intricate relationship. Some argue that at lower levels of industrial agglomeration, the negative externalities stemming from resource consumption and ecological contamination outweigh the positive externalities of technology and capital, hindering regional green innovation performance. As agglomeration levels increase, the beneficial externalities of industrial agglomeration gradually strengthen, thereby promoting regional green innovation. This perspective concludes the effect of industry agglomeration on green innovation performance follows a “positive U-shaped” pattern [31]. Certain scholars contend that, at the outset, industrial agglomeration can enhance regional green innovation efficiency. However, as agglomeration levels rise, it may lead to “crowding effects” and “adverse competition effects”, impeding the enhancement of green innovation capabilities. This perspective considers the impact of industrial agglomeration on green innovation performance follows an “inverted U-shaped” pattern [34]. Some researchers integrate these views, categorizing industrial agglomeration into initial, intermediate, and advanced stages. They argue that there exists a prominent “inverted N-shaped” connection between industrial agglomeration and green innovation performance [35].

2.2. New Energy Industry Agglomeration

New energy industry agglomeration refers to the concentration of economic activities related to new energy in specific geographic areas, where factors such as talents, resources, and technologies are concentrated to form industrial advantages [36]. Currently, studies on new energy industry agglomeration are still in their initial phases, mainly concentrating on measurement, driving factors, and influencing effects. Firstly, in the study about measuring the level of agglomeration within the new energy sector, methods such as location entropy, location Gini coefficient, and Herfindahl index are employed, with location entropy the most widely used [37]. Given the challenges in obtaining statistical data for the new energy industry, numerous scholars employ general equipment manufacturing and electrical machinery and equipment manufacturing as substitutes to substitute for the new energy industry [37,38]. However, this measurement approach may introduce significant biases. Therefore, scholars further opt to use directly relevant data associated with the new energy industry to measure the level of its agglomeration, such as new energy installed capacity [23], new energy generation [37], and the main business income of new energy-listed companies on the A-share market in China [22]. Secondly, multiple elements contribute to the emergence of clustering in the new energy sector, encompassing technological, economic, policy, and consumer preference aspects [39,40]. However, current research predominantly concentrates on the effect of policy factors on new energy industry agglomeration. Because the development momentum of the new energy sector stems from environmental benefits and energy substitution rather than the profit drive of the industry itself [41], policy support is pivotal in guiding the new energy industry agglomeration process [42,43]. For instance, Reinhard et al., (2011) found via a study of several cases in EU member states that fiscal support measures were more effective in promoting the development of the new energy industry than other measures [44]. Li et al., (2021) argued that the new energy industry bears more risks and market uncertainties compared to traditional industries, thus requiring government subsidies to address market failures and drive industry development [45]. Finally, the research on the impacts of new energy industry agglomeration is relatively scarce. Since it is a low-carbon industry, scholars have concentrated on examining the correlation between the clustering of new energy industries and environmental factors. Most studies have proved that new energy industry agglomeration could reduce fossil energy consumption [46], alleviate energy poverty [47], directly or indirectly improve environmental efficiency [1], and favor regional green development [23]. Nevertheless, new energy industry agglomeration does not always bring positive impacts; some studies believe that the current Chinese new energy industry patented technology there is excessive agglomeration, the establishment of technical barriers to inhibit regional pollution control [16], and sustainable development capability [48]. Regarding innovation impact, some studies have proved that new energy industry clusters can promote green innovation efficiency but failed to prove the impact effect after the industry agglomeration exceeds a certain standard [22].
To summarize, previous studies have room for further improvement: first, based on different industrial characteristics and different development stages of industries, how industrial clusters affect green innovation performance is still controversial. More in-depth exploration of the relationship and influence mechanisms is needed, especially considering the new energy industry perspective. Secondly, current research primarily examines the environmental impact of new energy industry agglomeration. Studies on green innovation establish a simple linear relationship, neglecting the complex dynamics between new energy industry agglomeration and green innovation. Building upon these, the present study uses a perspective centered on the new energy industry. Using a research sample comprising 30 Chinese provinces, data from the years 2011 to 2021 were employed; this paper examines how industrial agglomeration affects green innovation performance, explores regional heterogeneity between the two, and investigates the underlying regulatory mechanisms. Furthermore, employing a spatial Durbin model, the study delves into the local effects and interprovincial impacts of the influence of new energy industry agglomeration on regional green innovation performance.

3. Mechanism Analysis and Research Hypothesis

Theoretically, new energy industry clusters manifest a dual impact, simultaneously fostering and impeding green innovation performance. Drawing from Marshall’s external economic theory and competitive advantage theory, the favorable influence of new energy industry agglomeration on green innovation performance is contingent on manifold effects engendered by agglomeration. New energy industry agglomeration can generate agglomeration scale effects, resulting in positive externalities on green innovation performance [49]. These effects encompass scale impacts on intermediate inputs, the labor market, as well as information exchange, and technological diffusion. The scale effect of intermediate inputs and the labor market, termed the sharing effect and matching effect, respectively, represent financial externalities. The sharing of factors like infrastructure, intermediate inputs, expertise, and services among firms in a cluster area results in diminished production and R&D costs. It also lowers the expenses associated with information exchange and innovation collaboration among firms [50]. Industrial agglomeration attracts professional labor, reducing the search costs for enterprises in the agglomeration area and facilitating talent and knowledge sharing [51]. The externality of funds directly reduces operating costs for enterprises, contributing to a decrease in environmental pollution and fostering improved green innovation performance. The effect of exchanging information and diffusing technology, often referred to as the knowledge spillover effect, falls under technology externalities [52]. The concentration of the new energy industry promotes exchanges of progressive green technology and knowledge among enterprises within the agglomeration region, promoting the mutual transformation of explicit and tacit knowledge and thereby enhancing regional green innovation capabilities. Moreover, new energy industry agglomeration can invigorate the competitive dynamics of regional enterprises [53], compelling them to participate in sustainable innovation initiatives to uphold market position and competitive edge. Spatial agglomeration enhances enterprises’ ability to promptly discern competitors’ innovation trends, thereby reinforcing green innovation outcomes and elevating overall innovation output. The new energy industry, characterized as both a high-tech and green sector, exhibits a more robust inclination and capability for green innovation than other industries [9]. From an input–output perspective, the new energy industry aids in decreasing conventional fossil energy consumption and the release of pollutants [23], thereby fostering improvements in regional green innovation performance.
In line with Hoover’s theory of the optimal agglomeration scale, neither excessively low nor high levels of industrial agglomeration can fully optimize outcomes. When the degree of new energy industry cluster is low, on one hand, the industry chain in the region is incomplete, infrastructure lacks perfection, and innovation resource allocation efficiency is suboptimal, hindering the realization of economies of scale [50]. Although local governments usually provide policy support in the initial phase of new energy industry development [54], policy-driven industrial agglomeration may only be a formal bunching of enterprises, and the upstream and downstream enterprises have not formed a close link but rather make the transfer of innovative knowledge, technology and information more hindered. On the other hand, since it is capital-intensive, the new energy industry exhibits significant upfront investment and prolonged innovation cycles [55], and enterprises may reduce green innovation inputs in order to save money and avoid risks. Therefore, the initial new energy industry agglomeration is not only difficult to exert a positive externality on the green innovation performance in the region but may also have an inhibitory effect. When new energy industry agglomeration reaches an excessive level, an excess of enterprises in the agglomeration area surpasses the region’s carrying capacity in terms of resources, markets, and other factors. Intense competition among enterprises can induce a crowding effect, hindering green innovation performance primarily via excessive competition and hitchhiking.
China’s new energy industry initiated comparatively delayed; it was not until the promulgation and application of the “New Energy Law” in 2006 that this industry transitioned into a phase characterized by standardized development. During the sample period, new energy industry agglomeration in most regions ranged from initial to medium stages, with fewer areas reaching the phase of excessive agglomeration [22,54]. Consequently, the influence of new energy industry agglomeration on green innovation performance is initially inhibitory. With the improvement in new energy industry clustering intensity, the positive externality effect of agglomeration is revealed, so new energy industry agglomeration can positively affect green innovation performance. Derived from the preceding analysis, this paper proposes the following:
H1. 
The impact of new energy industry agglomeration on green innovation performance follows a “positive U-shaped” pattern.
Opening up stands as a pivotal avenue for a nation to propel the globalization process and facilitate the flow of high-quality resource elements. This external engagement significantly influences the interplay among new energy industry agglomeration and green innovation performance, primarily driven by the “imitation learning effect” and “competition effect”. Primarily, the act of opening up introduces innovative elements, encompassing advanced talents and technology. In the premier phase of new energy industry agglomeration, characterized by an imperfect regional structure and low innovation levels, enterprises can alleviate the negative influence of clustering on green innovation performance by emulating and assimilating advanced technology and management concepts [51,53]. As new energy industry agglomeration attains a high level, the regional industrial structure and infrastructure progressively improve, leading to the maturation of products and factor markets. Consequently, information transmission efficiency and innovation resource allocation efficiency in the region are heightened, facilitating a more effective role for opening up in advancing green innovation performance. Secondly, opening up may subject numerous domestic products to the impact of similar imported products, thereby amplifying competitive pressures within the domestic market. Appropriate competitive pressures prove conducive to stimulating regional enterprises to allocate capital to innovative resources, elevating the performance of regional green innovation. However, intense competitive pressures can easily provoke detrimental effects such as vicious or homogeneous competition among enterprises, diminishing the enthusiasm for independent green innovation [56]. To foster a salubrious market competition environment, the state and governments at various levels have enacted policies and regulations in recent years. These measures include introducing high-quality foreign capital and ensuring fair competition to judiciously safeguard the domestic market environment. Consequently, the competitive impact resulting from opening up predominantly manifests as positive in influencing green innovation performance. Derived from the preceding analysis, this paper proposes the following:
H2. 
Opening up has a positive moderating effect on the “positive U-shaped” correlation between new energy industry agglomeration and green innovation performance.
With the continuous development of information technology and digital technology, economic activities are becoming increasingly interconnected across regions, and the impact of industrial agglomeration extends beyond administrative boundaries, influencing neighboring areas as well [57]. At the early stages of new energy industry agglomeration, due to the lack of an effective mechanism for synergistic development within the regional industrial chain and constrained by inadequate transportation and infrastructure, there was a lack of close connections and collaboration among various industrial links. As a result, green innovative resources would be prone to loss and waste, failing to meet the investment demands of capital and providing an unsatisfactory platform for technological talent [58]. The research and development factors exhibit profit-seeking characteristics [59], whereby, to maximize benefits, innovative elements such as capital and labor tend to flow into regions where returns or rewards are readily attainable [60]. Consequently, at lower levels of new energy industry concentration, production factors like labor and capital are more likely to flow to neighboring regions, thereby fostering the green innovation performance of those neighboring regions. As new energy industry agglomeration increases, the beneficial external effects of industrial agglomeration gradually emerge, promoting green innovation performance via scale and competition effects. But new energy industry agglomeration might not necessarily continue to facilitate the green innovation of neighboring regions. Instead, it might potentially inhibit the green innovation performance of nearby areas to some extent. The strategic emerging industries encompass the new energy sector, exhibiting a notably elevated level of technological and knowledge intensity in contrast to conventional sectors [22], resulting in a greater demand for technical talents and capital. Due to the scarcity of resources and technological exclusivity, regions with higher levels of agglomeration in the new energy industry are likely to establish a specific level of monopoly concerning technology and resources. Simultaneously, new energy industry clustering has the potential to generate additional job opportunities and higher returns on capital, attracting specialized labor and capital from neighboring areas, thereby creating a “siphoning effect” on nearby regions [61]. Due to the compounded impacts of monopoly and siphoning, an elevated level of agglomeration in the new energy industry might impose inhibitory effects on the green innovation performance of adjacent regions. Based on the earlier analysis, this paper puts forward the following:
H3. 
The influence of new energy industry agglomeration on green innovation performance exhibits spatial spillover effects.

4. Data and Methods

4.1. Variable Description

4.1.1. Explanatory Variable

New energy industry agglomeration (agg): the measurement of industrial agglomeration often relies on indicators such as market concentration (SR), spatial Gini coefficient (SGC), Herfindahl–Hirschman Index (HHI), and location quotient (LQ). Among these, the location quotient reflects the degree of specialization in a particular sector, also known as the specialization rate, and has been widely applied in both domestic and international research on industrial agglomeration. Considering the variety of new energy sources and the new energy industry’s boundaries lack a universally agreed-upon definition in academic circles, along with the difficulty in obtaining relevant data, this paper adopts a method proposed by other scholars [23,37]. It utilizes the installed capacity of new energy generation as a proxy for new energy sector data. New energy generation capacity is calculated by subtracting the combined installed capacity of thermal and hydraulic power generation from the total installed power generation capacity. The specific calculation is shown in Formula (1):
L Q i t = x i t / y i t X t / Y t
LQit represents the location quotient value of the new energy industry, where xit denotes the installed capacity of new energy generation in region i during period t, yit represents the total installed power generation capacity in region i during period t, Xt signifies the national total installed capacity of new energy generation during period t, and Yt represents the national total installed power generation capacity during period t. When LQit > 1, it indicates a relatively high concentration of new energy industry in region i, and a larger location quotient implies a higher level of specialized agglomeration. When LQit = 1, it signifies that the new energy industry in region i is as concentrated as the national average. Conversely, when LQit < 1, it suggests that the agglomeration trend of the new energy industry in the region is not significant.

4.1.2. Explained Variable

Green innovation performance (inn): building upon prior research [62], this paper considers the positive and negative factors influencing green innovation and applies the entropy method, a comprehensive evaluation approach, to evaluate the effectiveness of green innovation. Specific indicators are detailed in Table 1. Concerning input factors, the full-time equivalent of R&D personnel is designated as labor input, internal R&D fund expenditure and investments in industrial pollution control serve as capital inputs, and electricity consumption is identified as the energy consumption factor. In the realm of output factors, the innovation output index encompasses the number of patent applications, sales revenue from new products, and green coverage rate in developed areas. Concurrently, the choice of indicators for environmental pollution assessment depends on quantifying the discharge of the “three wastes.” The specific calculation procedure is as follows:
(1)
The indicators were standardized using the extreme value method. Xij represents the value of the j indicator in the i region, while Yij denotes the standardized value of each indicator. The specific formulas are shown in Equations (2) and (3):
Y i j = X i j m i n X i j m a x X i j m i n X i j
Y i j = m a x X i j X i j m a x X i j m i n X i j
(2)
The proportion of the j indicator in the i region relative to all regions for the j indicator is calculated. The specific formula is shown in Equation (4):
P i j = Y i j i = 1 n Y i j
(3)
The entropy value of the j indicator is calculated. The specific formula is shown in Equation (5):
e j = k i = 1 n P i j l n P i j ,   k = 1 l n n
In this case, k > 0 and ej > 0.
(4)
The redundancy of information entropy is calculated, with the specific formula shown as (6).
d j = 1 e j
(5)
The entropy weight of the j indicator is calculated, with the specific formula shown as (7).
w j = d j j = 1 m d j
(6)
The comprehensive score of the i region is calculated, with the specific formula shown as (8).
Q i = j = 1 m w j   ·   P i j

4.1.3. Regulating Variables

Opening up (open): opening up refers to the extent of a country or region’s economic engagement with the world, measured by the trade dependency ratio. The calculation involves determining the ratio of the aggregate value of imports and exports to GDP.

4.1.4. Control Variables

Indicators of control variables include foreign investment level (fdi), government intervention (gov), marketization index (market), and infrastructure level. Foreign direct investment (fdi) is gauged based on the foreign direct investment amount compared to the GDP of the respective region. Government intervention is evaluated based on the rate of general budget expenditures to the GDP of the region, reflecting how local governments influence green innovation and economic development via methods such as investment and fiscal appropriations [63]. The marketization index employs the marketization process scores compiled by scholars like Wang Xiaolu to gauge the level of marketization. The infrastructure level is assessed via the proportion of the entire road network length to the total population.

4.1.5. Data Description

Using the data’s availability and comprehensiveness as a criterion, regions with substantial data gaps, including the Tibet Autonomous Region, Hong Kong, Macao, and Taiwan, were excluded from the analysis. Selected for measurement were panel data spanning from 2011 to 2021, covering 30 provinces in China. Data sources encompass the China Statistical Yearbook, China Energy Statistical Yearbook, China Environmental Statistical Yearbook, China Industrial Statistical Yearbook, and the National Bureau of Statistics. In cases where the required data were not present in these yearbooks, the respective provincial statistical yearbooks were utilized as substitutes. Linear interpolation was employed to address missing data. Refer to Table 2 for details on the selected variables and descriptive statistics.

4.1.6. Model Construction

(1)
Benchmark Regression Model
To validate the overall effect of new energy industry agglomeration on green innovation performance, the quadratic term of new energy industry agglomeration is incorporated into the econometric model, constructing the baseline model (9):
i n n i t = β 0 + β 1 a g g i t + β 2 a g g i t 2 + β 3 X i t + μ i + γ t + ε i t
Within this framework, i represents the region, and t represents the year, respectively. innit denotes green innovation performance, aggit represents new energy industry agglomeration, and Xit denotes the series of control variables. β0 is the intercept term, while β1, β2, and β3 are coefficients.  μ i  and  γ t  represent fixed effects for individuals and time, and  ε i t  denotes the random error component.
(2)
Regulatory effect model
Examining how openness level moderates the association between new energy industry agglomeration and green innovation performance, interaction terms between external openness and industry agglomeration’s first and second-order terms are added to the model (2), forming econometric model (10):
i n n i t = β 0 + β 1 a g g i t + β 2 a g g i t 2 + β 3 o p e n i t + β 4 a g g i t × o p e n i t + β 5 a g g i t 2 ×   o p e n + β 6 X i t + μ i + γ t + ε i t i t
(3)
Spatial Dobbin model
To investigate the spatial spillover effects of new energy industry clustering on green technology innovation, spatial panel regression models (11) and (12) are constructed:
i n n i t = β 0 + ρ W i n n i t + β 1 a g g i t + β 2 a g g i t 2 + β 3 X i t + W θ 1 a g g i t + W θ 2 a g g i t 2 + W θ 3 X i t + μ i + γ t + ε i t
ε i t = λ W ε i t + φ i t
In this context, W denotes the matrix of spatial weights, with this study employing a proximity spatial weight matrix. Ρ, θ, and λ denote the spatial correlation coefficients for the explained variable, explanatory variable, and the random disturbance term, respectively. When θ = λ = 0, and ρ is not equal to 0, Equation (4) corresponds to a Spatial Lag Model (SLM). If θ = ρ = 0, and λ is not equal to 0, Equation (4) represents a Spatial Error Model (SEM). When λ = 0, and both θ and ρ are not equal to 0, Equation (4) constitutes a spatial Durbin model (SDM).

5. Empirical Findings and Discourse

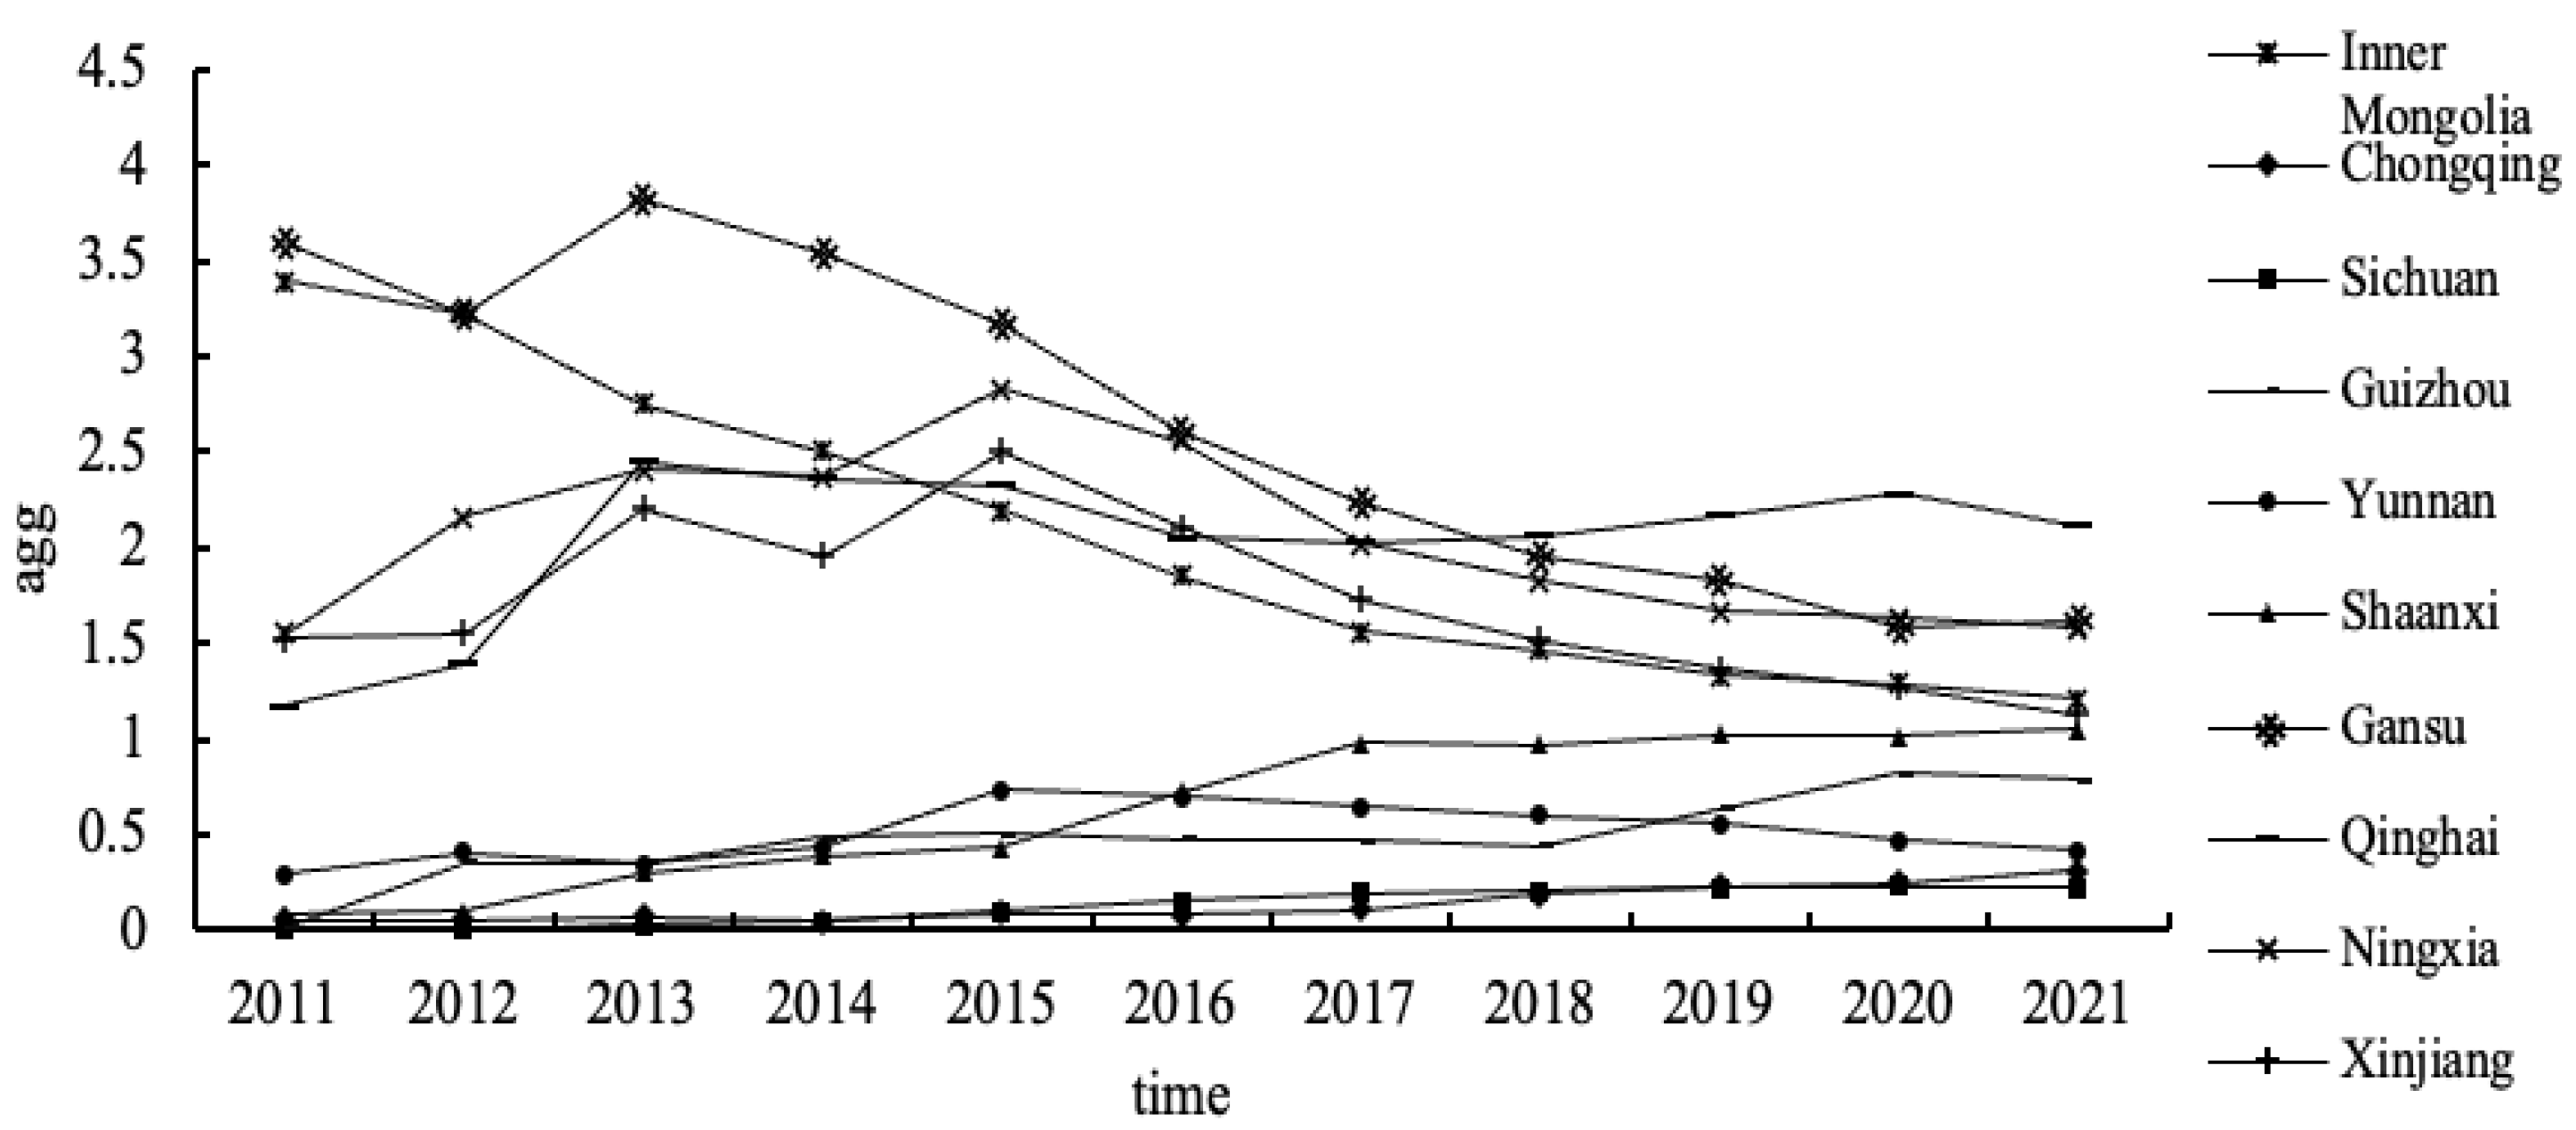
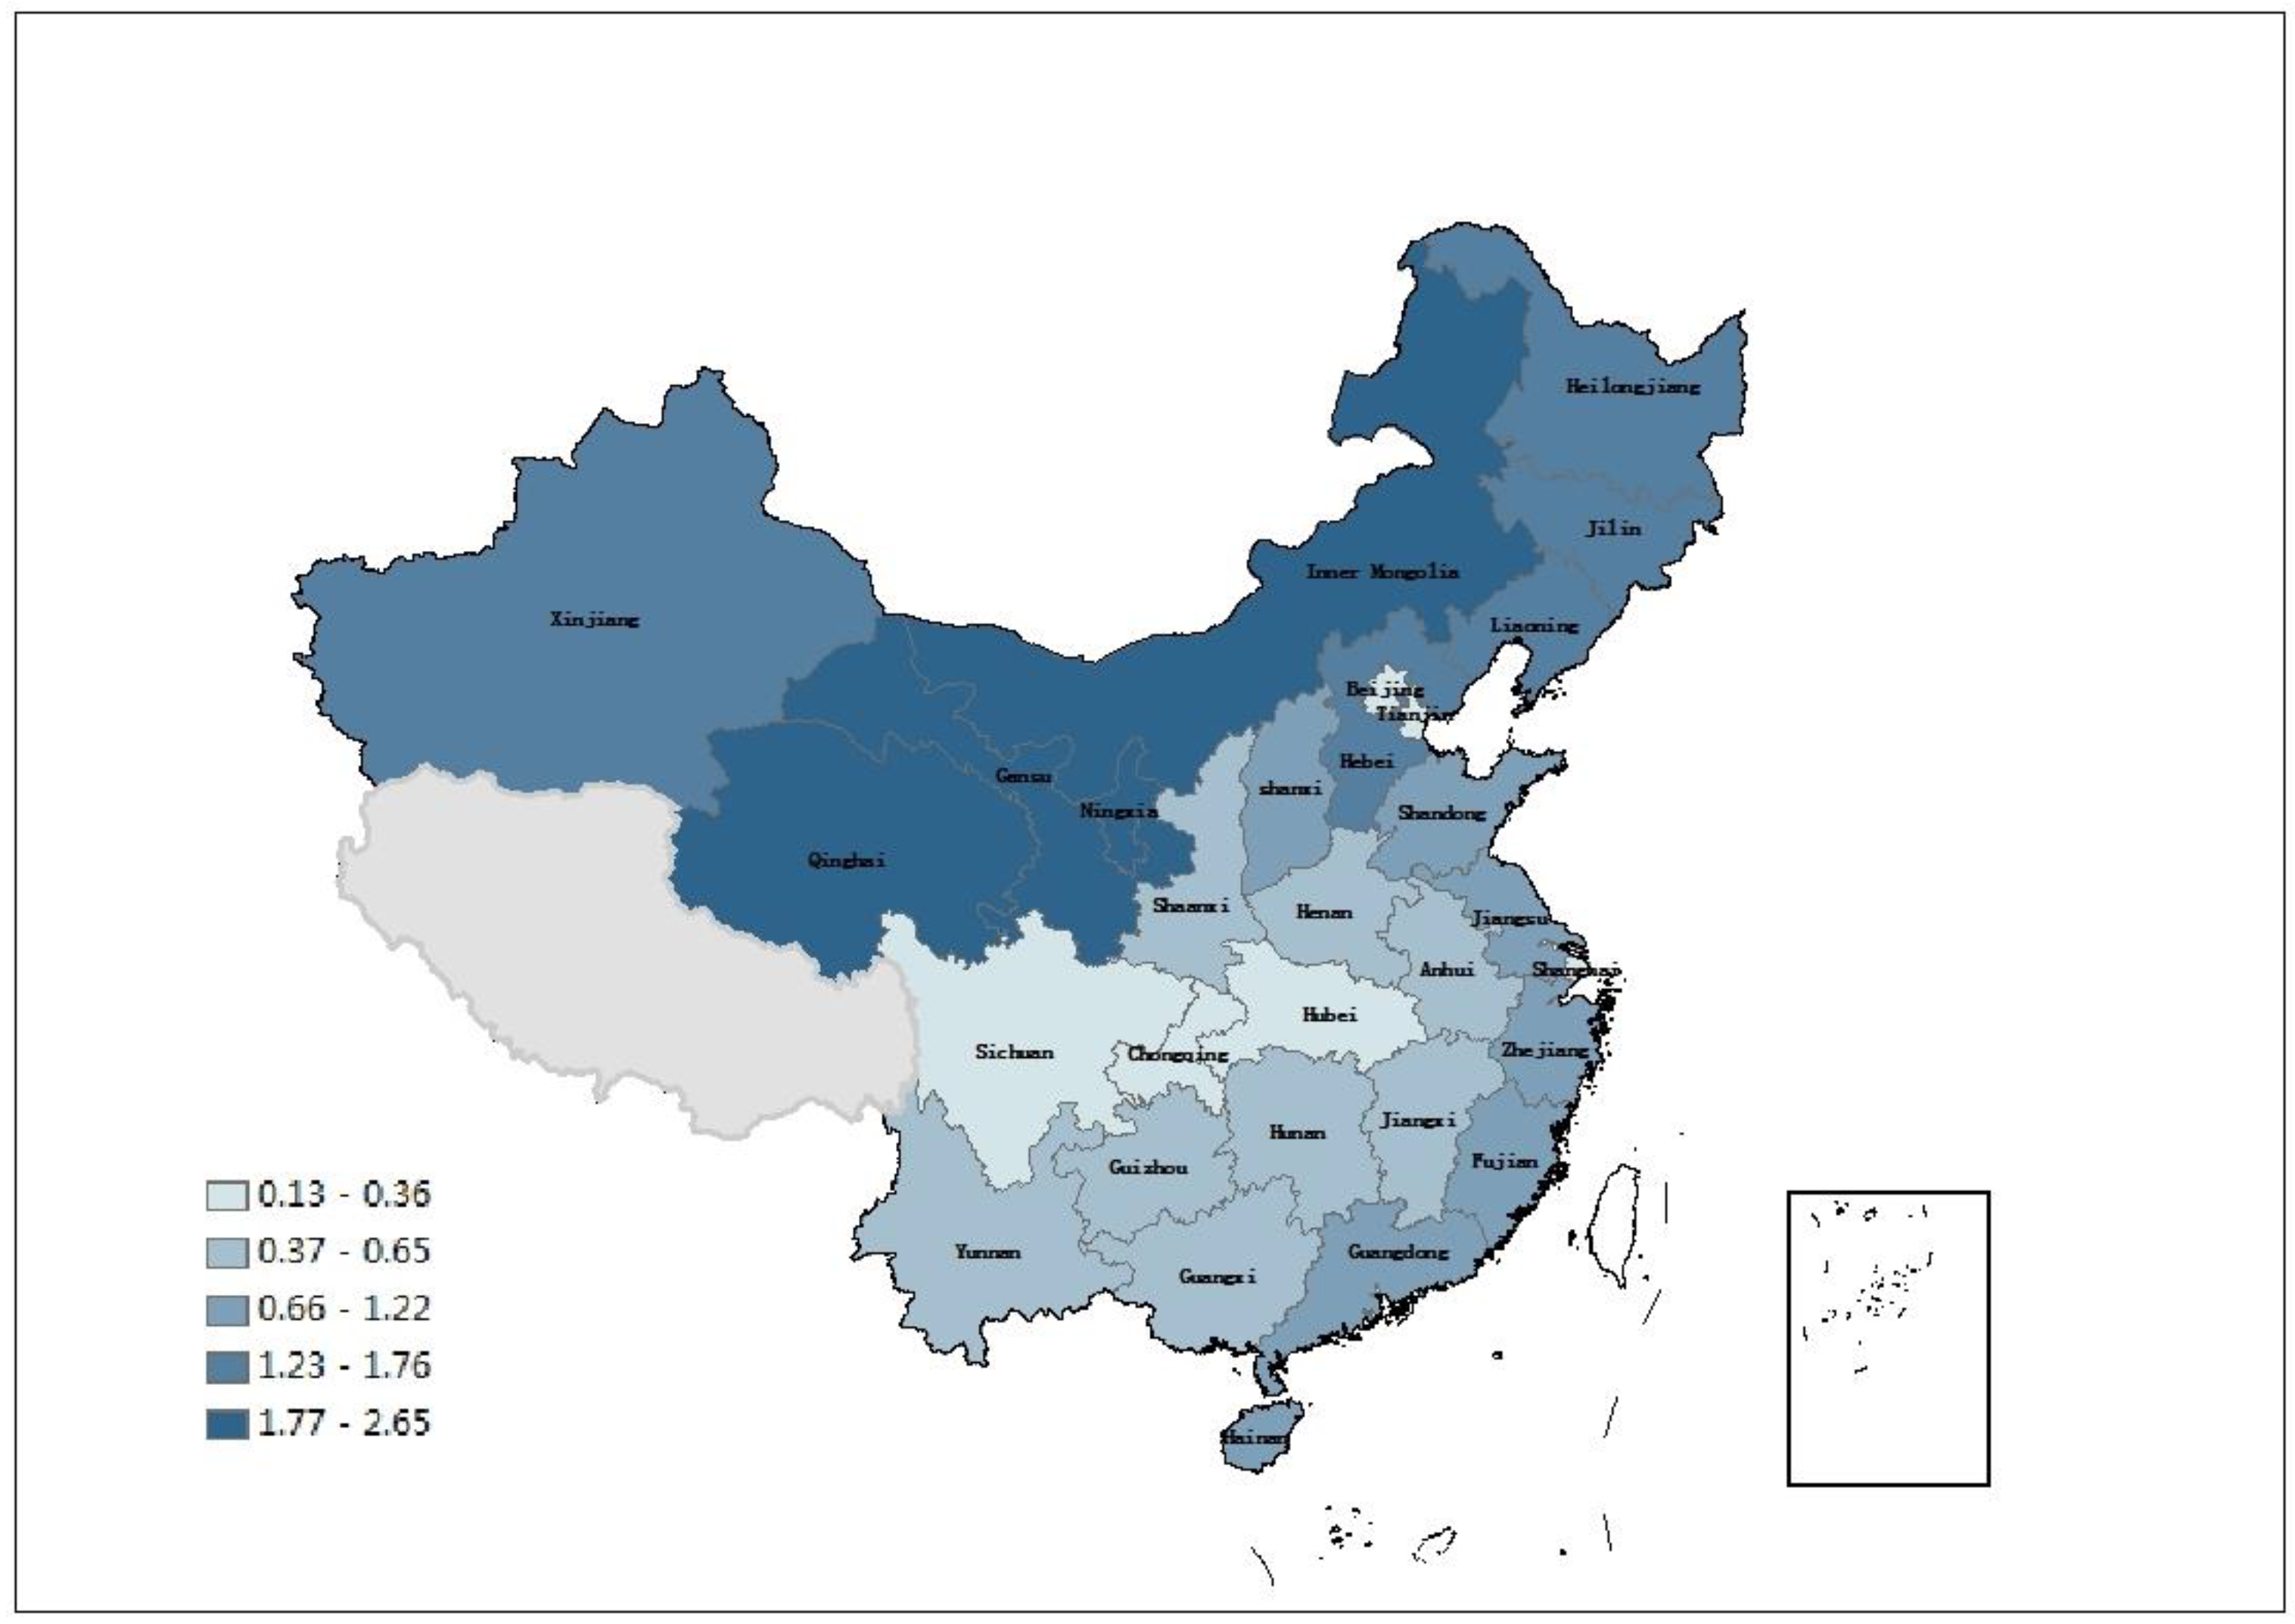
5.1. Measurement Outcomes of New Energy Industry Agglomeration Level

Based on the calculation formula for location entropy, this paper computes the location entropy coefficients of the new energy sector according to provincial installed capacity from 2011 to 2021. Figure 1, Figure 2 and Figure 3, respectively, illustrate the trends in location entropy coefficients in the provinces of China’s eastern, central, and western regions throughout the specified period, and Figure 4 shows the spatial distribution of the average value of new energy industries in 30 provinces and cities. It is evident that from 2011 to 2021, regions with location entropy coefficients greater than 1 persist nationwide, indicating the continuous presence of agglomeration in China’s new energy industry. During this period, the enhancement and decline in new energy industry agglomeration occur simultaneously on a national scale. The regions where the location entropy of the new energy industry has consistently exceeded 1 include Hebei, Liaoning, Inner Mongolia, Gansu, Qinghai, Ningxia, Xinjiang, Jilin, and Heilongjiang. Provinces with an increase in new energy industry location entropy surpassing 1 include Jiangsu, Shandong, Jiangxi, and Henan. Regions with a high level of agglomeration in China’s new energy industry can be broadly categorized into two types: those with a well-developed economic foundation and industrial level, such as Hebei, Jiangsu, and the Northeast Industrial Base, and those endowed with abundant natural resources, including Inner Mongolia, Gansu, and Xinjiang. From a regional perspective, although some western provinces show a descending trend, the agglomeration level of the new energy industry in the western region surpasses that in the central and eastern regions. The central region is experiencing an overall upward trend with significant potential for improvement, while the eastern region is generally on a declining trajectory, indicating insufficient momentum in the evolution of the new energy industry.

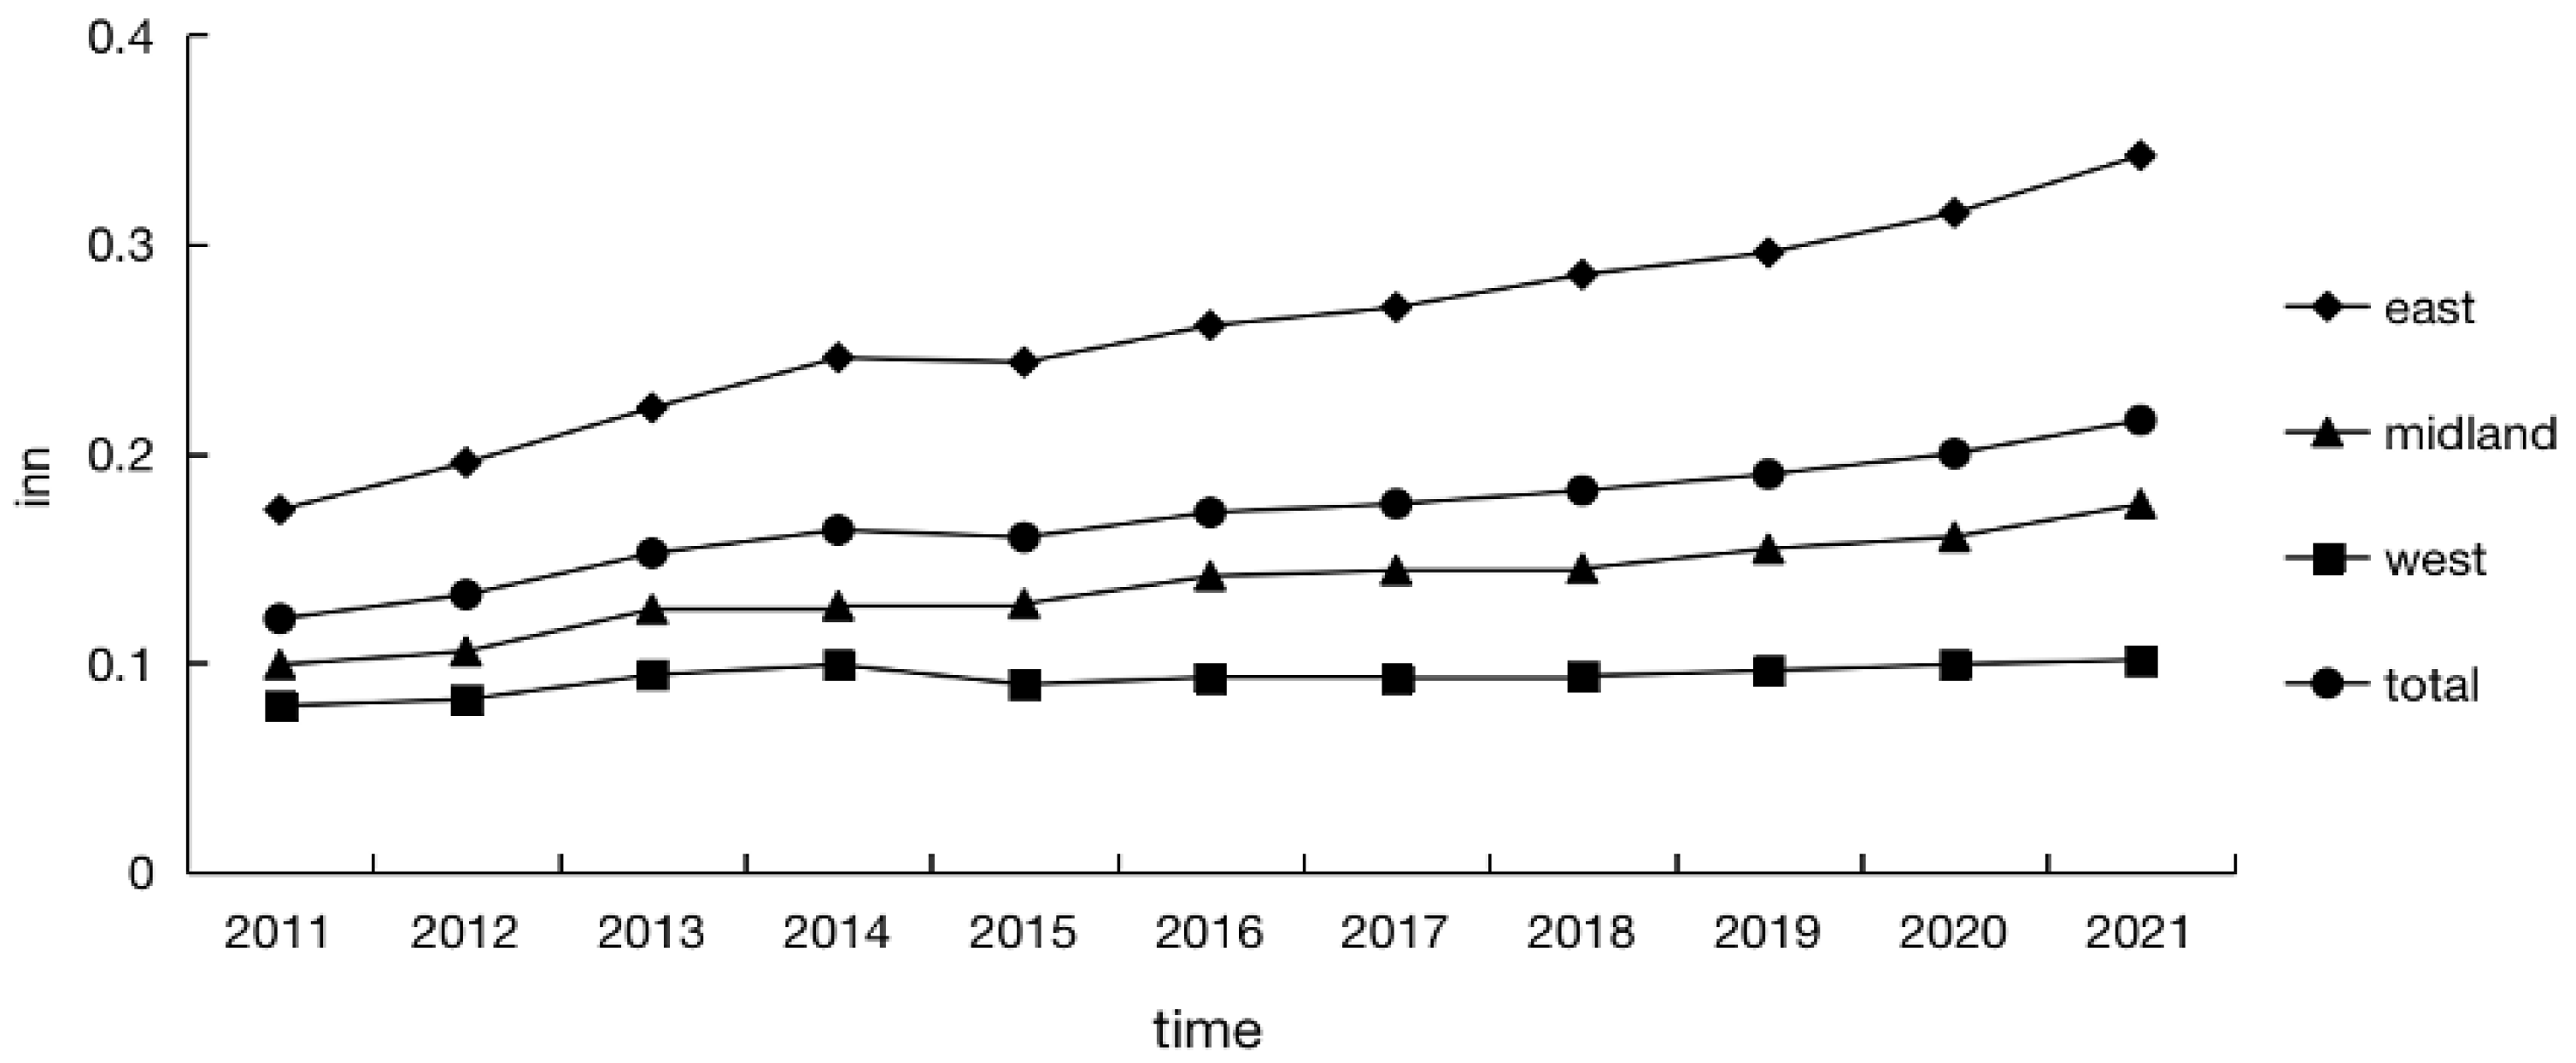
5.2. Measurement Outcomes of Green Innovation Performance

Figure 5 illustrates the nationwide, eastern, central, and western mean values and trends in green innovation performance from 2011 to 2021. From Figure 5, It is evident that a noticeable disparity in green innovation performance exists among the regions. The eastern region demonstrates markedly elevated green innovation performance, surpassing the national average, with a pronounced trend. This indicates that the innovation mechanisms within the confines of the eastern locality operate effectively, supported by a robust economic foundation, enabling the maintenance of consistently high levels of innovation. Green innovation performance in the central and western regions falls below the national average. The western region demonstrates inferior trends in both green innovation performance and growth compared to the central region. This suggests that, in the realm of innovation development, the industrial structures in the central and western regions are comparatively trailing the eastern region. There is evidence of technological and resource disconnection, yet there exists substantial potential for improvement. Overall, in advocating the advancement of green innovation, both at regional and national levels, there has been a consistent upward trend in green innovation performance. The level of green innovation performance follows a stepwise distribution pattern with the sequence of “East–Central–West”, where the eastern region consistently maintains a leading position, playing a pioneering role.

5.3. Results of Baseline Regression

Considering the potential lag effects of agglomeration in the new energy industry on green innovation performance, tests were conducted on both the current new energy industry agglomeration indicators and their lagged terms. Table 3 presents the results of the regression analysis for the benchmark model, presenting baseline estimates with fixed effects for the effection of agglomeration in the new energy industry on green innovation performance. Within columns (1) and (2), explanatory variables include the current new energy industry agglomeration and its quadratic term, while columns (3) and (4) incorporate the lagged one-period new energy industry agglomeration and its quadratic term. Columns (1) and (3) exhibit the regression outcomes without incorporating additional variables, while columns (2) and (4) showcase regression outcomes, including control variables.
Specifically, the results in columns (1) and (2) indicate that regression outcomes for both the main term and quadratic term of new energy industry clustering consistently meet the significance test at the 1% level. This holds true both before and after incorporating control variables. The primary term related to new energy industry agglomeration exhibits a positive coefficient, whereas the quadratic term demonstrates a negative coefficient. This configuration suggests a “positive U-shaped” impact of new energy industry agglomeration on green innovation performance, thereby confirming H1. During the initial stages of new energy industry agglomeration, when the agglomeration scale is relatively small, optimal allocation of innovation resources may not be achieved. This suboptimal allocation hinders the realization of positive externalities associated with agglomeration. Additionally, the necessary infrastructure development for industrial agglomeration might result in a range of environmental problems. Consequently, overall, new energy industry agglomeration appears to exert a passive influence on green innovation performance. With the expansion of clustering in the new energy industry scale and surpassing the turning point of agglomeration in more provinces, the complexity of the industry chain’s both upstream and downstream segments deepens. This leads to achieving positive externalities, such as knowledge spillover effects and economies of scale associated with the clustering. Only at this stage can new energy industry agglomeration effectively contribute to advancing green innovation performance. According to the turning point formula (−β1/2β2), the turning point value for the “positive U-shaped” connection between new energy industry agglomeration and green innovation performance is calculated as 1.785. This value falls within the range of new energy industry agglomeration values [0.004, 3.813]. Provinces and municipalities with new energy industry agglomeration values exceeding this turning point include Hebei, Ningxia, Gansu, Liaoning, Inner Mongolia, Heilongjiang, Xinjiang, Qinghai, and Jilin, primarily located in the western region. The outcomes in columns (3) and (4) reveal that the regression findings for lagged new energy industry agglomeration and its quadratic term successfully meet the significance test at a 1% level, with direction remaining consistent. This implies that there is a delayed impact of the “positive U-shaped” influence of new energy industry agglomeration on green innovation performance, with the agglomeration effect manifesting not only in the present timeframe but also in the subsequent duration.

5.4. Regional Heterogeneity Test

To delve deeper into whether variations exist in the impact of new energy industry agglomeration on green innovation performance among different regions, this study subdivides the 30 provinces into three subgroups: eastern, central, and western regions. Findings from the regression analysis grouped by categories are shown in Table 4. In column (1), findings suggest that, at the 1% statistical significance level, the primary term coefficient of new energy industry clustering in the eastern region is notably negative, while the coefficient for the quadratic term is notably positive. This suggests that the influence of new energy industry agglomeration on green innovation performance in the eastern region follows a “positive U-shaped” pattern; the inflection point value is 1.369. In the central and western regions, the outcomes in columns (2) and (3) reveal notably positive coefficients for the primary terms linked to the agglomeration of the new energy industry. Meanwhile, the coefficients for the quadratic terms are notably negative. The inflection point value in the central region is identified as 1.852, and in the western region, it is noted as 2.373. This indicates that the impact of new energy industry agglomeration on green innovation performance in the central and western regions follows an “inverted U-shaped” pattern, with the central region having a lower level of significance. Based on the analysis above, it is evident that there is a notable regional heterogeneity in how new energy industry agglomeration impacts green innovation performance in China. Compared to the western region, potential factors may originate from the observation that the central and eastern regions possess diminished endowments of new energy resources [23]. The eastern region, despite having a lower endowment of new energy resources, boasts the most developed economy, advanced governance capabilities, and management systems. This scenario promotes the early realization of positive externalities resulting from new energy industry agglomeration, enabling the eastern region to surpass the turning point sooner than the overall national level. In contrast, while the central region lags behind in economic development, the degree of clustering in the new energy industry within this area is not considerable, but the market and environmental carrying capacity in the central region are weaker, leading to the early manifestation of the negative externalities due to the over-concentration of the new energy sector. The western region, rich in new energy resources and driven by China’s commitment to achieving shared prosperity across regions via vigorous western development, has facilitated the swift advancement of the new energy industry, forming a high level of agglomeration. However, this has resulted in negative externalities such as “crowding effects” and “excessive competition”, affecting the green innovation performance in the respective regions.

5.5. Robustness and Endogenous Test

5.5.1. Replace the Explained Variable

To bolster the reliability of the findings, this study relies on existing research [64], considering economic, resource, and environmental factors comprehensively. It employs the SBM-DEA model, accounting for unexpected input–output, to assess green innovation performance. Based on the information in column (2) of Table 5, the main term coefficient associated with the agglomeration of the new energy industry is notably negative at the 1% statistical significance level. Concurrently, the quadratic term coefficient exhibits significant positivity at the same level of statistical significance. This robustly confirms the conclusion that the effect of new energy industry agglomeration on green innovation performance follows a “positive U-shaped” pattern.

5.5.2. Replacing Explanatory Variables

The location entropy is employed in the benchmark model section of this paper, derived from the installed capacity of new energy electricity generation, as the measurement indicator for new energy industry agglomeration. The capacity of installations for new energy electricity generation predominantly indicates the agglomeration scenario within the downstream power generation segment of the new energy industry chain. However, this does not encompass the upstream extraction segment and the midstream production and manufacturing segments. Therefore, following the approach proposed by scholar Guo Liwei [37], This study utilizes data from the general equipment manufacturing industry, electrical machinery and equipment manufacturing industry as proxy substitutes for new energy industry data. It chooses the operating revenue of the new energy industry as a measurement indicator to recompute the location entropy of agglomeration in the new energy industry and validate the robustness of the results. As shown in Table 5 (2), the coefficient associated with the primary term concerning the clustering of the new energy industry exhibits a notably negative trend at the 10% significance level, whereas the quadratic term coefficient demonstrates a significant positive association at the 1% statistical threshold. Although there are variations in the estimation results after substituting the explanatory variables, it does not alter the main conclusions. The findings still substantiate the “positive U-shaped” effect of new energy industry agglomeration on green innovation performance.

5.5.3. Increase Control Variable

Environmental regulations may require companies to boost investment in innovation and intensify research and development initiatives, thereby effectively encouraging green innovation. Under the condition of keeping the explanatory variables and the explained variable constant, this paper conducts a robustness test by introducing environmental regulations into the control variables. As shown in column (3) of Table 5, the coefficients pertaining to both the primary and quadratic terms of new energy industry agglomeration exhibit significance at the 1% statistical level. The coefficients experience only minor alterations, and their orientations stay in line with the baseline regression, indicating the stability of the results.

5.5.4. SYS-GMM

The presence of endogeneity issues in the model can lead to biases in empirical results. The baseline model in the paper utilizes a panel of two-way fixed-effects regression models. This model helps, to some extent, in addressing endogeneity concerns arising from factors that remain constant over time and across individuals. However, it does not resolve endogeneity issues associated with reverse causality. Therefore, this paper opts for the SYS-GMM approach to test endogeneity. The method utilizes the lagged dependent variable as an instrument, and the specific outcomes are showcased in column (4) of Table 5. p-values of the AR(2) and Sargan tests are both insignificant, indicating the absence of second-order autocorrelation in the model and confirming the effectiveness of the chosen instrumental variables. The coefficient for previous one-year green innovation performance is highly significant at the 1% confidence level. This implies that the enhancement in green innovation performance is a prolonged cumulative process, where past innovation developments can drive current innovation progress. The coefficients of the main and quadratic terms of agglomeration in the new energy industry remain compatible and significant, aligning with the previous results, demonstrating that, after addressing the endogeneity issue arising from reverse causality, the H1 remains valid.

6. Further Discussion

6.1. Regulatory Effect of Opening Up

Table 6 presents the results of incorporating the openness up as a moderating variable in the correlation between new energy industrial agglomeration and green innovation performance. Column (1) presents regression outcomes without incorporating control variables, whereas (2) incorporates these variables for a comprehensive analysis. The results reveal a distinct positive trend, reaching statistical significance at the 1% level, concerning the coefficient associated with the quadratic term of new energy industry agglomeration and the interaction term involving the degree of openness. This presents that the openness-up positively moderates the “positive U-shaped” effect of new energy industrial agglomeration on green innovation performance, thereby validating H2. Compared to the baseline regression, the coefficients for primary and quadratic terms of new energy industrial agglomeration display a shift in sign, suggesting a reversal in the “positive U-shaped” relationship between energy industry agglomeration and green innovation performance. The inflection point, calculated using the formula (−β1/2β2), is determined to be 2.397, signifying a rightward shift of the curve’s inflection point. The transition indicates that the moderating influence of external openness may counterbalance the adverse effects of the initial agglomeration of the new energy industry on green innovation performance. This promotes the efficient improvement in green innovation performance at the regional level during both the initial and intermediate phases of agglomeration in the new energy industry. Until the later stages of the new energy agglomeration industry, crowding effects hinder the development of green innovation.

6.2. Spatial Spillover Effect

The relationship between the new energy industry’s agglomeration and green innovation performance may exhibit spatial spillover effects. First of all, before conducting spatial econometric analysis, it is necessary to examine whether there exists a spatial correlation among the explained variables. This research examines the spatial correlation observed in green innovation performance. The execution of the Moran I index test was involved in the analysis of the data on green innovation performance spanning from 2011 to 2021. This procedure utilized a spatial adjacency weight matrix, and the corresponding findings have been showcased in Table 7. The results indicate a consistently significant positive Moran I index, at either the 1% or 5% level, across all years. This signifies a positive spatial autocorrelation in the green innovation performance among provinces. Secondly, to select appropriate spatial econometric models, this study conducts LM, LR, and Wald tests. The results, as shown in Table 8, indicate that the spatial Durbin model is ultimately employed to examine the spatial effects between new energy industry agglomeration and green innovation performance. Lastly, the fixed-effects model is determined for use via the Hausman test in this study.
The regression analysis results of the spatial Durbin model are presented in Table 9, where columns (1), (2), and (3), respectively, depict the outcomes of individual-fixed, time-fixed, and double-fixed effects. According to the results, among the three fixed-effects models, the spatial autoregressive coefficient for individual fixed effects demonstrates a significant positive trend at the 1% level, and the goodness of fit pertaining to individual fixed effects attains the highest level. Therefore, this investigation chooses the model with individual fixed effects as the primary analytical focus. The results obtained from the fixed-effects model regression reveal a notably negative coefficient for the primary term associated with new energy industry agglomeration, accompanied by a notably positive coefficient for the second-order term. This confirms the “inverted U-shaped” effect of new energy industry agglomeration on local green innovation performance, providing further validation for Hypothesis H1. The coefficient for the spatial interaction term in the first-order term of new energy industry agglomeration shows a notably positive trend. Conversely, the spatial interaction term coefficient in the second-order term exhibits a significant negative trend. This suggests that the effection of new energy industry agglomeration on the green innovation performance of neighboring regions Adheres to an “inverted U-shaped” pattern.
To comprehensively and systematically investigate the spatial effects of new energy industry agglomeration, this study employs partial differentiation to decompose the overall spatial effect into direct and indirect effects. The outcomes are showcased in Table 10. Both the direct and indirect regression coefficients for the first and second-order terms of new energy industry agglomeration successfully pass significance tests at the 1% level. However, the directions of the coefficients for direct and indirect effects are opposite. This implies that the impact of agglomeration in the new energy industry follows a “positive U-shaped” pattern on local green innovation performance while simultaneously demonstrating an “inverted U-shaped” spatial spillover effect on neighboring regions, confirming H3. This suggests that during the phase where positive externalities from new energy industry agglomeration have not yet materialized, profit-driven capital tends to facilitate the outflow of innovation resources from the region, thereby promoting green innovation development in neighboring areas. As the scope of agglomeration in the new energy industry increases and the operational mechanism of the industry becomes more intricate, a “siphon effect” on innovation resources in neighboring areas will emerge, thereby inhibiting green innovation performance in these adjacent regions.

7. Conclusions and Policy Implications

7.1. Conclusions

According to panel data spanning from 2011 to 2021, encompassing 30 provinces in China, the fixed-effects model is employed in this study to investigate the non-linear correlation between new energy industry clustering and green innovation performance. Additionally, this study explores and discusses the moderating factors and spatial effects between the two. The principal conclusions are as below: first, the calculation and analysis of indicators for new energy sector agglomeration and green innovation performance reveal pronounced regional variations in China’s new energy industry. The western region demonstrates the highest agglomeration level, while the nationwide scenario witnesses simultaneous enhancement and recession of new energy industry agglomeration. China’s overall green innovation performance is steadily improving, showing a stepwise distribution of “East–Middle–West”. Secondly, A nonlinear correlation is evident between China’s new energy sector clustering and the performance of green innovation, displaying a “positive U-shaped” pattern. Furthermore, significant regional variations are observed in this non-linear relationship, with the majority of Chinese provinces yet to surpass the inflection point of the “positive U-shaped” relationship. Thirdly, foreign openness moderates the “positive U-shaped” connection between new energy sector clustering and green innovation performance via the “imitation learning effect” and “competitive effect”. This moderating effect can counterbalance the adverse influence of the early phase of new energy industry agglomeration on green innovation performance. Fourthly, the effection of agglomeration in the new energy industry on the performance of green innovation demonstrates spatial spill-over effects. At the onset of new energy industry agglomeration, the outward movement of local resources, including capital and talent, had beneficial effects on green innovation performance in adjacent areas. However, as new energy industry agglomeration reaches a higher level, the inhibition of green innovation in adjacent areas occurs because of technological monopoly effects and suction effects.

7.2. Policy Implications

To further leverage the positive externalities stemming from the agglomeration of the new energy sector, boost local green innovation, and achieve the high-quality development goal of coordinated, green development among regions, the following recommendations are proposed:
(1)
Strengthen the role of policy in guiding and supervising new energy industry development. Local governments should take into account various factors such as industrial development foundation, economic status, endowment advantages, and technological conditions to rationally guide and plan industrial layout, maximizing the positive externalities of industrial agglomeration. In regions with lower levels of new energy industry agglomeration, tailor-made approaches should be adopted to develop new energy industry clusters with regional characteristics. In regions with higher levels of new energy industry agglomeration, it is essential to manage their scale judiciously to prevent overcrowding resulting from indiscriminate development. Additionally, while the government attracts new energy industry agglomeration via various preferential measures, it is imperative to establish rigorous evaluation mechanisms and regulatory platforms to accurately identify enterprises in urgent need of support. This helps to prevent false agglomeration resulting from “policy rent-seeking” behavior by companies.
(2)
Strengthen collaboration within each region’s new energy industry, promote the formation of a national green innovation network for new energy technologies, and actively break down interregional technological monopolies and market barriers. The new energy industry, being knowledge-intensive, may exhibit monopolistic tendencies in technology and resources, which are not conducive to the coordinated advancement of green innovation performance across regions. On one hand, establishing interregional green innovation alliances within the new energy industry can foster a network of green technology innovation, facilitating information sharing and technological exchange among regions. On the other hand, establishing robust incentive and management systems, such as comprehensive innovation reward mechanisms and intellectual property protection mechanisms, is essential. These measures aim to eliminate institutional barriers that impede the flow of innovation factors between regions, thereby fostering a conducive external environment for the interregional mobility of innovation factors. Via interregional knowledge spillover exchanges and interactions, achieving common progress in the green innovation performance of each region will enhance the overall green innovation performance of the country.
(3)
Deepen external openness and optimize the innovation environment. Firstly, broadening the domestic and international spatial pattern of openness, seizing the opportunities presented by the “Belt and Road” initiative and the establishment of high-quality free trade zones, and constructing a global network for external openness, especially in the relatively less open regions like the northwest. Secondly, the proportion of high-tech and high-quality product imports should be increased to enhance the quality of technology transfer, fully harnessing the technology spillover effects brought about by import trade and strengthening the absorption and re-creation of green innovation elements by enterprises.

7.3. Research Limitations

This study has unavoidable limitations. Firstly, the scope of this paper is limited to China, and its findings are only applicable to countries with development levels and patterns similar to those of China. Secondly, due to limitations in data accessibility, this paper utilizes provincial panel data. Future statistical analyses on new energy industry data extended to prefecture-level cities would enable a more precise exploration of the impact of green innovation on new energy industry clustering. Finally, this study treats green innovation activities as a whole, overlooking their stage differences. Variations may exist in the impact of new energy industry clustering on the R&D performance and outcome transformation of green innovation. Hence, further research is warranted to investigate their relationship from the perspective of the two-stage value chain.

Author Contributions

Data curation, H.D.; methodology, J.Y. and H.D.; writing—original draft preparation, J.Y. and H.D.; writing—review and editing, H.D. and J.Y. All authors have read and agreed to the published version of the manuscript.

Funding

This research received no external funding.

Institutional Review Board Statement

Not applicable.

Informed Consent Statement

Not applicable.

Data Availability Statement

The data presented in this study are available upon request from the corresponding author.

Conflicts of Interest

The authors declare no conflicts of interest.

References

  1. Liang, Y.; Hao, X. Can the Agglomeration of New Energy Industries Improve Environmental Efficiency?—Evidence from China. Sustainability 2022, 14, 8961. [Google Scholar] [CrossRef]
  2. Goldemberg, J. The Promise of Clean Energy. Energy Policy 2006, 34, 2185–2190. [Google Scholar] [CrossRef]
  3. Lin, B.; Li, Z. Towards World’s Low Carbon Development: The Role of Clean Energy. Appl. Energy 2022, 307, 118160. [Google Scholar] [CrossRef]
  4. Zhang, F.; Gallagher, K.S.; Myslikova, Z.; Narassimhan, E.; Bhandary, R.R.; Huang, P. From Fossil to Low Carbon: The Evolution of Global Public Energy Innovation. WIREs Clim. Chang. 2021, 12, e734. [Google Scholar] [CrossRef]
  5. Diaz-Rainey, I.; Ashton, J.K. Investment Inefficiency and the Adoption of Eco-Innovations: The Case of Household Energy Efficiency Technologies. Energy Policy 2015, 82, 105–117. [Google Scholar] [CrossRef]
  6. Du, K.; Li, J. Towards a Green World: How Do Green Technology Innovations Affect Total-Factor Carbon Productivity. Energy Policy 2019, 131, 240–250. [Google Scholar] [CrossRef]
  7. Guinot, J.; Barghouti, Z.; Chiva, R. Understanding Green Innovation: A Conceptual Framework. Sustainability 2022, 14, 5787. [Google Scholar] [CrossRef]
  8. Lee, S.-H.; Park, S.; Kim, T. Review on Investment Direction of Green Technology R&D in Korea. Renew. Sustain. Energy Rev. 2015, 50, 186–193. [Google Scholar] [CrossRef]
  9. Zhan, H.; Hou, M.; Tan, F. Influence of intelligentization on enterprise green innovation: Evidence from listed companies of new energy industry in China. Resour. Sci. 2022, 44, 984–993. [Google Scholar] [CrossRef]
  10. Liu, J.; Chen, T.; Chen, Z. Revolution of New Energy Industry: Spatio-Temporal Dynamics and Drivers of Technological Diffusion in Zhejiang, China. Front. Environ. Sci. 2022, 10, 1058372. [Google Scholar] [CrossRef]
  11. Niu, X.; Li, C. On China’s Strategic Orientation, Policy Framework and Role of Government in Renewable Energy Sources. Chin. Public Adm. 2014, 3, 100–103. [Google Scholar] [CrossRef]
  12. Song, M.; Chen, Y.; An, Q. Spatial Econometric Analysis of Factors Influencing Regional Energy Efficiency in China. Environ. Sci. Pollut. Res. 2018, 25, 13745–13759. [Google Scholar] [CrossRef] [PubMed]
  13. Xingang, Z.; Jieyu, W.; Xiaomeng, L.; Pingkuo, L. China’s Wind, Biomass and Solar Power Generation: What the Situation Tells Us? Renew. Sustain. Energy Rev. 2012, 16, 6173–6182. [Google Scholar] [CrossRef]
  14. Liu, Y.; Xiao, L.; Wang, H.; Lin, L.; Dai, S. Investigation on the Spatiotemporal Complementarity of Wind Energy Resources in China. Sci. China Technol. Sci. 2012, 55, 725–734. [Google Scholar] [CrossRef]
  15. Li, Y.; Wu, X.-P.; Li, Q.-S.; Tee, K.F. Assessment of Onshore Wind Energy Potential under Different Geographical Climate Conditions in China. Energy 2018, 152, 498–511. [Google Scholar] [CrossRef]
  16. Su, Y.; Yu, Y. Spatial Agglomeration of New Energy Industries on the Performance of Regional Pollution Control through Spatial Econometric Analysis. Sci. Total Environ. 2020, 704, 135261. [Google Scholar] [CrossRef]
  17. Dong, L.; Liang, H.; Gao, Z.; Luo, X.; Ren, J. Spatial Distribution of China’s Renewable Energy Industry: Regional Features and Implications for a Harmonious Development Future. Renew. Sustain. Energy Rev. 2016, 58, 1521–1531. [Google Scholar] [CrossRef]
  18. Peng, H.; Shen, N.; Liao, H.; Wang, Q. Multiple Network Embedding, Green Knowledge Integration and Green Supply Chain Performance—Investigation Based on Agglomeration Scenario. J. Clean. Prod. 2020, 259, 120821. [Google Scholar] [CrossRef]
  19. Li, X.; Lai, X.; Zhang, F. Research on Green Innovation Effect of Industrial Agglomeration from Perspective of Environmental Regulation: Evidence in China. J. Clean. Prod. 2021, 288, 125583. [Google Scholar] [CrossRef]
  20. Zhang, X.; Yao, S.; Zheng, W.; Fang, J. On Industrial Agglomeration and Industrial Carbon Productivity—Impact Mechanism and Nonlinear Relationship. Energy 2023, 283, 129047. [Google Scholar] [CrossRef]
  21. Wang, Y.; Bai, Y.; Quan, T.; Ran, R.; Hua, L. Influence and Effect of Industrial Agglomeration on Urban Green Total Factor Productivity—On the Regulatory Role of Innovation Agglomeration and Institutional Distance. Econ. Anal. Policy 2023, 78, 1158–1173. [Google Scholar] [CrossRef]
  22. Li, T.; Shi, Z.; Han, D.; Zeng, J. Agglomeration of the New Energy Industry and Green Innovation Efficiency: Does the Spatial Mismatch of R&D Resources Matter? J. Clean. Prod. 2023, 383, 135453. [Google Scholar] [CrossRef]
  23. Pan, L.; Chen, J.; Chai, B. Research on the Impact of New Energy Power Generation Industry Agglomeration on Regional Green Economic Efficiency. J. Chin. Soc. Power Eng. 2022, 42, 1051–1060. [Google Scholar] [CrossRef]
  24. Martinez-Ros, E.; Kunapatarawong, R. Green Innovation and Knowledge: The Role of Size. Bus. Strateg. Environ. 2019, 28, 1045–1059. [Google Scholar] [CrossRef]
  25. Fan, J.; Teo, T. Will China’s R&D Investment Improve Green Innovation Performance? An Empirical Study. Environ. Sci. Pollut. Res 2022, 29, 39331–39344. [Google Scholar] [CrossRef]
  26. He, K.; Chen, W.; Zhang, L. Senior Management’s Academic Experience and Corporate Green Innovation. Technol. Forecast. Soc. Chang. 2021, 166, 120664. [Google Scholar] [CrossRef]
  27. Bhatti, S.M.; Al Mamun, A.; Wu, M.; Naznen, F.; Kanwal, S.; Makhbul, Z.K.M. Modeling the Significance of Green Orientation and Culture on Green Innovation Performance: Moderating Effect of Firm Size and Green Implementation. Environ. Sci. Pollut. Res. 2023, 30, 99855–99874. [Google Scholar] [CrossRef]
  28. Tang, C.; Xu, Y.; Hao, Y.; Wu, H.; Xue, Y. What Is the Role of Telecommunications Infrastructure Construction in Green Technology Innovation? A Firm-Level Analysis for China. Energy Econ. 2021, 103, 105576. [Google Scholar] [CrossRef]
  29. Stucki, T.; Woerter, M.; Arvanitis, S.; Peneder, M.; Rammer, C. How Different Policy Instruments Affect Green Product Innovation: A Differentiated Perspective. Energy Policy 2018, 114, 245–261. [Google Scholar] [CrossRef]
  30. Lambertini, L.; Poyago-Theotoky, J.; Tampieri, A. Cournot Competition and “Green” Innovation: An Inverted-U Relationship. Energy Econ. 2017, 68, 116–123. [Google Scholar] [CrossRef]
  31. Zeng, W.; Li, L.; Huang, Y. Industrial Collaborative Agglomeration, Marketization, and Green Innovation: Evidence from China’s Provincial Panel Data. J. Clean. Prod. 2021, 279, 123598. [Google Scholar] [CrossRef]
  32. Stucki, T. What Hampers Green Product Innovation: The Effect of Experience. Ind. Innov. 2019, 26, 1242–1270. [Google Scholar] [CrossRef]
  33. Ding, J.; Liu, B.; Shao, X. Spatial Effects of Industrial Synergistic Agglomeration and Regional Green Development Efficiency: Evidence from China. Energy Econ. 2022, 112, 106156. [Google Scholar] [CrossRef]
  34. Wang, H.; Hao, W. Impact of high-tech industrial agglomeration on the efficiency of green innovation in China. China Soft Sci. 2022, 08, 172–183. [Google Scholar]
  35. Wu, C.; Shen, Y. Effect of Equipment Manufacturing Industrial Concentration on Green Innovation Efficiency in China. Sci. Technol. Prog. Policy 2019, 36, 54–63. [Google Scholar]
  36. Wu, R.; Lin, B. Does Industrial Agglomeration Improve Effective Energy Service: An Empirical Study of China’s Iron and Steel Industry. Appl. Energy 2021, 295, 117066. [Google Scholar] [CrossRef]
  37. Guo, L.; Shen, M. The Comparative Study of New Energy Industrial Agglomeration Level in China’s Provincial Administrative Region Based on Panel Data. Ecol. Econ. 2018, 34, 81–85. [Google Scholar]
  38. Wang, H.; Zhang, X.; Bin, H.; Li, M. Study on Agglomeration Measurement and Structure Optimization of Strategic Emerging Industries-Taking New Energy Industry as an Example. Inq. Econ. Issues 2018, 10, 179–190. [Google Scholar]
  39. Agterbosch, S.; Vermeulen, W.; Glasbergen, P. Implementation of Wind Energy in the Netherlands: The Importance of the Social–Institutional Setting. Energy Policy 2004, 32, 2049–2066. [Google Scholar] [CrossRef]
  40. Kuik, O.; Branger, F.; Quirion, P. Competitive Advantage in the Renewable Energy Industry: Evidence from a Gravity Model. Renew. Energy 2019, 131, 472–481. [Google Scholar] [CrossRef]
  41. Shi, D.; Yang, D. The Role of Chinese Alternative Energy Industry in World Arena and Role-promoting Measures. Sino-Glob. Energy 2012, 17, 29–35. [Google Scholar]
  42. Binz, C.; Gosens, J.; Hansen, T.; Hansen, U.E. Toward Technology-Sensitive Catching-Up Policies: Insights from Renewable Energy in China. World Dev. 2017, 96, 418–437. [Google Scholar] [CrossRef]
  43. Ericsson, K.; Nilsson, L.J.; Nilsson, M. New Energy Strategies in the Swedish Pulp and Paper Industry—The Role of National and EU Climate and Energy Policies. Energy Policy 2011, 39, 1439–1449. [Google Scholar] [CrossRef]
  44. Haas, R.; Panzer, C.; Resch, G.; Ragwitz, M.; Reece, G.; Held, A. A Historical Review of Promotion Strategies for Electricity from Renewable Energy Sources in EU Countries. Renew. Sustain. Energy Rev. 2011, 15, 1003–1034. [Google Scholar] [CrossRef]
  45. Li, Q.; Wang, M.; Xiangli, L. Do Government Subsidies Promote New-Energy Firms’ Innovation? Evidence from Dynamic and Threshold Models. J. Clean. Prod. 2021, 286, 124992. [Google Scholar] [CrossRef]
  46. Cheng, Y.; Yao, X. Carbon Intensity Reduction Assessment of Renewable Energy Technology Innovation in China: A Panel Data Model with Cross-Section Dependence and Slope Heterogeneity. Renew. Sustain. Energy Rev. 2021, 135, 110157. [Google Scholar] [CrossRef]
  47. Zhao, J.; Dong, K.; Dong, X.; Shahbaz, M. How Renewable Energy Alleviate Energy Poverty? A Global Analysis. Renew. Energy 2022, 186, 299–311. [Google Scholar] [CrossRef]
  48. Yu, Y.; Lin, Z.; Liu, D.; Hou, Y. Exploring the Spatially Heterogeneous Impacts of Industrial Agglomeration on Regional Sustainable Development Capability: Evidence from New Energy Industries. Environ. Dev. Sustain. 2023, 1–26. [Google Scholar] [CrossRef]
  49. Jang, S.; Kim, J.; von Zedtwitz, M. The Importance of Spatial Agglomeration in Product Innovation: A Microgeography Perspective. J. Bus. Res. 2017, 78, 143–154. [Google Scholar] [CrossRef]
  50. Yang, H.; Xu, X.; Zhang, F. Industrial Co-Agglomeration, Green Technological Innovation, and Total Factor Energy Efficiency. Environ. Sci. Pollut. Res. 2022, 29, 62475–62494. [Google Scholar] [CrossRef]
  51. Diodato, D.; Neffke, F.; O’Clery, N. Why Do Industries Coagglomerate? How Marshallian Externalities Differ by Industry and Have Evolved over Time. J. Urban Econ. 2018, 106, 1–26. [Google Scholar] [CrossRef]
  52. Iammarino, S.; McCann, P. The Structure and Evolution of Industrial Clusters: Transactions, Technology and Knowledge Spillovers. Res. Policy 2006, 35, 1018–1036. [Google Scholar] [CrossRef]
  53. Liu, X.; Zhang, X. Industrial Agglomeration, Technological Innovation and Carbon Productivity: Evidence from China. Resour. Conserv. Recycl. 2021, 166, 105330. [Google Scholar] [CrossRef]
  54. Xia, H.; Dai, L.; Sun, L.; Chen, X.; Li, Y.; Zheng, Y.; Peng, Y.; Wu, K. Analysis of the Spatiotemporal Distribution Pattern and Driving Factors of Renewable Energy Power Generation in China. Econ. Anal. Policy 2023, 80, 414–428. [Google Scholar] [CrossRef]
  55. McCauley, S.M.; Stephens, J.C. Green Energy Clusters and Socio-Technical Transitions: Analysis of a Sustainable Energy Cluster for Regional Economic Development in Central Massachusetts, USA. Sustain. Sci. 2012, 7, 213–225. [Google Scholar] [CrossRef]
  56. Huang, X. The Roles of Competition on Innovation Efficiency and Firm Performance: Evidence from the Chinese Manufacturing Industry. Eur. Res. Manag. Bus. Econ. 2023, 29, 100201. [Google Scholar] [CrossRef]
  57. Yin, X.; Guo, L. Industrial Efficiency Analysis Based on the Spatial Panel Model. EURASIP J. Wirel. Commun. Netw. 2021, 2021, 28. [Google Scholar] [CrossRef]
  58. Zhang, L.; Ni, Z. Scientific and Technological Talent Agglomeration and Regional Innovation Efficiency-Empirical Test Based on Spatial Spillover and Threshold Effect. Soft Sci. 2022, 36, 45–50. [Google Scholar] [CrossRef]
  59. Wang, J.; Li, J.; Zhang, Y. How does Policy Uncertainty Affect Enterprise’s Innovation Performance: An Analysis of Mediating Role of Interregional R&D Factor Flow. Sci. Technol. Prog. Policy 2022, 39, 105–113. [Google Scholar]
  60. Caldara, D.; Iacoviello, M.; Molligo, P.; Prestipino, A.; Raffo, A. The Economic Effects of Trade Policy Uncertainty. Int. Financ. Discuss. Pap. 2019, 2019, 1–49. [Google Scholar] [CrossRef]
  61. Wang, J.; Guo, D. Siphon and Radiation Effects of ICT Agglomeration on Green Total Factor Productivity: Evidence from a Spatial Durbin Model. Energy Econ. 2023, 126, 106953. [Google Scholar] [CrossRef]
  62. Zhang, G.; Li, T. The Innovation Efficiency Pattern Evolution and Spatial Econometric Analysis of Beijing, Tianjin and Hebei. Areal Res. Dev. 2017, 36, 13–18. [Google Scholar]
  63. Gao, K.; Yuan, Y. Government Intervention, Spillover Effect and Urban Innovation Performance: Empirical Evidence from National Innovative City Pilot Policy in China. Technol. Soc. 2022, 70, 102035. [Google Scholar] [CrossRef]
  64. Yang, H.; Li, L.; Liu, Y. The Effect of Manufacturing Intelligence on Green Innovation Performance in China. Technol. Forecast. Soc. Chang. 2022, 178, 121569. [Google Scholar] [CrossRef]
Figure 1. Eastern region.
Sustainability 16 02029 g001
Figure 2. Central region.
Sustainability 16 02029 g002
Figure 3. Western region.
Sustainability 16 02029 g003
Figure 4. Spatial distribution of the mean value of new energy industry agglomeration.
Sustainability 16 02029 g004
Figure 5. Results of green innovation performance measurement.
Sustainability 16 02029 g005
Table 1. Evaluation indicator system for green innovation performance.
HierarchyMeasurement IndicatorsWeightAttribute
Innovation Input Capabilityfull-time equivalent of R&D personnel20.12%Positive
internal R&D fund expenditure18.71%Positive
investments in industrial pollution control12.09%Positive
Innovation Output Levelthe number of patent applications22.35%Positive
sales revenue from new products20.51%Positive
green coverage rate in developed areas0.59%Positive
Energy Consumptionelectricity consumption1.38%Negative
Environmental Pollutiontotal industrial sulfur dioxide emissions1.43%Negative
total industrial wastewater emissions1.44%Negative
generation of general industrial solid waste1.37%Negative
Table 2. Descriptive statistics for every variable.
TypeVariable NameSymbolMeanMinMaxSD
Explained variableGreen innovation performanceinn0.1680.0660.8980.135
Explanatory variableNew energy industry agglomerationagg0.9760.0043.8130.751
regulated variableOpening upopen0.2650.0081.5480.291
Control variableForeign investment levelfdi0.0190.0000.0800.015
government interventiongov0.2490.1070.6430.103
Marketization indexmarket8.0393.35912.3901.914
Infrastructure levelInfralevel39.0905.129145.03724.440
Table 3. Benchmark model regression findings.
Inn
(1)(2)(3)(4)
agg−0.047 **−0.060 ***
(0.019)(0.019)
agg_20.017 ***0.017 ***
(0.005)(0.005)
l.agg −0.054 ***−0.065 ***
(0.019)(0.019)
l.agg_2 0.018 ***0.017 ***
(0.005)(0.005)
fdi 0.342 0.329
(0.326) (0.337)
gov −0.202 * −0.204 *
(0.109) (0.110)
market 0.004 0.007
(0.006) (0.006)
Infralevel −0.005 *** −0.005 ***
(0.001) (0.001)
_cons0.132 ***0.340 ***0.148 ***0.329 ***
(0.012)(0.061)(0.012)(0.064)
province YesYesYesYes
yearYesYesYesYes
N330330300300
r20.3100.4090.2850.378
* p < 0.1, ** p < 0.05, *** p < 0.001.
Table 4. Regional heterogeneity test results.
inn
(1)(2)(3)
EastMidlandWest
agg−0.060 ***0.072 ***0.024 ***
(0.019)(0.027)(0.008)
agg_20.017 ***−0.019 *−0.005 ***
(0.005)(0.011)(0.002)
fdi0.342 0.321−1.275 ***
(0.326)(0.384)(0.268)
gov−0.202 *−0.267 ***−0.097 **
(0.109)(0.088)(0.040)
market0.004 0.0040.001
(0.006)(0.006)(0.002)
Infralevel−0.005 ***0.003 ***0.000
(0.001)(0.001)(0.000)
_cons0.340 ***0.0030.131 ***
(0.061)(0.050)(0.025)
Control variableYesYesYes
provinceYesYesYes
yearYesYesYes
r20.4090.8670.603
N330330330
* p < 0.1, ** p < 0.05, *** p < 0.001.
Table 5. Robustness and endogenous test results.
inn2inn
(1)(2)(3)(4)
L.inn 1.109 ***
(0.029)
agg−0.273 *** −0.062 ***−0.021 **
(0.094) (0.018)(0.010)
agg_20.081 *** 0.015 ***0.007 ***
(0.026) (0.005)(0.002)
inagg −0.179 *
(0.101)
inagg_2 0.221 ***
(0.058)
fdi4.582 ***−0.3820.348 0.553
(1.621)(0.328)(0.317)(0.341)
gov1.293 **−0.117−0.228 **0.118 *
(0.543)(0.104)(0.107)(0.060)
market0.057 **0.008 0.004 0.004
(0.028)(0.006)(0.005)(0.005)
Infralevel0.010 **−0.005 ***−0.005 ***0.000
(0.004)(0.001)(0.001)(0.000)
ers 4.315 ***
(1.049)
provinceYesYesYesYes
yearYesYesYesYes
_cons−0.591 *0.245 ***0.331 ***−0.071
(0.301)(0.068)(0.059)(0.052)
r20.1690.445 0.442
N330330330210
AR (2)-p 0.595
Hansen test-p 0.686
* p < 0.1, ** p < 0.05, *** p < 0.001.
Table 6. Test results of adjustment function of opening up.
inn
(1)(2)
agg0.106 ***0.094 ***
(0.022)(0.023)
agg_2−0.019 ***−0.020 ***
(0.007)(0.007)
agg × open−0.595 ***−0.645 ***
(0.099)(0.100)
agg_2 × open0.149 ***0.185 ***
(0.048)(0.049)
tra0.075 *0.139 ***
(0.044)(0.044)
Control variableNoYes
provinceYesYes
yearYesYes
_cons0.132 ***0.255 ***
(0.013)(0.055)
r20.5160.564
N330330
* p < 0.1, ** p < 0.05, *** p < 0.001.
Table 7. Moran I index and its test for green innovation performance from 2011 to 2021.
variable20112012201320142015201620172018201920202021
Moran I0.1990.2040.2110.2110.2470.2570.1980.1380.1480.1550.162
Z-value2.0262.0762.1142.1022.4272.5092.0291.5511.6561.7021.763
p-value0.0210.0190.0170.0180.0080.0060.0210.060.0490.0440.039
Table 8. Model type test results.
LM testLM-error test9.56 ***
Robust LM-error test9.35 ***
LM-lag test16.695 ***
Robust LM-lag test16.485 ***
LR testLR Test (SAR)117.17 ***
LR Test (SEM)118.29 ***
Wald testWald Test (SAR)140.39 ***
Wald Test(SEM)137.74 ***
* p < 0.1, ** p < 0.05, *** p < 0.001.
Table 9. Spatial effect regression result.
inn
(1)(2)(3)
Individual FixedTime FixedIndividual and Time Fixed
agg−0.115 ***0.134 ***−0.124 ***
(0.017)(0.023)(0.017)
agg_20.025 ***−0.029 ***0.027 ***
(0.004)(0.007)(0.004)
Control variableYesYesYes
W × agg0.222 ***−0.148 ***0.197 ***
(0.026)(0.041)(0.033)
W × agg_2−0.035 ***0.042 ***−0.033 ***
(0.008)(0.013)(0.009)
W × Control variableYesYesYes
provinceYesNoYes
yearNoYesYes
rho0.275 ***0.0480.115 **
(0.047)(0.069)(0.054)
Variance sigma2_e0.001 ***0.007 ***0.001 ***
0.000(0.001)0.000
N330330330
r20.4950.0990.011
* p < 0.1, ** p < 0.05, *** p < 0.001.
Table 10. Findings regarding the direct, indirect, and overall effects estimation.
VariableDirect EffectIndirect EffectTotal Effect
agg−0.101 ***0.249 ***0.148 ***
(0.017)(0.036)(0.042)
agg_20.023 ***−0.037 ***−0.014
(0.005)(0.010)(0.012)
Control variableYesYesYes
* p < 0.1, ** p < 0.05, *** p < 0.001.
Disclaimer/Publisher’s Note: The statements, opinions and data contained in all publications are solely those of the individual author(s) and contributor(s) and not of MDPI and/or the editor(s). MDPI and/or the editor(s) disclaim responsibility for any injury to people or property resulting from any ideas, methods, instructions or products referred to in the content.

