1. Introduction
At present, with the access of a high proportion of new energy sources, the inertia of the new power system continues to decline, the dynamic characteristics change, and the risk of safe and stable operation of the power grid becomes increasingly prominent. In addition, there are uncontrollable random failure risks during operation, such as equipment failure, load fluctuation, external force damage, system instability, and other risks [
1]. Therefore, for the new power system, risk assessment can quantify the risk, which is the necessary link and reliable guarantee for the safety and stability of the power system. At the same time, the traditional power system risk assessment theory has been unable to fully adapt to the new power system. Therefore, in order to improve the system control ability, it is necessary to establish a new power system risk assessment system.
The research on the risk of the new power system can be roughly divided into three categories. In terms of random uncertainty, Yi Zhang et al. believe that voltage sag has become the most serious type of power quality problem; it is mainly caused by short circuit fault of the power grid and has a widespread range, which can interrupt the operation of the equipment and then affect the continuity of the entire process [
2]. Xiaopeng Li believes that the output prediction error of new energy units changes the original supply–demand balance of the system, which may cause the system to fail to meet the load requirements and lead to the upward risk of supply–demand mismatch [
3]. Xie et al. believe that the power generation, power load, and power equipment life of new energy units in the new power system will also be affected by weather factors, and even be more sensitive to low-temperature cold wave weather [
4]. In terms of cognitive uncertainty, Yan Meng et al. believe that different demand response users have different levels of rational cognition, consumption behavior, and adaptability, resulting in different users’ willingness to participate in demand response, and the resulting uncertainties will cause risks to the new power system [
5]. In terms of decision dependence on uncertainty, Xuemin An et al. believe that the inclusion of new energy output and load response with uncertainty in system planning/operation decision making will affect the instability of both supply and demand [
6]. In short, compared with the traditional power system, the new power system is more flexible, the risk sources are more diverse, and the risk forms are more complex.
At present, there are various methods of risk assessment which are applied in different fields. Among them, algorithms based on machine learning and artificial intelligence are widely used in early warning of natural disasters. When exploring typhoon generation, path, and intensity, Chen et al. paid attention to the spatio-temporal correlation of atmospheric and ocean variables, defined typhoon formation and intensity forecast as the classification and regression problems of spatio-temporal series forecast, and established a convolutional neural network–long short-term memory network hybrid prediction model [
7]. Liang et al. developed a structural smoothing technique for diffraction imaging by analyzing the root mean square amplitude energy of diffraction data and proposed a method for describing natural fracture zones based on diffraction data which is capable of predicting earthquakes by describing the spatial distribution of natural fracture zones with a high signal-to-noise ratio [
8]. In terms of risk assessment in the field of cold chain logistics, Wang Qi conducted cluster analysis on the risk indicators of cold chain logistics of agricultural products, established an index system according to the clustering results, and calculated the weight of the indicators by using an analytic hierarchy process [
9]. When calculating grey statistics, Juring Zhang et al. took into account the human factor and added the objectively assigned expert weight. The weights of each index are obtained by using an analytic hierarchy process. Finally, the index weight is combined with the improved grey comprehensive evaluation method to obtain the overall risk value [
10]. Risk assessment is also fully reflected in the civil aviation field. Zhang et al. [
11] established a machine learning model integrated with support vector machine and deep neural network, developed a risk-based event outcome classification strategy, and verified the effectiveness of the hybrid model in quantifying risks related to the consequences of dangerous events. Yantao Wang et al. [
12] used rough set theory to reduce the core risk index, and then selected two machine learning algorithms, support vector machine and neural network, to improve the risk identification accuracy to 95%.
Meanwhile, for the research on the comprehensive assessment index system of the new power system, domestic and foreign researchers have formed stage-by-stage results. The research in [
13] used the dynamic programming method to achieve the annual optimal control and analyzed the impact of different pricing schemes, energy storage system capacity, and unit capacity cost on the efficiency of the system; the study in [
14] assessed and researched the static voltage stability of the AC-DC hybrid grid, formed an index system, and verified its reasonableness in different application scenarios; the research in [
15] assessed the reliability-constrained energy supply capacity for microgrids containing multiple energy sources, and formed a set of accurate assessment system. The above literature shows that the current assessment systems at home and abroad generally consider the security and flexibility aspects, while ignoring the impact of environmental benefits, supply and demand balance, etc., and the establishment of a comprehensive evaluation system still needs to be improved. In this paper, with reference to the evaluation index system of large power grids and the influencing factors of the new power system, we establish the risk assessment index system of the new power system from five aspects, namely security, supply and demand, sufficiency, cleanliness, and flexibility.
In summary, however, due to the greater complexity, stochasticity, and risk of the new type of power system, it is very necessary to assess the risks existing in the new type of power system. Among the existing risk assessment methods, the use of hierarchical analysis has too many qualitative components, which is unconvincing. In the use of support vector machines, neural networks, and other machine learning methods, the training time is very long, and if the amount of training data is not large, it is prone to overfitting phenomena, and the performance on the data is poor. The cloud model can handle the mutual conversion between qualitative and quantitative well, and can be used to deal with some problems and limitations of fuzzy logic and probability statistics in dealing with uncertainty. Meanwhile, it can also be applied to many fields, such as natural language processing, data mining, decision analysis, intelligent control, and image processing, which can be better combined with the new power system risk assessment. Therefore, this paper establishes a new type of power system risk assessment index system from five aspects, namely security, supply and demand, sufficiency, cleanliness, and flexibility, and adopts a comprehensive evaluation method of cloud modelling to assess the risk of the new type of power system.
The paper is organized as follows.
Section 2 is the processing method.
Section 3 is a case study to verify the effectiveness of the method.
Section 4 is the discussion and analysis of the research content of this paper.
Section 5 is the conclusion of this paper.
2. Methods
2.1. Research Ideas
This paper improves the existing index system’s neglect of environmental benefits and supply and demand balance, and establishes an index system for the risk of the new power system by analyzing the evaluation index system of a large power grid and the influencing factors of the new power system. The index weight of a new power system is established by means of the entropy weight–critic combination weighting method, and the comprehensive evaluation is carried out by combining it with the cloud model. Finally, the specific data of the new power system in Fujian Province from 2020 to 2022 are taken as an example to verify the feasibility of combining the combined weighting method with the cloud model.
2.2. Influencing Factors
The new power system takes wind, light, and other new energy as the main body. Due to the inherent randomness, volatility, and intermittent nature of new energy power generation and the characteristics of power grid integration through power electronic devices, the new power system will present the characteristics of “one low, two high, double peaks, double random”, which brings risks and challenges to the operation of the new power system. This paper analyzes the factors that bring risks to the operation of the new power system from five aspects.
- (1)
Security factors
Security represents the ability of a new power system to respond to dynamic and transient disturbances. Security resources mainly include loss of load, line flow, energy equipment failure, and so on. Loss of load refers to the sudden reduction in or disappearance of load in the power system. Since the power system needs to maintain balance, load reduction will lead to an increase in the frequency of the power system. At the same time, the loss of load may cause the voltage level to rise and affect the voltage stability of the power system. Line power flow refers to the flow of current in the power system in the transmission line. It determines the active power loss on the transmission line. A large amount of active power loss can lead to wasted energy and reduce the overall efficiency of the system. If the line power flow exceeds the designed capacity, the line may be overloaded, resulting in equipment overheating, equipment failure, or wire breakage, which poses a threat to the safety of the system. Failure of energy equipment can lead to the interruption of generators or transmission lines, which can trigger power supply disruptions. It can also cause other equipment to overload, such as transformers or transmission lines, causing equipment to overheat, and even start a fire, which poses a threat to the safety of the system.
- (2)
Supply and demand factors
At present, the mismatch between supply and demand of the new power system is obvious, and it faces the problem of the coexistence of efficient consumption and energy security. The downside risk of supply and demand mismatch represents the risk of “short supply” caused by component failures and new energy fluctuations. The upside risk of mismatch between supply and demand represents that the new energy or hydropower output is sufficient, but due to the access of a large number of interactive devices such as distributed power supplies and energy storage, the power flow congestion leads to the risk of “oversupply”. An expected power shortage is a lack of power supply in the power system due to various reasons, resulting in power outages or the need for emergency measures to balance supply and demand. If a large number of renewable energy sources are used in the new power system, the uncontrollable factors of renewable energy will exacerbate the imbalance between supply and demand. “Wind curtailment” and “light curtailment” generally refer to the excess generation of electricity in the power system due to the volatility of renewable energy sources such as wind and solar that cannot be fully absorbed. At the same time, when there is a surplus of renewable energy, if this excess power cannot be efficiently stored or deployed, it will lead to energy waste.
- (3)
Sufficiency factor
Adequacy represents the ability of system facilities to fully meet user load requirements under system constraints. The new power system has changed from “source-on-load” to “source-on-load interaction”, and its risk is related to the system’s source-on-load and wind–scene complementarity. “Source load synchronization” usually refers to the synchronous movement of the power supply and load in the power system, that is, the capacity of the power supply and the demand for the load can change relatively harmoniously. It helps ensure a balance between power supply and load, making it easier to maintain an adequate power supply by generating electricity in the system to meet actual demand. Wind–solar complementarity refers to the complementary relationship between wind and solar energy in time and space. This complementarity allows the generation of wind and solar energy to compensate for each other within a certain time frame, thus providing electricity more smoothly. It also helps smooth out the volatility of renewable energy. Due to the complementary characteristics of solar and wind energy in time, the generation of solar energy may be strong at a certain time, while wind energy is relatively weak, and vice versa. This helps reduce volatility in the system and increases the stability of the power.
- (4)
Cleaning factors
Cleanliness represents the carbon emission degree of the new power system, which is mainly reflected in the new energy grid connection, new energy consumption, and carbon dioxide emission reduction. Renewable energy sources such as wind and solar are intermittent and unstable, and are affected by weather conditions, and the amount of electricity generated can fluctuate greatly. When the fluctuation of renewable energy is not properly managed, it may be necessary to rely on a traditional stable power source to deal with the fluctuation, thus reducing the cleanliness of the entire power system. New energy consumption refers to the effective integration of electric energy generated by new energy into the power system to meet the needs of users. However, the intermittent characteristics of new energy require suitable energy storage facilities to balance the difference between supply and demand, and there is still a problem of insufficient energy storage capacity in some regions. The lack of effective energy storage means will lead to the waste of new energy power or the inability to meet the demand of peak hours. Reliance on conventional coal- or gas-fired power plants may remain necessary during the transition to greater use of new energy sources. This may lead to a new power system that still relies on high-carbon energy sources until clean energy is built, increasing the overall carbon emissions of the power system.
- (5)
Flexibility factor
Flexibility represents the dynamic adjustment ability of a new power system to cope with load fluctuations. Flexible resources include power side, load side, transmission grid, energy storage system, and so on. Power climb rate refers to the rate at which a generator can climb from low power to high power in a certain period of time. If the power climb rate is too high, the system may struggle to cope with sudden load increase. Landslide rate refers to the rate at which a generator drops from high power to low power in a certain period of time. When the power supply landslide rate is too high, the system may struggle to rapidly reduce the power generation when faced with load reduction, resulting in excess power being released into the grid, resulting in voltage instability, frequency fluctuation, and other problems. Net load fluctuation refers to the change degree of the load of the power system in a certain period of time. New load access rate refers to the access ratio of new load in the power system. The increase in net load volatility and unreasonable changes in the new load access rate may lead to difficulties in energy consumption and trigger voltage and frequency fluctuations.
2.3. Index System
After studying the comprehensive evaluation index system of the new power system, researchers at home and abroad have formed phased results. The research in [
13] uses a dynamic programming method to realize annual optimal control, and analyzes the effects of different pricing schemes, energy storage system capacity, and unit capacity cost on system efficiency. The research in [
14] evaluated and studied the static voltage stability of an AC-DC hybrid power grid, formed an index system, and verified its rationality under different application scenarios. The research in [
15] evaluated energy supply capacity with reliability constraints for microgrids containing multiple energy sources, and formed a set of accurate evaluation systems.
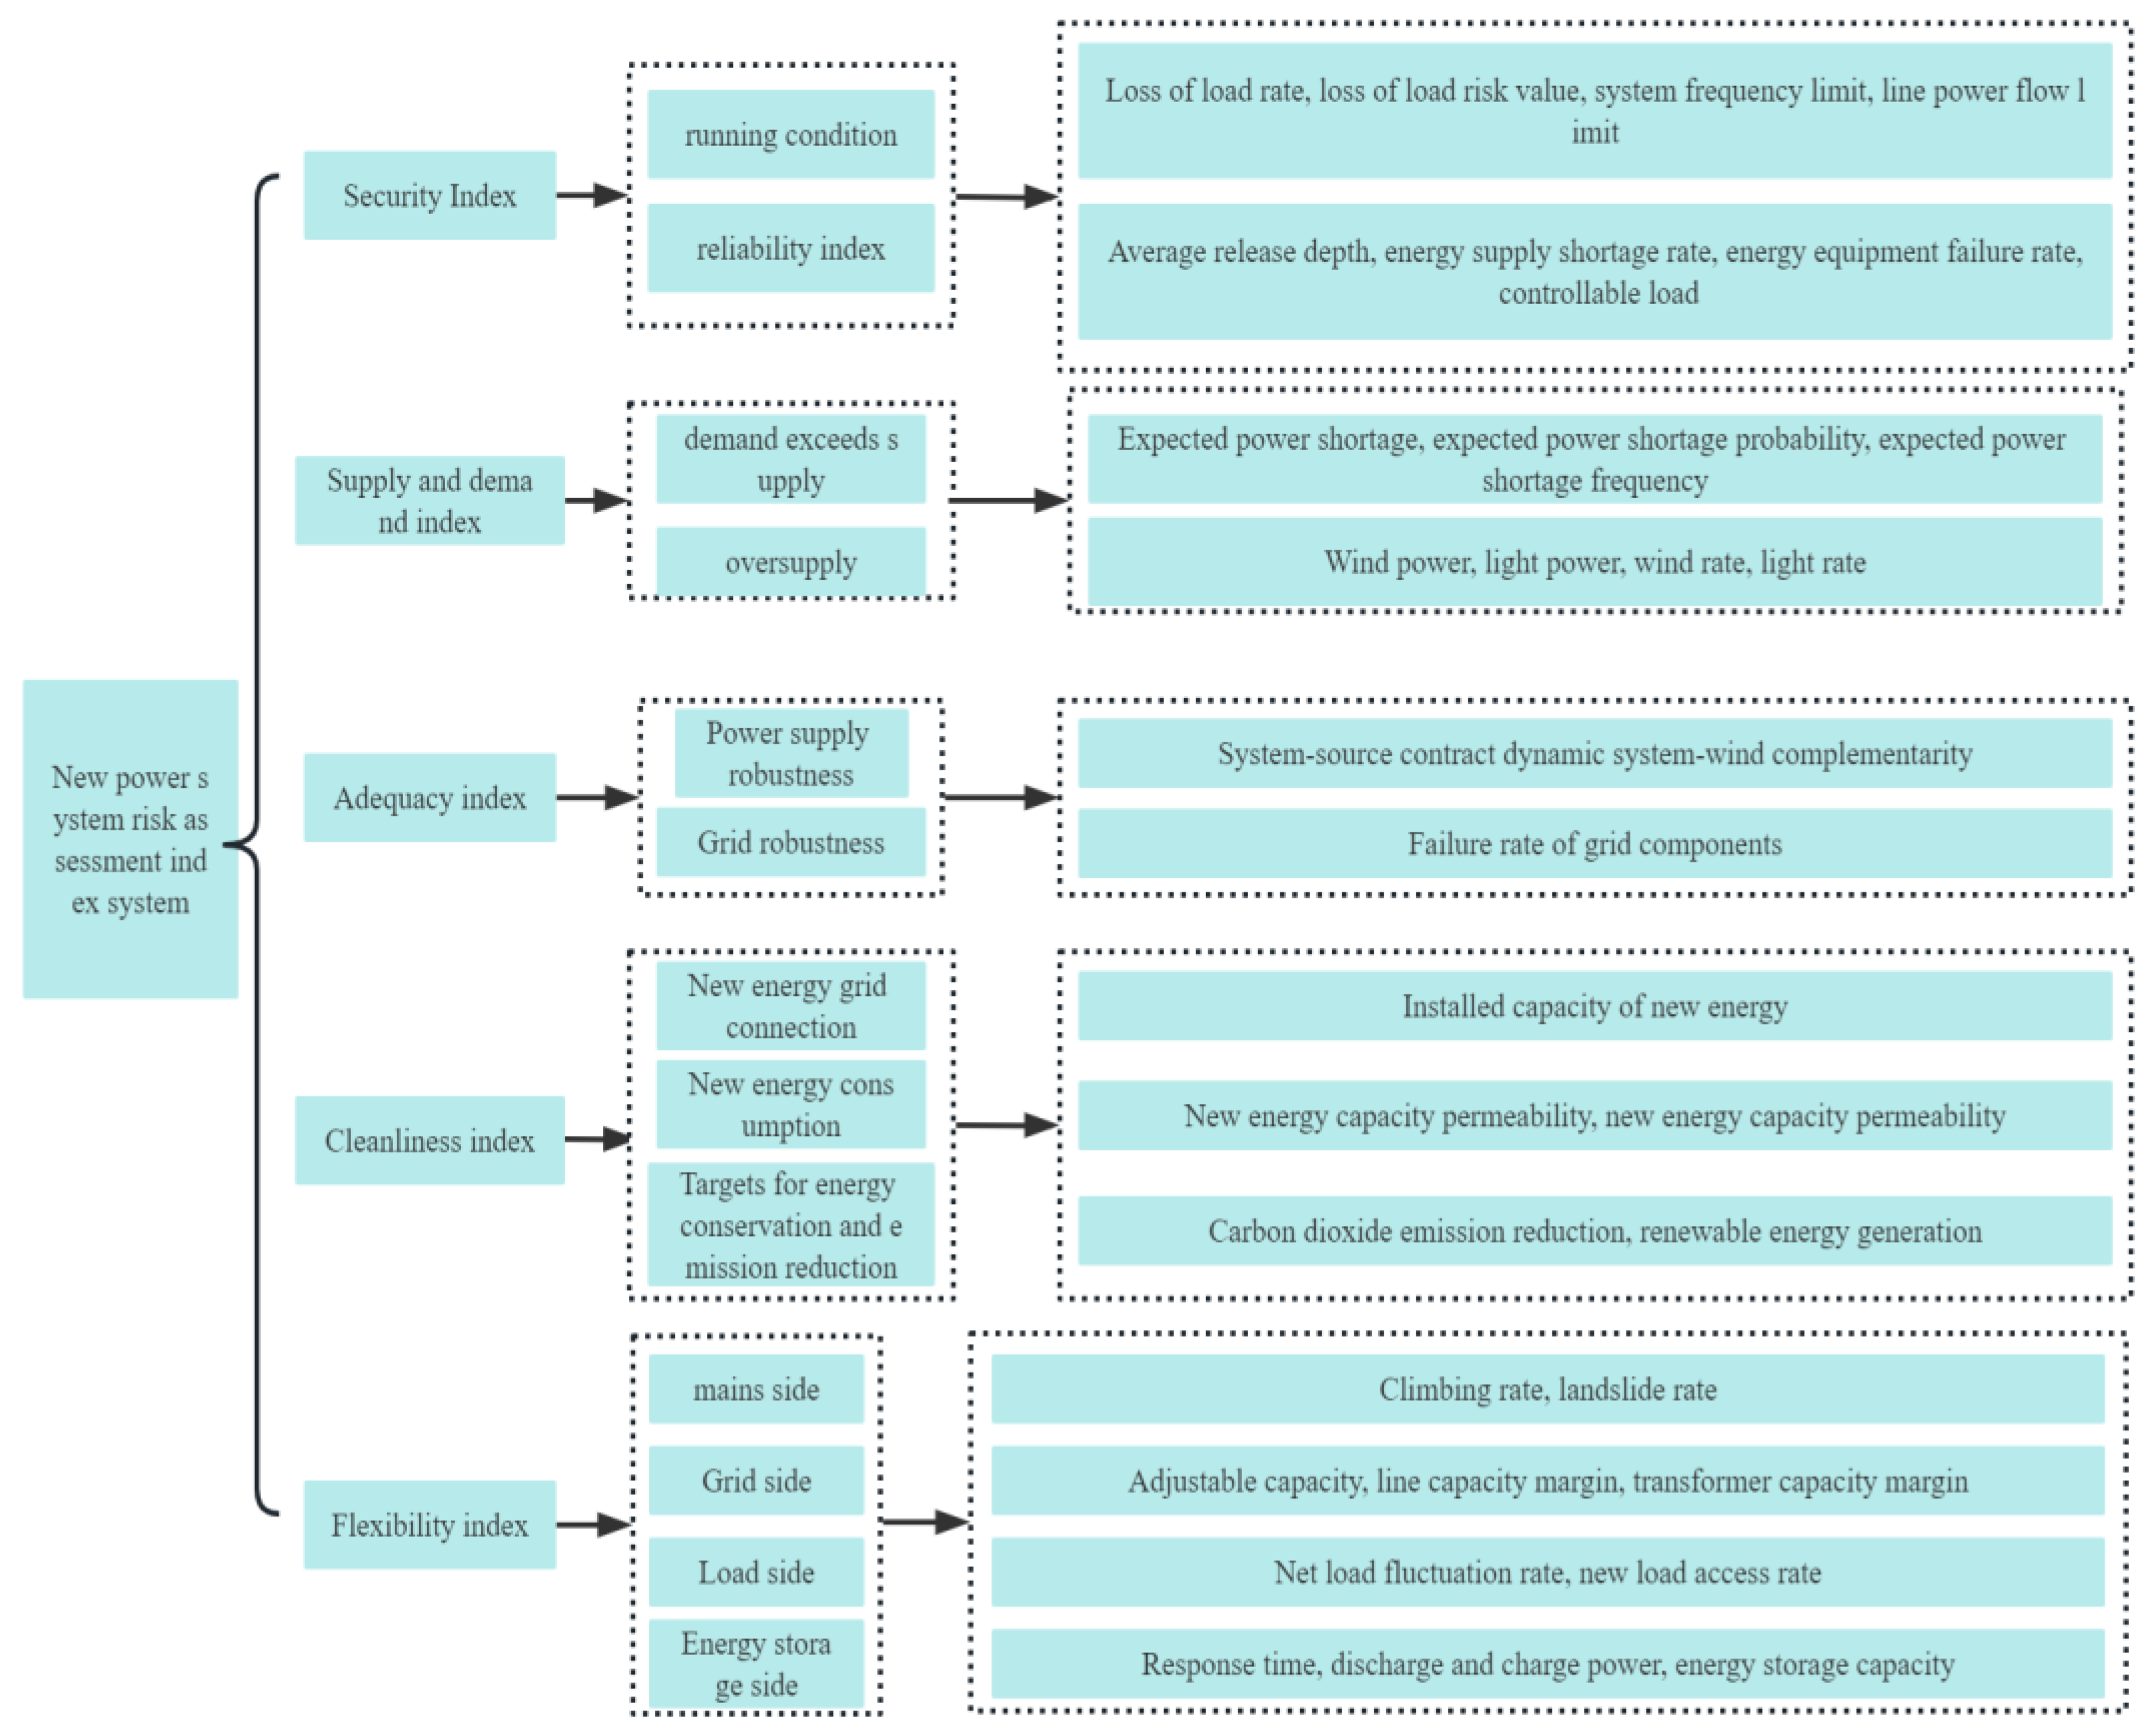
The above literature shows that the current domestic and foreign evaluation systems are generally considered from the two aspects of safety and flexibility, while ignoring the impact of environmental benefits, supply and demand balance, and other aspects, and the established comprehensive evaluation system still needs to be improved. Based on the evaluation index system of a large power grid and the influencing factors of the new power system, this paper establishes the risk assessment index system of the new power system from five aspects: security, supply and demand, sufficiency, cleanliness, and flexibility. The specific content is shown in
Figure 1 below.
2.4. Weight Determination Method
This paper uses the combination weighting method of entropy weight and CRITIC to determine the weight. The entropy weight method is an objective weighting method. In essence, entropy is a measure of the instability of the system state. When evaluating the index, entropy values range from 0 to 1. When the entropy value is the maximum value of 1, it indicates that the value of the evaluated object on a certain indicator is exactly the same, which means that the indicator does not provide any useful information to the decision maker, so the entropy weight is 0. On the contrary, when the entropy value is relatively small, the value of the evaluated object in a certain index has a large difference, so the decision maker should pay more attention to this index, and the entropy weight is large [
16]. The steps of using the entropy weight method to determine the weight of indicators are shown in Formulas (1)–(3):
Formula (1) calculates the occurrence probability of the index, then Formula (2) calculates the output entropy of the JTH index through the probability, and finally the entropy weight of the JTH index is obtained from Formula (3). In Formula (2), , because 0 ≤ ≤ 1, 0 ≤ ≤ 1.
The CRITIC method is also a kind of objective weight, and its basic principle is to determine the objective weight of an indicator based on the discrimination and conflict between evaluation indicators. The evaluation index reflects the discriminative power of the index according to the change in different sample values. The greater the change, the stronger the discriminative power. The correlation between indicators reflects the conflict of evaluation indicators [
17]. In Formula (4),
represents the standard deviation of item
j,
is the correlation coefficient between item
i and item
j, and
represents the comprehensive information amount represented by item
j evaluation index. Through normalization operation, the objective weight
of item
j evaluation index can be obtained from Formula (5).
Finally, the weight of the CRITIC method
and entropy method
are calculated for each three-level index. Finally, the combined weight of item i is calculated according to Formula (6):
2.5. The Analysis of Cloud Model Is Based on Evaluation Model and Solution
2.5.1. Conceptual and Numerical Characteristics of the Cloud Model
Suppose
U is a quantitative region expressed numerically, C is a qualitative concept on
U, and the quantitative value
x∈
U is an arbitrary implementation of C. Then, the certainty of
x to C μ(
x)∈[0, 1] is a random number with a stable tendency, i.e., [
18]
The distribution of x over U is called the cloud, denoted C(x), and each cloud droplet is a random implementation of x.
The overall characteristics of qualitative concepts in cloud models are represented by expected value Ex, entropy En, and superentropy He, which are the overall quantitative expressions of concepts. The cloud model mainly generates cloud droplets according to the characteristics of Ex, En, and He to produce different cloud models.
2.5.2. Cloud Generator
The cloud model needs to be realized by specific algorithms. Forward cloud generator and reverse cloud generator are two major algorithms of the cloud model. The former realizes qualitative concept quantification and the latter realizes quantitative data qualitativeness, and the evaluation of evaluation objectives is completed through these two algorithms [
18].
- (1)
Forward cloud generator
The conversion of qualitative concepts to quantitative values mainly relies on the three digital characteristics of the cloud model to generate quantitative values through Ex, En, and He, which is called the forward cloud generator. The main steps of the forward cloud generator are as follows:
Input: digital eigenvalues Ex, En, He, number of cloud drops N;
Output: the certainty of generating N cloud droplets with quantitative values and their corresponding concepts;
- ➀
generates a normal random number Ex, ~N(En, He, 2);
- ➁
generates a normal random number x, ~N(Ex, En, 2);
- ➂
Compute ;
- ➃
Repeat steps ➀~➂ until N droplets are generated.
- (2)
Reverse cloud generator
The reverse cloud generator is exactly the opposite of the forward cloud generator; it converts quantitative data into a qualitative language represented by three digital features, En, Ex, and He. The reverse cloud generator can be expressed as follows:
Input: Sample point .
Output: Numerical features reflecting qualitative concepts En, Ex, He.
- ➀
calculates according to this group of data of the sample mean , a first-order sample absolute center distance , sample variance ;
- ➁
computes the expectation ;
- ➂
computes the entropy ;
- ➃
calculates the superentropy .
In this paper, the reverse cloud generator is used to convert the sample data into cloud language, namely, the three parameters of the cloud model Ex, En, and He, so as to facilitate the subsequent comprehensive evaluation of the cloud model. The more sample data given, the smaller the error.
2.5.3. Integrated Cloud Computing
- (1)
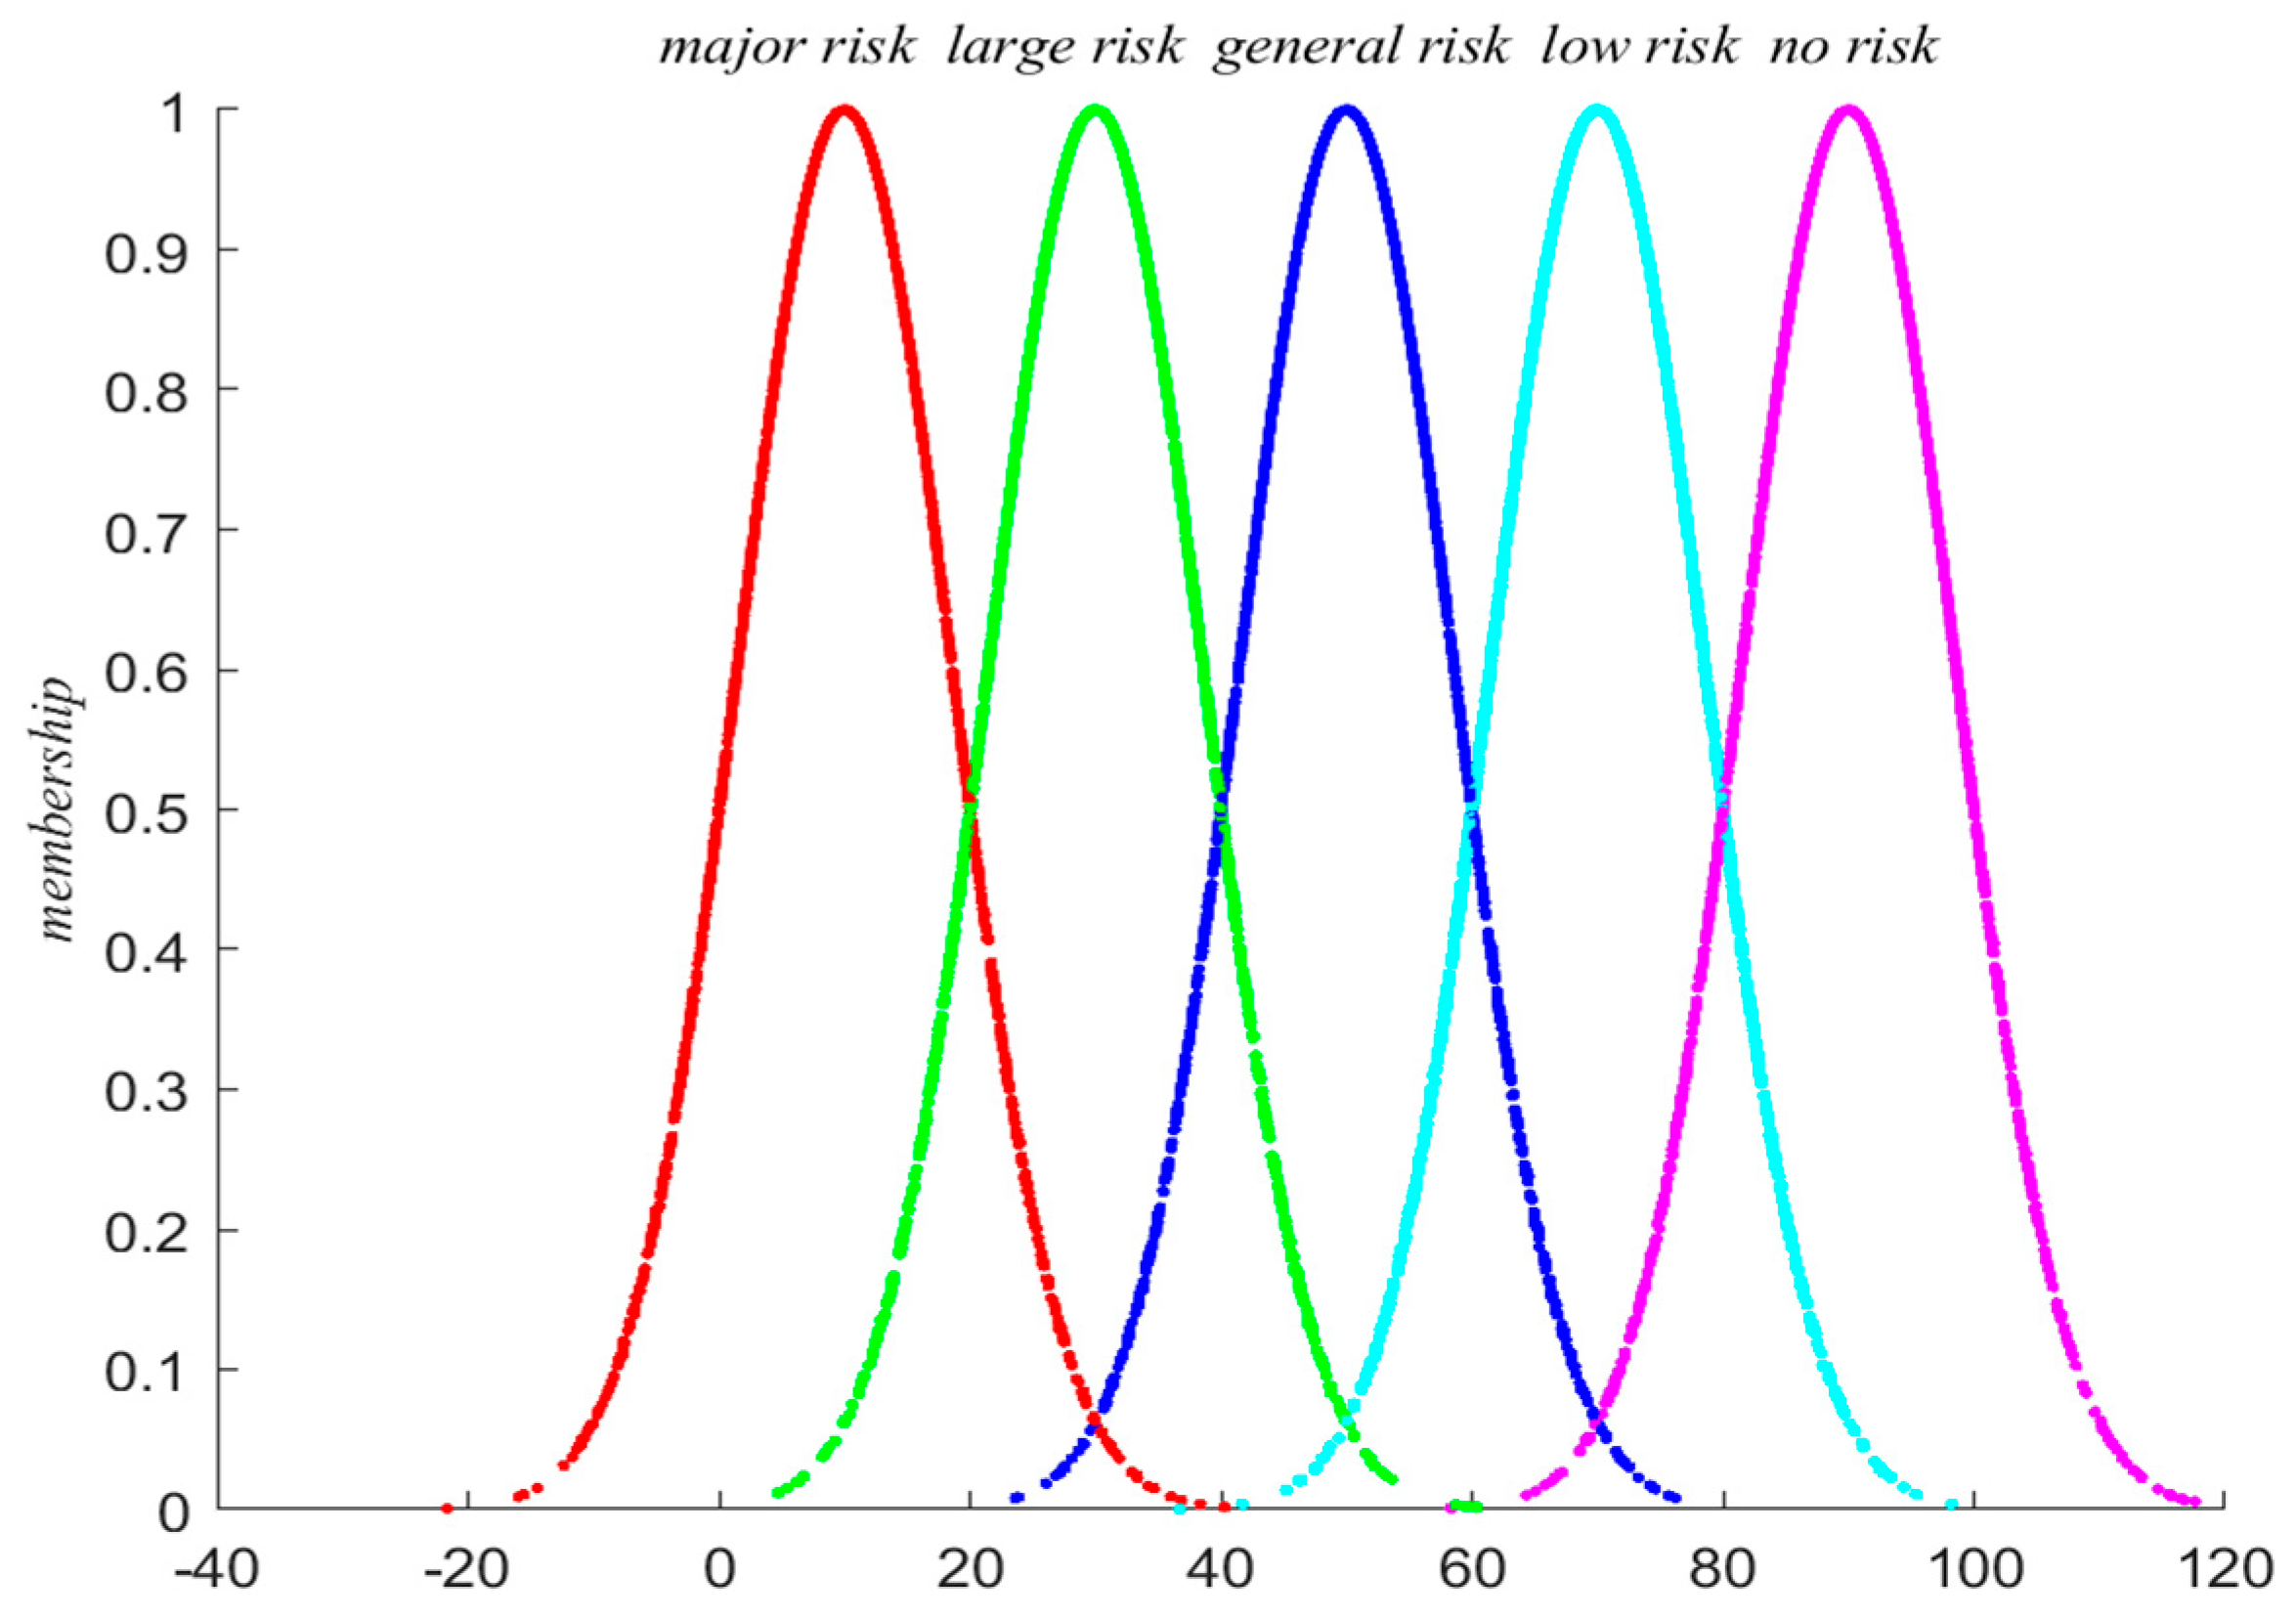
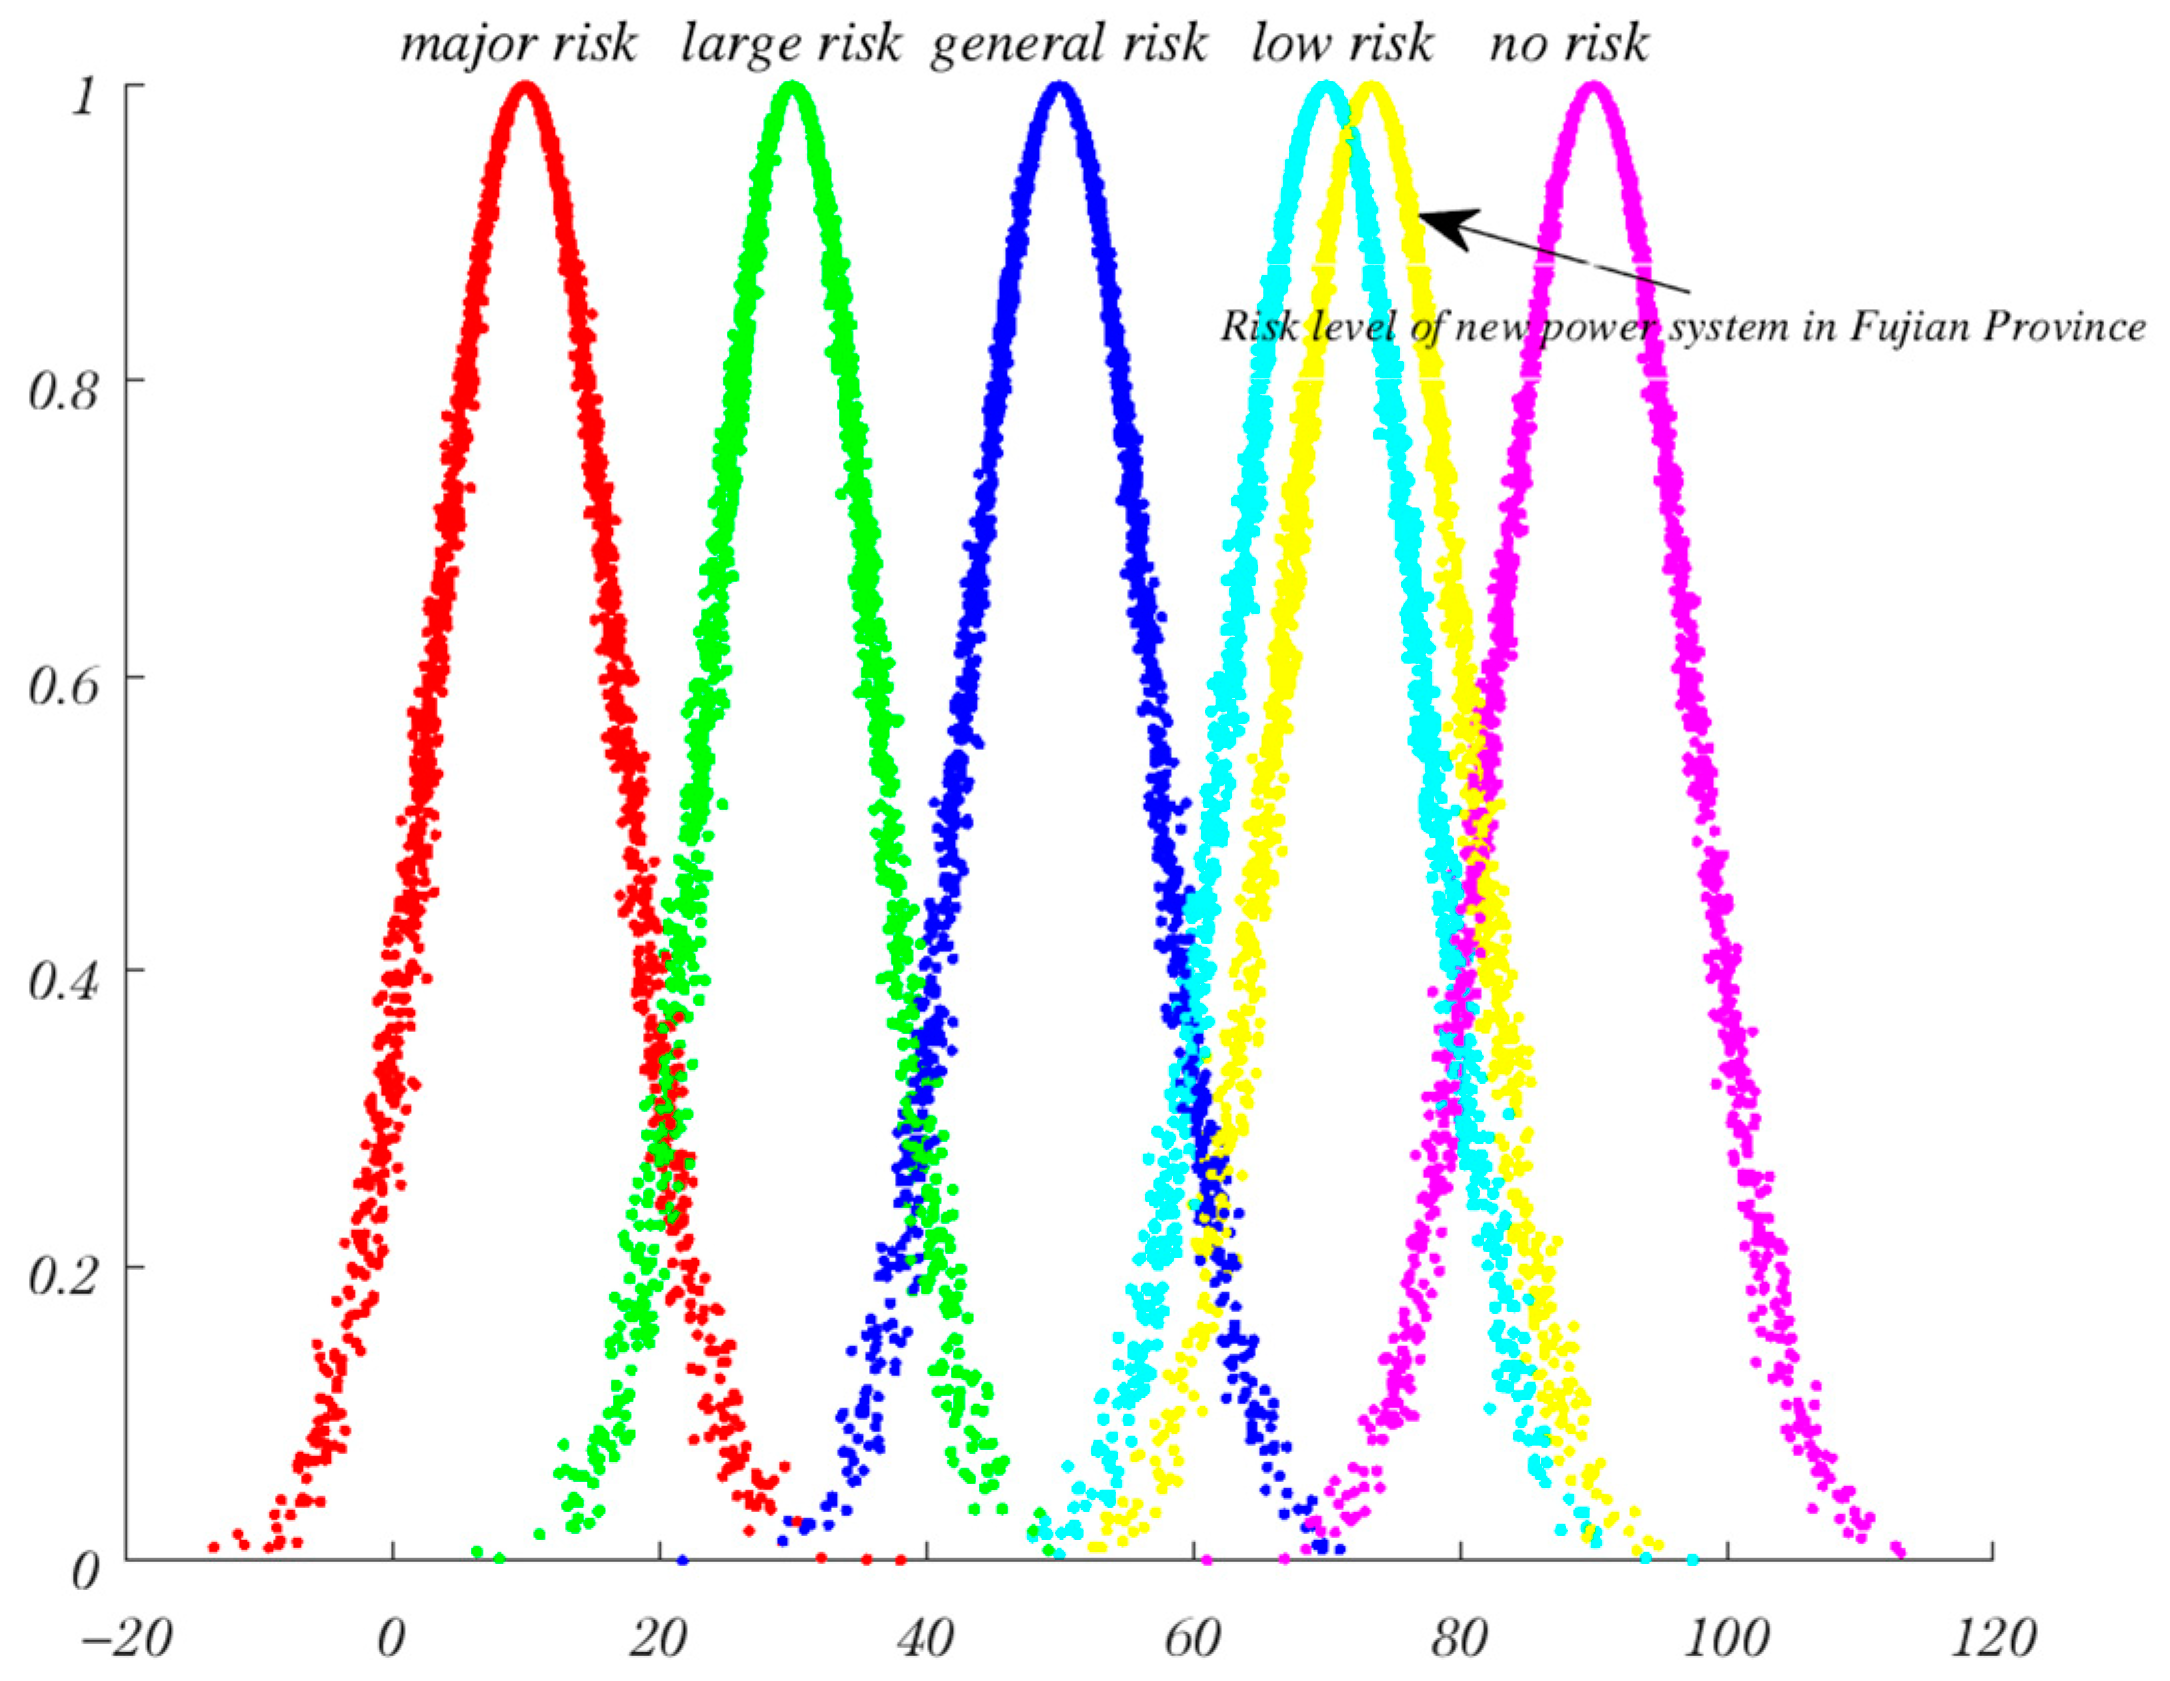
Evaluate the cloud model representation of the description language. Risk assessment rating refers to the quantitative or qualitative evaluation of risks through the use of scientific and rational methods, and the classification of the rating based on the evaluation results. The purpose of the five-level risk classification is to better identify and assess risks, prioritize risk control, and adopt effective risk management measures. Therefore, according to the characteristics of the new power system and the grading standards of previous research studies, this paper uses the five-level method [
19] to classify the research objects into “major risk”, “large risk”, “general risk”, “low risk”, and “no risk”, and the corresponding value ranges are [0, 20), [20, 40), [40, 60), [60, 80), [80, 100). The calculation formula of the evaluation level expressed by the three parameters of the cloud model is
where
are the maximum and minimum values of each evaluation interval, and k is a constant, generally ranging from 0.001 to 0.1. In this paper, k is taken to be 0.03 based on the degree of ambiguity of the rubric itself and the value of hyperentropy taken in the literature [
20].
According to the above formula, the cloud model representation of the rating can be calculated, as shown in
Table 1.
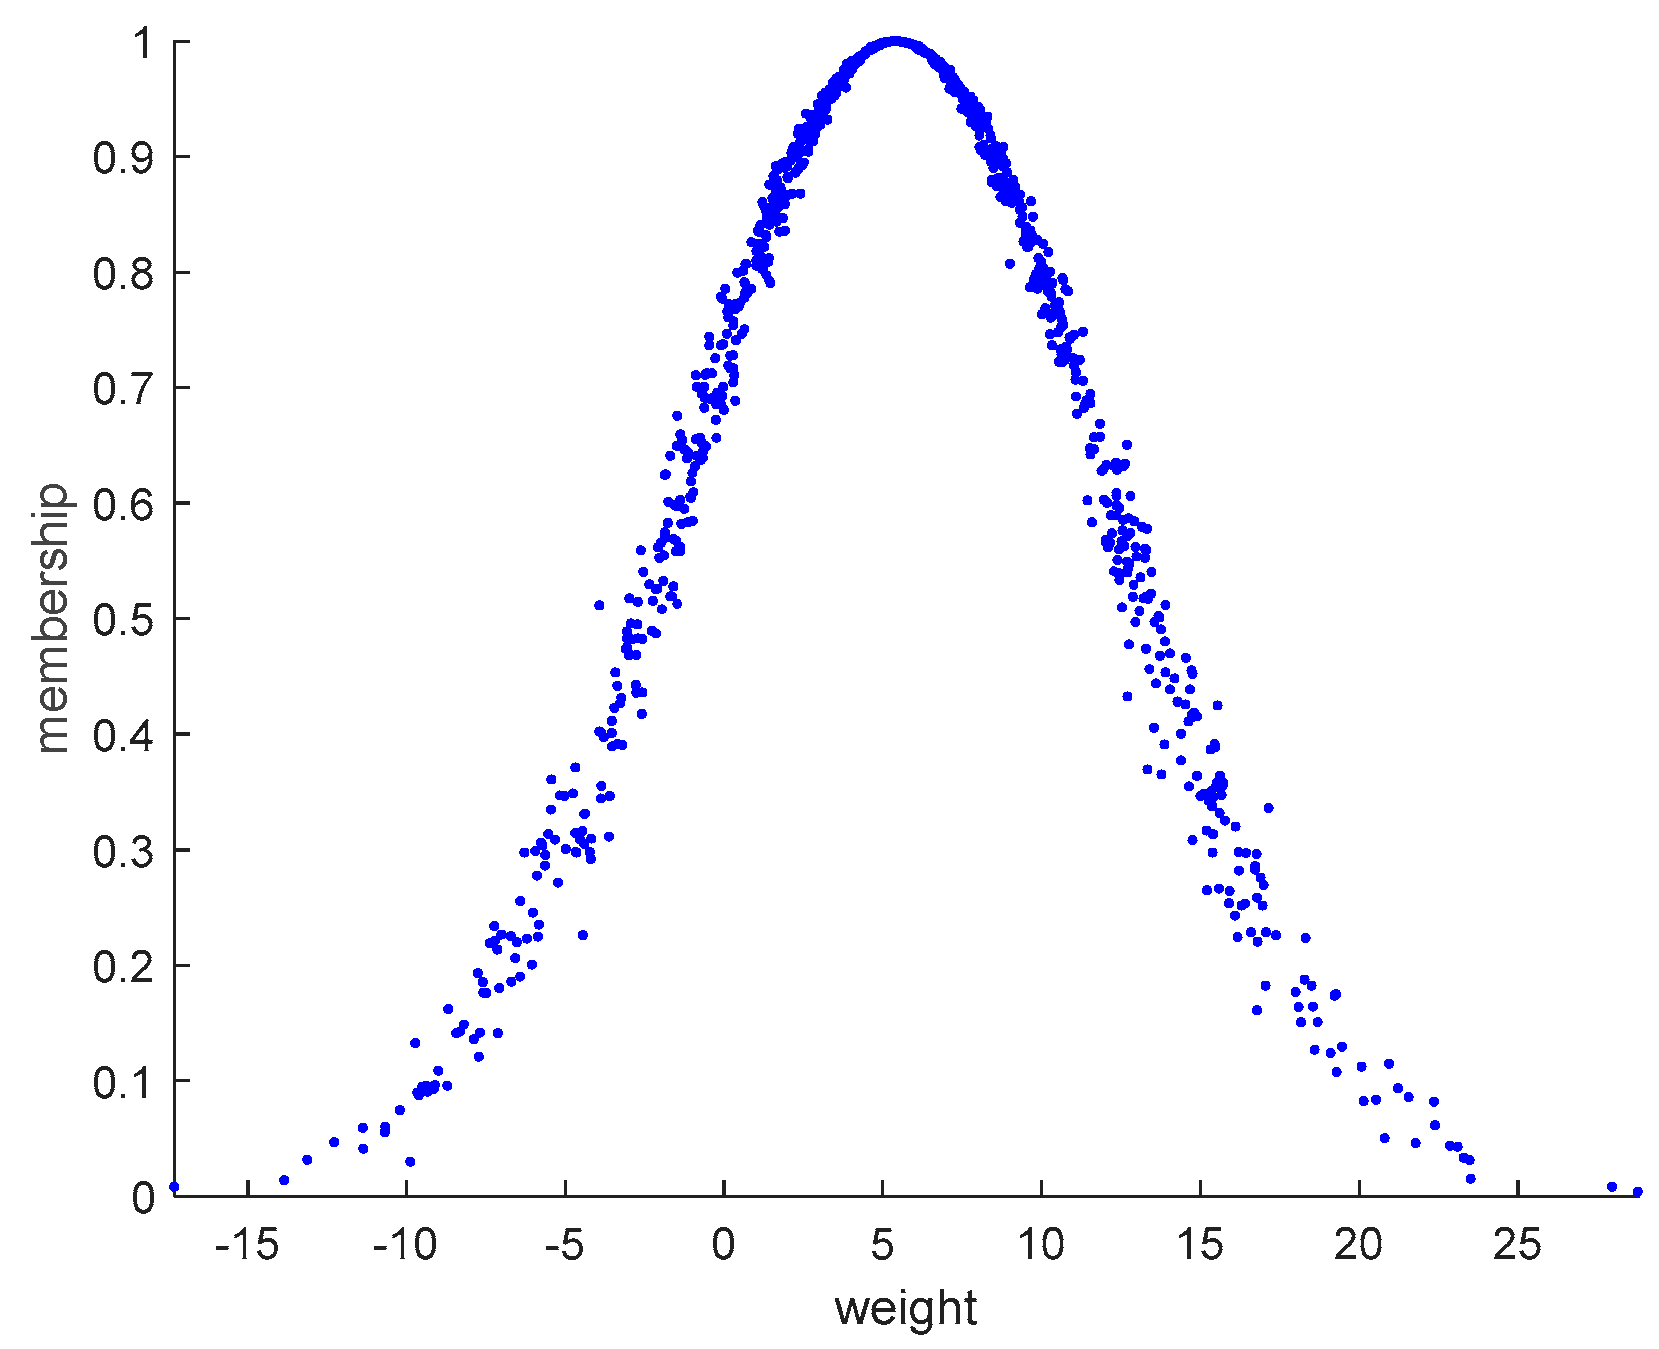
According to Formulas (7)–(9), the evaluation interval is converted into the digital features of the cloud model, namely the three parameters of the cloud model, Ex, En, and He. Then, the forward cloud generator algorithm is used to generate the cloud map of the evaluation level, as shown in
Figure 2.
- (2)
Integrated cloud computing
When calculating the cloud parameters of the target layer, it is necessary to calculate the cloud parameters of the criterion layer index first. The cloud parameters of the criterion layer index are calculated based on the index layer cloud parameters. When calculating the comprehensive cloud, it is necessary to calculate the cloud parameters of the index layer first, and then calculate the corresponding cloud parameters layer by layer according to the calculation formula, which is as follows:
Among them, λ represents the weight corresponding to the evaluation cloud for each level of indicators.
According to the above formula, the evaluation result of the secondary index can be calculated, and then the evaluation information of the secondary index can be integrated into cloud computing to obtain the final evaluation result. According to the final evaluation result, the cloud graph can be generated by using the forward cloud generator and compared with the evaluation grade cloud graph, the position of the graph in the coordinate axis can be obtained, and the evaluation grade of the evaluation project can be known.
3. Case Study
This chapter will take the relevant data of the new power system in Fujian Province from 2020 to 2022 as the research object to verify the rationality of the risk assessment of the new power system based on the cloud model.
3.1. Sources of Evaluation Data Acquisition
According to the operation status of the new power system in the southeast of China, the risk assessment index system is used to make a comprehensive evaluation, and Fujian Province is selected as a concrete example. The original data of the power system collected in Fujian Province in the past three years are mainly obtained from Fujian Statistical Yearbook, and some indicators are also consulted from China Statistical Yearbook. The processing method of partial missing data mainly adopts the moving average method, assisted by the mean replacement method. For the 33 three-level indicators of the new power system risk assessment index system, through the reference of relevant data, a total of ninety original data points from 2020 to 2022 are collected, including nine missing data, seven processed by the moving average method, and two processed by the mean replacement method, and a total of 99 data points are obtained.
3.2. Determination of Indicator Weights
It can be seen from the above that the risk assessment indicators of the new power system are based on the five first-level indicators of safety, supply and demand, sufficiency, cleanliness, and flexibility, and expand to thirteen s-level indicators and thirty-three third-level indicators. Among them, loss of load rate W
1, loss of load risk value W
2, system frequency excess limit W
3, line power flow excess limit W
4, average release depth W
5, energy supply shortage rate W
6, energy equipment failure rate W
7, expected power shortage W
9, expected power shortage probability W
10, expected power shortage frequency W
11, wind abandonment power W
12, abandoned light power W
13, wind abandonment rate W
14, abandoned 18 indicators of light rate W
15, system landscape complementarity W
17, grid component failure rate W
18, net load fluctuation rate W
29, and response time W
31 are negative indicators. Controllable load W
8, system source load synchronization W
16, new energy installed capacity W
19, new energy power permeability W
20, new energy capacity permeability W
21, carbon dioxide emission reduction W
22, renewable energy power generation W
23, climb rate W
24, landslide rate W
25, adjustable capacity W
26, line capacity margin W
27, transformer capacity margin W
28, the new load access rate W
30, discharge and charge power W
32, and energy storage capacity W
33 are positive indicators. According to Formulas (1)–(6) in
Section 2, the weight results of each index of the new power system data in Fujian Province in the last three years are calculated as shown in
Table 2 below.
As can be seen from
Table 2, the weight difference of the five major indicators of risk assessment of the new power system is not large; the difference between the lowest and the highest value is 0.1878. Among them, the index weights of flexibility and supply and demand are the first and second, respectively, indicating that the flexible adjustment ability of the new power system to cope with load fluctuations is the primary factor in risk assessment, which is consistent with the inherent randomness, volatility, and intermittent nature of new energy generation in the new power system and the characteristics of integration into the grid through power electronic devices. The weight of the supply and demand index is significant with the mismatch of supply and demand in the current new power system, and it is also consistent with the problem of coexistence of efficient consumption and energy security. The weight of sufficiency is the lowest, indicating that in the current new power system risk, the role of sufficiency is not very obvious.
3.3. Index Layer Cloud Parameter Calculation
The collected data of the new power system in Fujian Province are used to calculate the cloud parameters of each three-level index by using the reverse cloud generator (specifically, see
Section 2.5 above). The specific values are shown in
Table 3.
3.4. Criteria of Stratocloud Parameter Calculation
The cloud parameters of the third-level indicators have been calculated. From the cloud parameters of the third-level indicators, the cloud parameters of the second-level indicators can be obtained. According to Formula (10), the comprehensive cloud parameters of the second-level indicators can be obtained.
- (1)
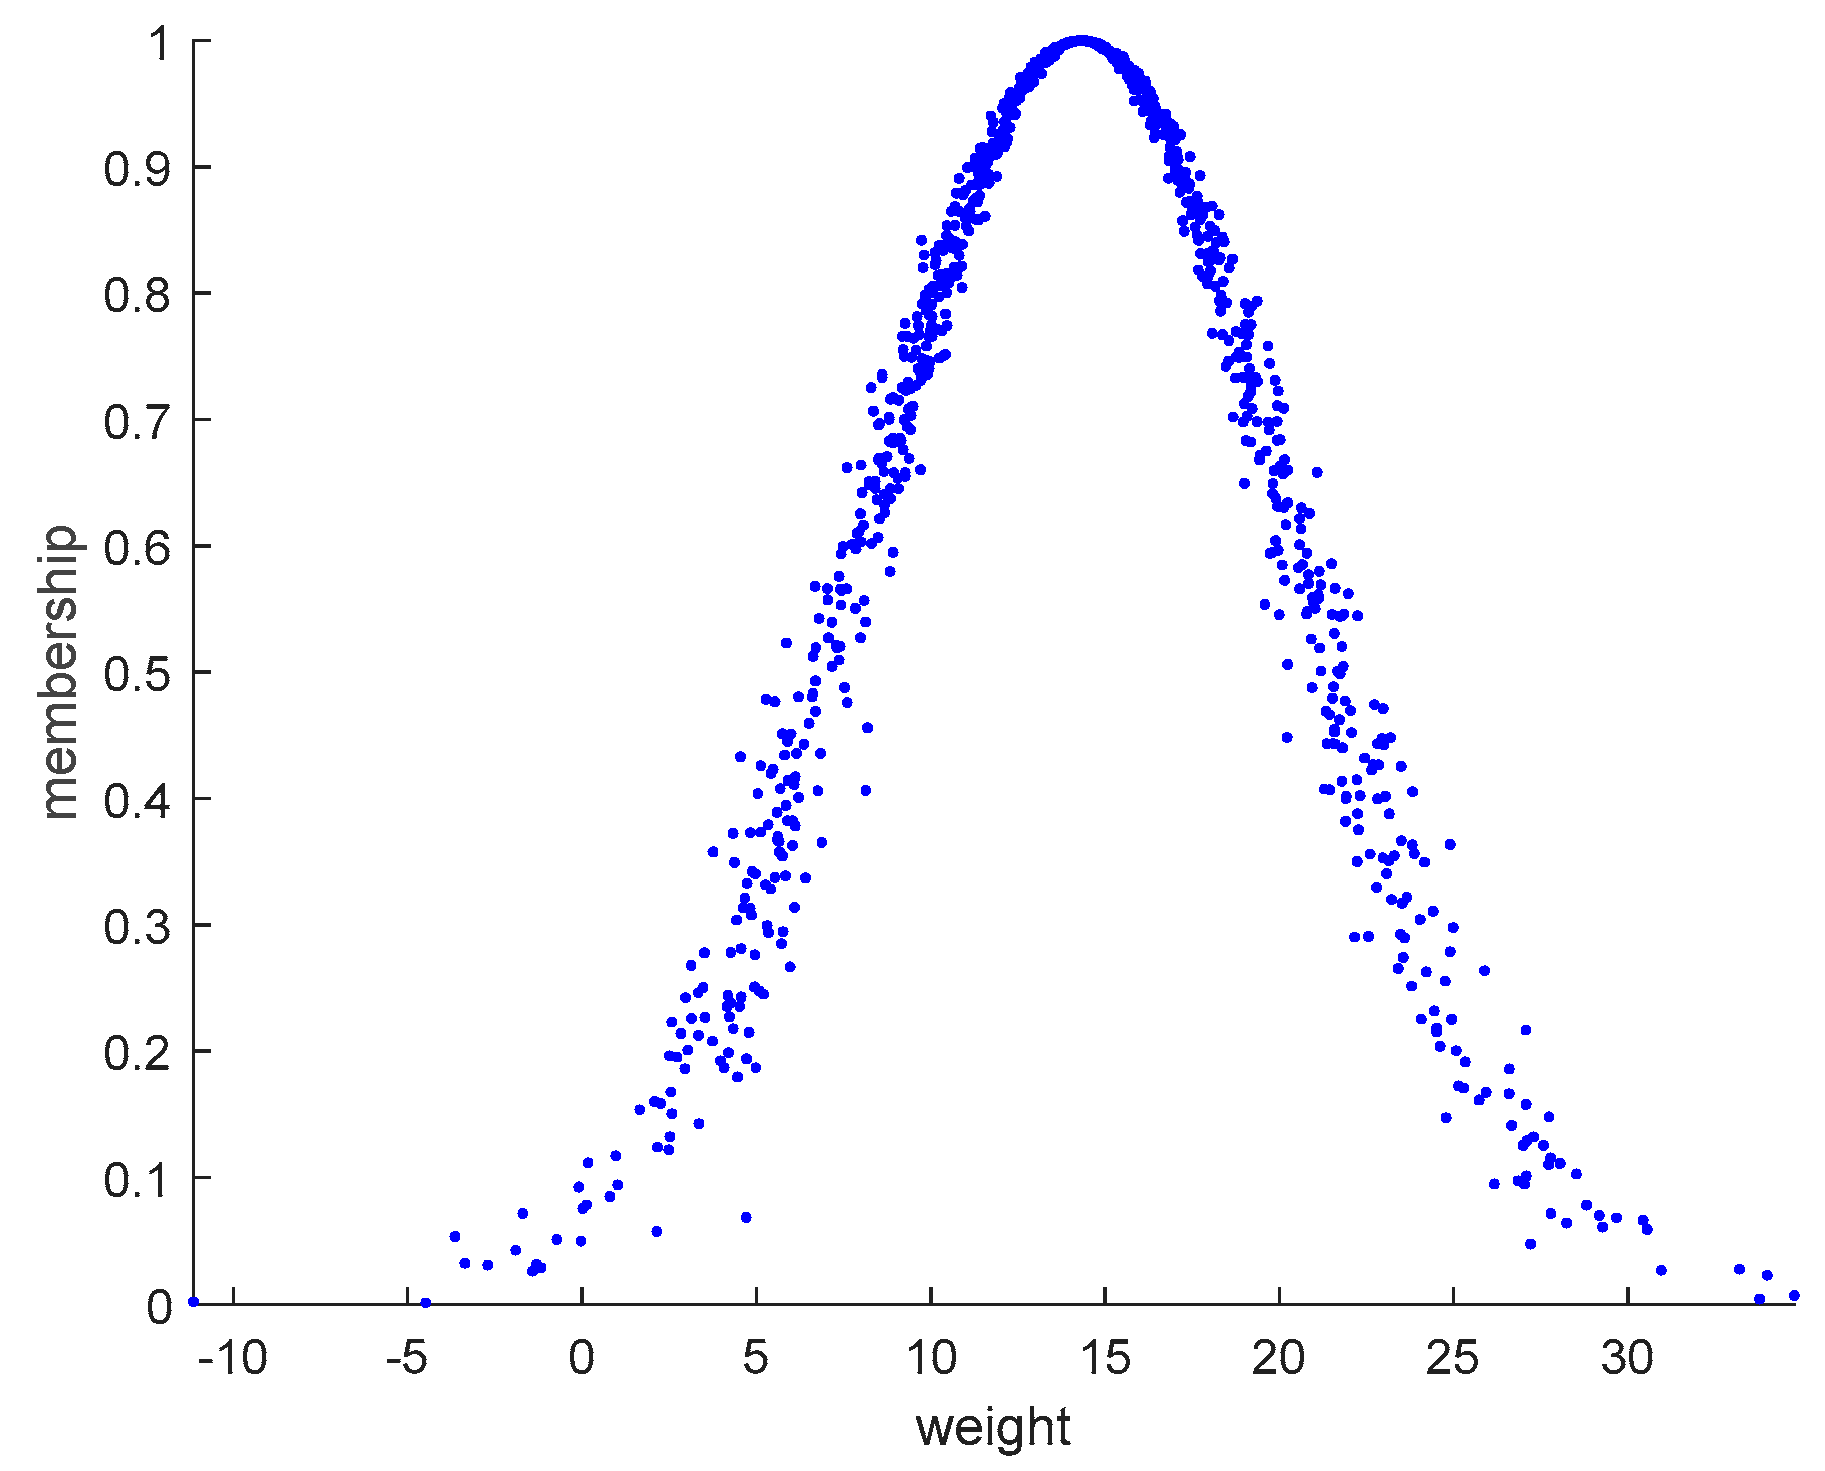
Security indicators
As shown in
Table 4, the expected value of the safety index is 14.184, the entropy is 6.7905, and the overentropy is 0.5014. The large superentropy indicates that the cloud droplet has large dispersion and large membership randomness. In addition, it can be seen from
Figure 3 that the cloud droplets in the security index cloud graph are relatively concentrated and the left and right boundaries are wide, indicating that different indicators have different degrees of influence on the security of the power system under certain circumstances, indicating that the new power system has large randomness and volatility. The high excess entropy of energy supply shortage rate under the criterion layer indicates that the supply of new energy should be ensured and the safety level of the whole system should be improved during the operation of the new power system.
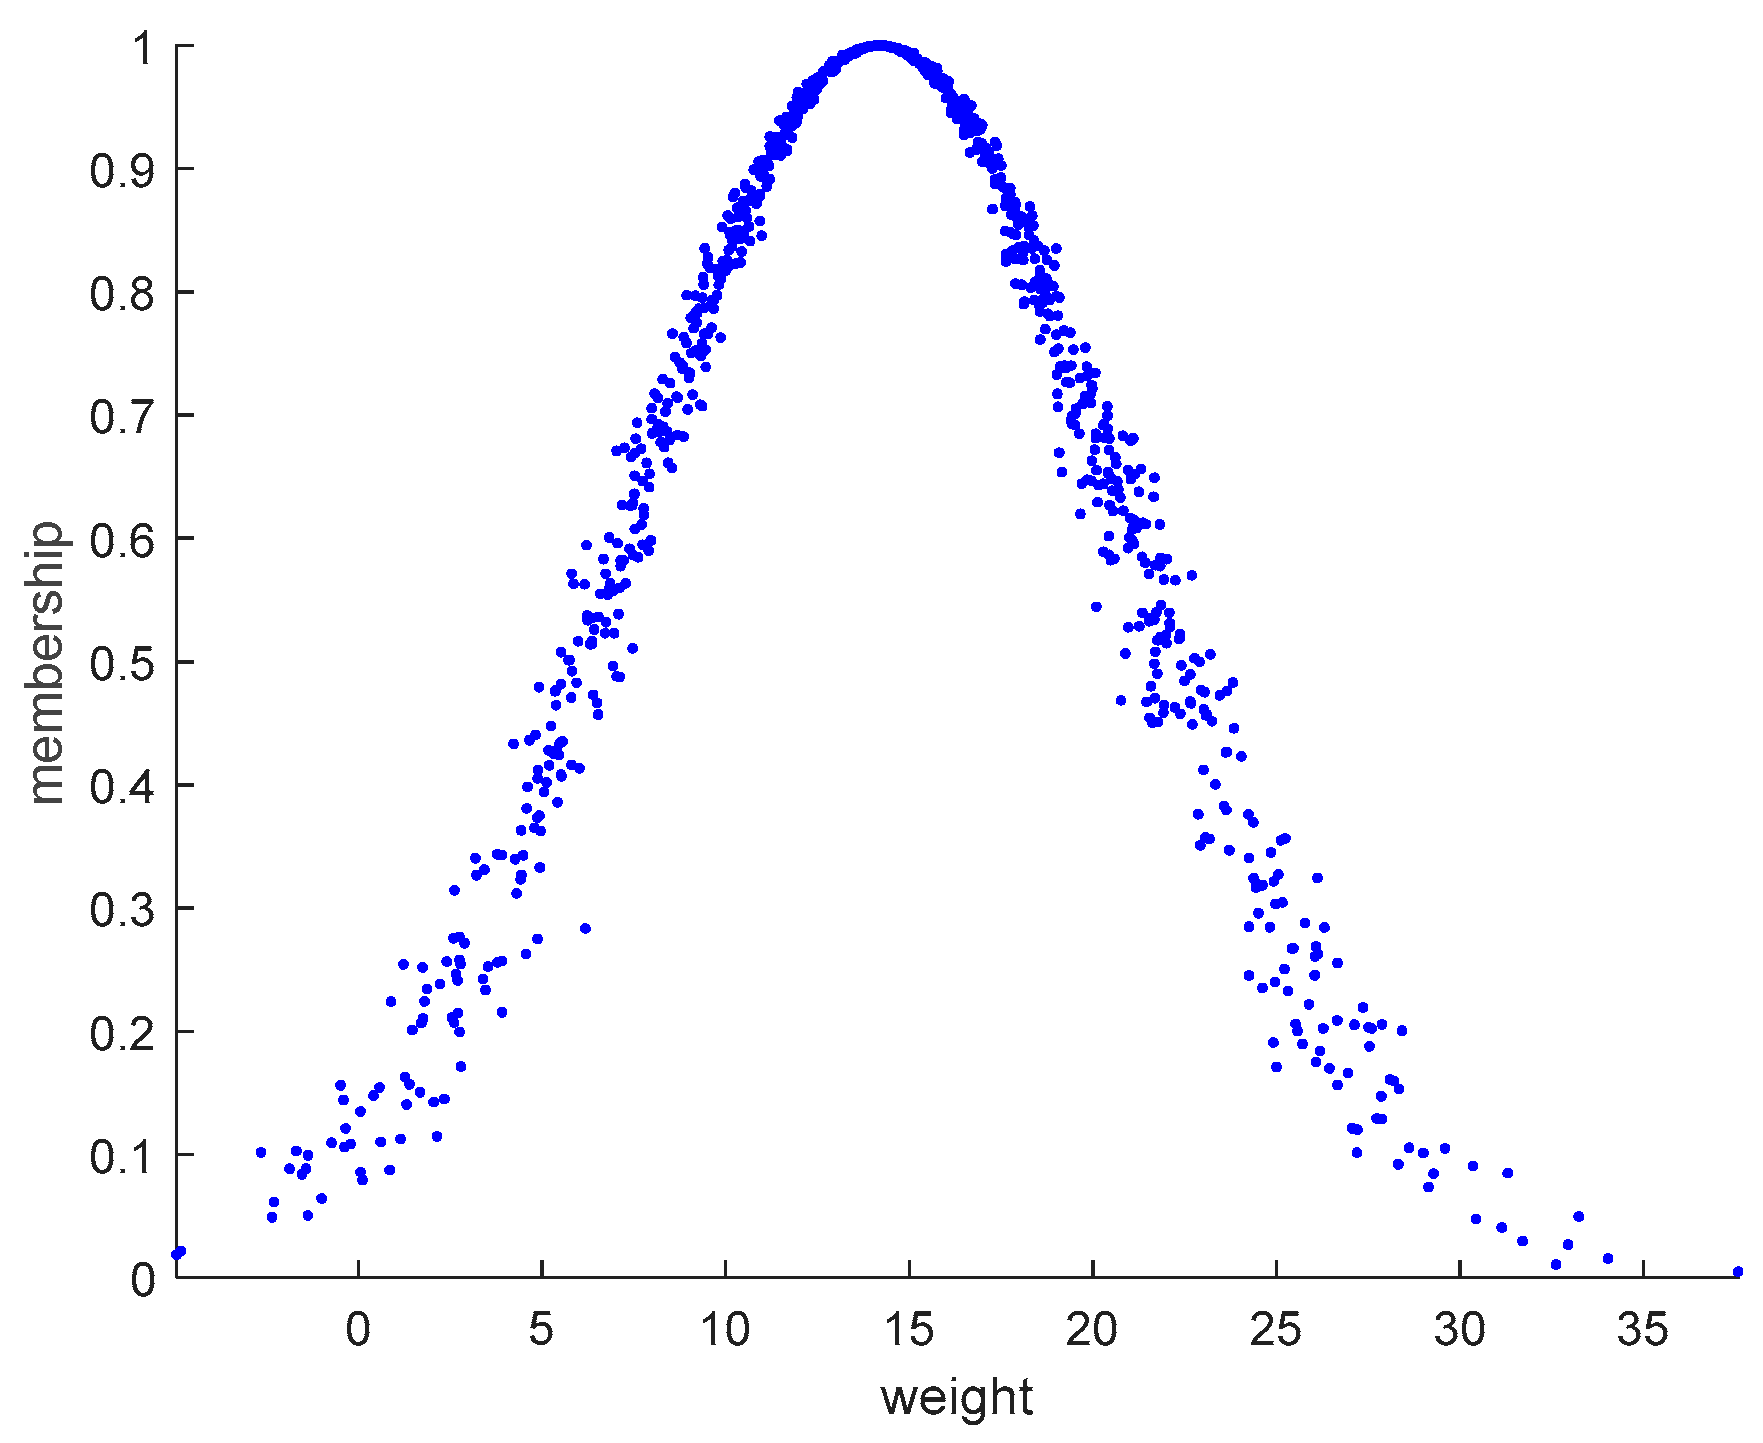
- (2)
Supply and demand indicators
As shown in
Table 4, the expected value of the supply and demand index is 14.3183, the entropy is 6.1598, and the overentropy is 0.5366. The maximum superentropy indicates that the dispersion of cloud droplets is also large, and the “thickness” of the cloud is also large. It can also be seen from
Figure 4 that cloud droplets in the supply and demand index cloud graph are relatively concentrated, but scattered at the left and right boundaries. It shows that the evaluation criteria of supply and demand index are wide and fuzzy. Under this index, the overentropy of controllable load is the largest, and the expected power shortage may lead to system interruption and imbalance of power supply and demand. Therefore, maintaining the balance of supply and demand is an important factor to maintain the stability of the new power system.
- (3)
Adequacy index
As shown in
Table 4, the expected value of the adequacy index is 5.3997, the entropy is 6.8016, and the overentropy is 0.4307. The smaller superentropy indicates that the dispersion of cloud droplets is smaller and the randomness of membership is also smaller. The expected value of the three indexes under this index is relatively balanced, indicating that the washing–silting index is relatively stable, and the overentropy of the system source load synchronization index is slightly higher, indicating that the synchronous movement of the power supply and the load should be maintained, that is, the capacity of the power supply and the demand of the load can be relatively coordinated. Source–charge synchronization helps to ensure a balance between the power supply and the load, so that the power generation in the system can meet the actual demand.
- (4)
Cleanliness index
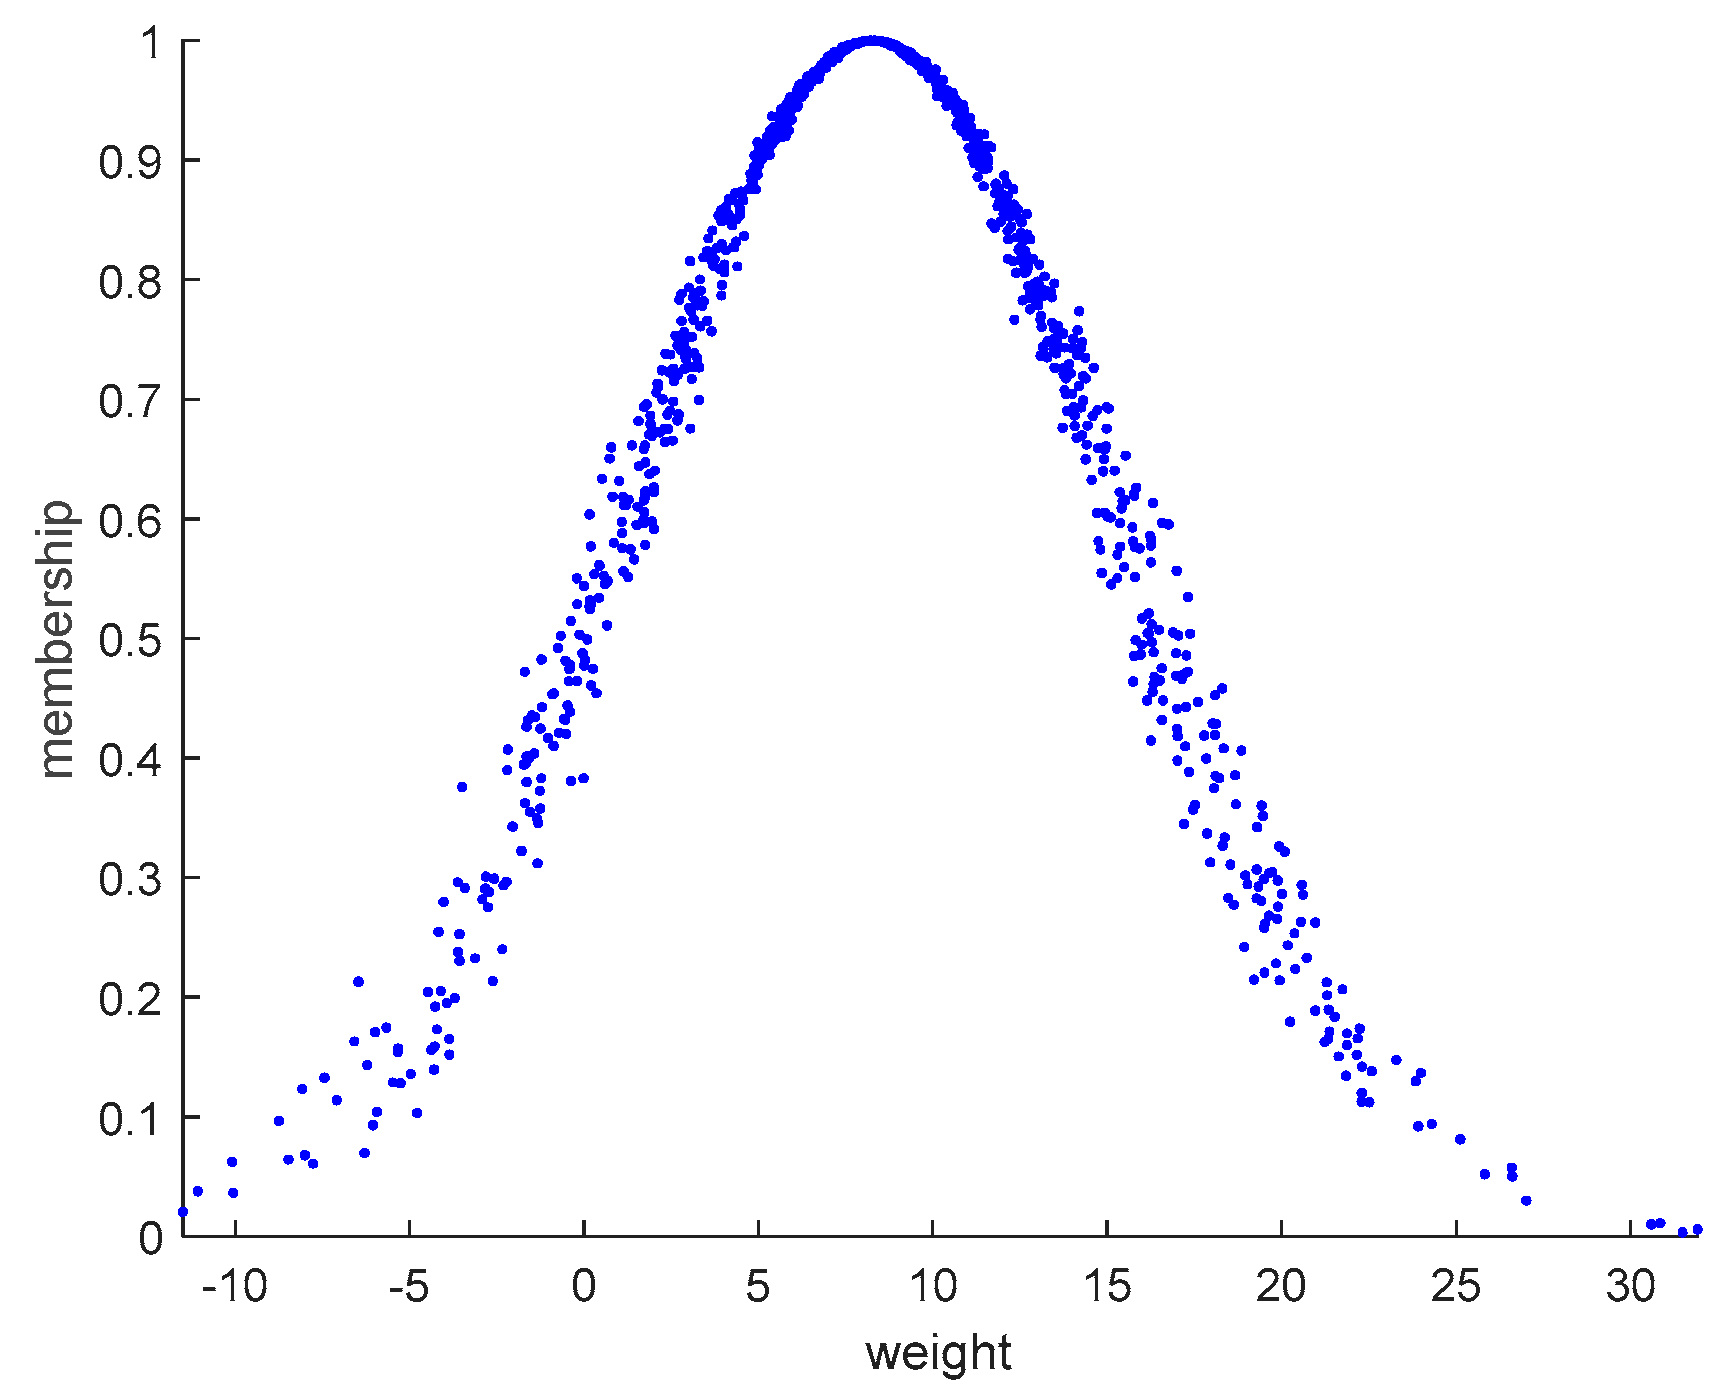
As shown in
Table 4, the expected value of the cleanliness index is 8.2723, the entropy is 7.0386, and the overentropy is 0.4687, indicating that the randomness of this index is small. In addition, it can be seen from
Figure 6 that the cloud droplets of the cleanliness index cloud graph are relatively concentrated, only some values are scattered, and the range of evaluation scores is concentrated. However, the expected value of renewable energy generation in the third index under this index is low, just reaching the general level, indicating the instability and intermittent nature of renewable new energy. Therefore, in order to prevent the increase in renewable energy instability in the new power system, more complex scheduling and management are needed to ensure the balance of supply and demand.
- (5)
Flexibility index
As shown in
Table 4, the expected value of the flexibility index is 16.9183, the entropy is 7.1942, and the overentropy is 0.4203. The minimum superentropy indicates that the randomness of the index is small and more stable. It can be seen from
Figure 7 that the cloud droplets in the flexibility index cloud graph are the most concentrated, indicating that the establishment of flexibility index, selection of standards, and establishment of levels are relatively unified. Among the three indexes under this index, the expected value of transformer capacity margin and net load fluctuation is low, indicating that there are risks in the flexibility of the grid side and the load side of the new power system. The landslide rate index has the highest overentropy. If the landslide rate of the power supply is too high, excess power may be released into the power grid, causing voltage instability, frequency fluctuations, and other problems, and reducing the flexibility of the system. Therefore, more attention should be paid to the power side of the new power system.
3.5. Target Stratus Parameter Calculation
All the cloud parameters of the criterion layer index have been calculated, and the cloud parameters of the target layer index can be calculated according to Formula (10).
The comprehensive evaluation data obtained in
Table 5 is input into the forward cloud generator to obtain the cloud map of the new power system risk comprehensive evaluation, as shown in
Figure 8.
According to the comprehensive cloud map, comparing the comprehensive cloud map of the risk of the new power system in Fujian province with the evaluation grade standard cloud, it can be seen that the risk level of the new power system in Fujian province is between “low risk” and “no risk”, which is closer to the evaluation cloud of “low risk”. Therefore, the final level of the risk evaluation of the power system in Fujian province is “low risk”. It shows that there are still some problems in some aspects of the power system of the province, but through the overall evaluation, we can see that the risk level of the power system of the province has basically reached the required effect and level, so it is considered that the new power system risk assessment is more successful.
4. Discussions
- (1)
Establishment of index system
For the research on the comprehensive evaluation index system of the new power system, domestic and foreign researchers have formed phased results. The research in [
13] used a dynamic programming method to achieve annual optimal control, and analyzed the effects of different pricing schemes, energy storage system capacity, and unit capacity cost on system efficiency. The research in [
14] evaluated and studied the static voltage stability of an AC-DC hybrid power grid, formed an index system, and verified its rationality under different application scenarios. The research in [
15] evaluated energy supply capacity with reliability constraints for microgrids containing multiple energy sources and formed a set of accurate evaluation systems.
The above literature shows that the current domestic and foreign evaluation systems are generally considered from the two aspects of safety and flexibility, while ignoring the impact of environmental benefits, supply and demand balance, and other aspects, and the established comprehensive evaluation system still needs to be improved. Based on the evaluation index system of the large power grid and the influencing factors of the new power system, this paper establishes the risk assessment index system of the new power system from five aspects: security, supply and demand, sufficiency, cleanliness, and flexibility.
- (2)
Determination of weight method
After a comparison of the methods, this paper selects the combination weighting method of entropy weight and CRITIC to establish the weight of indicators, and compares it with the methods in [
21,
22], respectively.
The research in [
21] adopted principal component analysis, and the premise of principal component analysis is that the data are suitable for this method. The KMO test and Bartlett sphericity test are usually used. The KMO test is used to check the correlation between variables and takes the value 0–1. The closer the KMO value is to 1, the stronger the correlation between indicator variables is. Generally, if the value is greater than 0.6, principal component analysis can be carried out. The Bartlett sphericity test is used to test whether variables are independent. Usually, when the significance is less than 0.05, it indicates that the criteria are met. The data in this paper were put into SPSS for testing, and the following results were obtained, as shown in
Table 6.
As can be seen from
Table 6, the KMO value of 0.358 < 0.6 means that the research data are not suitable for principal component analysis, and there may be some problems such as too small sample size or non-quantitative data. If the analysis continues, the results may be biased.
The research in [
22] adopted the grey relational degree subjective weighting method, established the weight parent sequence by expert experience score, and selected the maximum value of expert experience score to assign to the reference sequence. The difference between expert experience weight parent sequence and reference sequence was analyzed to determine the degree of correlation. However, after combining this with the content of this paper, it is considered that the establishment of index weights in this paper is not objective. Even if a group of identical parent sequences are selected with different reference sequences or different resolution coefficients, different weight results will be obtained. At the same time, the expert evaluation score is too affected by subjective factors, so it is not suitable to use this method.
To sum up, although the method in [
21] is an objective weighting method, due to the impact of data quality and selected variables, the KMO value will not reach the standard, so the following steps cannot be carried out. The research in [
22], as a subjective weighting method, has relatively low requirements for data, but because it requires expert scores, it is too affected by subjective factors. This paper does not need too many subjective factors for the index system of risk assessment. At the same time, it is difficult to determine the optimal value of some indicators, which makes it difficult to distinguish the importance of indicators, so the grey relational degree method is not suitable for risk assessment. The entropy weight method determines the index weight according to the variation degree of the index value of each index, avoiding the deviation caused by human factors. However, sometimes the weight is determined only by the fluctuation degree of the data, ignoring the actual significance and correlation of the data. However, the CRITIC weight method just makes up for this defect. It mainly analyzes the correlation between indicators, and the data have a certain stability. Therefore, this paper adopts the entropy weight–critic combination weighting method for risk assessment.
- (3)
Determination of evaluation methods
At present, there are various methods of risk assessment which are applied in different fields. In terms of risk assessment in the field of cold chain logistics, the research in [
9] carried out cluster analysis on the risk indicators of cold chain logistics of agricultural products, established an index system according to the clustering results, and calculated the weight of the indicators by using an analytic hierarchy process. In [
12], rough set theory was used to reduce the core risk index, and two machine learning algorithms, support vector machine and neural network, were selected to improve the risk identification accuracy to 95%.
Although the analytic hierarchy process in [
9] is systematic and comprehensive, it is unconvincing, with less quantitative data and more qualitative components. The risk assessment of new power systems does not need too much qualitative color. In addition, there are 33 three-level indicators in this paper. There are too many indicators, too much statistical data, a huge scale of the judgment matrix, and the weight is difficult to determine.
Although the support vector machine method in [
12] has a low error rate and fast classification speed, it is difficult to implement for a large number of data samples and is very sensitive to missing data. The neural network method has strong adaptability, self-adjustment, and optimization, and high fault tolerance. However, the neural network requires a large amount of data and computing resources, and the training time is very long. If the training data are not large, it is prone to overfitting phenomena and poor performance on data.
The cloud model used in this paper can deal with the conversion between qualitative and quantitative, and can be used to deal with some problems and limitations of fuzzy logic and probability statistics in dealing with uncertainty problems. At the same time, it can also be applied to many fields such as natural language processing, data mining, decision analysis, intelligent control, and image processing. Therefore, it can be effectively combined with the new power system risk assessment, and is a comprehensive evaluation method suitable for this paper.


