1. Introduction
Due to the existing paradigm, the transportation industry is facing a critical juncture regarding one of the most pressing issues that humanity needs to tackle. Worries about climate change have been rapidly increasing in recent decades, leading to a major change in the focus of development across all industries. The alarming rate of carbon footprint expansion is a significant indicator of this ongoing trend. Regrettably, society’s emphasis on rapid progress and heightened consumption has resulted in a dearth of energy efficiency. As a result, civilization is already on a perilous trajectory that will have substantial long-term environmental consequences for our development [
1].
In spite of the fact that the transportation industry has been one of the primary contributors to this concern, one of the most effective solutions to this problem is the construction of extensive sustainable public transportation systems in conjunction with the implementation of traffic restrictions. A number of innovative and environmentally friendly transportation alternatives are being presented as viable alternatives to the use of personal vehicles in an effort to increase the use of public transit as a primary mode of transportation. This process is being carried out in order to facilitate the growth of the public transportation systems.
Sustainability in the transportation industry has undoubtedly become a major issue across Europe in light of the current environmental challenges. The European Union has taken a number of actions to solve this problem, such as imposing stricter emission limits and continually updating the fleets of public transportation vehicles [
2]. The BEBs and the FCEBs are two of the most popular solutions for environmentally friendly public transportation in Europe. The way in which these solutions manage and store the energy necessary for propulsion is where they diverge the most from one another [
3,
4].
At the other end of the spectrum, hydrogen is used by the FCEBs, in addition to smaller battery packs, as an energy buffer. Fuel cells use hydrogen as a source of energy to produce the necessary electricity for propulsion. By managing energy delivery and storage using hydrogen, this dual-energy strategy lessens the burden on the battery, thus reducing the rate at which they degrade over time while reducing the total operational costs [
3,
4,
5].
As a result of Europe’s dedication to sustainability in the transportation industry, both the BEBs and the FCEBs have been adopted, with the latter providing a special benefit in reducing battery-related problems (e.g., in cold regions) and enhancing the long-term viability of sustainable bus transportation. These cutting-edge strategies are essential first steps in tackling the pressing environmental issues.
As hydrogen is one of the most effective energy carriers on the market right now, it plays an especially important role in this context. It can be obtained in several ways and used in conjunction with fuel cells to store the energy needed to run long-distance electric motors. Right now, the two most common processes for producing hydrogen are steam reformation of natural gas and electrolysis, with the latter being the more ecologically favorable option [
6].
There is a wide variety of fuel cells available, each with its own advantages and disadvantages. The proton exchange membrane (PEM) fuel cell is the most widely used type of fuel cell, employing an exchange membrane as a solid electrolyte. The PEM fuel cells have the capability to produce a maximum power output of one hundred kilowatts with an efficiency ranging from 40% to 60%. These fuel cells operate within a specific temperature range of 80 to 100 degrees Celsius. Within the mobility sector, these devices are extensively utilized due to their small dimensions, lightweight construction, and rapid initialization period. Nevertheless, the PEM fuel cells are vulnerable to fluctuations in temperature, the level of salt in the water, moisture, and dehydration. Phosphoric acid (PAFC), alkaline (AFC), solid oxide (SOFC), and molten carbonate (MCFC) fuel cell technologies are less frequently utilized in mobility applications due to their extended startup times and higher production and operating expenses [
7,
8,
9].
Considering the technologies used in the FCEBs, as well as the use of hydrogen in propulsion systems, the outlook offers a remarkable energy efficiency perspective as well as a very viable option to reduce emissions. Because of their alteration in the powertrain, the FCEBs are able to go farther than the traditional BEBs. While fuel cells boast zero emissions and impressive range, they have a weakness: they cannot react as quickly as batteries to sudden changes in power demand. To overcome this limitation, fuel cell vehicles often team up with batteries or supercapacitors. This synergy ensures a smooth and responsive driving experience while maintaining the benefits of fuel cells.
The Municipality of Cluj-Napoca is currently investing in an extensive hydrogen production infrastructure, the findings of this study is one of the starting points in the future of fuel cell bus fleet management. By having a perspective regarding the consumption and usage patterns of such vehicles, the hydrogen demand can be estimated, as well as the refueling strategy on the considered route. Furthermore, this study can serve as a basis for expansion, taking into consideration further data sets from different routes, and optimizing the use of such vehicles based on energy efficiency.
2. Materials and Methods
Fuel cell electric buses (FCEBs) have emerged as promising alternatives to regular diesel-powered buses in the pursuit of eco-friendly transportation options. This study examines the operational features of a Fuel Cell Electric Bus (FCEB) when used in a public transportation system, particularly in a highly populated urban area. The main goal is to measure the energy management patterns and overall efficiency of the vehicle by evaluating its hydrogen consumption, distance traveled, and vehicle velocity.
AVL Cruise M (R2021 R2), software developed by AVL List GmbH, was used to simulate and assess the performance of the FCEB accurately. AVL Cruise M is a versatile software tool that can simulate several elements of vehicle operation, such as engine dynamics, energy management, and emissions.
A simulation model of the Solaris Urbino 12 bus was created. Urbino 12 is a multifunctional public transit bus available in both electric and fuel cell variations. The primary objective of this study is to examine the FCEB version, with a specific emphasis on its range and hydrogen consumption.
Before commencing the simulation, it was essential to determine the vehicle’s structural and functional characteristics. The specs were carefully and thoroughly defined and organized in
Table 1, offering a comprehensive summary of the vehicle’s essential characteristics.
The AVL Cruise M simulation was performed using a thorough model and detailed input data. The simulation entailed duplicating authentic driving events, encompassing diverse conditions, patterns of acceleration and deceleration, and stop-and-go scenarios. Through the simulation of these situations, the FCEB’s energy consumption and range were observed under different operating conditions.
The modeling technique involved a sequence of parametrization procedures. The FCEB exhibits a modular design, wherein each functional component is represented by a separate module. To ensure the acquisition of accurate findings, all elements were simulated according to the specifications provided by the manufacturer. The electric model consists of several key components, including a battery pack, a set of 2 ZF AVE 130 hub-mounted electric motors, a consumer module, and a control functions subsystem. In addition to the aforementioned components, the Urbino 12 Fuel Cell model is outfitted with a Ballard HD60 fuel cell.
The battery pack was designed and arranged based on the output power, voltage, and current specifications, with the aim of achieving a high level of precision. The tractive system comprises two electric motors that are designed based on the actual machinery employed by Solaris and produced by ZF. According to ZF [
11], every motor exhibits a maximum power output of 250 kW, operates at a nominal voltage of 650 V, and can sustain a maximum current of 340 A. The control function subsystem encompasses algorithms employed for the regulation of individual motors, with the computational functions responsible for determining the range and performance characteristics of the vehicle.
The functions utilized for the implementation of the test cycle are likewise encompassed inside this subsystem. The fuel cell model incorporates the Ballard HD60 fuel cell together with a specialized mechanism responsible for regulating the energy transfer between the battery and the fuel cell [
12]. The model can be observed in
Figure 1.
The powertrain in the model consists of the essential components mentioned earlier. The fuel cell is responsible for the production of energy through the utilization of hydrogen as fuel. Subsequently, the generated energy is transmitted to the battery pack, which serves the purpose of supplying power to the electric motors [
13]. The model includes various types of links, including a mechanical link that represents the physical connections of the vehicle, such as those found in the powertrain architecture and braking system. The electrical circuit serves a dual purpose: it facilitates the transmission of electrical energy throughout the powertrain while also enabling the communication of information from the management system to all the components. In a real fuel cell vehicle, the system would naturally be split into two separate systems based on voltage level: a high voltage system, which handles voltages above 48 V, and a low voltage system consisting of electronic control units and driver input panels, responsible for data transfer.
The management system includes specific sections designed to govern the behavior of the fuel cell. A key feature of this management system is the capability to program a specific state of charge for the battery. This state triggers the activation of the fuel cell, allowing for the optimization of energy consumption between the two integrated energy buffers in the powertrain [
14]. This management subsystem has the ability to control the overall energy consumption of auxiliary components, including the high-voltage heating system and the air conditioning system.
The running gear subsystem has been accurately modeled based on the dimensions of the actual buses used in the City of Cluj-Napoca, including tire and brake specifications. The data on the final drive ratio has been obtained from technical information provided by the manufacturer.
The outcomes derived from the simulations were produced from authentic data gathered from the operational electric buses within the municipality of Cluj-Napoca. The data obtained from the buses encompasses several factors, including the GPS coordinates of the bus, the velocity of the vehicle, the date and time of the data collection, and additional metrics such as brake lining usage and the total amount of energy charged and discharged.
Precise replication of a bus’s real-life performance necessitates comprehensive information regarding its driving patterns, velocity, and position. The data can be acquired by different methodologies, including the connection of a CANedge 2 device to the OBD (On Board Diagnostics) port of the bus. The device (depicted in
Figure 2), along with a manufacturer-provided adapter, captures available data. There are two methods to carry out the data gathering process: on-site collection using a memory card or utilizing an API (Application Programming Interface) to manage larger amounts of data. The collected data was thoroughly filtered and sorted in order to eliminate any sort of errors.
An important aspect to note is the challenges faced during the data acquisition process. The bus manufacturer has implemented a security key to protect the entire data flow of the bus in compliance with highly stringent data protocols. The CANedge2 device utilized for data acquisition exclusively provided unprocessed, encoded data directly from the controller area network of the bus. To acquire usable data, a lengthy process of data identification needed to be conducted. Via the fleet management platform used by The Cluj-Napoca Public Transport Company (CTP) (Cluj-Napoca, Romania), we were able to execute this intricate procedure. The platform facilitated the elucidation of the parameter identification numbers, allowing us to establish a correlation between the recorded data and their true significance. The collected data encompasses information on energy consumption, GPS coordinates (which can be correlated with the actual route), vehicle velocity (which was utilized to generate the depicted driving cycles in
Figure 3), as well as brake lining deterioration, potential bus powertrain errors, and various yet-to-be-identified parameters.
This entire process was carried out over an extended period of time due to difficulties in establishing the connection between the recorded data and the data provided via the fleet management platform. Once we had discovered the actual correlations, a series of tests were performed in order to confirm that our correlation algorithm was correct. During this process, we have stumbled upon a plethora of errors generated by the data collection device as well as the bus itself. We have also tried to create our own API so that we could remotely access the collected data, which turned out to be quite difficult due to the unstable network connection in certain areas, with local storage of the data becoming the most accessible option.
The study comprised the collection of real-world driving data from Line 47 in the Municipality of Cluj-Napoca, Romania for an entire work week. This method guaranteed the incorporation of nuanced fluctuations in the bus’s usage pattern, enabling a more authentic simulation.
The collected data were thoroughly examined and sorted, and subsequently transferred into AVL Cruise M, a specialized data-driven simulation software tailored for vehicle operation modeling. During this procedure, a total of five driving cycles were created, with each cycle corresponding to a specific workday of the week. The cycles effectively depicted fluctuations in bus utilization, with Monday displaying the highest level of demand and subsequent days showing a declining pattern as other buses also travel the same route.
The next step is the implementation of the raw, collected data as a driving cycle in AVL Cruise M. In order to achieve this, a data extraction stage has been carried out to generate the driving cycles used in this paper. The block used for cycle implementation in AVL Cruise M is called the Driving Cycle and includes consecrated and industry-standard cycles such as WLTP and NEDC. However, the software allows the parametrization of such a cycle using two main metrics: time and vehicle velocity. Five simulation cases were generated, in which the main variable was the actual driving cycle.
One fact worthy of being mentioned is that the model is based on blocks that include specific mathematical equations in order to work together inside the solver architecture. In the presented model, the Fuel Cell has been adopted from a unit created by AVL, and we have intervened in the parametrization process of the block, according to data available online from the manufacturer [
15].
The Fuel Cell Block contains a module for the Stack and a converter. The block responsible for the mathematical modeling of the dependencies and energy efficiency is the Stack block. The mathematical equations contained in the Stack block are briefly presented in the technical manual of the simulation software under section 6.17.19.5. With regard to energy efficiency and fuel consumption, the main mathematical equations used in the generation of the results are to be presented below [
15,
16,
17].
The mass flow of the reacted hydrogen and oxygen can be calculated by
and
where
M(H2) and
M(O2) are the molar masses of hydrogen and oxygen. Using the stoichiometric ratio (
SR), the mass flow of total amount of hydrogen and oxygen fed to the fuel cell is equal to
and
The mass flow of the demanded air fed to the cathode of the fuel cell is equal to
where F is the Faraday constant,
Istack is the stack current,
ncells is the number of cells [
17].
The driving cycles generated, as shown in
Figure 3, illustrate the unique patterns of utilization seen throughout the week. Over the course of a two-way journey between the two ends of the defined transport line, the cycles provide a description of the movement of the vehicle’s velocity in relation to the passage of time. This aspect makes it possible to study the behavior of vehicles as they travel toward the city center, as well as the behavior of vehicles as they travel back to a less densely populated area of the city.
One thing that should be brought up is the fact that the cycles that are depicted might be different depending on the driver’s profile, as well as the temperature outside and the patterns of ridership. Although the results that are presented in this paper have a solid foundation in reality, it is possible that the results that are obtained could be different depending on a number of factors that were discussed earlier.
The meticulous process of collecting data and simulation yields important insights into the operational dynamics of the bus, allowing for the assessment of many factors such as energy usage, route planning, and driver behavior. These simulations are crucial for optimizing bus operations and improving overall efficiency.
The cycles express a series of energy consumption peaks due to the periods of heavy traffic registered in the city of Cluj-Napoca. These peaks correspond to the early morning rush hour, while the population starts daily activities (07:30–08:30). The second peak of energy consumption is registered during the afternoon rush hour, when people return home from work (16:30–17:30). The final rush hour is registered in the evening (21:00–22:00). These peaks are easily observable in the graphs represented in
Figure 3.
The continuous variations of vehicle speed correspond to the successive inputs made by the drivers throughout the day. These inputs are a proper indication of the usage patterns observed in the monitored vehicle. The resulting and generated drive cycles indicate a significant difference in contrast to the industry standard drive cycles used for vehicle testing and homologation. Therefore, a significant difference in vehicle velocity and driver input can be observed.
The cycle on Mondays depicted in
Figure 3a includes many stops, which are a result of the strong demand from passengers and the concomitant requirement for prolonged breaks to charge the vehicles and switch drivers. Throughout the week, the frequency of stops decreases, suggesting a decrease in the number of passengers and an increase in the utilization of alternative buses on the same route. This evolution is depicted in
Figure 3b–e. The usage time of the bus also decreases as the week progresses. This is due to the management strategy of the Cluj-Napoca Public Transport Company, which implies the use of secondary vehicles to take the load off the bus considered for data collection.
3. Results
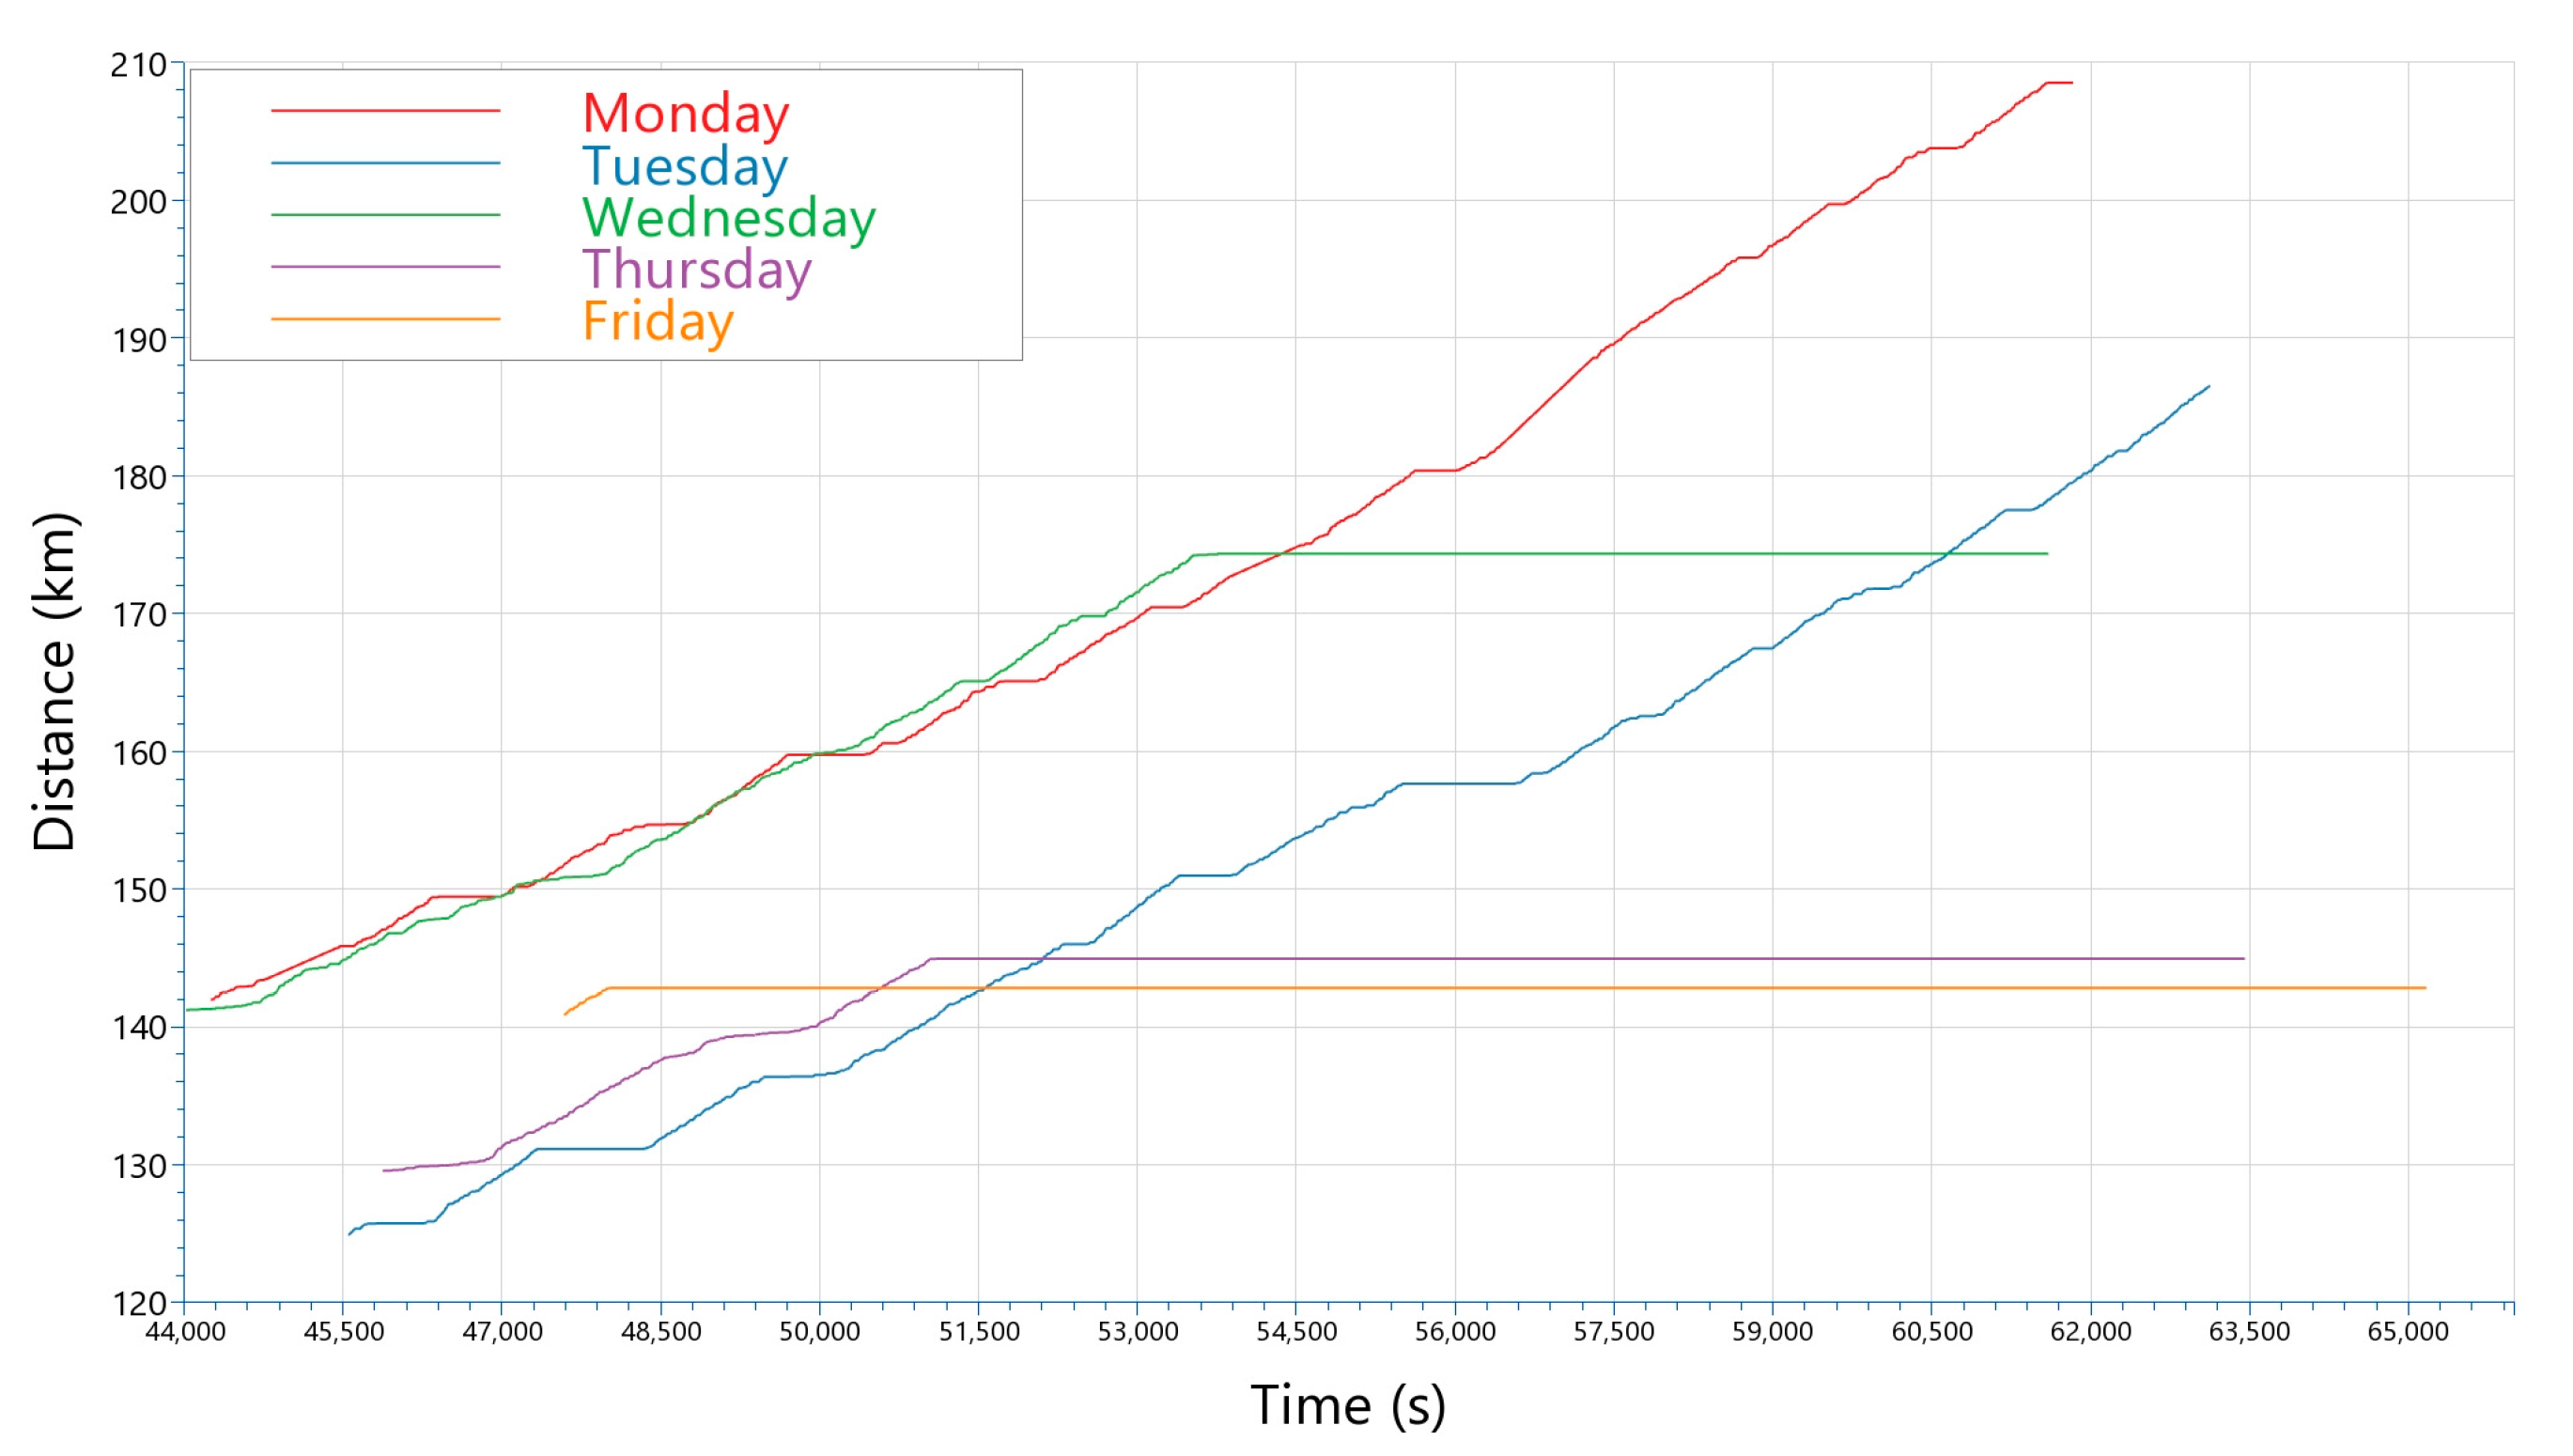
The first analyzed metric is the total distance traveled in each of the modeled cycles. The main indication of the difference between the traveled distances is the usage rate of the bus. During the first day, the bus is subjected to a series of charge–discharge cycles. As the week progresses, the usage rate of the bus reduces, thus causing the traveled distance to decrease. The total driven distance was calculated by the simulation software as well as logged from the bus. The difference between the sources has been less than 2%. The total traveled distance is depicted in
Figure 4. The data can be seen in
Table 2.
The process of logging the data and mapping the data results in a gradual reduction in the total distance traveled, which can be observed after the process is complete. The total distance traveled is 879.6 km, with an average distance traveled of 175.9 km that was actually traveled. On Monday and Tuesday, the progression of this parameter is relatively consistent throughout the day. On the other days, however, most of the vehicle exploitation occurs in the first part of the day, with the route being served by other electric buses that have exploitation cycles that are comparable to the one being employed by this particular vehicle.
The second metric that is analyzed is the velocity of the vehicle, which is captured during the entire process of generating the driving cycles. The variations that were observed are a result of the inputs made by the driver, in addition to being constrained by the traffic conditions in the surrounding area. In the process of generating the drive cycles, the prime hours were the most significant time periods that should be considered. There is information regarding the typical speed of vehicles that can be found in
Table 3.
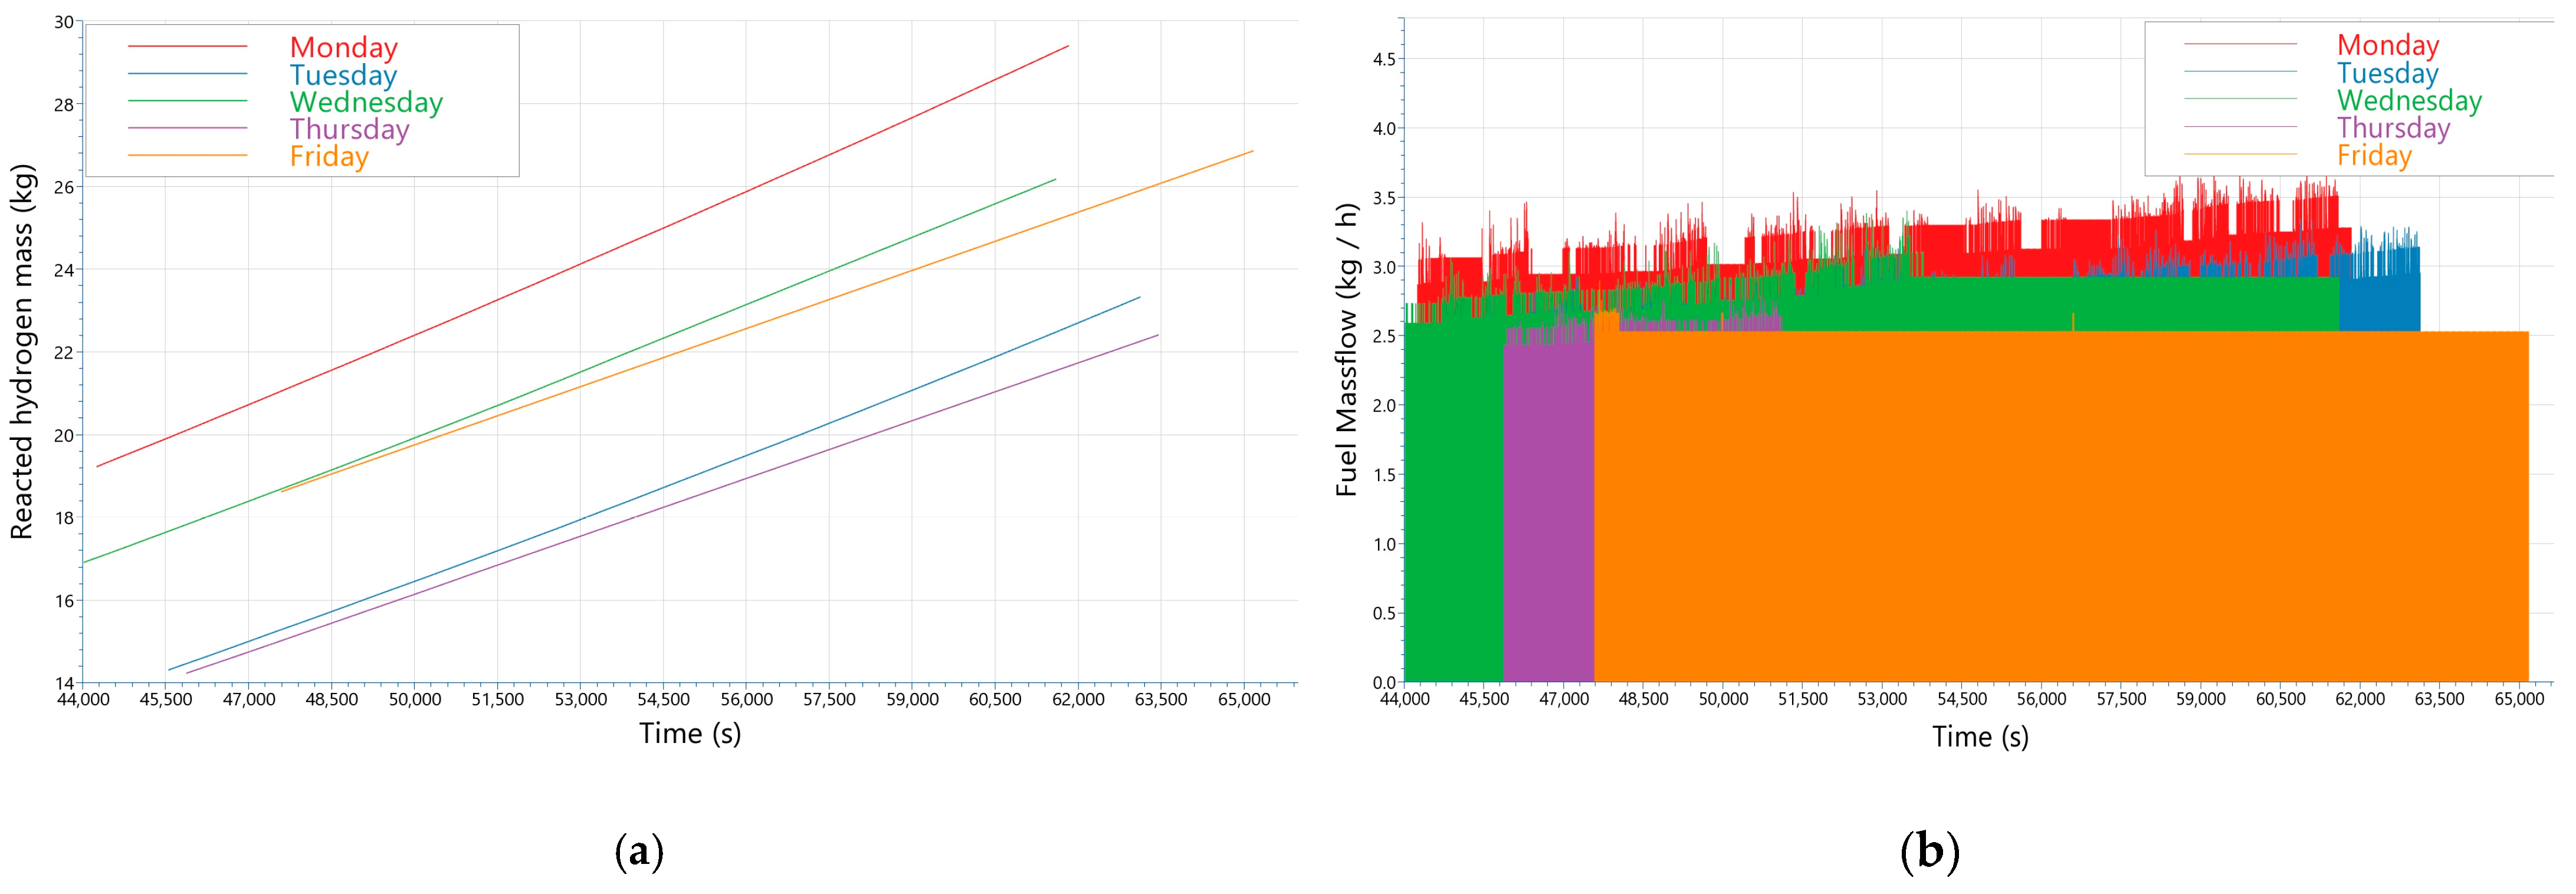
The hydrogen consumption of the bus is the most significant parameter that emerged as a result of the extensive simulations. This metric is demonstrated by the total mass of hydrogen consumed, in addition to the flow of hydrogen mass. It is stated by the manufacturer that the maximum range of the bus would be up to 350 km if it were to be used with its full storage capacity of 37.5 kg. According to the information that was gathered from the simulations, it is quite challenging to achieve this range when the conditions are in their natural state. There are, however, a few facts that are worthy of being mentioned. There is no consideration given to the number of passengers who ride the buses in the tests that are carried out by the manufacturer. Within the framework of the model that was developed, the bus was arranged in such a way that it reached its maximum carrying capacity in each of the cycles. The fact that each of the cycles takes into account every single decrease in velocity, whether it be due to the input of the driver or to the external traffic conditions, is another aspect that deserves to be mentioned. When these conditions are present, the powertrain is subjected to a significant amount of strain. Every cycle that was modeled represents a charging cycle for the electric bus, and the longer brakes that were applied in each scenario are representative of this. It would not be necessary to perform these kinds of charging cycles in the event that a fuel cell bus was used. The simulation model, on the other hand, records a consumption of hydrogen during these periods of inactivity, which influences the overall results. The evolution of the hydrogen mass that has been consumed can be seen in
Figure 5a, and the flow of hydrogen mass can be seen in
Figure 5b. The data are widely represented in
Table 4.
The results were generated in a scenario in which the bus is permanently operating with the auxiliary systems functioning as well as at maximum ridership capacity. Due to this fact, the energy consumption might, at times, be over some values that are considered to be typical. This effect can also be influenced by the fuel cell never being turned off.


 ,
, 


