Article

Estimating Water Use Efficiency for Major Crops in Chihuahua, Mexico: Crop Yield Function Models vs. Evapotranspiration

by
Octavio Villalobos-Cano
1,*,
Eduardo Santellano-Estrada
2,
Blair L. Stringam
3,
Kulbhushan Grover
3,* and
Edgar Esparza-Vela
2
1
School of Agricultural and Forestry Sciences, Universidad Autónoma de Chihuahua, Km 2.5 Carretera Delicias-Rosales, Delicias 33000, Chihuahua, Mexico
2
School of Husbandry and Ecology, Universidad Autónoma de Chihuahua, Km 1 Periférico R. Almada, Colonia Zootecnia, Chihuahua 31000, Chihuahua, Mexico
3
Department of Plant & Environment Sciences, New Mexico State University, Las Cruces, NM 88003, USA
*
Authors to whom correspondence should be addressed.
Sustainability 2024, 16(5), 1851; https://doi.org/10.3390/su16051851
Submission received: 28 December 2023 / Revised: 3 February 2024 / Accepted: 19 February 2024 / Published: 23 February 2024
(This article belongs to the Special Issue Advances in Sustainable Agricultural Crop Production)

Abstract

:
Water use in agriculture is a critical aspect of sustainable food production. Efficient water management is essential to address both yield optimization and environmental concerns. The current study evaluated the water diversions by the Irrigation District 05—Delicias (DR-05), in the State of Chihuahua, Mexico, for four major crops grown in the region including alfalfa, chile, pecans and peanuts. The amounts of water applied to raise these crops were compared to the amounts of water use estimated with the evapotranspiration (ET) method and with the crop yield function model, and respective water use efficiencies were estimated with both the methods. The water use efficiency measured using the ET estimation (WUE-ET) for alfalfa ranged from 60.9% to 70.4%, while the water use efficiency derived from the yield function data (WUE-YF) showed lower values and ranged from 43.6% to 59.7%. In the case of chile, the opposite trends were observed than in alfalfa, with the WUE-ET for chile ranging from 47.7% to 54.8%, and WUE-YF showing higher values that ranged from 49% to 70%. In the case of peanuts and pecans, only the WUE-ET was estimated and it ranged from 55.9% to 68.8% for peanuts and 90.9% to 116.9% pecans, respectively. Among the four crops studied, pecans were found to have the highest WUE-ET, with values of WUE-ET reaching higher than 100%. However, it is to be noted that these high values of water use efficiencies are more indicative that pecans are probably under irrigated.

1. Introduction

Water is essential for life and is the foundation of sustainable development, from food and energy security to human health and the environment [1]. The human altered hydrologic cycle, socio-economic development, population growth and climate change represent the main challenges to meet food requirements [2,3,4]. This challenge is further complicated considering that natural resources, mainly water, are limited and increasingly scarce [5].
A major part of global freshwater use for mankind (80–90%) is for agriculture, including crop production [6]. Population growth is increasing food requirements, which is exerting increasing pressure on water resources [7]. A 2017 UN report predicts the world population will reach 9.8 billion by the year 2050 [8]. Presently, the world population is at about 8.1 billion. This leads to a critical question: how will societies feed this 1.7 billion increase in population. In a report from the 2017 International Commission on Irrigation and Drainage, it states that the greatest burden of providing this growing population with food would fall on irrigated lands [8]. However, much of the water that would be needed for this increase in food production is already allocated. Thus, the only option is to learn to be more efficient with the water that is currently used in irrigation.
Inappropriate usage of resources diminishes productivity and causes environmental deterioration [9]. This acquires more importance in arid and semi-arid zones, where water resource is the deciding factor in the productive process, for which it is necessary to reduce water usage per unit, whether by area or product, stopping or slowing down environmental damage [10,11]. The productivity of resources is the main indicator to determine whether agricultural inputs are being correctly utilized [12].
The productive efficiency of a water resource is the most used indicator. It shows the amount of product per water unit used, and it is a useful measurement to determine the capacity of agricultural systems, and it provides a clearer vision of water redistribution opportunities [13]; it can be reported as average productive or, more often, as marginal productivity, which expresses the quantity of product gained by using an additional unit of water.
Climate change poses another serious threat to the sustainability of agriculture due to rising global temperatures, higher atmospheric CO2 levels and altering rainfall patterns [14]. For instance, predictions for the climate over the next 50 years indicate increases of annual mean temperature of 1–2.58 degrees Celcius [15]. Each degree Celsius increase in global temperature can lead to crop yield reductions of 5 to 16% [16,17]. The effects of climate variability are exacerbated in regions with limited water availability.
Water use in agriculture is, therefore, a critical aspect of sustainable food production. Efficient water management is essential to address both yield optimization and environmental concerns. It is necessary to prudently manage the use of this resource and avoid waste in its utilization in agriculture. In arid and semiarid regions, efficient water use takes on greater importance, because water is a scarce resource and conserving water is the key for sustainable agriculture and regional development [18]. Moreover, in arid and semi-arid regions, the aim should be to maximize water productivity rather than land productivity [19].
The Irrigation District 05—Delicias is located in the state of Chihuahua, Mexico, and is characterized as a dry desert, with cold winters and hot summers [20]. The summer temperatures range between 35 °C and 40 °C while annual rainfall averages of 290.4 mm in the region. The highest rain occurs in the summer during the months of July and August, representing 45% of the annual precipitation in the region [20].
Water resources in the Irrigation District 05—Delicias are declining at an alarming rate due to the climate variability, which has resulted in long periods of drought. Scientific research plays an important role in facilitating the implementation of a sustainable development model using assessments and policy engagement from a global to a local scale [21]. It requires a broad and in-depth knowledge of the global to local dynamics of water availability and use.
The 05—Delicias Irrigation District is one of Mexico’s top-producing agricultural regions for alfalfa, pecans, peanuts, chile, and onion crops (Table 1). In the 2015–2016 agricultural cycle, these DR-05 crops were ranked first and second nationwide in terms of production and economic value among all the irrigation districts in Mexico [22].
The production capacity of DR-05 depends on the water available from two reservoirs, the Francisco I. Madero dam, known as “las virgenes”, and the La Boquilla dam, with storage capacities of 355.29 and 2893.57 hm3, respectively. Both of these reservoirs are connected by a hydro-agricultural conduction system called “canal principal” to provide an irrigation service to the entire DR-05 area.
Considering that DR-05 has had significant harvest variability over the last 30 years, the availability and use of water for irrigation may impact the long-term viability of these reservoirs. Hence, it is necessary to perform a comparative analysis of the water use for this area. Evapotranspiration can be an important factor affecting the amount of water needed for vegetation development, surface runoff, and therefore, for irrigation and water resource management [24,25,26]. Estimation of evapotranspiration helps producers gauge crop water needs. Accurate measurements aid in irrigation planning, ensuring judicious water use while minimizing waste [27].
Implementing technologies like weather-based evapotranspiration models enhances precision, contributing to resource conservation and improved crop productivity. Overall, integrating advanced methods for calculating evapotranspiration is pivotal for achieving a balance between agricultural productivity and water sustainability [28].
The crop yield function holds paramount importance in agricultural contexts as it serves as a fundamental metric for assessing the productivity and efficiency of farming practices [29]. This function provides a quantitative relationship between various input factors such as water, nutrients, sunlight, and crop management practices, and the resulting output in terms of harvested crops [30]. Understanding and optimizing the crop yield function is crucial for farmers and researchers alike, as it enables the identification of optimal conditions and practices to maximize production.
By analyzing and fine-tuning this function, stakeholders can enhance resource utilization, mitigate environmental impacts, and contribute to global food security. Moreover, the crop yield function plays a pivotal role in informing decision-making processes related to agricultural planning, resource allocation, and sustainable farming practices.
This paper reports the use of water for alfalfa, chile, peanuts, and pecans for the years 2009 to 2016. The goal of this study was to evaluate the water diversions from the Irrigation District 05—Delicias (DR-05), in the State of Chihuahua, Mexico and estimate the efficiency of water being used. This evaluation will help to determine if the crops grown in this area can be grown in a sustainable manner. This paper only evaluates one of the factors, water use efficiency. Other factors such as suitable crop evaluation, environmental, economic, and social impacts should also be considered in subsequent work. All these aspects must be considered to help identify measures for a better sustainable agriculture.

2. Materials and Methods

In this study, the yield and water use as well as applied water were studied for 2009 to 2016. Crop evapotranspiration (ETc) values were determined for chile, peanuts, alfalfa and pecans for all of these years. Reference ETo was determined using the Hargreaves Equation. The appropriate Kc value was required for the estimation of ETc. The Kc values that were used for alfalfa and peanuts were taken from the FAO 56 publication [31] while the Kc values for pecans were determined from [32] and the Kc values for chile were found in [33].
In order to further review water use efficiency in the 05—Delicias area, yield functions for alfalfa and chile were evaluated. However, the yield function equations were rearranged to solve for total consumptive water use. Yield functions were not available for peanuts and pecans for this region. The crop yields for alfalfa and chile were input into the equations to determine the required water application depths to achieve these yields.

2.1. Hargreaves ET Equation

Limited weather information was available for this work, so the Hargreaves ETo equation was used to estimate crop ETc water use for the growing season. This allowed for a comparison of the water used to irrigate and grow the crop with the total ET that was determined for the season. When all of the weather data are available, the Penman–Monteith equation is recommended to estimate crop ETo [34]. However, only air temperatures were consistently available for this area, so the Hargreaves equation was used to estimate ETo:
E T o = 0.0023 R A T + 17.8 T R
where ETo is the reference evapotranspiration; RA is the extraterrestrial solar radiation; T is the mean temperature; and TR is the average daily temperature range. Temperatures for this research were obtained from a local weather station in the 05–Delicias area. Researchers explain that this equation does not work as well for daily ETo estimation, but it provides a good estimate of ETo for longer periods of time [34]. Considering that the crop water use is estimated for the growing season, this equation will accomplish the goal of this research. The extraterrestrial radiation has to be estimated for the above equation using the following relationship:
R A = 37.6   d r ω s   s i n ϕ   s i n δ + c o s ϕ   c o s δ   s i n ω s
where dr is the relative distance from the earth to the sun, ωs is the sunset hour angle (rad); ϕ is the latitude (rad); and δ is the declination of the sun (rad). All of these variables are dependent upon the day of the year, the latitude, and the elevation. They can be estimated using simple equations that are found in [34].

2.2. Yield Functions

Yield functions have been developed to understand how varying amounts of applied water influence crop yields [35]. These functions are simplified relationships that show crop water requirements for given crop yield [36]. Yield functions are used for “irrigation system design and management, agronomic and economic development, feasibility studies and the benefits of irrigation water compared with other water uses” [36]. Users of these functions can assess water needs to meet production targets and estimate crop yields based on available water [37].
For this study, yield functions were used for alfalfa and chile crops. The alfalfa yield function was developed in Mexico [38]:
Y = 1.84 + 0.26 E T 0.0006 E T 2
where Y is the alfalfa seasonal crop yield (ton ha−1) and ET is the crop water use (cm depth).
A crop yield function for chile grown in southern New Mexico has been developed [39]. This function is as follows:
Y = 0.5168 E T 12.1
where Y is the chile seasonal crop yield (ton ha−1) and ET is the crop water use (cm). In DR-05 the crop is usually planted in March, and it grows for about 90–110 days before it is harvested. Equations (3) and (4) developed for alfalfa and chile only. As mentioned earlier; yield functions were not available for peanuts and pecans for this region.

2.3. Water Use Efficiency

The values from the ET calculations and the crop production function were used as the numerator in the water use efficiency equation. The water that was applied was used in the denominator. This helps us understand how well the water is being used for the various crops. Water use efficiency was determined from the following formula found in [40]:
E u = W u W d × 100
where Eu is the water use efficiency, Wu is the water beneficially used and Wd is the water delivered. It is generally accepted that when a crop is irrigated, there will be a water loss. Therefore, the water use efficiency will be less than 100%.

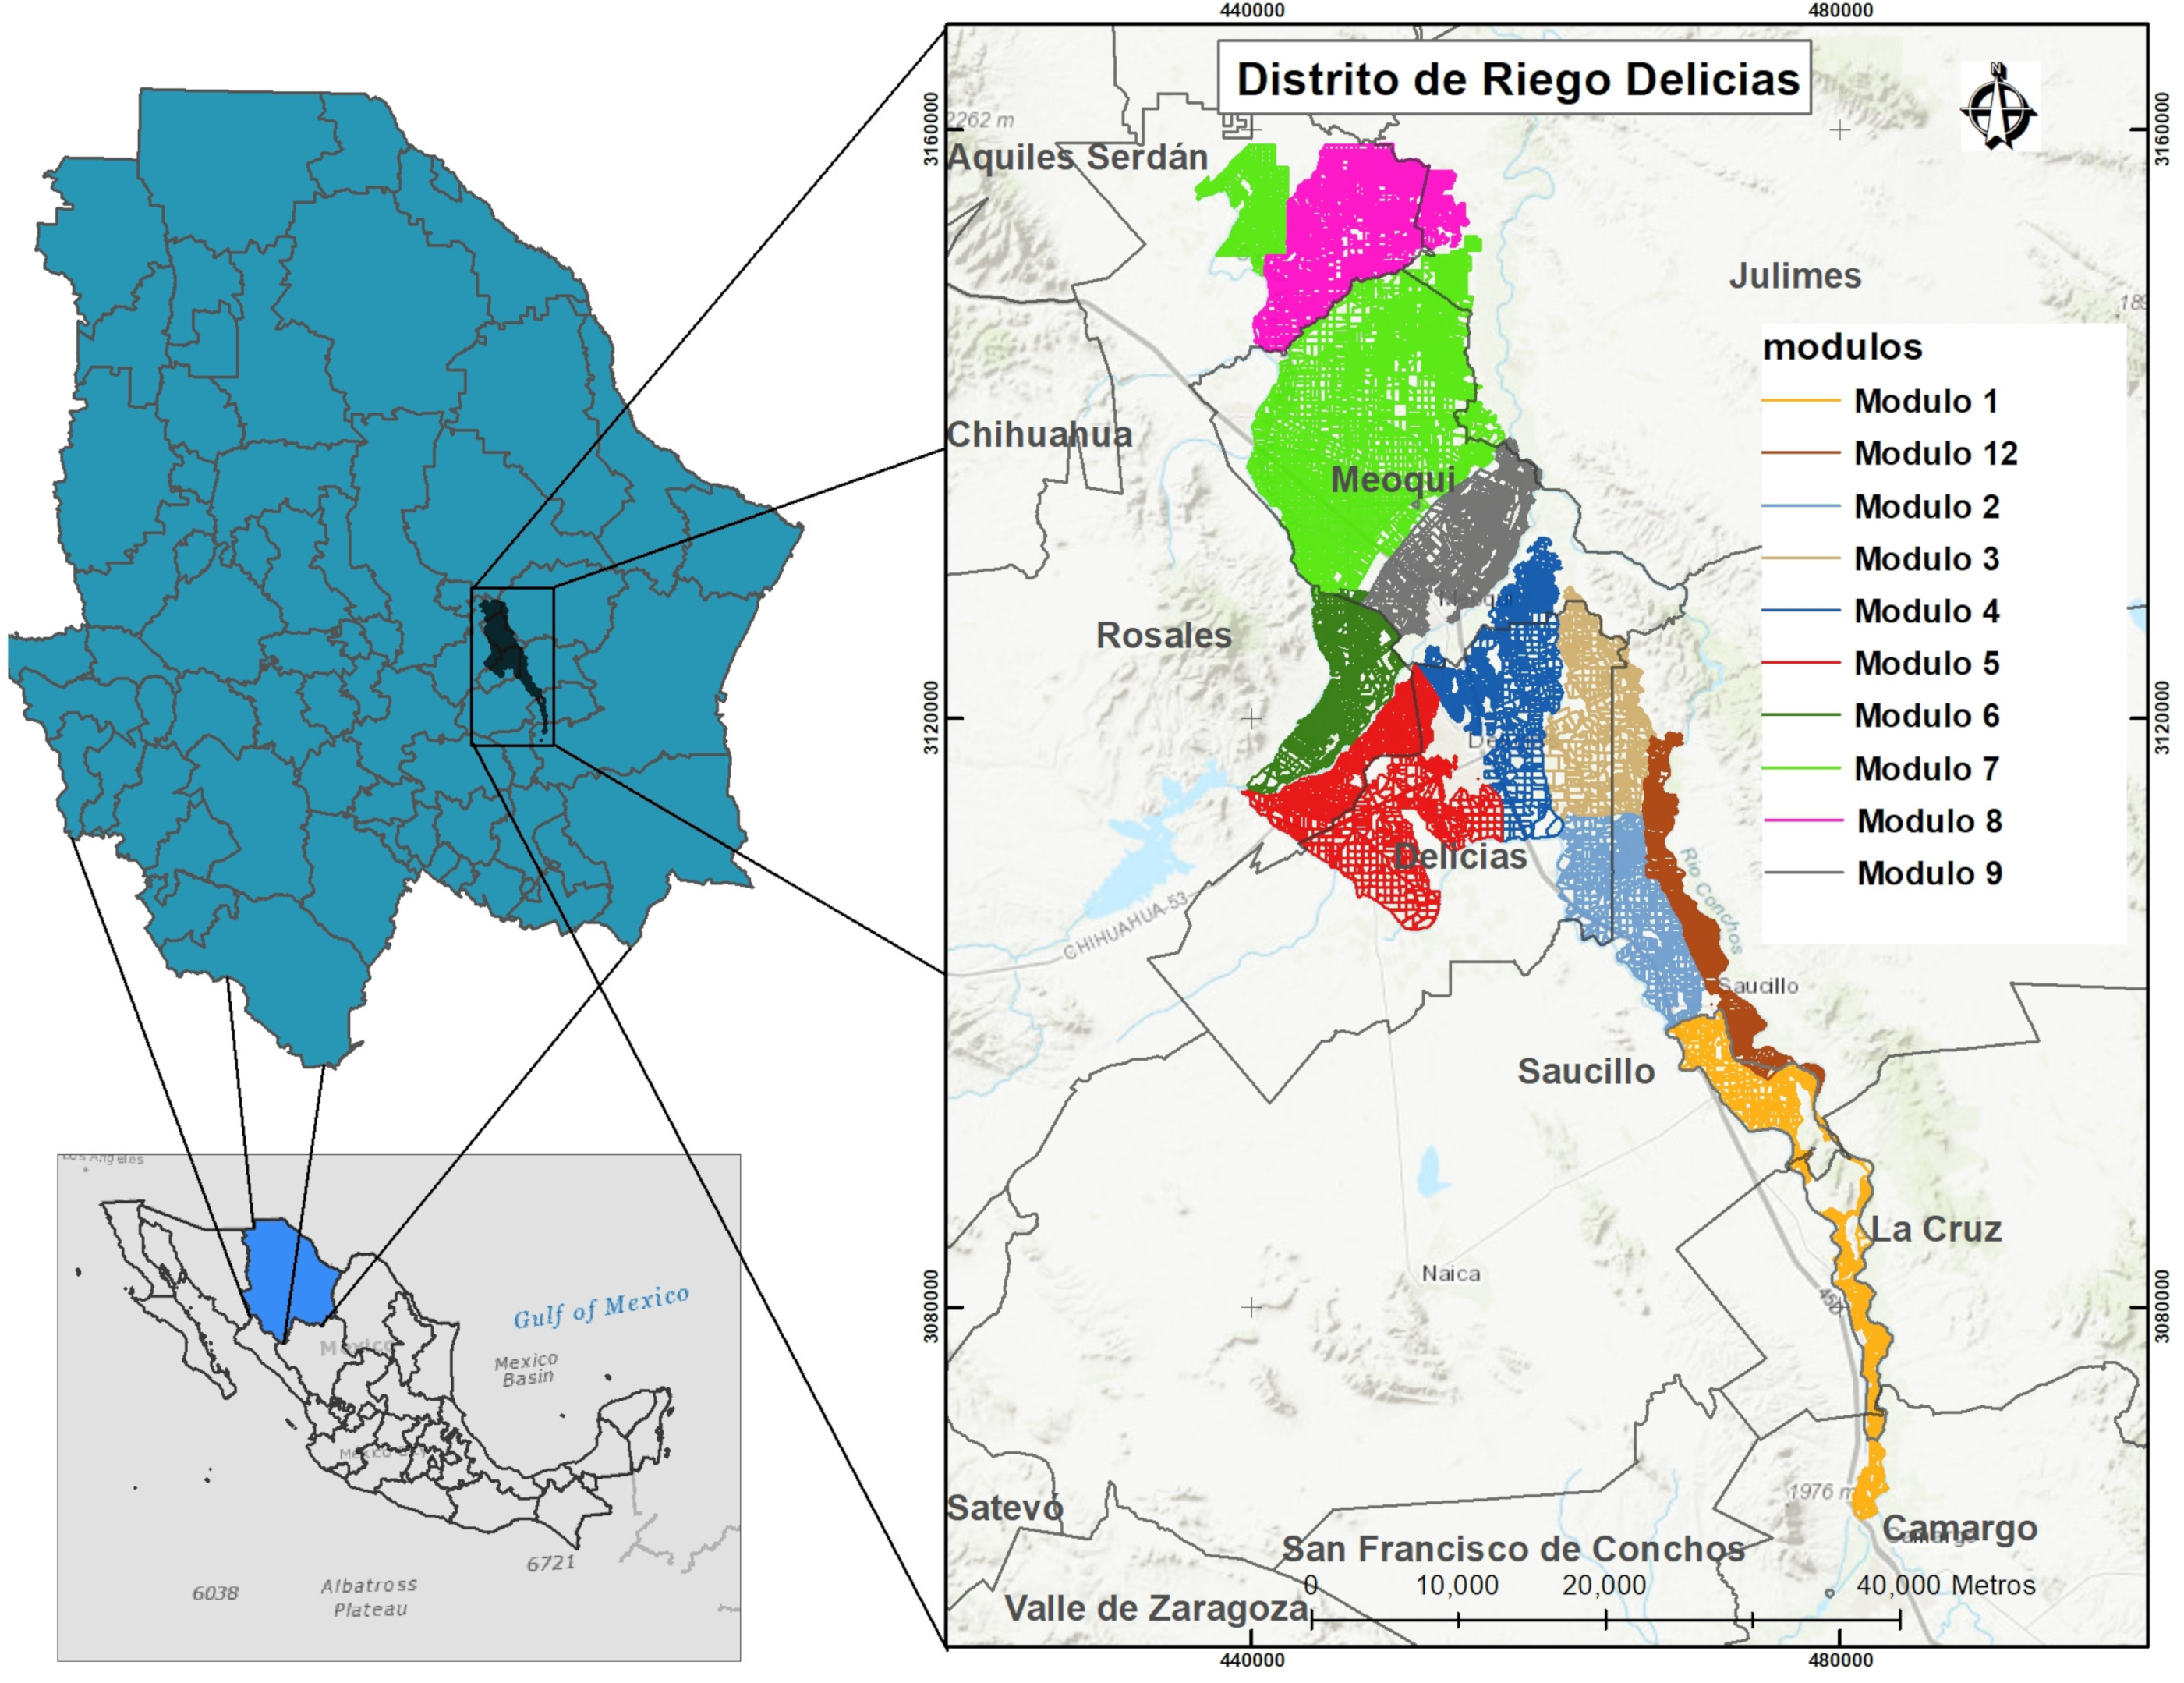
2.4. Description of the Study Area

The Irrigation District 05—Delicias, Chihuahua, Mexico, belongs to the Rio Bravo hydrological basin. It is located in northern Mexico, in the south central region of the State of Chihuahua, 28°11″ north latitude and 105°28″ west longitude, with an average altitude of 1165 m above sea level. The DR-05 has an area of 100,093 ha, where 80% of the area is irrigated and 20% uses seasonal precipitation. This area has 8113 producers that grow crops. These producers are organized into 10 non-profit organizations called “modulo” (Figure 1), whose main function and responsibility is the distribution and delivery of watering volume to its users. These modules are, in turn, integrated into two limited liability companies, whose functions are water delivery to the irrigation modules and giving maintenance to distribution major infrastructure in the DR-05.

2.5. Choice of Crop under Study

In order to obtain agricultural production information, personal interviews were conducted with the District Chief and Chief of Operations of CONAGUA. To determine the importance of the crops in this area, statistical information on agricultural production were analyzed. These data were obtained from official databases including the Secretariat of the Environment and Natural Resources (SEMARNAT), National Water Commission (CONAGUA), and the Secretariat of Agriculture, Livestock, Rural Development, Fisheries and Food (SAGARPA).
The subject population of the study amounted to 8083 producers that were registered in the user registry and grouped into 10 civil associations. Statistical data were obtained from August 2009 to February 2016 from personal interviews with the head engineer and the head of operations of the DR-05. Statistical information was used for agricultural production from 8 agricultural cycles (2009–2016) by accessing information from several databases [41,42,43,44].

2.6. Climatological Description

Based on the Köppen classification, the climate in Irrigation District 05—Delicias, Chihuahua is a dry desert type Bwh, with cold winters and hot summers. The region has an average temperature of 19.1 °C, and average daytime and nighttime temperatures of 24.0 and 14.1 °C, respectively, having a maximum maximum temperature of 45 °C and a minimum temperature of −21 °C [20]. The average annual rainfall is 290.4 mm, with 43.4 days of precipitation, and a higher incidence in the summer months of July, August, and September (July and August representing 45% of the annual total), and an annual evaporation of 2659.5 mm [20].

3. Results

The total depths of water that were applied in 2009 to 2016 for alfalfa, chile, peanuts and pecans are stated below (Table 2). Also stated are the total amount of water that was evapotranspired by these crops for the same years. These data were used to determine water use efficiency. The efficiency is partially dependent on the irrigation method. For example, flood irrigation methods have the lowest efficiency while drip irrigation tends to have higher efficiencies. It should also be pointed out that if there is a water use efficiency that is greater than 100%, then the crop is being under-irrigated.
For simplification, the water use efficiency calculated using the ET values is denoted by WUE-ET, while the water use efficiency calculated using the crop yield function is denoted by WUE-YF. The evapotranspiration and collected data indicated that the water use efficiency (WUE-ET) for alfalfa ranged from 60.9% to 70.4% and the WUE-ET for chile ranged from 47.7% to 54.8% (Table 2). The WUE-ET for peanut ranged from 55.9% to 68.8% (Table 2). The highest WUE-ET was recorded for pecans, ranging between 90.9% to 116.9% during the period from 2009 to 2016 (Table 2). It must be noted that the higher WUE-ET under pecans does not mean that the pecans were efficiently irrigated. In this case, the pecans were under irrigated. This will be explained later.
The data from Table 2 were used to generate mean and standard deviation values for the total water applied, evapotranspiration and water use efficiency. The data indicate that in the water shortage year (2015) water users more efficiently irrigated the alfalfa and chile crops, given that the water use efficiency for these crops was greater than the mean that was determined for these crops. On the other hand, the means that were determined for water use efficiency for peanuts and pecans were not exceeded in the water shortage year (Table 3). The standard deviation for the total water applied was greater than the standard deviation for water use efficiency. Crop ETc had a lower standard deviation than total water applied except for pecans (Table 3).

Yield Function Evaluation

In order to evaluate if the collected data for the DR-05 area were valid, the yield functions that were mentioned above were used to compare the collected data to the data generated by the yield functions.
In order to assess collected yield data, the crop yield was input into the yield function and a corresponding water depth for the crop yield was determined. Equation (4) was manipulated to solve ET explicitly while Equation (3) had to be solved implicitly because the power term could not be manipulated to solve for ET explicitly. This water depth was then divided by the total depth of water applied to the crop to determine the water use efficiency. The resulting estimated water use efficiency (WUE-YF) was then recorded in Table 4.
The WUE-YF for alfalfa ranged from 43.6% to 59.7% while the WUE-YF for chile ranged from 49% to 70% (Table 4). The data presented in Table 2 and Table 3 indicate that the WUE-YF estimations of alfalfa were lower than its WUE-ET estimations during the 2009–2016 period. In contrast, WUE-YF estimations of chile crop were higher than its WUE-ET estimations during the 2009–2016 period (Table 2 and Table 4).
The data in Table 4 were used to determine mean values for the yield function water depths as well as the mean values for water use efficiency data. Once again, it can be observed that for the water shortage year (2015), the water use efficiency was greater than the average for the 8 years of data for chile and alfalfa. Again, this indicates that the water users irrigated more efficiently for the 2015 year.

4. Discussion

Efficient water management is essential for sustainable food production, particularly in arid and semiarid regions where water is a scarce resource. The region of study in this manuscript, Irrigation District 05—Delicias, is located in the state of Chihuahua, Mexico, and is characterized as a dry desert with cold winters and hot summers. The 05—Delicias Irrigation District is one of Mexico’s top-producing agricultural regions for alfalfa, pecans, peanuts, chile, and onion crop. The current study analyzed the use of water for alfalfa, chile, peanuts, and pecans for the years 2009 to 2016, with a goal to evaluate the water diversions and to estimate the efficiency of water being used from the Irrigation District 05—Delicias (DR-05), in the State of Chihuahua, Mexico.
Irrespective of the irrigation method used, there are always water losses during an irrigation. The level of water use efficiency that is obtained depends on the irrigation method used and good irrigation management. It should be noted that all the crops in this study were flood-irrigated, and a water use efficiency of 60% was considered a good achievement for a flood irrigation. Even with good management practices, it can be difficult to achieve high application efficiencies with flood irrigation.
The differences in WUE-ET and WUE-YF obtained for the same crops in this study may partially be attributed to the inaccuracies in the estimation equations. It must be remembered that the equations were determined when measured data were used to develop a best-fit comparison that modeled the data. This is true for both the yield equations and Hargreaves equation. However, both methods that are used for estimating irrigation water use efficiency indicate that alfalfa and chile are irrigated with low efficiencies (Table 2 and Table 5).
Another important factor identified is that water users tend to use water more efficiently in water shortage years. This observation is demonstrated in the 2015 low-water-availability year, where water was used more efficiently (Table 2, Table 3, Table 4 and Table 5). However, there was no noticeable change in water use efficiency for peanuts and pecans in the 2015 water shortage year. It is puzzling why farmers change their irrigation practices for the lower-value crops.
Pecans are typically basin-irrigated (a category of flood irrigation). If a basin irrigation system is properly sized, leveled, and managed, the efficiencies can exceed 60% [45]. The ET/yield data (WUE-ET and WUE-YF) indicate this to some degree; however, the high efficiencies were more indicative of under-irrigation. Basin irrigation usually has efficiencies in the 65 to 75% range when it is properly managed. In this study, the high efficiencies for pecans were indicative of under-irrigation, rather than of them being efficiently irrigated. In other words, pecan yields can be increased by applying additional water. This is also indicative that more water could and should be applied to increase pecan yields and to increase potential income to pecan growers.
In the DR-05 district, areas under perennial crops have been increasing year after year, resulting in greater pressure on the availability of water and its sustainable management. It was also concluded that the increase in crops with a high consumption of water has increased pressure on the management of this resource and on decision making, since they represent the crops with the highest water consumption per unit area [46].

5. Conclusions

The current study evaluated the water diversions by the Irrigation District 05—Delicias (DR-05), in the State of Chihuahua, Mexico, for four major crops grown in the region, alfalfa, chile, pecans and peanuts, and compared water use efficiency calculated using two methods. The water use efficiency measured using the ET estimation (WUE-ET) for alfalfa ranged from 60.9% to 70.4%, while the water use efficiency derived from the yield function data (WUE-YF) showed lower values and ranged from 43.6% to 59.7%. In the case of chile, opposite trends were observed than in alfalfa, with the WUE-ET for chile ranging from 47.7% to 54.8%, and WUE-YF showing higher values that ranged from 49% to 70%. The difference between the two comparison methods is likely due to the errors in the data collection as well as the yield function and Hargreaves equations that are used in this comparison.
In the case of peanuts and pecans, only WUE-ET were measured. The WUE-ET for peanut ranged from 55.9% to 68.8% (Table 2). The highest WUE-ET was recorded for pecans, ranging between 90.9% to 116.9% during the period from 2009 to 2016. While considering the evapotranspiration method, pecans grown in the Irrigation District 05—Delicias appear to have the highest WUE-ET among the four crops evaluated in this study. Further, ET/yield data indicate this to some extent.
The data indicate that in the 2015 water shortage year, chile and alfalfa were irrigated more efficiently. For the WUE-ET data, the water users were 4.8% more efficient than the mean when irrigating alfalfa and 2.4% greater than the mean when irrigating chile. The WUE-YF data indicate that for 2015, alfalfa was 7.8% more efficiently irrigated and the chile was 8.3% more efficiently irrigated. This proves that when motivated, irrigation farmers are capable to use water more efficiently.
The results of this research will help determine future plans for the Irrigation District 05—Delicias, where these plans will determine the conditions, characteristics and important profiles that will help make this area more sustainable.

Author Contributions

Conceptualization, O.V.-C.; methodology, K.G. and B.L.S.; formal analysis, O.V.-C. and B.L.S.; investigation, O.V.-C. and B.L.S.; writing—original draft preparation, O.V.-C. and E.S.-E.; writing—review and editing, K.G.; visualization, E.S.-E. and E.E.-V.; supervision, K.G. All authors have read and agreed to the published version of the manuscript.

Funding

This research received no external funding.

Institutional Review Board Statement

Not applicable.

Informed Consent Statement

Not applicable.

Data Availability Statement

Publicly available datasets were analyzed in this study. The data presented in this study are openly available in references [23,41,42,43].

Conflicts of Interest

The authors declare no conflicts of interest.

References

  1. Akhmouch, A. Water Governance in Latin America and the Caribbean: A Multi-Level Approach; OECD Regional Development Working Papers; OECD Publishing: Berlin, Germany, 2012. [Google Scholar]
  2. Fischer, G.; Shah, M.N.; Tubiello, F.; Van Velhuizen, H. Socio-economic and climate change impacts on agriculture: An integrated assessment, 1990–2080. Philos. Trans. R. Soc. B Biol. Sci. 2005, 360, 2067–2083. [Google Scholar] [CrossRef] [PubMed]
  3. Hanjra, M.A.; Qureshi, M.E. Global water crisis and future food security in an era of climate change. Food Policy 2010, 35, 365–377. [Google Scholar] [CrossRef]
  4. Misra, A.K. Climate change and challenges of water and food security. Int. J. Sustain. Built Environ. 2014, 3, 153–165. [Google Scholar] [CrossRef]
  5. Wisser, D.; Fekete, B.M.; Vörösmarty, C.J.; Schumann, A.H. Reconstructing 20th century global hydrography: A contribution to the Global Terrestrial Network-Hydrology (GTN-H). Hydrol. Earth Syst. Sci. 2010, 14, 1–24. [Google Scholar] [CrossRef]
  6. Morison, J.I.L.; Baker, N.R.; Mullineaux, P.M.; Davies, W.J. Improving water use in crop production. Phil. Trans. R. Soc. B 2008, 363, 639–658. [Google Scholar] [CrossRef]
  7. Bieber, N.; Ker, J.H.; Wang, X.; Triantafyllidis, C.; van Dam, K.H.; Koppelaar, R.H.; Shah, N. Sustainable planning of the energy-water-food nexus using decision making tools. Energy Policy 2018, 113, 584–607. [Google Scholar] [CrossRef]
  8. ICID. Modernizing irrigation and drainage for a new green revolution. In Proceedings of the International Congres on Irrigation and Drainage Transaction, Mexico City, Mexico, 8–14 October 2017. [Google Scholar]
  9. Hofman, A.; Aravena, C.; Aliaga, V. Information and communication technologies and their impact in the economic growth of Latin America, 1990–2013. Telecommun. Policy 2016, 40, 485–501. [Google Scholar] [CrossRef]
  10. Amaro-Rosales, M.; Gortari-Rabiela, R. Inclusive innovation in the Mexican agricultural sector: Coffee producers in Veracruz. Econ. Inf. 2016, 400, 86–104. [Google Scholar]
  11. Expósito, A.; Berbel, J. Agricultural irrigation water use in a closed basin and the impacts on water productivity: The case of the Guadalquivir river basin (Southern Spain). Water 2017, 9, 136. [Google Scholar] [CrossRef]
  12. Rizzi, F.I.; Borghini, A.; Frey, M. Environmental management of end-of-life products: Nine factors of sustainability in collaborative networks. Bus. Strategy Environ. 2013, 22, 561–572. [Google Scholar] [CrossRef]
  13. Ríos, F.J.L.; Torres, M.M.; Torres, M.A.M. Agricultural Water Productivity in Pecans Tree of Northern Mexico; Editorial Académica Española: London, UK, 2016. [Google Scholar]
  14. Allen, C.D.; Macalady, A.K.; Chenchouni, H.; Bachelet, D.; McDowell, N.; Vennetier, M.; Kitzberger, T.; Rigling, A.; Breshears, D.D.; Hogg, E.H.; et al. A global overview of drought and heat-induced tree mortality reveals emerging climate change risks for forests. For. Ecol. Manag. 2010, 259, 660–684. [Google Scholar] [CrossRef]
  15. IPCC. 2007 Climate change. In 2007: The Physical Science Basis. Contribution of Working Group I to the Fourth Assessment. Report of the Intergovernmental Panel on Climate Change; Solomon, S.D., Qin, M., Manning, M., Chen, Z., Marquis, M., Averyt, K.B., Tignor, M., Miller, H.L., Eds.; Cambridge University Press: Cambridge, UK; New York, NY, USA, 2017. [Google Scholar]
  16. Lobell, D.B.; Schlenker, W.; Costa-Roberts, J. Climate trends and global crop production since 1980. Science 2011, 333, 616–620. [Google Scholar] [CrossRef] [PubMed]
  17. Regmi, M.; Tack, J.; Featherstone, A.M. Does crop insurance influence crop yield impacts of warming temperatures? A farm-level analysis. J. Agric. Appl. Econ. Assoc. 2023, 2, 808–822. [Google Scholar] [CrossRef]
  18. Stringam, B.L.; Grover, K.K. Crop Yield Function and Evapotranspiration Comparison for Crops near Hatch, New Mexico, USA. Arid. Land. Stud. 2014, 24, 125–128. [Google Scholar]
  19. Fereres, E.; Soriano, M.A. Deficit irrigation for reducing agricultural water use. J. Exp. Bot. 2007, 58, 147–159. [Google Scholar] [CrossRef]
  20. INIFAP. National Institute for Forestry, Agricultural and Livestock Research. Basic Climatological Statistics of the State of Chihuahua; INIFAP: Mexico City, Mexico, 2006. [Google Scholar]
  21. Bhaduri, A.; Bogardi, J.; Siddiqi, A.; Voigt, H.; Vörösmarty, C.; Pahl-Wostl, C.; Bunn, S.; Shrivastava, P.; Lawfor, R.; Foster, S.; et al. Achieving sustainable development goals from a water perspective. Front. Environ. Sci. 2016, 4, 64. [Google Scholar] [CrossRef]
  22. Comisión Nacional del Agua (CONAGUA). Estadísticas Agrícolas de los Distritos de Riego Año Agrícola 2015–2016; CONAGUA: Tlalpan, Mexico, 2017. [Google Scholar]
  23. Ministry of the Environment and Natural Resources (SEMARNAT). Agricultural Statistics of Irrigation Districts, Agricultural Cycle 2015–2016; SEMARNAT: Mexico City, Mexico, 2017.
  24. Bhat, S.A.; Pandit, B.; Dar, M.U.D.; ALI, Y.R.; Jan, R.; Khan, S. Comparative study of different methods of evapotranspiration estimation in Kashmir Valley. J. Agrometerology 2017, 19, 383–384. [Google Scholar] [CrossRef]
  25. Guo, D.; Westra, S.; Maier, H.R. Sensitivity of potential evapotranspiration to changes in climate variables for different Australian climatic zones. Hydrol. Earth Syst. 2017, 21, 2107–2126. [Google Scholar] [CrossRef]
  26. Elbeltagi, A.; Rizwan, M.; Mokhtar, A.; Deb, P.; Abdullahi, G.; Kushwaha, N.L.; Peroni, L.; Malik, A.; Kumar, N.; Deng, J. Spatial and temporal variability analysis of green and blue evapotranspiration of wheat in the Egyptian Nile Delta from 1997 to 2017. J. Hydrol. 2020, 594, 125662. [Google Scholar] [CrossRef]
  27. Wanniarachchi, S.; Sarukkalige, R. A review on evapotranspiration estimation in agricultural water management: Past, present, and future. Hydrology 2022, 9, 123. [Google Scholar] [CrossRef]
  28. Elbeltagi, A.; Nagy, A.; Mohammed, S.; Pande, C.B.; Kumar, M.; Bhat, S.A.; Zsembeli, J.; Huzsvai, L.; Tamás, J.; Kovács, E.; et al. Combination of Limited Meteorological Data for Predicting Reference Crop Evapotranspiration Using Artificial Neural Network Method. Agronomy 2022, 12, 516. [Google Scholar] [CrossRef]
  29. Nie, T.; Lu, D.; Zhang, Z.; Yang, H.; Gong, Z.; Chen, P.; Li, T.; Lin, Y.; Wang, M.; Du, C.; et al. Adaptabilities of Water Production Function Models for Rice in Cold and Black Soil Region of China. Agronomy 2022, 12, 2931. [Google Scholar] [CrossRef]
  30. Wang, D.; Li, F.; Nong, M. Response of yield and water use efficiency to different irrigation levels at different growth stages of Kenaf and crop water production function. Agric. Water Manag. 2017, 179, 177–183. [Google Scholar] [CrossRef]
  31. Allen, R.; Pereira, L.; Raes, D.; Smith, M. Crop Evapotranspiration–Guidelines for Computing Crop Water Requirements–FAO Irrigation and Drainage Paper 56; Food and Agricultural Organization of the United Nations Rome: Rome, Italy, 1998. [Google Scholar]
  32. Sammis, T.W.; Mexal, J.G.; Miller, D. Evapotranspiration of Flood-Irrigated Pecans. J. Agric. Water Manag. 2004, 69, 179–190. [Google Scholar] [CrossRef]
  33. Smith, R.; Aguiar, J.L.; Baameur, A.; Cahn, M.; Cantwell, M.; De L Fuente, M.; Hartz, T.; Koike, S.; Molinar, R.; Natwick, E.; et al. Chile Pepper Production in California; University of California Vegetable Research & Information Center; University of California: Los Angeles, CA, USA, 2011. [Google Scholar]
  34. Hargreaves, G.H.; Merkley, G.P. Irrigation Fundamentals; Water Resource Publications: Highlands Ranch, CO, USA, 2010. [Google Scholar]
  35. Liu, W.Z.; Hunsaker, D.J.; Li, Y.S.; Xie, X.S.; Wall, G.W. Interactions of yield, evaporation, and water use efficiency from marginal analysis of water production functions. Agric. Water Manag. 2002, 56, 143–151. [Google Scholar] [CrossRef]
  36. Hanks, R.J. Model for predicting plant yield as influenced by water use. Agron. J. 1974, 66, 660–665. [Google Scholar] [CrossRef]
  37. Brumbelow, K.; Georgakakos, A. Optimization and assessment of agricultural water-sharing scenarios under multiple socioeconomic objectives. J. Water Resour. Plan. Manag. 2007, 133, 264–274. [Google Scholar] [CrossRef]
  38. Inzunza, I.M.A. Respuesta de la alfalfa a diferentes contenidos de humedad del suelo. Terra 1991, 9, 129–138. [Google Scholar]
  39. Wierenga, P.J. Yield and quality of trickle irrigated chile. In Agricultural Experiment Station Bulletin No. 703; New Mexico State University: Las Cruces, NM, USA, 1983. [Google Scholar]
  40. Hansen, V.E.; Israelsen, O.W.; Stringham, G.E. Irrigation Principles and Practices, 4th ed.; John Wiley & Sons, Inc.: New York, NY, USA, 1980. [Google Scholar]
  41. Ministry of the Environment and Natural Resources (SEMARNAT). Agricultural Statistics of Irrigation Districts, Agricultural Cycle 2008–2009; SEMARNAT: Mexico City, Mexico, 2010.
  42. Ministry of the Environment and Natural Resources (SEMARNAT). Agricultural Statistics of Irrigation Districts, Agricultural Cycle 2009–2010; SEMARNAT: Mexico City, Mexico, 2011.
  43. Ministry of the Environment and Natural Resources (SEMARNAT). Agricultural Statistics of Irrigation Districts, Agricultural Cycle 2010–2011; SEMARNAT: Mexico City, Mexico, 2012.
  44. Ministry of the Environment and Natural Resources (SEMARNAT). Agricultural Statistics of Irrigation Districts, Agricultural Cycle 2011–2012; SEMARNAT: Mexico City, Mexico, 2013.
  45. Íñiguez-Covarrubias, M.; Ojeda-Bustamante, W.; Olmedo-Vázquez, V.M. Productivity analysis of the Río Bravo irrigation districts using performance indicators. Ing. Agrícola Y Biosist. 2020, 12, 131–158. [Google Scholar] [CrossRef]
  46. Villalobos-Cano, O.; Santellano-Estrada, E.; Sánchez-Chávez, E.; Mancillas-Flores, P.F.; Martínez-Salvador, M.; Morales-Nieto, C.R.Y.; Esparza-Vela, M.E. Diagnosis and evaluation of water resources use in Irrigation District 05-Delicias, Chihuahua, México. Ecosistemas Recur. Agropecu. 2020, 7, 14. [Google Scholar]
Figure 1. Location of the Irrigation District 05—Delicias in the state of Chihuahua, Mexico.
Sustainability 16 01851 g001
Table 1. The most important crops in the Irrigation District 05—Delicias, agricultural cycle 2015/2016, by the value of their production in dollars.
Production Economic Value (Million USD)
CropDR-05NationalDR05/National
(%)
DR05/National
Rank
Alfalfa65.3380.917.12
Pecans69.1271.325.51
Peanuts6.18.373.71
Chile58.9340.317.32
Watermelon19.170.127.21
Onion17.452.633.11
Source: [23].
Table 2. Total water applied compared to evapotranspiration for alfalfa, chile, peanuts and pecans in District 05—Delicias, Chihuahua, Mexico, from 2009 to 2016.
YearCropTotal Water Applied (cm)Evapotranspiration Water (cm)Water Use Efficiency (WUE-ET) (%)
2009Alfalfa178.2116.265.2
2009Chile149.281.754.8
2009Peanuts120.974.261.4
2009Pecans132.8148.5111.8
2010Alfalfa187.511460.9
2010Chile164.981.149.2
2010Peanuts117.273.863
2010Pecans118.9114.596.3
2011Alfalfa187.5124.666.5
2011Chile184.289.248.4
2011Peanuts144.480.855.9
2011Pecans137.7161.1116.9
2012Alfalfa187.4118.263.1
2012Chile154.481.253
2012Peanuts128.874.157.5
2012Pecans165149.990.9
2013Alfalfa163.5106.665.2
2013Chile169.680.947.7
2013Peanuts111.967.560.3
2013Pecans126.5131.8104.2
2014Alfalfa175.3111.563.6
2014Chile173.486.750
2014Peanuts110.472.966
2014Pecans139.9143102.2
2015Alfalfa154.9109.170.4
2015Chile15080.953.9
2015Peanuts119.27058.7
2015Pecans144.3140.397
2016Alfalfa158.9110.769.7
2016Chile142.878.254.8
2016Peanuts103.170.968.8
2016Pecans132.8141.2106.3
Table 3. The mean and standard deviation for the total water applied, evapotranspiration and water use efficiency for alfalfa, chile, peanuts and pecans in District 05—Delicias, Chihuahua, Mexico from 2009 to 2016.
CropTotal Water Applied Mean (cm)Total Water Applied Standard Deviation (cm)Evapotrans. Mean (cm)Evapotrans.
Standard Deviation
(cm)
Water Use Efficiency Mean (%)Water Use Efficiency Standard Deviation (%)
Alfalfa174.212.6113.95.465.63.0
Chile161.113.382.53.451.52.8
Peanuts121.510.172.93.761.4512.9
Pecans137.212.8141.312.9103.28.0
Table 4. Total water applied compared with the depth of water required using the yield function data for alfalfa and chile in District 05—Delicias, Chihuahua, Mexico from 2009 to 2016.
YearCropsCollected Yield (ton/ha)Total Water Applied (cm)Yield Function Depth (cm)Estimated Water Use Efficiency (WUE-YF) (%)
2009Alfalfa19.9178.287.148.9
2009Chile41.8149.2104.470
2010Alfalfa19.1187.181.543.6
2010Chile31.7164.984.751.3
2011Alfalfa20.2187.588.847.4
2011Chile34.5184.290.249
2012Alfalfa20.6187.491.548.8
2012Chile35154.491.159
2013Alfalfa19.7163.585.452.2
2013Chile40169.6100.859.4
2014Alfalfa20.4175.390.251.5
2014Chile40173.4100.858.1
2015Alfalfa20.65154.991.859.2
2015Chile40150100.867.2
2016Alfalfa21.11158.994.959.7
2016Chile30142.881.557
Table 5. The mean and standard deviation for the yield function water depth and water use efficiency for alfalfa and chile in District 05—Delicias, Chihuahua, Mexico, from 2009 to 2016.
CropYield Function Depth
Mean (cm)
Yield Function Depth
Standard Deviation (cm)
Water Use Efficiency Mean (%)Water Use Efficiency Standard Deviation (%)
Alfalfa88.93.951.45.2
Chile94.38.058.96.6
Disclaimer/Publisher’s Note: The statements, opinions and data contained in all publications are solely those of the individual author(s) and contributor(s) and not of MDPI and/or the editor(s). MDPI and/or the editor(s) disclaim responsibility for any injury to people or property resulting from any ideas, methods, instructions or products referred to in the content.

