Article

Does Environmental Protection Law Bring about Greenwashing? Evidence from Heavy-Polluting Firms in China

School of Economic and Management, Tongji University, Shanghai 200092, China
*
Author to whom correspondence should be addressed.
Sustainability 2024, 16(5), 1782; https://doi.org/10.3390/su16051782
Submission received: 5 February 2024 / Revised: 19 February 2024 / Accepted: 20 February 2024 / Published: 21 February 2024
(This article belongs to the Special Issue Public Policy and Green Governance 2nd Edition)

Abstract

:
To enhance environmental governance for sustainable development, China has made efforts to address environmental issues through formal institutions. The enactment of the new Environmental Protection Law (EPL) in 2015 exerted new institutional pressures on heavy-polluting firms. Our study focuses on examining the phenomenon of greenwashing among these firms after the implementation of EPL. Using difference-in-difference model, we identify that EPL results in an increase in greenwashing behavior by heavy-polluting firms. Furthermore, our research reveals that while EPL implementation enhances disclosure performance in heavy-polluting firms, there is no tangible improvement in substantive environmental performance. These results are supported by various robustness tests that affirm their reliability. Additionally, we uncover that government subsidies exacerbate greenwashing in heavy-polluting firms. In contrast, the availability of slack resources diminishes the impact of EPL on greenwashing behavior. This study not only enhances the understanding of the mechanism of the impact between EPL and firm greenwashing, but also offers suggestions to help the government for better environmental governance as well as firms to engage in environmental behaviors and sustainability.

1. Introduction

The rapid development of firms has become a primary driver of economic prosperity [1,2]. However, this pace of growth has often come at the expense of the environment [3,4]. The pursuit of growth will bring to extra depletion of resources and emissions of waste, triggering increasingly pressing environmental concerns that have become a focal point globally [5]. The same is true of China, where rapid economic growth in the early 2000s has been accompanied by a growing shadow of environmental destruction [6]. In 2013, China had suffered the worst smog in the history [7], which made the Chinese government and public aware of the seriousness of environment issues. With the prominence of environmental issues and the promotion of public voices, the government continuously strengthened environmental governance [8,9]. Regulations are one of the means that the government can adopt [10]. Past literature has uncovered the effectiveness of environmental regulations in reducing pollutant emissions from both theoretical models and empirical examinations. The theoretical model reveals the mechanism of environmental regulation on pollutant emission reduction by constructing analytical frameworks including government [11], revenue [12], welfare [13], etc. While empirical examination shows the positive effects of environmental regulations in practical applications through a large number of cases [14,15,16].
In 2015, a new Environmental Protection Law (EPL) came into effect, which increases enforcement and establishes a mechanism for subsidies and penalty [17]. As a new environmental regulation, EPL imposes a multitude of requirements on firms. On the one hand, it mandates strict control of pollutant emissions, ensuring that they comply with nationally and locally prescribed standards. Firms need to adopt a range of measures, such as updating production processes, adopting advanced clean production technologies and equipment to reduce pollutant emissions. Additionally, appropriate pollution treatment facilities must be utilized to effectively manage the generated pollutants and ensure that emissions are within standards. Faced with such strict regulations, firms are likely to respond by green innovation [8,18,19] and purchase of environmental equipment, leading to decrease the risk of environmental issues. However, green innovation brings significant resource burdens to firms, including financial and human resources [20,21,22], while firms also need to bear the risk of innovation failure. Even when choosing to purchase environmental equipment, it can significantly increase the firm’s production costs [23], negatively impacting the firm’s liquidity. On the other hand, the new EPL also requires firms to disclose environmental information, facilitating supervisory departments and the public to oversee their environmental conduct, which is particularly stringent for heavy-polluting firms.
As a result, there is a conflict between a firm’s compliance with EPL and its goal of profit maximization, especially for mandatory regulations [24,25], implying that the purpose of the law might be undermined. Furthermore, due to the requirements of information disclosure, firms may adopt a strategy that they establish positive communication on environmental issues but without taking practical measures to solve them, which is defined as greenwashing [26]. Evidence reveals that financial constraints serve as the primary trigger of greenwashing [27], because firms with financial constraints will try to access the external financial resources through inflating ESG disclosure scores. This allows firms to demonstrate good environmental performance externally while minimizing costs. According to the discussion above, we propose our research questions. What kind of response will heavy-polluting firms exhibit as a result of the new EPL? What are the mechanisms that make heavy-polluting firms respond with greenwashing behavior after the implementation of EPL?
To address the research questions, we construct a difference-in-differences (DID) model to examine the causal relationship between the new EPL and greenwashing behavior in the heavy-polluting firms. The empirical results show that after the implementation of the new EPL, heavy-polluting firms increase greenwashing behaviors substantially compared to non-heavy-polluting firms, which remains consistent with robustness tests. Moreover, we investigate the boundary conditions of the main effect and find that government subsidies strength the greenwashing after EPL but slack resources diminish the impact of EPL on greenwashing. Besides, we explore how the heterogeneous firm characteristics, diversification, ownership concentration, and firm size, influence the greenwashing in heavy-polluting firms.
This paper makes contributions to existing literature in two aspects. Firstly, it enriches the literature on how firms respond to environmental regulations. Previous studies have mainly focus on positive reactions of firms when facing environmental regulations, such as green innovation [8,9,19], total factor productivity growth [17,28], ESG enhancement [29], etc. However, this paper pays attention to the negative reactions of firms. When the regulations conflict with the growth goals of firms, they may choose negative strategies like greenwashing. Secondly, this paper advances the understanding of the motivations behind firm greenwashing. Existing literature discusses the motivations for greenwashing in terms of market opportunities [30], government policies [27,31,32], and firm characteristics [33,34]. Although previous literature has concentrated on macro-level policies, we provide a deeper examination of the impact of the new environmental regulations on greenwashing through internal and external resource perspective.

2. Theory and Hypothesis Development

2.1. EPL and Greenwashing

Institutional theory points out that firms will be influenced by the institutional environment. When making decisions, firms will consider the requirements of the institutional environment and comply with the expectations and regulations of external institutions to ensure their legitimacy [35]. Although it may not necessarily promote economic performance within the firm, it can help to obtain and enhance its legitimacy, thereby obtaining the resources for firms [36,37,38]. Government regulation is an important element of the institutional environment [39], and the new EPL, as a law, is a government regulation that firms need to face. Hence, firms will choose to avoid the risks of violating EPL and actively take measures to improve their legitimacy.
Based on EPL, firms are obligated to disclose environmental information. Previous literature has shown that the greater the institutional pressure faced by firms, the higher the level of environmental information disclosure [40,41]. However, environmental disclosure is the result of political and social pressures [42,43]. To uphold legitimacy or meet stakeholders’ expectations, firms may provide deceptive environmental information [44,45,46], which leads to greenwashing. Additionally, the new EPL focuses on heavy-polluting firms, which are the objects to stricter environmental regulations. The law recommends that firms need the utilization of clean energy and integrate technologies and equipment characterized by high resource utilization rates and low pollutant emissions. Furthermore, the law encourages the integrated use of waste and the use of harmless treatment technologies for pollutants. Additionally, an elimination system has been instituted for processes, equipment, and products causing substantial environmental pollution. When facing strict legal requirements, heavy-polluting firms may adopt two strategies: one is to exit the heavy-polluting industry to avoid being constrained by the law; the other is to actively comply with the regulations to gain legitimacy in the institutional environment, which is discussed in this paper. Nevertheless, neoclassical economic theory has demonstrated that environmental regulations lead to elevated compliance costs for businesses, which goes against the goal of maximizing profits [47]. This has led firms to be unwilling to take substantive environmental actions, but only beautify their external communications through greenwashing. We therefore propose the following:
Hypothesis 1.
After the introduction of the new EPL, the degree of greenwashing in heavy-polluting firms increases.

2.2. EPL, Government Subsidy and Greenwashing

The existing literature suggests that government subsidies are a major source of resources [48]. Firms with more government subsidies can effectively alleviate their financing pressure and positively influence their innovation activities [49,50,51], while counteracting the risks of innovation activities [52]. In addition, government subsidies can be regarded as a signal [53]. Government subsidies can help firms label themselves as authenticated, release positive signals to the market, and attract more external resources to supplement their own lack of resources [54,55,56]. Some scholars have found that government subsidies can promote firms to cooperate with external resources and thus enhance their own competitiveness [56,57]. From these two perspectives, government subsidies are a way for firms to access external resources. Firms with more government subsidies, after tasting the sweetness brought by the subsidies, will hope to continue receiving them in order to stimulate their growth.
The new EPL not only establishes a punishment mechanism, but also provide incentives to promote and assist companies in further reducing pollution emissions, which including fiscal, tax, price, and government procurement policies and measures. Firms can expect that after the implementation of EPL, there will be a large number of government subsidies related to the environment, coordinating with EPL to solve environmental issues. Heavy-polluting firms that have enjoyed government subsidies want to continue the benefits of government subsidies. Because of the information asymmetry between the subsidy policy makers and firms, firms may cheat on subsidies through false information. As a result, firms will exaggerate their external communication on positive environmental performance, triggering greenwash. Here, we propose the following:
Hypothesis 2a.
Government subsidies enhance the greenwashing of heavy-polluting firms after the implementation of the new EPL.

2.3. EPL, Slack Resources and Greenwashing

Slack resources refer to the resources that are more than necessary for firm production and operation, which can be used directly or indirectly in the future [58]. Organization theory suggests that slack resources provide a resource buffer and support for firms to adapt to internal development and external challenges, assisting firms make strategic adjustments according to the external environment [59,60]. When companies confront the implications of the EPL, slack resources can be used to address external pressures promptly, which can provide a buffer for the firm to find the best solution. As slack resources increase, the firm’s capacity to develop intricate resources also enhances, supporting the firm solving environmental issues [61,62]. Many studies have found that slack resources provide greater flexibility for firms to implement green innovations [63], enhance their ability to explore new opportunities [64], and buffer them from the negative consequences of failed innovations [65].
The implementation of the EPL has forced heavy-polluting firms to consider green innovations. Heavy-polluting firms with sufficient slack resources can respond to legal requirements and make substantive improvements. Furthermore, heavy-polluting firms with slack resources are less dependent on external resources and do not need to acquire them by faking legitimacy. For firms lack of slack resources, on the one hand, in order to maintain the normal operation, firms need to seek external resource for accumulation [66]. On the other hand, only when the accumulation of slack resources exceeds a certain level, firms are willing to spend their energy and time in acquiring resources to be used in green activities required by EPL [22]. Therefore, heavy-polluting firms with scarce slack resources engage in symbolic environmental communication with stakeholders without substantive changes, leading to greenwashing increase. Here, we introduce the following:
Hypothesis 2b.
Slack resources diminish the greenwashing of heavy-polluting firms after the implementation of the new EPL.

3. Data and Methodology

3.1. Data Sources

We use data on listed firms in China’s A-share market from the China Stock Market and Accounting Research Database (CSMAR, https://data.csmar.com/, accessed on 12 August 2023), a widely used database containing information on listed firms in China. We select the basic information and financial data of Shanghai and Shenzhen stock markets from 2011 to 2020, a time window that encompass 4 years before the policy shock and 6 years after. Except for year restriction, we exclude data that (1) firms belong to financial industry, and (2) firms belong to special treatment (ST). Following Zhang [32], we measure greenwashing through regarding ESG index in Bloomberg database as ESG disclosure score (https://www.bloombergchina.com/global-environmental-social-governance-data/, accessed on 31 August 2023), which represents the symbolic communication and ESG rating in Sino-Securities Index Information Service (Huazheng ESG, https://www.chindices.com/esg-data.html, accessed on 6 September 2023) as ESG performance score, regarding as the substantive performance. Finally, we obtain a sample with 9283 firm-year observations.

3.2. Variables

3.2.1. Dependent Variable

This paper defines greenwashing as a specific strategy adopted by firms to only engage in communication on environmental issues, without substantively addressing these issues through concrete actions [26,67]. According to the existing literature, greenwashing is measured following [33], where the disclosure score and performance score are centered separately to make the difference, as described in Equation (1). In the equation, the ESG disclosing score represents the firm’s inflated achievements, whereas the ESG performance score reflects the actual enhancements in environmental performance. Bloomberg ESG score reflects the amount of data disclosed to the public by firms, and whether the disclosed information is positive or negative is less important. The higher the amount of non-financial information disclosed, the higher the firm’s Bloomberg ESG score, which is consistent with the connotations of symbolic environmental communication. However, the Huazheng ESG score focuses on ESG performance, with higher values indicating better performance [33]. Given the distinct scoring methods applied to these two ESG database, normalization is employed to facilitate an effective comparison between them.
G r e e n w a s h i n g i t = E S G D i s i t E S G D i s ¯ σ E S G D i s E S G P e r i t E S G P e r ¯ σ E S G P e r

3.2.2. Independent Variables

Because the new EPL came into effect on the first day of 2015, the dummy variable Post equals 1 in and after the years 2015, and 0 otherwise. The treatment group and control group are divided based on the industry that the firm belongs to. In accordance with the Guidelines for Classifications of Listed Firms (Amended in 2012), we identify firms belonging to the 19 industry codes as heavy-polluting firms [17], shown in Table 1, which constitute the treatment group, while the remaining firms in sample are classified as the control group. The variable Treat equals 1 if the firm belong to heavy-polluting industries, and 0 otherwise. The multiplication Post × Treat captures the net effect of the new EPL on heavy-polluting firms.

3.2.3. Moderator Variables

Government subsidy. We aggregate the amounts of various government subsidies received by listed firms and take the logarithm of the total as a measurement of subsidies.
Slack resources. There are various ways to measure slack resources for a firm. We adopt the measurement proposed by Bourgeois (1981) based on financial ratios [64]. The liquidity ratio is measured for slack resources, where the equation is as follows.
S l a c k i t = C u r r e n t   A s s e t i t C u r r e n t   L i a b i l i t y i t

3.2.4. Control Variables

Following the previous literature, we control for a range of variables that may affect the firm’s greenwashing. Firm size (Size) is measured using the logarithm of assets. Total asset growth rate (AssGr) is controlled for the growth of the firm. Tobin’s Q (TobinQ) is controlled for the profitability of the firm. Broad size (BroSiz), proportion of independent directors (IndDirPro) and ownership concentration (OwnCon) affect the efficiency and manner of decision making, where the ownership concentration is measured as the share of top 3 holders. Fixed asset ratio (FixAss) and leverage (Lev) to control the liquidity of the firm. The ownership (SOE) is introduced to control the behavior under different types. Also, we control the firm and year fixed effects.

3.3. Model

3.3.1. DID Model

To capture the effect between EPL and greenwashing behavior in heavy-polluting firms, we adopt a differences-in-differences (DID) model to identify our hypothesis. The basic regression equation is shown as follows.
G r e e n w a s h i n g i t = β 0 + β 1 P o s t t × T r e a t i + X i t γ + δ t + τ i + ε i t
where subscript i and t denote firm and time, respectively. P o s t t represents whether the EPL is implemented, T r e a t i represents whether the firm belongs to heavy-polluting industries, X i t represents the control variables, δ t represents time fixed effect, τ i represents firm fixed effect, and ε i t is the error term. The software used in this study is Stata MP 17.0.

3.3.2. Parallel Trend Test Model

Parallel trend test is an important premise of using the DID model. The test requires that without policy intervention, the time trend of the treatment group should be the same as that of the control group, which is a key for the accurate estimation of policy effects by the DID method. We run the regression following the equation in the below to catch the trend difference between the treatment group and the control group.
G r e e n w a s h i n g i t = β 0 + β j = 4 10 P o s t j × T r e a t i t + X i t γ + δ t + τ i + ε i t
In Equation (4), P o s t j is a dummy variable related to year. The subscript j equals 0 in the year 2015 due to the enactment of EPL. Thus, P o s t j includes 4 years before EPL ( P o s t 4 , P o s t 3 , P o s t 2 , P o s t 1 ), the EPL year ( P o s t 0 ), and 5 years after EPL ( P o s t 1 , P o s t 2 , P o s t 3 , P o s t 4 , P o s t 5 ). The value of P o s t j equals 1 in the year of the observation while 0 in others. The remaining variables are consistent with those in basic DID model.

3.3.3. Placebo Test Model

Placebo tests are designed to ensure that observed policy effects are not caused by unobservable factors. We conduct 500 random samplings of the DID term (Post × Treat) to form fake treatment groups, which generates 500 new data sets. It is observed whether the kernel density map of the estimator for the DID term is centrally distributed near 0 and whether it deviates significantly from its true value, where the estimated model is the same as the Equation (3).

3.3.4. Expectation Effect Model

The DID approach requires that the policy should be exogenous. If the research objects can foresee the launch of policies, they can respond to the policies in advance, leading to expectation effects [68]. The EPL was voted in in April 2014 and officially implemented in 2015, so the expectation effect may exist. To make our results robust, we introduce the dummy variable Treat2014 in Equation (5) on the base of Equation (3).
G r e e n w a s h i n g i t = β 0 + β 1 P o s t t × T r e a t i + β 2 Y e a r 2014 t × T r e a t i + X i t γ + δ t + τ i + ε i t
Here, Year2014 is the dummy variable that equals 0 if the year is before the launch of the new EPL (i.e., year 2014), and equals 1 in and after 2014.

4. Results

4.1. Basic Results

Descriptive statistics and correlations are presented in Table 2. Table 3 shows the regression results for the DID model. Column (1) provides the results of regressing greenwashing on DID term when fixing the firm and year effects, where coefficient is positive and significant ( β 1 = 0.1243 ,   p < 0.001 ). After inducing the control variables, the coefficient remains positive and significant ( β 1 = 0.1316 ,   p < 0.001 ), supporting H1. We further decompose greenwashing to observe the difference between symbolic and substantive environmental performance addressed by heavy-polluting firms. As shown in columns (3) and (4), the coefficient of Post × Treat is insignificant in regression on ESG performance score ( β 1 = 0.0324 ,   p > 0.1 ), while it is positive and significant ( β 1 = 0.7190 ,   p < 0.001 ) in regressions on ESG disclosure score. The results suggest that heavy-polluting firms have made no substantive changes in environmental issues after the EPL, but simply shown improvement in environmental communication.

4.2. Robustness Tests Results

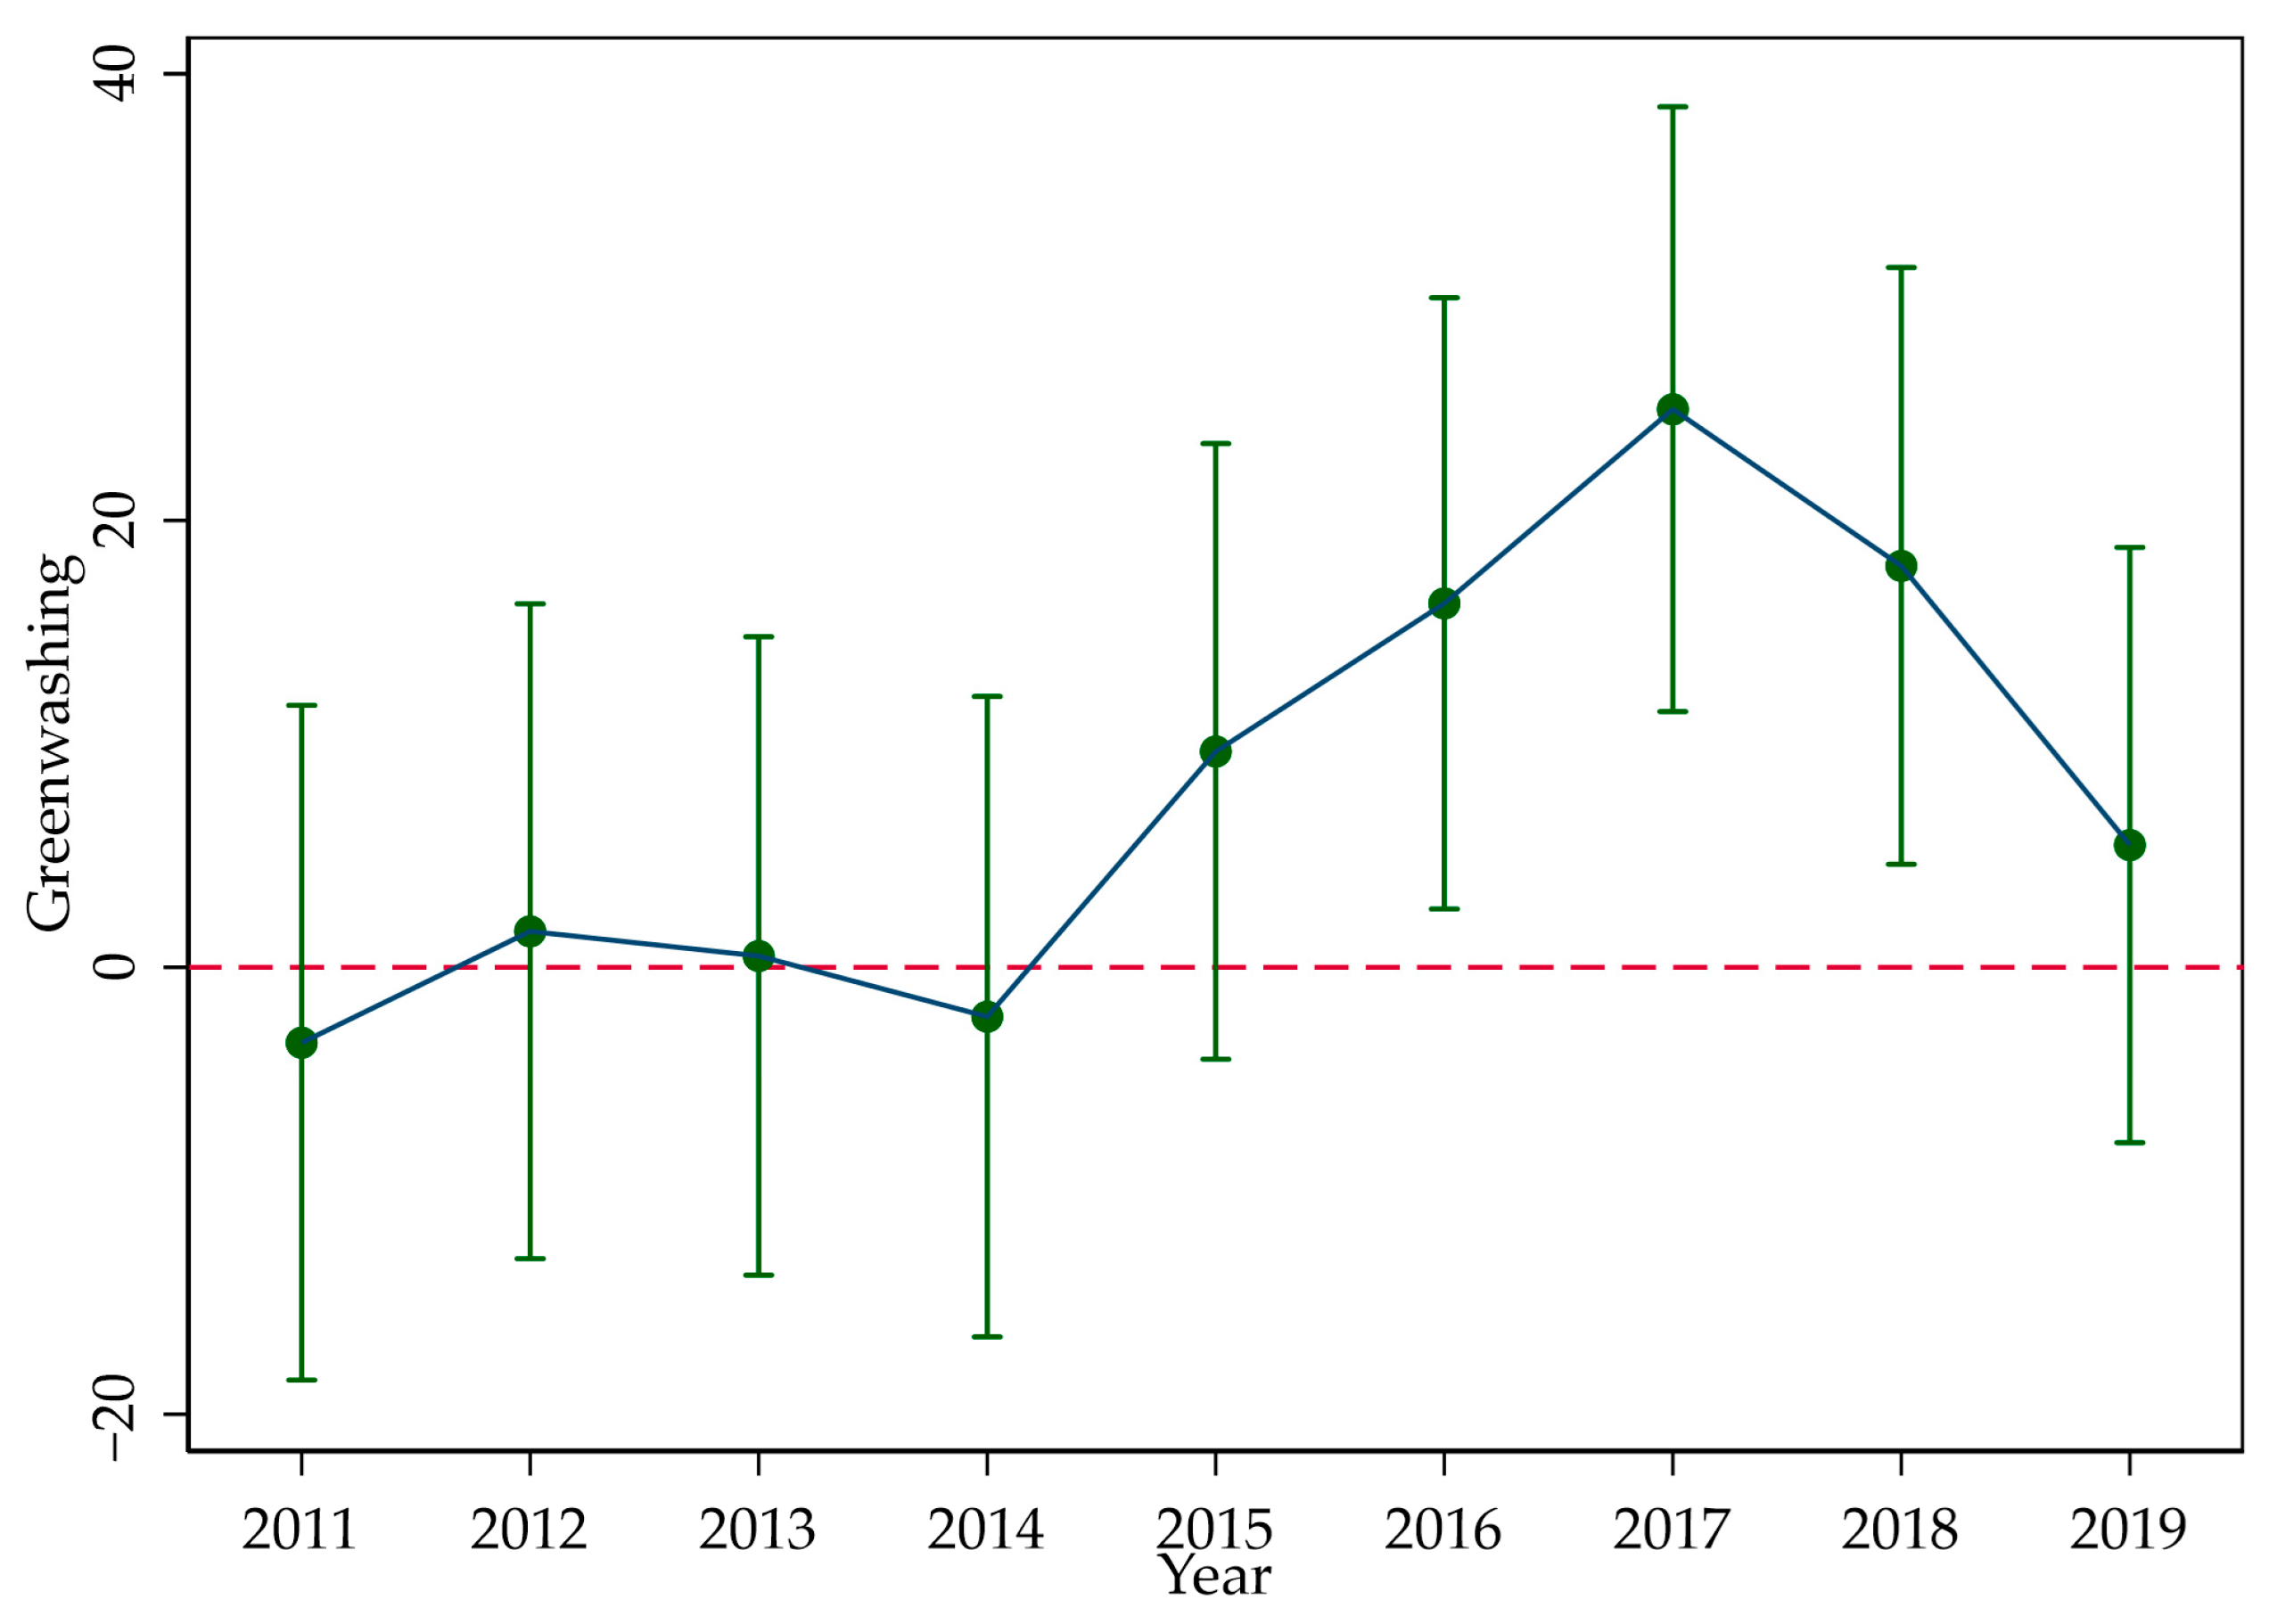
4.2.1. Parallel Trend Assumption

The validity of the DID approach relies on the parallel trend assumption, so we conduct a test on it. We add interaction terms between the year dummies and the treatment group in the regression as Equation (4) to observe if the coefficients of the interaction terms are significant before the treated time. As shown in Figure 1, the coefficients of the interaction terms are insignificant from 2011 to 2015, become significant from 2016 to 2018, and then turn insignificant in 2019. From 2011 to 2014, before the implementation of the EPL, the insignificant coefficients indicate that parallel trend assumption is met. In 2015, which was the first year of EPL implementation, heavy-polluting firms did not respond to the law in a timely manner, resulting in an insignificant policy effect. As time passed, the impact of EPL decreased, leading to the disappearance of the policy effect in 2019 and an insignificant coefficient.

4.2.2. PSM-DID

The assumption of DID approach is that the selection of treatment and control groups is randomized, illustrating that the features of treatment and control groups should be approximately the same. However, since the treatment and control groups in this research belong to different industries, the selection of the subjects is not random, which may lead to selection bias. To solve this problem, we apply Propensity Score Matching (PSM) to match two groups through control variables. After 1:1 matching with Equation (3), we obtain the coefficient of Post × Treat in column (1) of Table 4 in the same regression with Equation (3) ( β 1 = 0.1327 ,   p < 0.001 ), showing that the effect is the same as basic regression.

4.2.3. Placebo Test

We randomly sample the interaction term Post × Treat to form a fake treatment group and obtain the placebo experimental results by repeating the operation 500 times. The coefficient results obtained from each sampling are shown in Figure 2. It can be seen that the values of the coefficients are close to 0 and follow a normal distribution, ranging from −0.1 to 0.1, which is significantly smaller than the baseline coefficient of 0.1316. Therefore, it can be ruled out that the baseline results in this paper are caused by unobservable factors.

4.2.4. Other Robustness Tests

  • Shorten time window
We shorten the sample period and use the data from 2013 to 2017, with the aim of better observing the effect after the implementation of the policy, which also excludes the influence of other potential factors. By limiting the time window, we can more accurately estimate the policy effect and test the robustness of the model with Equation (3). As shown in column (2) of Table 4, the coefficient of Post × Treat remains positive and significant ( β 1 = 0.1612 ,   p < 0.001 ), consistent with the results of the baseline regression.
2.
Expectation effect
In order to ensure the validity of DID estimation, we test whether the firms have the expected effect through Equation (5). The coefficients of Treat2014 are insignificant in columns (3)–(5) of Table 4, while the coefficients of Post × Treat in the regression for greenwashing ( β 1 = 0.1448 ,   p < 0.05 ) and disclosure ESG ( β 1 = 0.5054 ,   p < 0.1 ) are significantly positive, which are the same as the baseline results, suggesting that the expectation effect does not exist. The release of EPL does not cause heavy-polluting firms to take actions in advance, either through green innovations or misleading communication. Thus, our results are robust.

4.3. Moderate Effect

This paper studies the moderating effect of government subsidies and slack resources by groups. Taking the median as the boundary, we divide Subsidy and Slack into high- and low-level groups at median and conduct regression based on Equation (3). Columns (1) and (2) in Table 5 show the results of the low-level subsidy group and the high-level subsidy group, respectively. The coefficient of Post × Treat in the low-level group is insignificant ( β 1 = 0.0700 , p > 0.1 ), while the coefficient of Post × Treat in the high-level group is positive and significant ( β 1 = 0.2440 ,   p < 0.01 ), indicating that firms with more government subsidies will undergo more greenwashing after EPL, which is consistent with Hypothesis 2a. Columns (3) and (4) provide the results of firms with low- and high-level slack resources. The coefficient in the low-level group is positive and significant ( β 1 = 0.1407 , p < 0.1 ), while the coefficient in the high-level group is insignificant ( β 1 = 0.0506 , p > 0.1 ), indicating that firms with insufficient slack resources are more likely to undergo greenwashing after EPL, supporting Hypothesis 2b.

4.4. Heterogeneity Analyses

We further investigate how heavy-polluting firms with different features would behave differently in terms of greenwashing after EPL. Here we explore three features: diversification degree, ownership concentration, and firm size.

4.4.1. Heterogeneity of Diversification Degree

Refer to Jacquemin and Berry [69], we use the revenue entropy index and the Herfindahl Index to measure firm diversification degree, equations are shown below. Both measure the sum of the share of total revenue of each industry in which the firm operates through different calculations. We group firm diversification degree of the sample at the median and obtain the results displayed in Table 6. The coefficient of Post × Treat is significantly positive for the groups with a high-level of diversification, while the coefficient is insignificant for the group with a low-level of diversification. It can be concluded that heavy-polluting firms with high-level of diversification have higher greenwashing after EPL.
E n t r o p y = p i ln 1 / p i
H H I = p i 2
We believe that there are two reasons for this result. Firstly, diversification increases the transaction costs of firms. As firms’ business activities are distributed across multiple industries, the uncertainty of the business environment they face rises significantly. The internal transaction, coordination and information costs will also increase accordingly [70]. Secondly, based on the principal-agent theory, managers will blindly expand firm scale in order to expand their power, improve their salary and maintain their reputation, which will involve more investment in various industries, resulting in higher operating costs and financing pressure for firms [71,72,73]. High operating costs and financing pressures make heavy-polluting firms lack the flexibility to respond to the law after EPL launched, and lack the resources for improving their substantive environmental performance. However, due to institutional pressures, heavy-polluting firms with high diversification degree need to cater to the policy by greenwashing to ensure their legitimacy.

4.4.2. Heterogeneity of Ownership Concentration

Ownership concentration is measured in two ways, using the percentage of equity held by the firm’s largest shareholder and the sum of the equity shares of the firm’s top ten shareholders. Table 7 provides the results of the heterogeneity in ownership concentration, columns (1) and (3) show the group with low-level ownership concentration, neither of the coefficients of Post × Treat are significant, while the coefficients of the group with high-level ownership concentration are both significantly positive, implying that heavy-polluting firms with concentrated ownership are more likely to greenwash after EPL.
According to the cost of capital hypothesis, ownership concentration may negatively affect a firm’s abilities of financing and risk management [74]. Because firms rely more on the wealth of controlling shareholders or on internal cash flows, firms with concentrated ownership will be more dependent on these two sources of capital, otherwise they need to find difficult to raise under unfavorable conditions [75]. For heavy-polluting firms with high-level ownership concentration, they face significant financial constraints and cannot respond to EPL through practical actions, as take substantive environmental protection measures requires investment funds, making it more likely for them to engage in greenwashing.

4.4.3. Heterogeneity of Firm Size

Based on the measurement of firm size in control variables using total assets, we introduce a new measurement by taking the logarithm of the firm’s market capitalization [76]. We divide both measurements into small and large groups and conduct regression with Equation (3). The results are presented in Table 8. In both measurements, large firms have significantly positive coefficients of Post × Treat after the implementation of EPL, while small firms do not show significant changes.
Large firms are often the focus of public and regulatory attention. Large firms may be more inclined to carry out greenwashing behaviors to shape a good environmental image and maintain legitimacy, in response to pressure from the public and regulators. In addition, large firms are key support targets of local governments because they can provide more employment opportunities and local taxes revenue [77]. To obtain government support continuously, large firms need to communicate positive environmental performance externally. However, for the substantial environmental performance, compared with small firms, large firms have stronger resource advantages to take environmental protection measures that are in line with their own interests [78], leading to greenwashing.

5. Discussion

5.1. Key Findings

Firms occupy a pivotal position in economic development while also playing a significant role in environmental pollution. Improving environmental issues heavily relies on the environmental performance of them. The EPL is introduced to address China’s environmental challenges, and it proposes numerous environmental governance requirements for firms. However, whether the EPL has truly curbed firms’ polluting behaviors remains to be demonstrated through empirical evidence. This study examines the greenwashing reactions of heavy-polluting firms after EPL from the perspectives of resource dependence theory and resource-based view. It also considers the moderate effects of government subsidies and slack resources, and observes the heterogeneity of diversification, ownership concentration, and firm size.
The greenwashing of heavy-polluting firms increases significantly after EPL. In response to the introduction of this law, heavy-polluting firms are compelled to promote favorable environmental performance to maintain a positive firm image and secure legitimacy with the government and the public [35,43]. However, from a cost perspective, substantial investments are necessary to genuinely improve environmental performance, involving technology upgrades and green innovations [50,51]. Given the profit-oriented nature of firms, there is limited incentive for substantive environmental performance improvements [24]. Therefore, greenwashing becomes a strategic choice for these heavy-polluting firms to deal with the EPL as it allows them to meet government and public expectations without significant financial losses.
Government subsidies have strengthened the greenwashing of heavy-polluting firms in response to EPL. Government subsidies, as an available external resource [48], are something that firms would like to obtain. Based on resource dependence theory, government subsidies are a way for firms to obtain resources that can be regarded as a signal for government endorsement that help firms to win more resources [54,55,56,57]. When making the subsidy list, the government prefers to select firms that abide by the law and meet the government’s expectations. Therefore, after the EPL, firms will be eligible for subsidies by communicating positive environmental performance, but will not necessarily take substantial initiatives.
Slack resources can negatively moderate the effect of EPL on greenwashing of heavy-polluting firms. Firms with abundant slack resources are more resilient when facing the exogenous policy shock [59,60,79]. In the resource-based view, slack resources can become an advantage of the firms, so that they have the ability to take truly effective measures to improve the environmental performance. In this case, the cost of taking substantial environmental measures may be lower than the penalty cost of being caught cheating, resulting in the choice that heavy-polluting firms do not greenwash.

5.2. Implications for Research

Our research has some academic implications. First, we take the EPL as the starting point to deepen the understanding of the coping strategies adopted by firms in the face of environmental regulations. The existing literature has extensively discussed the positive impact of environmental regulation on green innovation and environmental performance of firms [8,9,29,34]. However, from the perspective of institutional theory and resource dependence theory, this research proposes a new angle that when facing formal institutions such as the EPL, firms tend to cater to institutional requirements and actively carry out environmental publicity without making substantial environmental changes. This paper not only discusses the specific impact of EPL on the firm environmental behavior from the micro level, but also enriches the relevant research on the negative impact of environmental regulation.
In addition, we investigate the greenwashing of heavy-polluting firms under formal institutional pressure from an internal and an external perspective. When exploring the moderating factors for environmental regulation impacts, the existing research has considered both internal factors such as financing constraints and ownership [8,19], as well as external factors such as market competition, public supervision, and regional economic development levels [8,9]. This indicates that the greenwashing response of firms is bounded. In our research, the mechanism through internal and external resources is somewhat different. When driven by scarce internal resources, facing with formal institution, firms are more likely to establish legitimacy to further obtain resources, which make them involve in more greenwashing. The mechanism is consistent with previous literature that emphasizes that financing constraints are positively related to greenwashing, which is also explained by resources [27,80,81]. With the temptation of external resources, which firms try to depend on, firms are tempted to minimize the cost to gain the resources, leading to more environmental communication and no substantive changes.

5.3. Implications for Practice

Based on the main findings in this study, there are several practical implications for policy makers and firm managers.
Firstly, the government must reevaluate and reform the enforcement methods and intensity of environmental laws to maintain their efficacy through diverse implementation strategies. Our research reveals that despite the enactment of EPL, there is little substantial environmental changes among heavy-polluting firms remain scarce. This underscores the urgent need for the government to enhance its efforts in effectively enforcing environmental laws. Currently, the penalty for greenwashing is significantly lower than the cost of undertaking substantial environmental measures, creating loopholes for firms to exploit. To address this, the government must ensure that penalties are severe and tangible enough to significantly increase the cost of violating environmental regulations, thus effectively curbing greenwashing practices. Such stringent enforcement not only ensures the effective implementation of environmental policies but also serves as a strong reminder to firms that environmental responsibilities cannot be ignored or taken lightly. This approach not only protects the environment but also promotes sustainable business practices, ensuring that firms prioritize environmental sustainability alongside their economic objectives.
Secondly, the government must establish robust environmental information disclosure systems to address the issue of information asymmetry, which is the foundation for firm greenwashing. Our research compares the disclosure score and performance score, revealing a measure of greenwashing that highlights the characteristics of information asymmetry. Through asymmetry, firms can manipulate or misrepresent their environmental performance, misleading stakeholders and evading accountability. As the steward of environmental regulations, it is imperative for the government to establish stringent environmental information disclosure standards. These standards must ensure that firms provide accurate, comprehensive, and transparent information, which makes stakeholders monitor and evaluate the firm environmental behavior more effectively, reducing the potential for greenwashing. Moreover, the government should foster a culture of environmental accountability among firms by providing incentives for those that proactively disclose their environmental performance. This approach encourages a competitive environment where firms strive to demonstrate their environmental credentials, rather than hiding or misrepresenting their impact.
Thirdly, firms must effectively manage their resource reserves to mitigate the impact of exogenous policy shocks. As an important part of environmental issues, the firm’s respond directly determines whether environmental problems can be effectively improved. When confronted with exogenous policy shocks like EPL, firms require substantial resources and capabilities to comply. Our research demonstrates that firms with abundant slack resources are better positioned to implement the requirements of environmental regulations, thereby making significant contributions to environmental improvement. Hence, firms need to focus on the preparation of resources in daily operation, both internally and externally, in order to keep their firms resilient to contingencies and opportunities, optimizing the internal resources allocation and establishing good public relation.

5.4. Limitaions and Future Research

Despite the contribution of our research, there are also some limitations in our research which can provide future research opportunities.
Firstly, in this study, we demonstrate that firms resort to greenwashing strategies in response to the implementation of EPL. However, the specific forms and contents of greenwashing behaviors have not been categorized. Meanwhile, we measure greenwashing mainly through the extent of information disclosure, but the quality of disclosure is equally crucial. Hence, future research can further differentiate between various types of greenwashing, such as firms exaggerating their environmental achievements, obscuring key information, and diverting public attention. By integrating firm CSR or ESG reports with other textual data sources, a new measurement approach for greenwashing variables from a text perspective can be developed to comprehensively assess greenwashing. The precise classification of these behaviors aids in a more accurate understanding of firms’ greenwashing strategies and provides targeted recommendations for policy makers.
Besides, this study approaches the impact of EPL on greenwashing behavior from a resource perspective. Although financial data have been primarily utilized to measure resources, it is crucial to acknowledge that firm resources extend beyond mere financial metrics. The concept of firm resources encompasses a multifaceted range of non-financial factors, including human resources, technological resources, and organizational resources, etc. These resources also play a significant role in shaping firm greenwashing. Future research can incorporate non-financial resources into the analytical framework to provide a more comprehensive understanding of the mechanism on greenwashing by resources. For instance, the quality of human resources, the degree of technological innovation, and the efficiency of resource allocation within the organization are all potential factors that could influence a firm’s greenwashing practices. By incorporating these factors into the study, we can gain deeper insights into the motivations and strategies behind greenwashing and the role of resources in this process.

6. Conclusions

The EPL implemented in 2015 made a big breakthrough compared to the previous version, and it is a landmark institution for China in environmental governance. This research studies the impact of EPL on the environmental behavior of heavy-polluting firms, and draws the following conclusions.
Firstly, the implementation of EPL positively affects the greenwashing in heavy-polluting firms. However, the impact of EPL has boundaries. Stimulated by government subsidies, firms may intensify greenwashing behavior. Conversely, when slack resources are sufficient, it will weaken the impact of EPL on firm greenwashing. Secondly, the degree of greenwashing varies with the characteristics of the firm. Firms with a high degree of diversification need more resources to support operation, which makes them have more greenwashing behavior after EPL. For firms with high ownership concentration, due to their limited resource sources, they will greenwash more heavily in the face of EPL. Additionally, large firms, motivated by the desire to cultivate a favorable public image, are more likely to engage in greenwashing after EPL.
In the future, the research on greenwashing can categorize firm behaviors from a more detailed perspective and adopt more diversified research materials to uncover the firm greenwashing situation. Also, in the study of greenwashing mechanisms, non-financial factors can be used to more comprehensively expose the motives of greenwashing by firms.

Author Contributions

Conceptualization, Y.Z. and S.C.; methodology, Y.Z.; software, Y.Z.; formal analysis, Y.Z.; data curation, Y.Z.; writing—original draft preparation, Y.Z.; writing—review and editing, Y.L. and D.L.R.; supervision, S.C.; funding acquisition, S.C. All authors have read and agreed to the published version of the manuscript.

Funding

This research was supported by National Natural Science Foundation of China [grant no. 72072132].

Institutional Review Board Statement

Not applicable.

Informed Consent Statement

Not applicable.

Data Availability Statement

There were no new data created, and all data sources have been explained in the article.

Conflicts of Interest

The authors declare no conflicts of interest.

References

  1. Skare, M.; Hasić, T. Corporate Governance, Firm Performance, and Economic Growth—Theoretical Analysis. J. Bus. Econ. Manag. 2016, 17, 35–51. [Google Scholar] [CrossRef]
  2. Mueller, P. Exploring the Knowledge Filter: How Entrepreneurship and University–Industry Relationships Drive Economic Growth. Res. Policy 2006, 35, 1499–1508. [Google Scholar] [CrossRef]
  3. Grossman, G.M.; Krueger, A.B. Economic Growth and the Environment. Q. J. Econ. 1995, 110, 353–377. [Google Scholar] [CrossRef]
  4. Huang, R.-J.; Zhang, Y.; Bozzetti, C.; Ho, K.-F.; Cao, J.-J.; Han, Y.; Daellenbach, K.R.; Slowik, J.G.; Platt, S.M.; Canonaco, F.; et al. High Secondary Aerosol Contribution to Particulate Pollution during Haze Events in China. Nature 2014, 514, 218–222. [Google Scholar] [CrossRef]
  5. Uddin, M.M.M. Revisiting the Impacts of Economic Growth on Environmental Degradation: New Evidence from 115 Countries. Environ. Ecol. Stat. 2021, 28, 153–185. [Google Scholar] [CrossRef]
  6. Yu, Y.; Li, K.; Duan, S.; Song, C. Economic Growth and Environmental Pollution in China: New Evidence from Government Work Reports. Energy Econ. 2023, 124, 106803. [Google Scholar] [CrossRef]
  7. Why Is China’s Smog So Bad? Researchers Point Far Away to a Melting Arctic. Available online: https://www.science.org/content/article/why-china-s-smog-so-bad-researchers-point-far-away-melting-arctic (accessed on 19 February 2024).
  8. Liu, Y.; Wang, A.; Wu, Y. Environmental Regulation and Green Innovation: Evidence from China’s New Environmental Protection Law. J. Clean. Prod. 2021, 297, 126698. [Google Scholar] [CrossRef]
  9. Fang, Z.; Kong, X.; Sensoy, A.; Cui, X.; Cheng, F. Government’s Awareness of Environmental Protection and Corporate Green Innovation: A Natural Experiment from the New Environmental Protection Law in China. Econ. Anal. Policy 2021, 70, 294–312. [Google Scholar] [CrossRef]
  10. Kourula, A.; Moon, J.; Salles-Djelic, M.-L.; Wickert, C. New Roles of Government in the Governance of Business Conduct: Implications for Management and Organizational Research. Organ. Stud. 2019, 40, 1101–1123. [Google Scholar] [CrossRef]
  11. Wang, L.; Wang, C.; Huang, R. Port-Based Supply Chain Decisions Considering Governmental Pollution Tax. Oper. Res. 2022, 22, 4769–4800. [Google Scholar] [CrossRef]
  12. Bosquet, B. Environmental Tax Reform: Does It Work? A Survey of the Empirical Evidence. Ecol. Econ. 2000, 34, 19–32. [Google Scholar] [CrossRef]
  13. Williams, R.C. Growing State–Federal Conflicts in Environmental Policy: The Role of Market-Based Regulation. J. Public Econ. 2012, 96, 1092–1099. [Google Scholar] [CrossRef]
  14. Cole, M.A.; Elliott, R.J.R.; Shimamoto, K. Industrial Characteristics, Environmental Regulations and Air Pollution: An Analysis of the UK Manufacturing Sector. J. Environ. Econ. Manag. 2005, 50, 121–143. [Google Scholar] [CrossRef]
  15. Xiang, D.; Lawley, C. The Impact of British Columbia’s Carbon Tax on Residential Natural Gas Consumption. Energy Econ. 2019, 80, 206–218. [Google Scholar] [CrossRef]
  16. Jia, W.; Xie, R.; Ma, C.; Gong, Z.; Wang, H. Environmental Regulation and Firms’ Emission Reduction—The Policy of Eliminating Backward Production Capacity as a Quasi-Natural Experiment. Energy Econ. 2024, 130, 107271. [Google Scholar] [CrossRef]
  17. Zhou, D.; Qiu, Y.; Wang, M. Does Environmental Regulation Promote Enterprise Profitability? Evidence from the Implementation of China’s Newly Revised Environmental Protection Law. Econ. Model. 2021, 102, 105585. [Google Scholar] [CrossRef]
  18. Shen, C.; Li, S.; Wang, X.; Liao, Z. The Effect of Environmental Policy Tools on Regional Green Innovation: Evidence from China. J. Clean. Prod. 2020, 254, 120122. [Google Scholar] [CrossRef]
  19. Zhang, D. Environmental Regulation, Green Innovation, and Export Product Quality: What Is the Role of Greenwashing? Int. Rev. Financ. Anal. 2022, 83, 102311. [Google Scholar] [CrossRef]
  20. Adomako, S.; Nguyen, N.P. Human Resource Slack, Sustainable Innovation, and Environmental Performance of Small and Medium-Sized Enterprises in Sub-Saharan Africa. Bus. Strategy Environ. 2020, 29, 2984–2994. [Google Scholar] [CrossRef]
  21. Lu, L.-H.; Wong, P.-K. Performance Feedback, Financial Slack and the Innovation Behavior of Firms. Asia Pac. J. Manag. 2019, 36, 1079–1109. [Google Scholar] [CrossRef]
  22. Troilo, G.; De Luca, L.M.; Atuahene-Gima, K. More Innovation with Less? A Strategic Contingency View of Slack Resources, Information Search, and Radical Innovation. J. Prod. Innov. Manag. 2014, 31, 259–277. [Google Scholar] [CrossRef]
  23. Yang, M.; Yuan, Y.; Yang, F.; Patino-Echeverri, D. Effects of Environmental Regulation on Firm Entry and Exit and China’s Industrial Productivity: A New Perspective on the Porter Hypothesis. Environ. Econ. Policy Stud. 2021, 23, 915–944. [Google Scholar] [CrossRef]
  24. Wang, C.; Lin, Y. Does Bargaining Power Mitigate the Relationship between Environmental Regulation and Firm Performance? Evidence from China. J. Clean. Prod. 2022, 331, 129859. [Google Scholar] [CrossRef]
  25. Wang, Q.; Xu, X.; Liang, K. The Impact of Environmental Regulation on Firm Performance: Evidence from the Chinese Cement Industry. J. Environ. Manag. 2021, 299, 113596. [Google Scholar] [CrossRef]
  26. Walker, K.; Wan, F. The Harm of Symbolic Actions and Green-Washing: Corporate Actions and Communications on Environmental Performance and Their Financial Implications. J. Bus. Ethics 2012, 109, 227–242. [Google Scholar] [CrossRef]
  27. Zhang, D. Green Financial System Regulation Shock and Greenwashing Behaviors: Evidence from Chinese Firms. Energy Econ. 2022, 111, 106064. [Google Scholar] [CrossRef]
  28. Cai, W.; Ye, P. How Does Environmental Regulation Influence Enterprises’ Total Factor Productivity? A Quasi-Natural Experiment Based on China’s New Environmental Protection Law. J. Clean. Prod. 2020, 276, 124105. [Google Scholar] [CrossRef]
  29. Lu, S.; Cheng, B. Does Environmental Regulation Affect Firms’ ESG Performance? Evidence from China. Manag. Decis. Econ. 2023, 44, 2004–2009. [Google Scholar] [CrossRef]
  30. Parguel, B.; Benoît-Moreau, F.; Larceneux, F. How Sustainability Ratings Might Deter “Greenwashing”: A Closer Look at Ethical Corporate Communication. J. Bus. Ethics 2011, 102, 15–28. [Google Scholar] [CrossRef]
  31. Hu, S.; Wang, A.; Du, K. Environmental Tax Reform and Greenwashing: Evidence from Chinese Listed Companies. Energy Econ. 2023, 124, 106873. [Google Scholar] [CrossRef]
  32. Zhang, D. Subsidy Expiration and Greenwashing Decision: Is There a Role of Bankruptcy Risk? Energy Econ. 2023, 118, 106530. [Google Scholar] [CrossRef]
  33. Yu, E.P.; Luu, B.V.; Chen, C.H. Greenwashing in Environmental, Social and Governance Disclosures. Res. Int. Bus. Financ. 2020, 52, 101192. [Google Scholar] [CrossRef]
  34. Zhang, D. Are Firms Motivated to Greenwash by Financial Constraints? Evidence from Global Firms’ Data. J. Int. Financ. Manag. Account. 2022, 33, 459–479. [Google Scholar] [CrossRef]
  35. DiMaggio, P.J.; Powell, W.W. The Iron Cage Revisited: Institutional Isomorphism and Collective Rationality in Organizational Fields. Am. Sociol. Rev. 1983, 48, 147. [Google Scholar] [CrossRef]
  36. Scott, W. Institutions and Organizations; Sage: Thousand Oaks, CA, USA, 1995. [Google Scholar]
  37. Peng, L.; Li, Y.; van Essen, M.; Peng, M.W. Institutions, Resources, and Strategic Orientations: A Meta-Analysis. Asia Pac. J. Manag. 2020, 37, 499–529. [Google Scholar] [CrossRef]
  38. Wang, X.; Chen, S.; Wang, Y. The Impact of Corporate Social Responsibility on Speed of OFDI under the Belt and Road Initiative. Sustainability 2023, 15, 8712. [Google Scholar] [CrossRef]
  39. Campbell, J.L. Why Would Corporations Behave in Socially Responsible Ways? An Institutional Theory of Corporate Social Responsibility. Acad. Manag. Rev. 2007, 32, 946–967. [Google Scholar] [CrossRef]
  40. Zeng, S.X.; Xu, X.D.; Yin, H.T.; Tam, C.M. Factors That Drive Chinese Listed Companies in Voluntary Disclosure of Environmental Information. J. Bus. Ethics 2012, 109, 309–321. [Google Scholar] [CrossRef]
  41. Ding, D.; Liu, B.; Chang, M. Carbon Emissions and TCFD Aligned Climate-Related Information Disclosures. J. Bus. Ethics 2023, 182, 967–1001. [Google Scholar] [CrossRef]
  42. Clarkson, P.M.; Li, Y.; Richardson, G.D.; Vasvari, F.P. Revisiting the Relation between Environmental Performance and Environmental Disclosure: An Empirical Analysis. Account. Organ. Soc. 2008, 33, 303–327. [Google Scholar] [CrossRef]
  43. Kong, D.; Liu, J.; Wang, Y.; Zhu, L. Employee Stock Ownership Plans and Corporate Environmental Engagement. J. Bus. Ethics 2024, 189, 177–199. [Google Scholar] [CrossRef]
  44. Lee, M.T.; Raschke, R.L. Stakeholder Legitimacy in Firm Greening and Financial Performance: What about Greenwashing Temptations?☆. J. Bus. Res. 2023, 155, 113393. [Google Scholar] [CrossRef]
  45. Li, F.; Lu, X.; Wang, J. Corporate Social Responsibility and Goodwill Impairment: Evidence from Charitable Donations of Chinese Listed Companies. Available online: https://www.researchgate.net/publication/367409847_Corporate_Social_Responsibility_and_Goodwill_Impairment_Evidence_from_Charitable_Donations_of_Chinese_Listed_Companies (accessed on 15 February 2024).
  46. Pope, S.; Peillex, J.; El Ouadghiri, I.; Gomes, M. Floodlight or Spotlight? Public Attention and the Selective Disclosure of Environmental Information. J. Manag. Stud. 2024. [Google Scholar] [CrossRef]
  47. Gollop, F.M.; Roberts, M.J. Environmental Regulations and Productivity Growth: The Case of Fossil-Fueled Electric Power Generation. J. Polit. Econ. 1983, 91, 654–674. [Google Scholar] [CrossRef]
  48. Ring, P.; Bigley, G.; D’Aunno, T.; Khanna, T. Perspectives on How Governments Matter. Acad. Manag. Rev. 2005, 30, 308–320. [Google Scholar] [CrossRef]
  49. Liu, D.; Chen, T.; Liu, X.; Yu, Y. Do More Subsidies Promote Greater Innovation? Evidence from the Chinese Electronic Manufacturing Industry. Econ. Model. 2019, 80, 441–452. [Google Scholar] [CrossRef]
  50. Kleine, M.; Heite, J.; Huber, L.R. Subsidized R&D Collaboration: The Causal Effect of Innovation Vouchers on Innovation Outcomes. Res. Policy 2022, 51, 104515. [Google Scholar] [CrossRef]
  51. Mulier, K.; Samarin, I. Sector Heterogeneity and Dynamic Effects of Innovation Subsidies: Evidence from Horizon 2020. Res. Policy 2021, 50, 104346. [Google Scholar] [CrossRef]
  52. Květoň, V.; Horák, P. The Effect of Public R&D Subsidies on Firms’ Competitiveness: Regional and Sectoral Specifics in Emerging Innovation Systems. Appl. Geogr. 2018, 94, 119–129. [Google Scholar] [CrossRef]
  53. Chen, J.; Lu, Q.; Heng, C.S.; Tan, B.C.Y. The Signaling Effect of Entrepreneurship Subsidies on Initial Public Offering Investor Valuation: An Anticorruption Campaign as a Quasi-Natural Experiment. Strateg. Entrep. J. 2023, 17, 633–670. [Google Scholar] [CrossRef]
  54. Chen, J.; Heng, C.S.; Tan, B.C.Y.; Lin, Z. The Distinct Signaling Effects of R&D Subsidy and Non-R&D Subsidy on IPO Performance of IT Entrepreneurial Firms in China. Res. Policy 2018, 47, 108–120. [Google Scholar] [CrossRef]
  55. Lerner, J. The Government as Venture Capitalist: The Long-Run Impact of the SBIR Program. J. Bus. 1999, 72, 285–318. [Google Scholar] [CrossRef]
  56. Meuleman, M.; De Maeseneire, W. Do R&D Subsidies Affect SMEs’ Access to External Financing? Res. Policy 2012, 41, 580–591. [Google Scholar] [CrossRef]
  57. Huang, Z.; Liao, G.; Li, Z. Loaning Scale and Government Subsidy for Promoting Green Innovation. Technol. Forecast. Soc. Chang. 2019, 144, 148–156. [Google Scholar] [CrossRef]
  58. Bentley, F.S.; Kehoe, R.R. Give Them Some Slack—They’re Trying to Change! The Benefits of Excess Cash, Excess Employees, and Increased Human Capital in the Strategic Change Context. Acad. Manag. J. 2020, 63, 181–204. [Google Scholar] [CrossRef]
  59. Tan, J.; Peng, M.W. Organizational Slack and Firm Performance during Economic Transitions: Two Studies from an Emerging Economy. Strateg. Manag. J. 2003, 24, 1249–1263. [Google Scholar] [CrossRef]
  60. Donnelly, R.; Purkayastha, S.; Manolova, T.S.; Edelman, L.F. Institutional Distance, Slack Resources, and Foreign Market Entry. J. Int. Bus. Stud. 2023, 55, 194–211. [Google Scholar] [CrossRef]
  61. Khan, S.J.; Mir, A.A. Ambidextrous Culture, Contextual Ambidexterity and New Product Innovations: The Role of Organizational Slack and Environmental Factors. Bus. Strategy Environ. 2019, 28, 652–663. [Google Scholar] [CrossRef]
  62. Modi, S.B.; Cantor, D.E. How Coopetition Influences Environmental Performance: Role of Financial Slack, Leverage, and Leanness. Prod. Oper. Manag. 2021, 30, 2046–2068. [Google Scholar] [CrossRef]
  63. Falco, S.E.D.; Renzi, A. The Role of Sunk Cost and Slack Resources in Innovation: A Conceptual Reading in an Entrepreneurial Perspective. Entrep. Res. J. 2015, 5, 167–179. [Google Scholar] [CrossRef]
  64. Bourgeois, L.J. On the Measurement of Organizational Slack. Acad. Manag. Rev. 1981, 6, 29–39. [Google Scholar] [CrossRef]
  65. Liu, H.; Ding, X.; Guo, H.; Luo, J. How Does Slack Affect Product Innovation in High-Tech Chinese Firms: The Contingent Value of Entrepreneurial Orientation. Asia Pac. J. Manag. 2014, 31, 47–68. [Google Scholar] [CrossRef]
  66. Lin, W.-T. How Do Managers Decide on Internationalization Processes? The Role of Organizational Slack and Performance Feedback. J. World Bus. 2014, 49, 396–408. [Google Scholar] [CrossRef]
  67. Wong, C.W.Y.; Lai, K.-H.; Shang, K.-C.; Lu, C.-S. Uncovering the Value of Green Advertising for Environmental Management Practices. Bus. Strategy Environ. 2014, 23, 117–130. [Google Scholar] [CrossRef]
  68. Tang, K.; Qiu, Y.; Zhou, D. Does Command-and-Control Regulation Promote Green Innovation Performance? Evidence from China’s Industrial Enterprises. Sci. Total Environ. 2020, 712, 136362. [Google Scholar] [CrossRef] [PubMed]
  69. Jacquemin, A.P.; Berry, C.H. Entropy Measure of Diversification and Corporate Growth. J. Ind. Econ. 1979, 27, 359–369. [Google Scholar] [CrossRef]
  70. Song, H.J.; Kang, K.H. The Moderating Effect of CEO Duality on the Relationship between Geographic Diversification and Firm Performance in the US Lodging Industry. Int. J. Contemp. Hosp. Manag. 2019, 31, 1488–1504. [Google Scholar] [CrossRef]
  71. Huang, C.J.; Liao, T.-L.; Chang, Y.-S. Over-Investment, the Marginal Value of Cash Holdings and Corporate Governance. Stud. Econ. Financ. 2015, 32, 204–221. [Google Scholar] [CrossRef]
  72. Thakur, A.; Bhatia, A. Firm-Specific Antecedents Affecting Product Diversification: Evidence from India. Transnatl. Corp. Rev. 2021, 13, 293–306. [Google Scholar] [CrossRef]
  73. Chen, S.; Xu, K.; Nguyen, L.T.; Yu, G. TMT’s Attention towards Financial Goals and Innovation Investment: Evidence from China. Sustainability 2018, 10, 4236. [Google Scholar] [CrossRef]
  74. Wang, K.; Shailer, G. Ownership Concentration and Firm Performance in Emerging Markets: A Meta-Analysis. J. Econ. Surv. 2015, 29, 199–229. [Google Scholar] [CrossRef]
  75. Carney, M.; Gedajlovic, E. The Coupling of Ownership and Control and the Allocation of Financial Resources: Evidence from Hong Kong. J. Manag. Stud. 2002, 39, 123–146. [Google Scholar] [CrossRef]
  76. Chen, J.; Hong, H.; Stein, J.C. Forecasting Crashes: Trading Volume, Past Returns, and Conditional Skewness in Stock Prices. J. Financ. Econ. 2001, 61, 345–381. [Google Scholar] [CrossRef]
  77. Branstetter, L.G.; Li, G.; Ren, M. Picking Winners? Government Subsidies and Firm Productivity in China. J. Comp. Econ. 2023, 51, 1186–1199. [Google Scholar] [CrossRef]
  78. Elsayed, K. Reexamining the Expected Effect of Available Resources and Firm Size on Firm Environmental Orientation: An Empirical Study of UK Firms. J. Bus. Ethics 2006, 65, 297–308. [Google Scholar] [CrossRef]
  79. Huang, W.; Chen, S.; Nguyen, L.T. Corporate Social Responsibility and Organizational Resilience to COVID-19 Crisis: An Empirical Study of Chinese Firms. Sustainability 2020, 12, 8970. [Google Scholar] [CrossRef]
  80. He, F.; Qin, S.; Liu, Y.; Wu, J. CSR and Idiosyncratic Risk: Evidence from ESG Information Disclosure. Finance Res. Lett. 2022, 49, 102936. [Google Scholar] [CrossRef]
  81. He, L.; Liu, R.; Zhong, Z.; Wang, D.; Xia, Y. Can Green Financial Development Promote Renewable Energy Investment Efficiency? A Consideration of Bank Credit. Renew. Energy 2019, 143, 974–984. [Google Scholar] [CrossRef]
Figure 1. Parallel trend test.
Sustainability 16 01782 g001
Figure 2. Placebo test.
Sustainability 16 01782 g002
Table 1. Heavy-polluting industry code.
CodeDescriptionCodeDescription
B6Coal mining and dressing industryC25Industries of petroleum processing, coking, and nuclear fuel processing
B7Oil and natural gas exploitation industry C26Manufacturing of chemical raw materials and chemical products
B8Ferrous metal ore mining and dressing industryC27Pharmaceutical industry
B9Non-ferrous metal ore mining and dressing industryC28Chemical fiber manufacturing
B10Non-metallic ore mining and dressing industryC29Industry of rubber and plastic products
C15Alcohol, beverage and refined tea manufacturingC30Industry of non-metallic mineral products
C17Textile industryC31Industry of ferrous metal smelting and rolling processing
C18Textile garment and apparel industryC32Industry of non-ferrous metal smelting and rolling processing
C19Leathers, furs, feathers and related products and footwear industryD44Industry of electric power and heat production and supply
C22Papermaking and paper product industry
Table 2. Descriptive statistics and correlation.
VariablesObsMeanS.D.(1)(2)(3)(4)(5)(6)
(1) Greenwashing92834.4161.0341.000
(2) ESG_Per928320.866.979−0.596 ***1.000
(3) ESG_Dis92830.01291.1630.588 ***0.298 ***1.000
(4) Inds92830.4760.2020.060 ***0.0030.074 ***1.000
(5) Size92831.9471.5430.224 ***0.187 ***0.454 ***−0.059 ***1.000
(6) AssGr92830.5380.499−0.040 ***−0.007−0.056 ***−0.050 ***0.0011.000
(7) TobinQ928351.0216.30−0.063 ***−0.076 ***−0.151 ***0.034 ***−0.381 ***0.049 ***
(8) BroSiz928337.605.8830.077 ***0.0100.101 ***0.058 ***0.215 ***−0.034 ***
(9) IndDirPro92839.0131.859−0.025 **0.088 ***0.059 ***−0.070 ***0.097 ***0.005
(10) OwnCon92830.1490.5210.107 ***0.070 ***0.199 ***0.0030.315 ***−0.011
(11) FixAss92830.2350.1820.171 ***−0.082 ***0.121 ***0.338 ***0.094 ***−0.113 ***
(12) Lev92830.3350.4720.146 ***−0.026 **0.148 ***−0.102 ***0.499 ***−0.030 ***
(13) SOE928323.111.3500.075 ***0.111 ***0.202 ***−0.027 **0.310 ***−0.091 ***
(14) Sub928116.753.0610.070 ***0.081 ***0.165 ***0.0010.283 ***0.004
(15) Slack91472.0243.553−0.088 ***0.005−0.099 ***0.038 ***−0.209 ***0.019 *
Variables(7)(8)(9)(10)(11)(12)(13)(14)(15)
(7) TobinQ1.000
(8) BroSiz−0.146 ***1.000
(9) IndDirPro0.033 ***−0.396 ***1.000
(10) OwnCon−0.106 ***0.072 ***0.072 ***1.000
(11) FixAss−0.151 ***0.194 ***−0.049 ***0.113 ***1.000
(12) Lev−0.349 ***0.116 ***0.032 ***0.061 ***0.077 ***1.000
(13) SOE−0.188 ***0.269 ***0.0010.204 ***0.183 ***0.240 ***1.000
(14) Sub−0.098 ***0.043 ***0.038 ***0.056 ***0.048 ***0.096 ***0.0131.000
(15) Slack0.198 ***−0.090 ***0.0050.001−0.176 ***−0.391 ***−0.115 ***−0.082 ***1.000
Notes: *** p < 0.01, ** p < 0.05, * p < 0.1.
Table 3. Baseline regression results.
(1)(2)(3)(4)
VariablesGreenwashingGreenwashingESG
Performance
ESG
Disclosure
Post × Treat0.1243 ***0.1316 ***−0.03240.7190 ***
(0.0355)(0.0357)(0.0319)(0.1656)
Size −0.0598 **0.2910 ***1.5517 ***
(0.0245)(0.0219)(0.1137)
AssGr −0.0289 *0.0188−0.0778
(0.0166)(0.0148)(0.0769)
TobinQ 0.00350.0261 ***0.2028 ***
(0.0083)(0.0074)(0.0386)
BroSiz −0.00820.0031−0.0376
(0.0102)(0.0091)(0.0472)
IndDirPro −0.0099 ***0.0127 ***0.0157
(0.0025)(0.0022)(0.0115)
OwnCon 0.00040.00100.0096
(0.0014)(0.0012)(0.0063)
FixAss 0.3195 ***−0.2619 **0.4984
(0.1231)(0.1102)(0.5715)
Lev 0.5299 ***−0.7592 ***−1.3824 ***
(0.0916)(0.0820)(0.4250)
SOE −0.08900.1504 **0.3882
(0.0670)(0.0600)(0.3108)
Constant−0.01441.5086 ***−2.5673 ***−15.9474 ***
(0.0109)(0.5716)(0.5117)(2.6527)
Firm FEYesYesYesYes
Year FEYesYesYesYes
Observations9276927692769276
R-squared0.64550.64850.64360.7895
Notes: Standard errors in parentheses, *** p < 0.01, ** p < 0.05, * p < 0.1.
Table 4. Robustness results.
(1)(2)(3)(4)(5)
VariablesGreenwashingESG
Performance
ESG
Disclosure
PSM-DID2013–2017Expectation
Effect
Post × Treat0.1327 ***0.1612 ***0.1448 **−0.07760.5054 *
(0.0357)(0.0410)(0.0582)(0.0521)(0.2698)
Treat2014 −0.01670.06200.3030
(0.0629)(0.0563)(0.2917)
Size−0.0530 **−0.0694 *−0.0530 **0.2851 ***1.5598 ***
(0.0248)(0.0418)(0.0248)(0.0222)(0.1151)
AssGr−0.0892 ***0.0441−0.0893 ***0.0786 ***−0.1024
(0.0316)(0.0367)(0.0316)(0.0283)(0.1465)
TobinQ0.0042−0.01420.00410.0259 ***0.2057 ***
(0.0083)(0.0127)(0.0083)(0.0075)(0.0386)
BroSiz−0.0099−0.0201−0.00990.0042−0.0421
(0.0102)(0.0149)(0.0102)(0.0092)(0.0474)
IndDirPro−0.0099 ***−0.0167 ***−0.0099 ***0.0122 ***0.0121
(0.0025)(0.0036)(0.0025)(0.0023)(0.0118)
OwnCon0.00060.00200.00060.00100.0114 *
(0.0014)(0.0020)(0.0014)(0.0012)(0.0063)
FixAss0.2768 **0.29560.2776 **−0.2189 *0.4924
(0.1250)(0.1805)(0.1250)(0.1119)(0.5797)
Lev0.5177 ***0.3469 **0.5171 ***−0.7378 ***−1.3282 ***
(0.0924)(0.1381)(0.0924)(0.0827)(0.4287)
SOE−0.0865−0.1804 *−0.08660.1586 ***0.4611
(0.0675)(0.1084)(0.0675)(0.0604)(0.3130)
Constant1.3751 **2.1268 **1.3784 **−2.4598 ***−16.1459 ***
(0.5785)(0.9730)(0.5786)(0.5179)(2.6833)
Firm FEYesYesYesYesYes
Year FEYesYesYesYesYes
Observations92254577922592259225
R-squared0.64800.76260.64800.64390.7881
Notes: Treat2014 = Year2014 × Treat, and Year2014 is the dummy variable whether the year is before or after the launch of the new EPL (i.e., year 2014). Standard errors in parentheses, *** p < 0.01, ** p < 0.05, * p < 0.1.
Table 5. Moderate effect results.
(1)(2)(3)(4)
VariablesGreenwashing
Low SubsidyHigh SubsidyLow SlackHigh Slack
Post × Treat0.07000.2440 ***0.1407 *0.0506
(0.0751)(0.0938)(0.0835)(0.0898)
Size−0.1299 **−0.1192 *−0.1222 **0.0460
(0.0606)(0.0697)(0.0578)(0.0584)
AssGr−0.0434−0.0117−0.0420 **−0.0684 ***
(0.0345)(0.0318)(0.0207)(0.0254)
TobinQ−0.01010.00270.0533 *−0.0002
(0.0103)(0.0211)(0.0299)(0.0125)
BroSiz0.0021−0.0208−0.0055−0.0098
(0.0210)(0.0228)(0.0222)(0.0236)
IndDirPro−0.0122 **−0.0110 **−0.0051−0.0160 ***
(0.0052)(0.0048)(0.0050)(0.0055)
OwnCon−0.00170.00240.0022−0.0027
(0.0028)(0.0035)(0.0031)(0.0034)
FixAss0.29710.20300.25860.1902
(0.2202)(0.3320)(0.2422)(0.3268)
Lev0.4231 ***0.7548 ***0.3784 *0.3913 *
(0.1531)(0.2304)(0.2133)(0.2079)
SOE−0.13490.05730.0958−0.1329
(0.0905)(0.1250)(0.1190)(0.1166)
Constant3.1314 **2.9385 *2.8088 **−0.5670
(1.3839)(1.6783)(1.4060)(1.3368)
Firm FEYesYesYesYes
Year FEYesYesYesYes
Observations4510452544844477
R-squared0.65960.69720.66070.6707
Notes: Standard errors in parentheses, *** p < 0.01, ** p < 0.05, * p < 0.1.
Table 6. Heterogeneity analysis of diversification degree.
(1)(2)(3)(4)
VariablesGreenwashing
High Diversity
HHI
Low Diversity
HHI
Low Diversity
Entropy
High Diversity
Entropy
Post × Treat0.2568 ***0.07750.08010.2548 ***
(0.0984)(0.0805)(0.0805)(0.0985)
Constant1.14091.20901.33041.1235
(1.4521)(1.3821)(1.3608)(1.4604)
ControlsYesYesYesYes
Firm FEYesYesYesYes
Year FEYesYesYesYes
Observations4431441444174434
R-squared0.68150.67750.67710.6804
Notes: Standard errors in parentheses, *** p < 0.01.
Table 7. Heterogeneity analysis of ownership concentration.
(1)(2)(3)(4)
VariablesGreenwashing
Low
Concentration
Largest Holder
High
Concentration
Largest Holder
Low
Concentration
Top 10 Holder
High
Concentration
Top 10 Holder
Post × Treat−0.00160.2462 ***0.07230.1653 *
(0.0859)(0.0869)(0.0814)(0.0867)
Constant2.26881.70634.0084 ***2.4697 *
(1.4480)(1.5328)(1.3718)(1.4711)
ControlsYesYesYesYes
Firm FEYesYesYesYes
Year FEYesYesYesYes
Observations4603460845844568
R-squared0.66030.67610.66210.6919
Notes: Standard errors in parentheses, *** p < 0.01, * p < 0.1.
Table 8. Heterogeneity analysis of firm size.
(1)(2)(3)(4)
VariablesGreenwashing
Small Size Log (Asset)Large Size Log (Asset)Small Size Log (Market Capitalization)Large Size Log (Market Capitalization)
Post × Treat0.00250.2719 ***0.04840.3110 ***
(0.0737)(0.0972)(0.0772)(0.1018)
Constant0.31660.13270.5480−0.2718
(0.4107)(0.4282)(0.4306)(0.4114)
ControlsYesYesYesYes
Firm FEYesYesYesYes
Year FEYesYesYesYes
Observations4576458245534535
R-squared0.63280.69220.63160.7085
Notes: Standard errors in parentheses, *** p < 0.01.
Disclaimer/Publisher’s Note: The statements, opinions and data contained in all publications are solely those of the individual author(s) and contributor(s) and not of MDPI and/or the editor(s). MDPI and/or the editor(s) disclaim responsibility for any injury to people or property resulting from any ideas, methods, instructions or products referred to in the content.

