Article

UAS-Based Thermal Photogrammetry for Microscale Surface Urban Heat Island Intensity Assessment in Support of Sustainable Urban Development (A Case Study of Lyulin Housing Complex, Sofia City, Bulgaria)

1
Department of Geospatial Systems and Technologies, Faculty of Geology and Geography, Sofia University St. Kliment Ohridski, 15 Tsar Osvoboditel Blvd., 1504 Sofia, Bulgaria
2
Department of Landscape Ecology and Environmental Protection, Sofia University St. Kliment Ohridski, 15 Tsar Osvoboditel Blvd., 1504 Sofia, Bulgaria
*
Author to whom correspondence should be addressed.
Sustainability 2024, 16(5), 1766; https://doi.org/10.3390/su16051766
Submission received: 7 January 2024 / Revised: 11 February 2024 / Accepted: 18 February 2024 / Published: 21 February 2024

Abstract

:
The urban heat island (UHI) and its intensity is one of the phenomena that are of determining importance for the comfort of living in cities and their sustainable development in the face of deepening climate change. The study is objectively difficult due to the large dynamics like land cover and the considerable diversity of land use patterns in urban areas. Most of the frequently used research practice approaches provide information with problematic spatial and temporal resolution, making them difficult to apply for sustainable urban planning purposes. This paper proposes to calculate SUHI intensity as the difference between the temperature of a given point within a city and the average minimum temperature of the land cover class with the lowest surface temperatures within the same urban area. The study presents the results of the application of thermal photogrammetry based on the use of unmanned aerial systems (UAS), combined with geographic information systems (GIS), in the study of surface urban heat island intensity (SUHI), at the local level for the largest housing complex in Bulgaria–Lyulin district of the capital of Sofia city. The studies were carried out during a heat wave in July 2023. A difference of 16.5 °C was found between locations with SUHI occurrence and of the peripheral non-build and natural land cover types within the urbanized area. The information benefits of locally addressed data and their direct applicability are discussed to support decision-making processes in the planning and management of urban areas, including their climate adaptation and sustainable development.

1. Introduction

The process of intensive urbanization is accompanied by a continuous densification of geographical space with artificial surfaces and objects, overconcentration of population, economic and social activities [1]. The combination of these circumstances has a direct impact on the formation of urban climate and the energy balance of urban climate systems, which is crucial for their sustainable development [2]. The formation and retention of higher temperatures in urban spaces compared to their neighboring areas is defined as the urban heat island effect. Since the first documented study in this area, conducted by Luke Howard in London [3] in the late 19th century, this phenomenon has been investigated in cities of varying sizes and geographical locations [4,5,6]. Higher ground surface and air temperatures in contact with it increase temperature stress for urban populations which significantly affects overall mortality [7,8]. It increases energy costs for cooling [9], as well as contributes to other environmental problems related to greenhouse gas emissions and other atmospheric pollutants [10]. These effects are likely to be further amplified if climate change intensification is taken into account [11,12,13,14]. In addition to health risks, the cumulative economic costs associated with urban impacts from UHI and climate change effects have been estimated to be 2.6 times higher than those without UHI effects [15]. Therefore, measures to mitigate UHI impacts will also contribute to mitigating urban heat stress, especially in an emerging future with more frequent and stronger extreme heat events due to the interaction between urban climate, heat waves, climate change, and urbanization [16].
For these reasons, mapping and assessing the urban heat island effect has emerged as an important issue in contemporary urban planning, which seeks a higher degree of resilience and the implementation of nature-based solutions aimed at mitigating and adapting to climate change. Intense urbanization coupled with global climate change is likely to lead to an intensification of UHI and the negative consequences of this phenomenon on urban governance, organization and planning, and the health and well-being of urban residents [17]. These issues are increasingly the focus of research interest [18,19], with the number of publications in this area increasing from 22 to 118 between 2010 and 2020 alone [20]. A significant proportion of these studies highlight the need to accurately quantify and spatially parameterize UHI intensity and the factors that determine it. The increasing number of published papers on the UHI effect, especially since 2016, from 48 to 118 publications at that time, highlights the scientific community’s interest in the prevalence of this problem, considering its causes and consequences in several dimensions, such as environmental, social, and economic [20].
This scientific relevance is directly related to the need to promote integrated planning to improve urban climate [21], using appropriate data as a key input [22] to address the challenges posed by this complex phenomenon. Knowledge of the genesis and dynamics of the UHI will contribute to an informed renewal of urban planning approaches and enhance the effectiveness of solutions to organize sustainable urban environments in the process of accelerated adaptation to climate challenges. To do this in the most adequate way possible, a georeferenced information base with high spatial resolution is needed to guide the exploration, mapping, and assessment of this phenomenon, which at the same time reflects the nature of urban areas, which determines the quantitative parameters of the UHI, its intensity and spatial configuration. Currently, there is a deficit of such studies due to the complexity of correctly quantifying and spatializing the occurrence of UHI and the intensity of the phenomenon in different structural parts of urban spaces [23,24,25].
The UHI is a complex geospatial phenomenon that includes at least three main manifestations: (1) within the surface of the urban area and the immediate subsurface urban heat island (SUHI); (2) the immediate atmospheric layer enveloping the city and the buildings, technical infrastructure, and population included within its boundaries; and (3) the boundary region in the suburban space formed along the direction of movement of the prevailing air masses [26]. The intensity and timing of UHI occurrence are derived from the structural characteristics of urban sites—building in compact forms with dense materials of low permeability and high heat capacity. These geographic land use patterns change the natural morphology of the terrain to a complex heterogeneous system and shape geodynamic and atmospheric processes of different natures. They lead to specific climatic regimes with a high degree of spatial variability that differ significantly from the thermal, hydrostatic, and radiative properties of natural landscapes. This situation is further complicated by the high concentration of air pollutants in cities, as well as by anthropogenic thermal emissions into the urban atmosphere, which also contribute synergistically to the formation of artificially created warmer urban spaces.
From an urban planning perspective, the surface urban heat island (SUHI) [27], which can be most directly investigated and mapped, is most often the focus. It is also found that there is a statistically significant positive relationship between SUHI and urban area size, with a doubling of urban area size leading to an increase in SUHI of as much as 0.7 °C [8]. For urban planning purposes, it is necessary to establish the exact parameters of the contribution of different types of territories and sites in urban areas and the influence of their geospatial configurations on the formation and manifestation of the urban heat island. Typically, different approaches, methods, and tools are used to provide information for these purposes, each with different limitations.
Remote sensing methods are the most commonly used in SUHI studies, which are typically performed using land surface temperature (LST) or radiative temperature data obtained by remotely sensing the radiative and thermodynamic properties of urban surfaces (horizontally, obliquely, or vertically) recorded by thermal infrared (TIR) sensors mounted on satellite, airborne, or unmanned platforms or helicopters [28,29]. However, data obtained from these platforms are difficult to apply to studies of the spatiotemporal distribution of ground surface temperature in urban areas at the local (block/neighborhood level). Usually, the main problem in this respect is related, on the one hand, to the relatively low temporal resolution of both satellite data and their temporal resolution and the influence of factors such as cloud cover, for example [30]. All these characteristics of satellite data limit the possibilities for a continuum spatial estimation of SUHI intensity that corresponds to the high spatial dynamics of urban areas. Typically, under the same meteorological conditions, surface and ground air temperatures do not coincide, as the remote sensor captures the longwave radiation from the surface rather than the air temperature recorded by thermometers, which forms the thermal environment in the inhabitable atmospheric layer (urban canopy layer, UCL). Because of the differences in the processes shaping the energy budgets of the two environments, LSTs vary over a much wider range than air temperature [31,32,33,34].
Remotely sensed airborne thermal data (from manned aircraft and helicopters) have a much higher level of detail, allowing for microscale variations in LST between different elements of the urban landscape to be explored. Another significant advantage is that the most appropriate time of day can be chosen to acquire thermal data. However, the disadvantages are related to the very high costs, the complex organization, and the strict flight management rules of manned vehicles. This type of observation is usually combined with ground temperature measurements from fixed and/or mobile weather stations [35,36,37,38]. Mobile sensors mounted on vehicles that drive along predetermined routes are also often used [12,39,40]. For example, Ko et al. [12] used measurement sensors mounted on a mobile platform. However, their study has limitations in determining the general characteristics of the urban thermal environment as it only includes meteorological observations along a specific travel route. Although observation-based methods can obtain accurate measurements, the observations usually are one-dimensional and collected at a single point in time [41,42].
In contrast to all of the above approaches and methods, the use of remote sensing methods based on unmanned aerial vehicles (UAVs) is finding an increasing place in research [25,43,44]. These systems operate at low altitude, have lower cost, greater flexibility and mobility [45]. Equipped with thermal infrared (TIR) spectral sensors mounted on UAVs, the temperature of the monitored area can be rapidly captured in two-dimensional space over an extended period of time and high spatial resolution data can be obtained [25,30,42,44,46,47,48]. As a consequence of these advantages, the UAV-based remote sensing system superimposed with thermal infrared technology has been applied in topographic mapping [49], forestry monitoring [50], precision agriculture [51,52], natural disaster and environmental monitoring [53], etc. In recent years, this technology has also been successfully applied in SUHI reconnaissance at different scales, for different territories, and in various combinations with other sensors and instruments [25,30,54,55,56,57].
At the same time, to adequately assess the effect of SUHI, it is necessary that these data can be combined with detailed information about the underlying land surface, land cover, land use patterns, and urban morphology. Given the typically lower resolution of the UAV thermal sensors, the need for additional surveys to acquire high spatial resolution data using standard photogrammetric sensors, and the small spatial extent of the UAV operation, sampling surveys are often applied, only in certain parts of urban areas, and then spatial interpolation methods are used [25]. Overcoming these limitations involves the use of a new generation of sensors that combine thermographic sensors with photogrammetric cameras, and that use fixed-wing UAVs instead of the more popular multirotor UAV, which have much more limited range and capabilities to operate over longer periods.
Our study is based on the hypothesis that an integrated approach using thermal photogrammetry (combined thermographic and photogrammetric sensors) based on a fixed-wing UAS and standard geospatial processing and analysis methods, can provide adequate quantitative data with high accuracy and spatial resolution for detailed mapping and estimation of SUHI and its magnitude that is understandable and usable for sustainable urban planning purposes. The results of such a combination of urban spatial research methods provide the much needed quantitative and spatially referenced information for selecting appropriate short and long term urban and landscape planning measures to mitigate its effects in a tailored approach to an urban morphostructure. The mapping of results can be used with the importance of a communication tool with stakeholders. Appropriate visualization can help integrate this specialized research information into discussions and decision-making to support sustainable urban management and adaptation to climate change—urban planning of living spaces, health, energy efficiency, and green systems.
To demonstrate the potential of the methodological approach described above, the same has been applied in a study in the largest residential complex of the Bulgarian capital Sofia–Lyulin. This is a typical example of residential complexes of Eastern European cities with large-scale high-rise residential buildings combined with impermeable areas and unstructured green spaces. The results obtained through the proposed methodological approach provide a valuable opportunity to initiate a more detailed discussion on the integrated application of modern geoinformation technologies. This would aid in the provision of information for sustainable planning and management of urban areas, especially in the context of the increasing need to adapt to climate change effectively.

2. Materials and Methods

2.1. Study Area

The subject of the present study is the territory of the housing complex Lyulin, located in the northwestern part of Sofia Municipality (Figure 1). This is the largest residential area in Bulgaria (125 thousand inhabitants, 2023), designed in the 1960s (and built by the mid-1980s) as a relatively self-contained structure with ten micro-districts on an area of 5.7 km2. It is executed in the style of large-panel construction (about 70%), typical for Eastern European cities with a predominance of high-rise residential buildings (over six stories).
The development in the complex is characterized by the creation of sealed zones between the high-rise residential buildings with a tendency towards a steady absorption of more and more empty spaces, which are filled with industrial, commercial, or residential buildings.
The climate of Sofia Municipality is temperate-continental with four seasons, but the regime of climatic elements is strongly influenced by the shape of the Sofia Basin (in which the city of Sofia is located), the altitude (550 m a.s.l.) and the orography of the neighboring chain mountain systems. The average annual temperature of Sofia is 10.3 °C and the average annual precipitation is 612 mm, with a maximum in May–June. The prevailing air mass movement is from the west-northwest. The average temperature of the coldest month is −1.7 °C and of the warmest month 21.2 °C. Temperature inversions and pronounced maximum temperatures are common.
The geographic conditions combined with the morphology of Sofia’s urban structure create the preconditions for the intense occurrence of the UHI effects [44], combined with the retention of pollutants in the ground air, which is a persistent problem for the management of Sofia Municipality [58]. Data over the period 1979 to 2021 show an increasing trend in mean temperatures, particularly clear from 2007 to the present [59]. This is accompanied by more prolonged heat waves, which in the densely urbanized structure of the Lyulin complex increases temperature stress. The frequency of these events is mainly concentrated in July and August but tends to expand towards June and September [59].

2.2. Approach and Methods for SUHI Intensity Calculation

This study proposes an approach to investigate the intensity of SUHI in a local inner-city context with a pragmatic focus: to provide an adequate spatial information base for urban planning and management purposes and to transform urban areas towards a more sustainable development pattern. By this term we mean a scientifically based readiness to adapt effectively to dynamic environmental (climate change) and societal variables (societal needs, access to resources, land use priorities).
The scientific literature on UHI lacks universal criteria for determining UHI intensity [60,61,62,63]. It is usually defined as the temperature difference between urban and non-urban locations (or areas) as shown in Equation (1):
Tu-r = Tu − Tr,
where Tu-r is the UHI intensity, Tu is the urban temperature, and Tr is the rural temperature [64]. For example, this classical approach was applied more than 20 years ago by Lopes et al. [60] in the city of Lisbon, Portugal. Miao et al. [64] defined UHI as the average difference in air temperature between stations inside (i.e., in urban areas) and outside (i.e., in rural areas) the built environment. From a methodological point of view, in this case, the extra-urban location that is used as a reference must be located outside the built urban space or any surface that is modified or sealed in nature, for the anthropogenic heat to be negligible in its energy balance, the sensible and latent heat to be as close as possible to those of the natural cover, and the radiative balance to present albedo and emissivity coefficients that are also similar to those of the natural environment [64].
In the same Lisbon study carried out by Lopes et al. [60] another interpretation of the UHI intensity at one of the locations studied (Iporá) is proposed, where the UHI intensity is calculated as the difference at a given time between the location with the highest temperature (Thigher) and the location with the lowest temperature (Tlower), according to Equation (2):
UHIt0 h → 23 h = Thigher − Tlower
Given the need for accurate spatial information, we believe that, for urban planning and management, SUHI intensity should be examined at a local scale as a direct reflection of the spatial combinations of environmental components and their thermal characteristics in a particular urban place or smaller spatial urban unit (in this case a residential area). This condition requires the provision of high spatial resolution data that allow effective delineation (spatial-topological and semantic) of the major land cover types together with the thermal characteristics of the individual components that form and characterize them. On this basis, we undertake a modification of the classical approach and propose the calculation of the SUHI intensity as a difference between the temperature of each urban location within the urban space under study (residential complex) and the average minimum temperature of the land cover class with the lowest surface temperatures, within that same space, as shown in Equation (3):
SUHI intra-urban intensity = Tn − TaverMIN,
where Tn—is the temperature at the given location, TaverMIN—the average minimum temperatures of the peripheral non-build and natural land cover types within the urbanized area
This approach allows to assess more effectively the degree of intensity of SUHI within a given urban unit, including:
(1)
provides high spatial resolution information within any specific portion of an urban area or spatial urban unit, which is an important necessity in urban planning procedures;
(2)
provide information on the heat load of individual land cover types;
(3)
provide data on the heat load for different spatial combinations of land cover types.
To adequately implement this approach, it is obviously necessary to provide subsurface spatial temperature information that reflects the spatial structure of the area in as much detail as possible. In addition, the study needs to be carried out at a precise and defined time of day when SUHI intensity is high but there is no active solar radiation to bias the thermal load data across land cover types and land use patterns. Its effect is most pronounced in the early evening hours, immediately after active sunshine, under relatively windless and cloudless skies under anticyclonic synoptic conditions. This part of the day offers the best opportunity to maximize the potential for precise determination of micro- and local climate differences between urban areas and their response to UHI [25].
From a technological point of view, this is possible to achieve by using the so-called thermal photogrammetry, which integrates digital photogrammetry with thermal imagery using the SfM (structure from motion) method based on a fixed-wing type UAV. The latter, in contrast to more polar multirotor systems, implies longer flights, with higher speed, which is a necessary condition to provide relatively unified geospatial information about the urban area and the thermal characteristics of its parts and surfaces. For this purpose, a fixed-wing UAV, model eBeeX, manufactured by the company AgEagle Aerial Systems, was used in the present investigation. This type of UAV is the only certified Class A2 platform that can fly over people as well as in beyond constant visual line-of-sight (BVLOS) situations (Figure 2a). To gather the necessary information, the platform is equipped with a dedicated integrated thermal and photogrammetric sensor Duet T, which combines a Flir thermal camera with a S.O.D.A. photogrammetric camera (Figure 2b).
Its use is from key to the quality of the research because it has a synchronized mechanism for performing and directly georeferencing the acquisition and a specially developed algorithm for integrated processing of the data from the two sensors (Figure 3, [65]). In this way, high-spatial-resolution thermal characterization data are simultaneously obtained, as well as data that can be used for the effective spatial differentiation of land cover and the geometric characterization and quantification of radar morphology.
Another advantage of this unmanned aerial vehicle is the ability to orient aerial imagery via GNSS in real-time kinematic (RTK) mode with high accuracy. As a result, the acquired images are georeferenced in the selected coordinate system, with no subsequent calculations required for their orientation and the use of previously measured ground control points, which greatly simplifies the primary and data acquisition process.
The primary data acquisition procedure for this study was conducted over four consecutive days in an anticyclonic situation (40% relative humidity, 1.4 m/sec wind speed) and under conditions of a prolonged and deepening heat wave, between 11 and 14 July 2023. All surveys were conducted immediately after sunset, in the time interval 20:30–22:00. In this case, a heat wave is understood in the classical sense of the World Meteorological Organization (WMO) definition: it is an unusual period of hot weather over a region that lasts at least two consecutive days during the hottest period of the year based on local climatic conditions, with temperature conditions recorded above certain thresholds [66]. The study attempts to build on earlier research by refining the methodological approach and testing it in extreme weather conditions. Previous studies by the team [25] have shown that the average LST in Sofia in August (between 20:00 and 22:00) is estimated at 20.9 °C. LST ranges from 17.2 to 25.1 °C, and the highest maximum LST values are in the range 27.9–30.6 °C.
Considering the short time intervals suitable for collecting the necessary information and the capabilities of the selected UAV, the flights are pre-planned in dedicated software (E-motion platform, Figure 3) to cover the required territory for the predefined time interval. To this end, four blocks of flights were designed for each of the survey days, with each block including the territory to be covered within 90 min intervals (approximately two flights per survey session). All flights are performed in automatic mode, which in turn allows for repetition with the same parameters, which can be used for data accumulation and continuous monitoring.
A total of 8561 individual images were collected for the present investigation, all taken nadir at a height of 120 m above elevation data. Half of the images contain temperature information as pixel values with a spatial resolution of 20 cm/px, and the other half as RGB values with 5 cm/px. These high detail images were then processed using the photogrammetric software “Pix4D mapper, version 4.5.6” to generate high accuracy thermal maps of the study area. The final processing step involved calculating a thermal index for the study area, resulting in a spatially resolved thermal raster map with improved spatial resolution of 5 cm/px based on the RGB images included in the process. The georeferenced raster data allowed the application of statistical methods to extract more detailed information about the temperature in the area, as well as the application of zonal statistics to more accurately estimate the temperature radiated by different surface types. The high spatial resolution of the thermal map enabled the temperature of individual objects to be determined, leading to results not achievable with other types of data at this level of detail.

3. Results

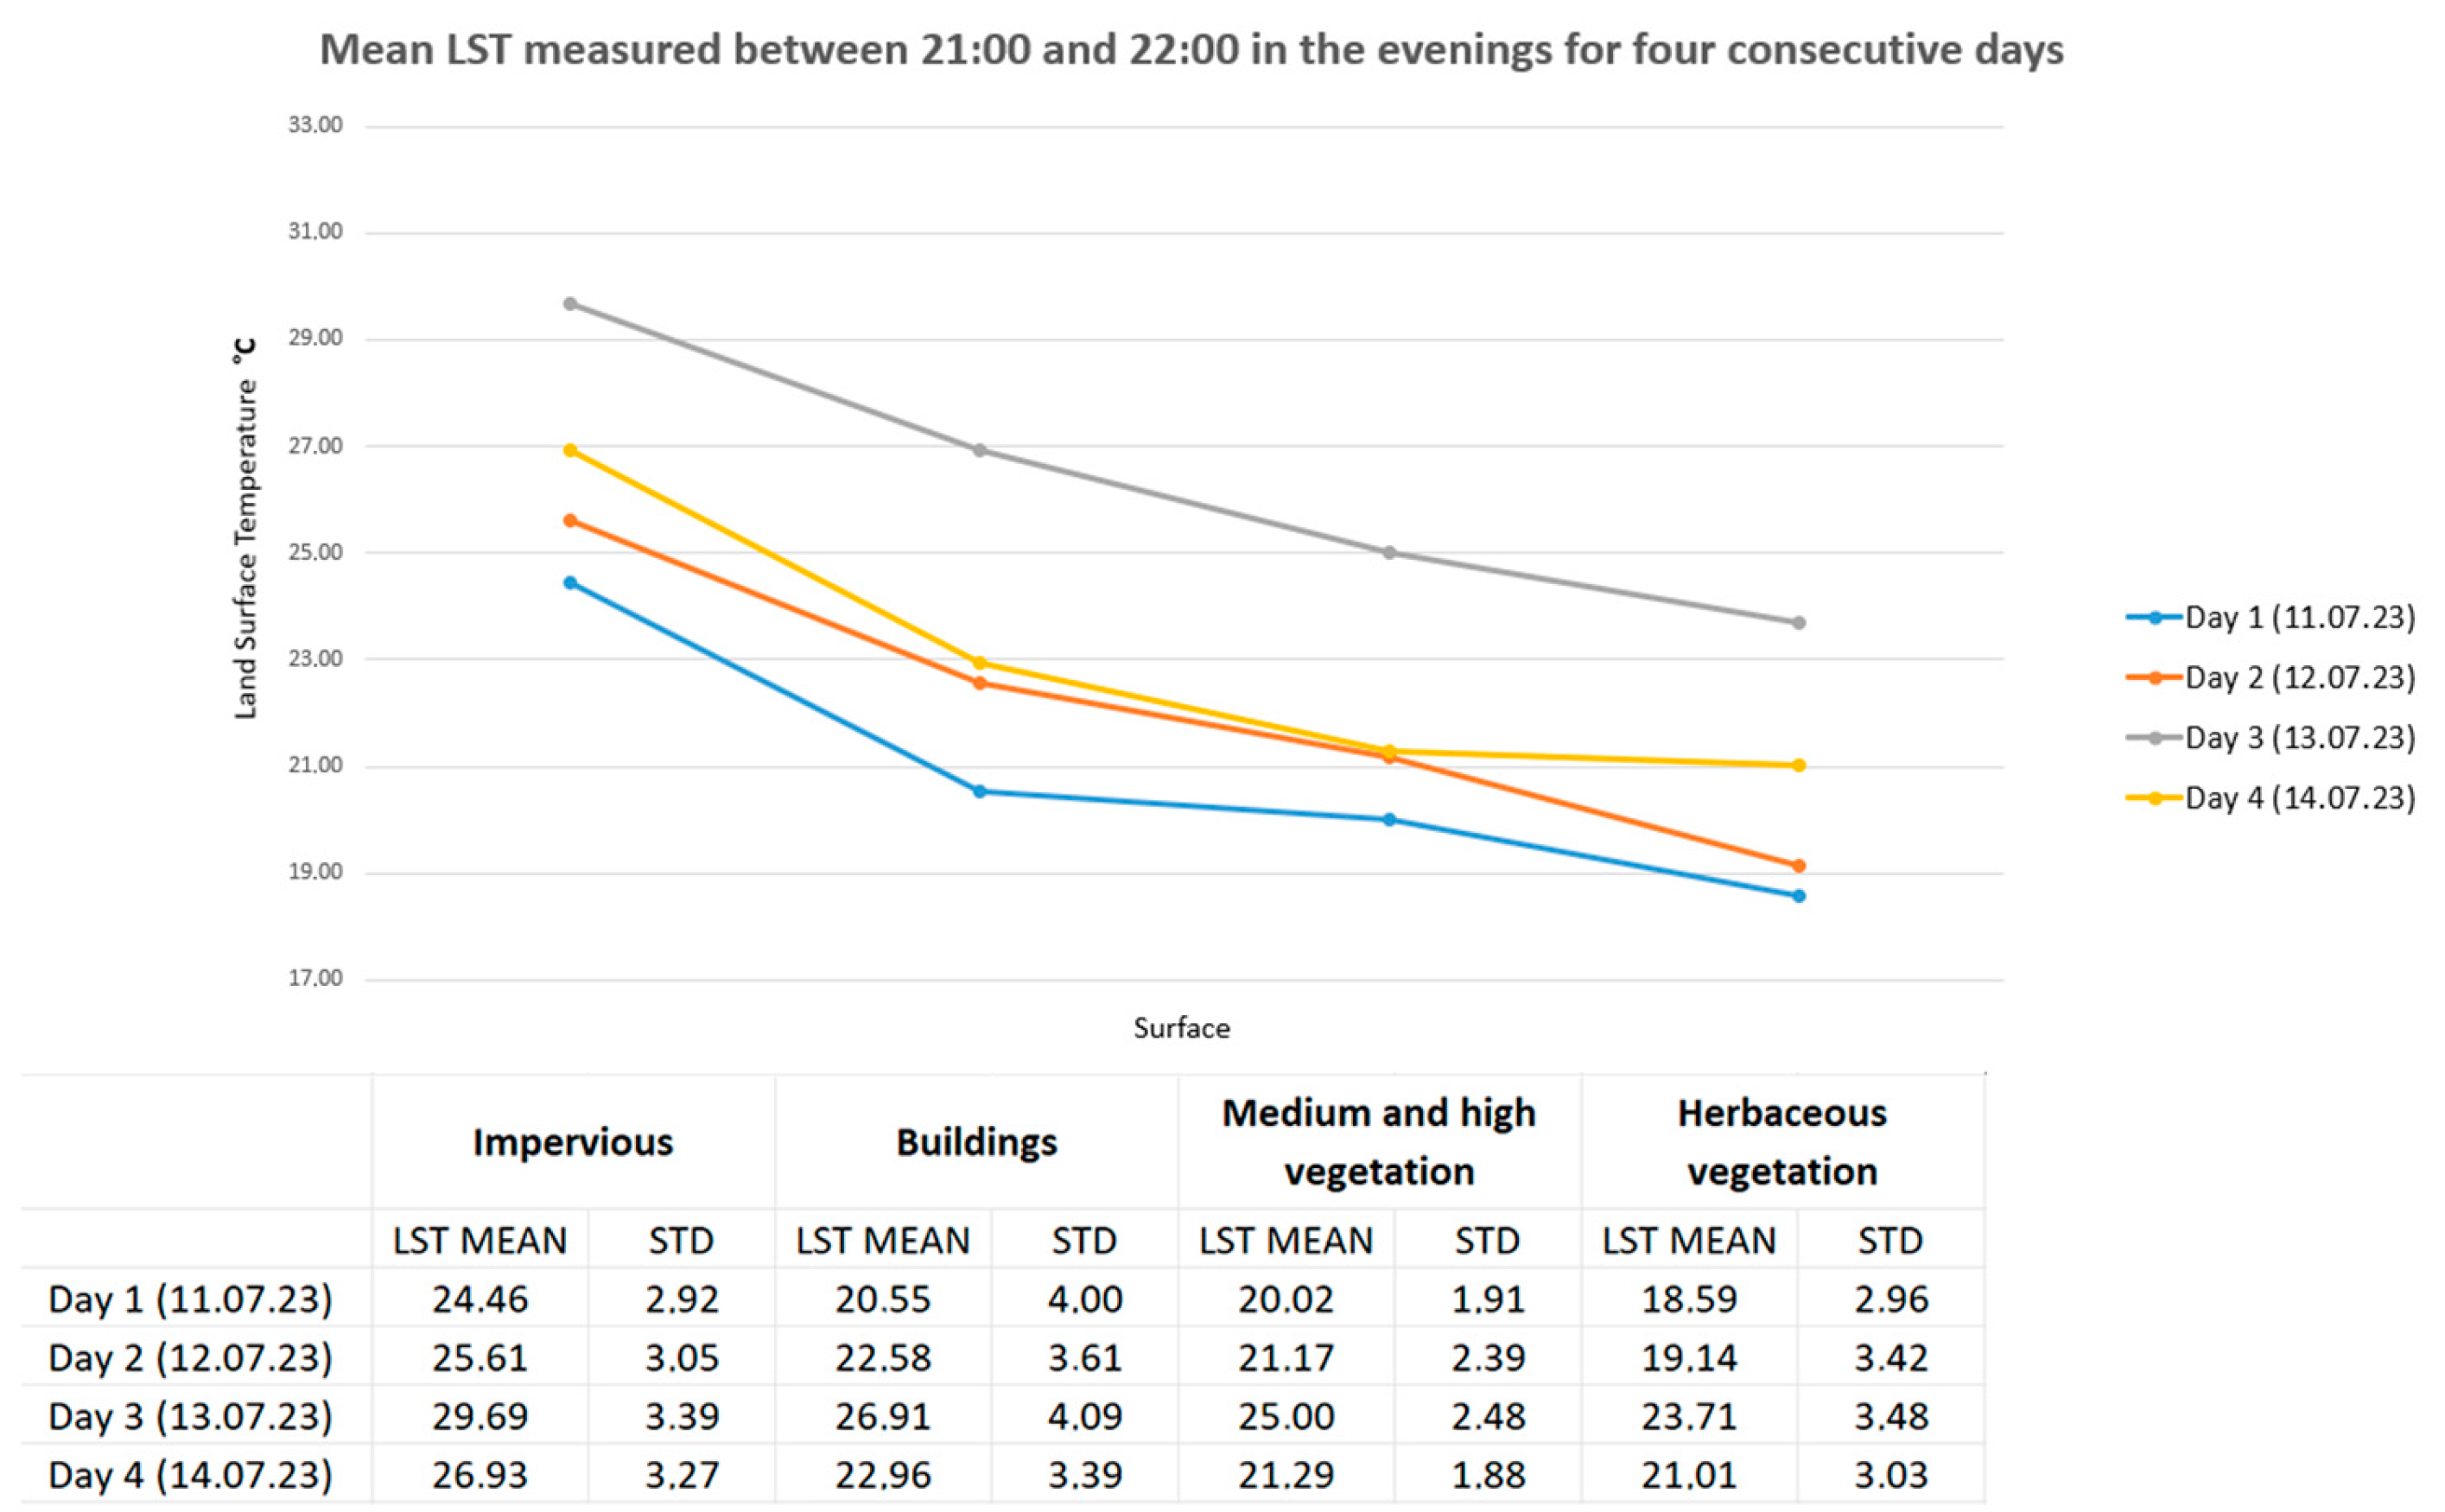
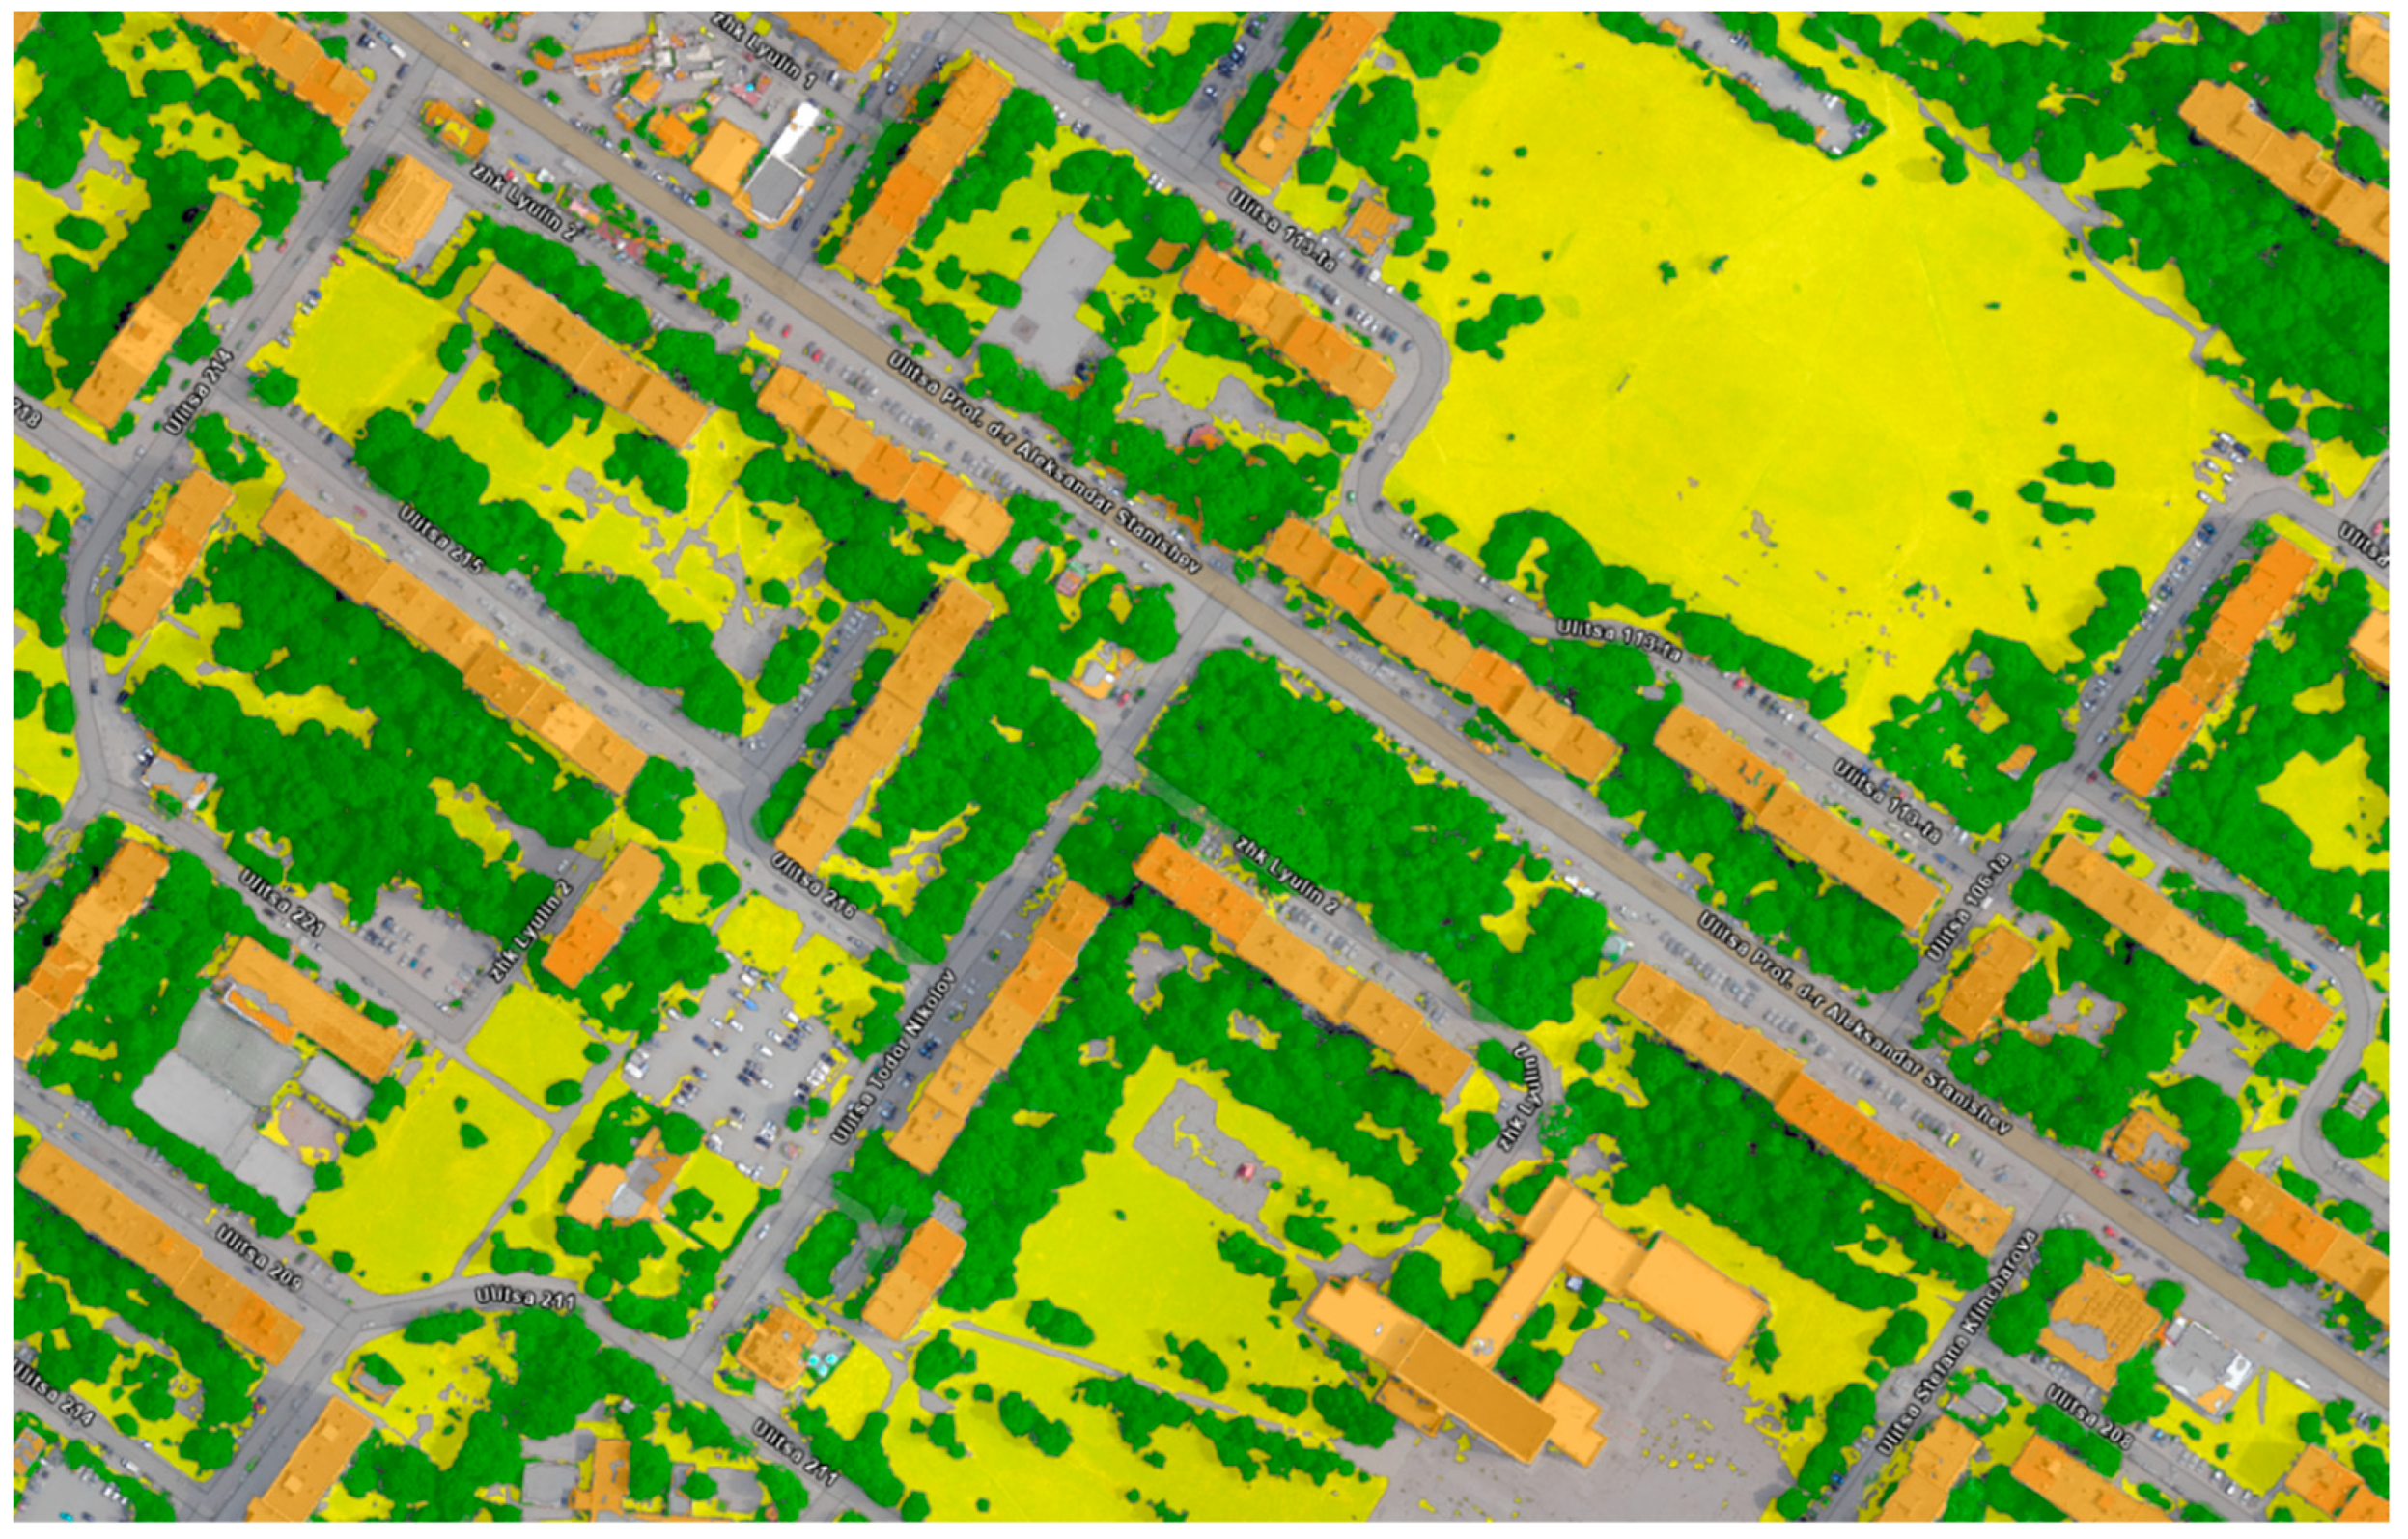
3.1. Geospatial and Thermal Characteristics of Different Land Cover Types Explorations

A complete thermal survey and mapping of the residential area of Lyulin were performed for four consecutive days under the conditions of an ongoing heatwave: 11–14 July 2023. Digital geospatial layers with ground surface temperature data were generated as high spatial resolution raster layers derived from the co-processing of 20 cm/px thermal and 5 cm/px RGB images, allowing the final layers to have a spatial resolution of 5 cm/px. All data were collected in the period immediately after sunset, between 20:30 and 22:00 when the SUHI effect is most pronounced (Figure 4).
In order to establish the geospatial and thermal characteristics of the different land cover types, a classification based on a standard algorithm in the Pix4D mapper platform of the photogrammetrically captured 3D point cloud was performed, separating the main land cover types based on geometric and micrometric characteristics—buildings, sealed surfaces, medium and tall vegetation, herbaceous vegetation.
The classified point cloud was processed in a GIS environment. To perform statistical analysis, the data type was transformed into a vector polygon layer carrying information about the surface types within the study area (Figure 5).
From the resulting vector layers, the percentage coverage of each surface type within the study area was calculated (Table 1). An average building height within the study area was also calculated using the photogrammetric model data—13.37 m.
For the calculation of the mean temperature in the different surface types, a zonal statistic has been applied which summarized the raster values in the zones of another data set and reports the results as a table. Based on this process, statistically calculated values for the mean, standard deviation, and median of the LST at the boundaries of individual surfaces were obtained for each of the thermal imaging days. The data are also presented in a graph (Figure 6) for a clearer visualization of the degree of heating of the different surfaces as well as the temperature differences on the same surface over the four days.
In the results presented in graphical form, it can be seen that although these are consecutive days and the warmest in the selected period, there are differences in the mean temperatures for the same surface types. The third day, 12 July 2023, is identified as the warmest of the four days. The gradual increase in surface temperatures during the first two days is impressive, reaching their highest values in the period of the recording in the evening hours of the third day and weakening in the evening hours of the fourth day, which marks the start of the beginning of the cooling (passing of the heat wave). The graph clearly shows the correlation of the highest averaged values for the land cover types with the sealed surfaces and the lowest values found in the areas mainly occupied by herbaceous vegetation.

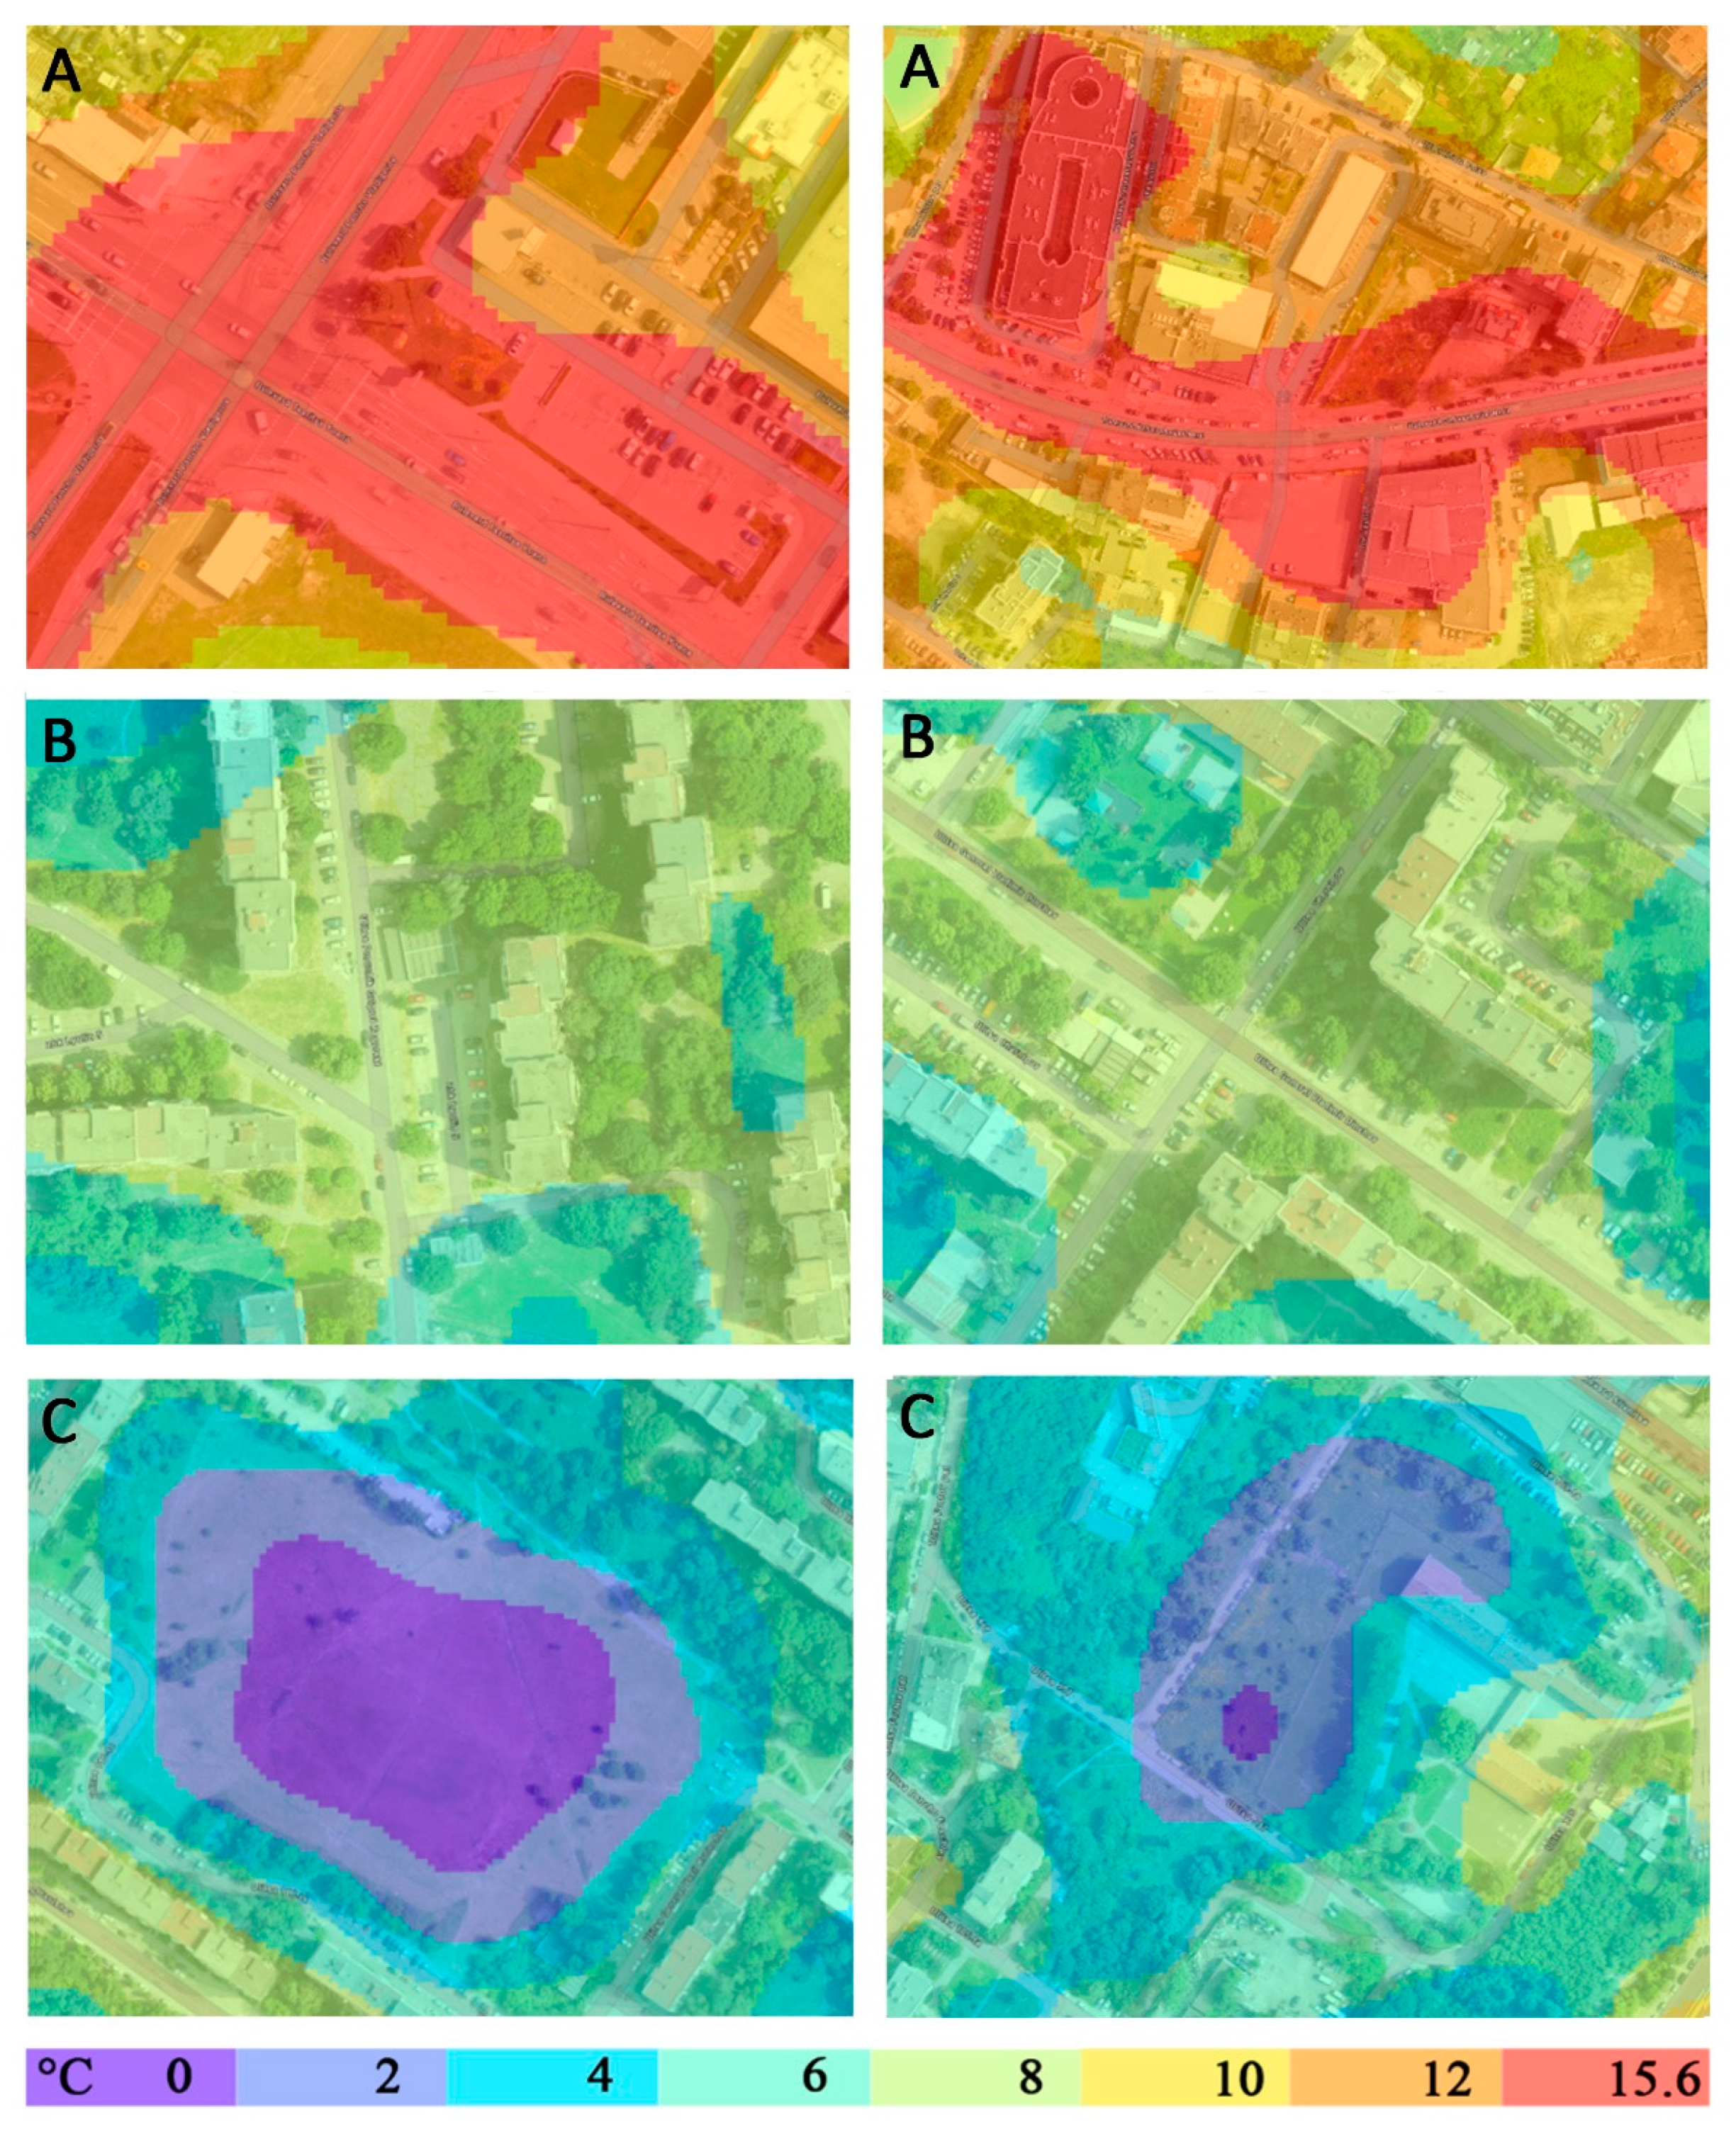
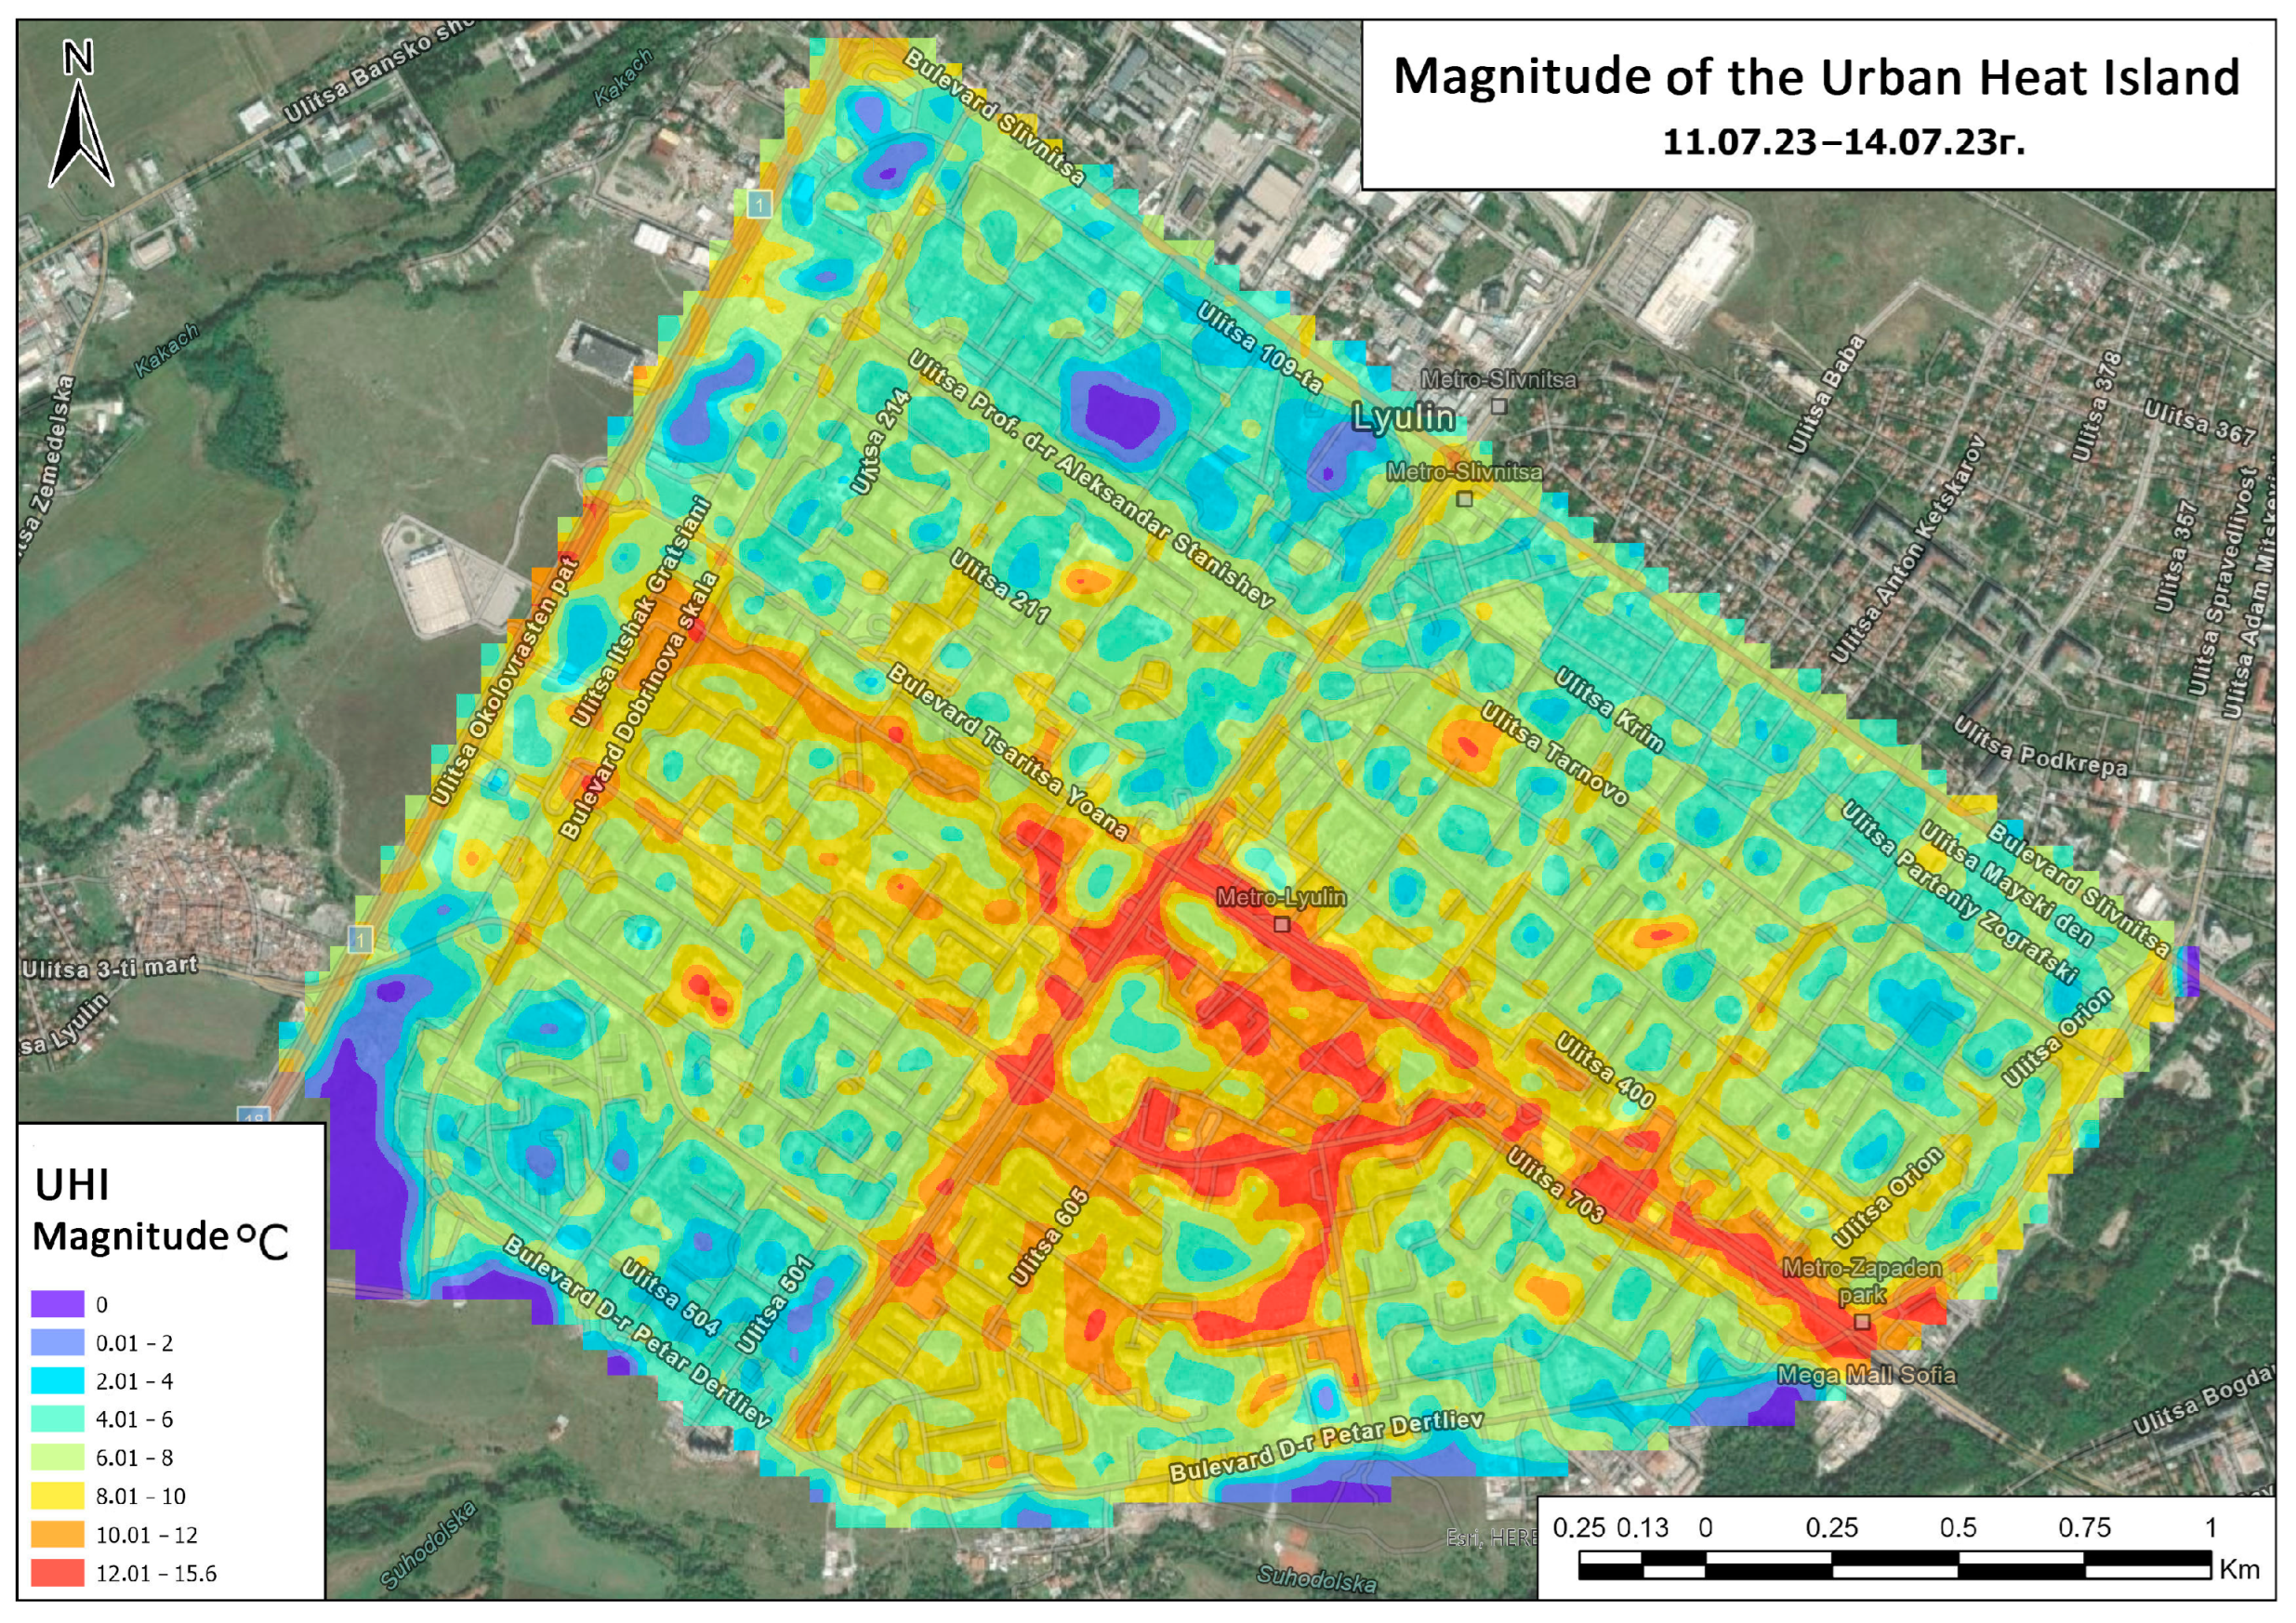
3.2. Calculation of Local SUHI Intensity

For this study, a local SUHI intensity approach has been applied to individual urban units. It is expressed as the difference between the temperature in the relevant part of the urban area and the average minimum temperature of the land cover class that is natural and has the lowest surface temperature values. On this basis, for each of the days of thermal imaging, the parts with minimum temperatures have been separated and averaged for that day (Table 2).
A magnitude was calculated for each of the pixels in the thermal map of the area using the formula presented in the methodological background in Section 2.2. This model (Figure 7) clearly shows a concentration of high-intensity areas within the central area and along the main boulevards in the area, where there is a significant concentration of sealed artificial surfaces.
Land surface temperature values during the study period in these areas reached up to 16 °C higher than the average minimum temperature of the land cover class with the lowest surface temperatures, within that same urban space. Areas that are distant from major boulevards or wide sealed areas have lower magnitude (up to 2–4 °C difference). Transition zones between those with a low proportion of sealed, unnatural surfaces and those with a high proportion of artificial surfaces have 5–8 °C higher land surface temperatures relative to those measured in the land cover class with the lowest surface temperatures.
To represent more clearly some of the morphological features of these areas with differences in SUHI intensity, several fragments with a higher level of detail and spatial resolution have been prepared (Figure 8A–C).

4. Discussion

The UHI is a complex geospatial phenomenon of urban climate, formed under the direct influence of urban morphostructure, dominant architectural solutions, and the functionality of urban space. Remote sensing provides a new perspective to record the phenomenon [25,29,45,67], but there is still the challenge of capturing different aspects of the phenomenon simultaneously and with the necessary level of detail. Unmanned aerial vehicles equipped with appropriate sensors appear to be an effective option for urban surface heat island research, being able to provide high spatial resolution data on the Earth’s surface temperature at appropriate time periods [68,69], and this quite naturally results in an increasing number of investigations [20]. Within this trend is the present research, which applies a methodology that takes into account the specificity and complexity of the phenomenon in a flexible way. By combining two sensors (thermal and photogrammetric), it becomes possible to simultaneously collect thermal information on the subsurface temperature with detailed information on the land cover character and land use pattern, thanks to the choice of the instrument used. Furthermore, by implementing this approach using a fixed-wing UAV, it becomes possible to cover large areas over a relatively short period [70]. This period can be chosen to most efficiently and realistically collect the required data, including immediately after sunset when the influence of active solar radiation is eliminated and when the UHI effect is also relatively more pronounced [71]. Secondly, the approach and technology used in the research is also in response to the needs of practice—urban planning, building technologies, energy strategies, etc., which means providing information with a level of detail applicable to other areas of direct information use. Particularly important for us here is the relationship between urban structure characteristics and the intensity of the SUHI phenomenon—over time and in terms of the total area affected.
Our results provide grounds to argue that the integrated approach allows us to correctly reflect the impact of environmental heterogeneity on the intensity of SUHI occurrence. We see strong potential for incorporating such research into systems for developing digital urban twining, which would raise a series of practically oriented questions around the design of cities to accelerate their climate adaptation. For example, observations on the manifestation of SUHI intensity concerning structural urban conditions and the characteristics of building types could be used to develop additional building indices and impute specific obligations to architectural and construction activities (including energy efficiency). The local registration of SUHI, its intensity under heatwave conditions, and the analysis of the potential vulnerability of the location to future similar phenomena (structural prerequisites, adjacency of land cover types, location in the general urban fabric) allow for a clear way to address this vulnerability to the relevant properties of the cadastral register. The latter will greatly facilitate contact with the public and ensure public support for implementing appropriate mitigation measures.

4.1. SUHI Intensity Calculation

Recording the SUHI intensity through our proposed computational approach provides a good insight into the manifestation of the phenomenon in the urban residential environment thus formed. The results of the study and their analysis clearly show that the intensity of the urban surface heat island can vary quite widely within the same urban area and is directly dependent on the balance of land cover types and land use patterns, which has been found in other similar studies [72]. It also supports the general conclusion that building intensity, configuration and geometry of urban morphology also directly influence the results [16].
Although the temperature conditions varied between the days on which the survey was conducted, the proportions in the thermal load of the different land cover classes were consistent. This implies that land cover type characteristics have a time-invariant influence on the formation, spatial configuration and intensity of the urban heat island under deepening heat wave conditions (which were present at the time of data collection).
The results of the study give us grounds to argue that the data presented in this way can be effectively applied in the urban planning process, especially when considering the balance of the territory in individual urban units. It is important to conduct additional studies to prove this more conclusively, including ones that reveal how these same areas (affected by SUHI) will respond to thermal forcing at different times of the day, not just in the first two hours after sunset. The approach, methodology, and technology of the survey make this possible because the flight missions are automated and can be performed an unlimited number of times. Therefore, there will be a high degree of comparability between the data obtained in terms of quality, resolution, and spatial consistency.

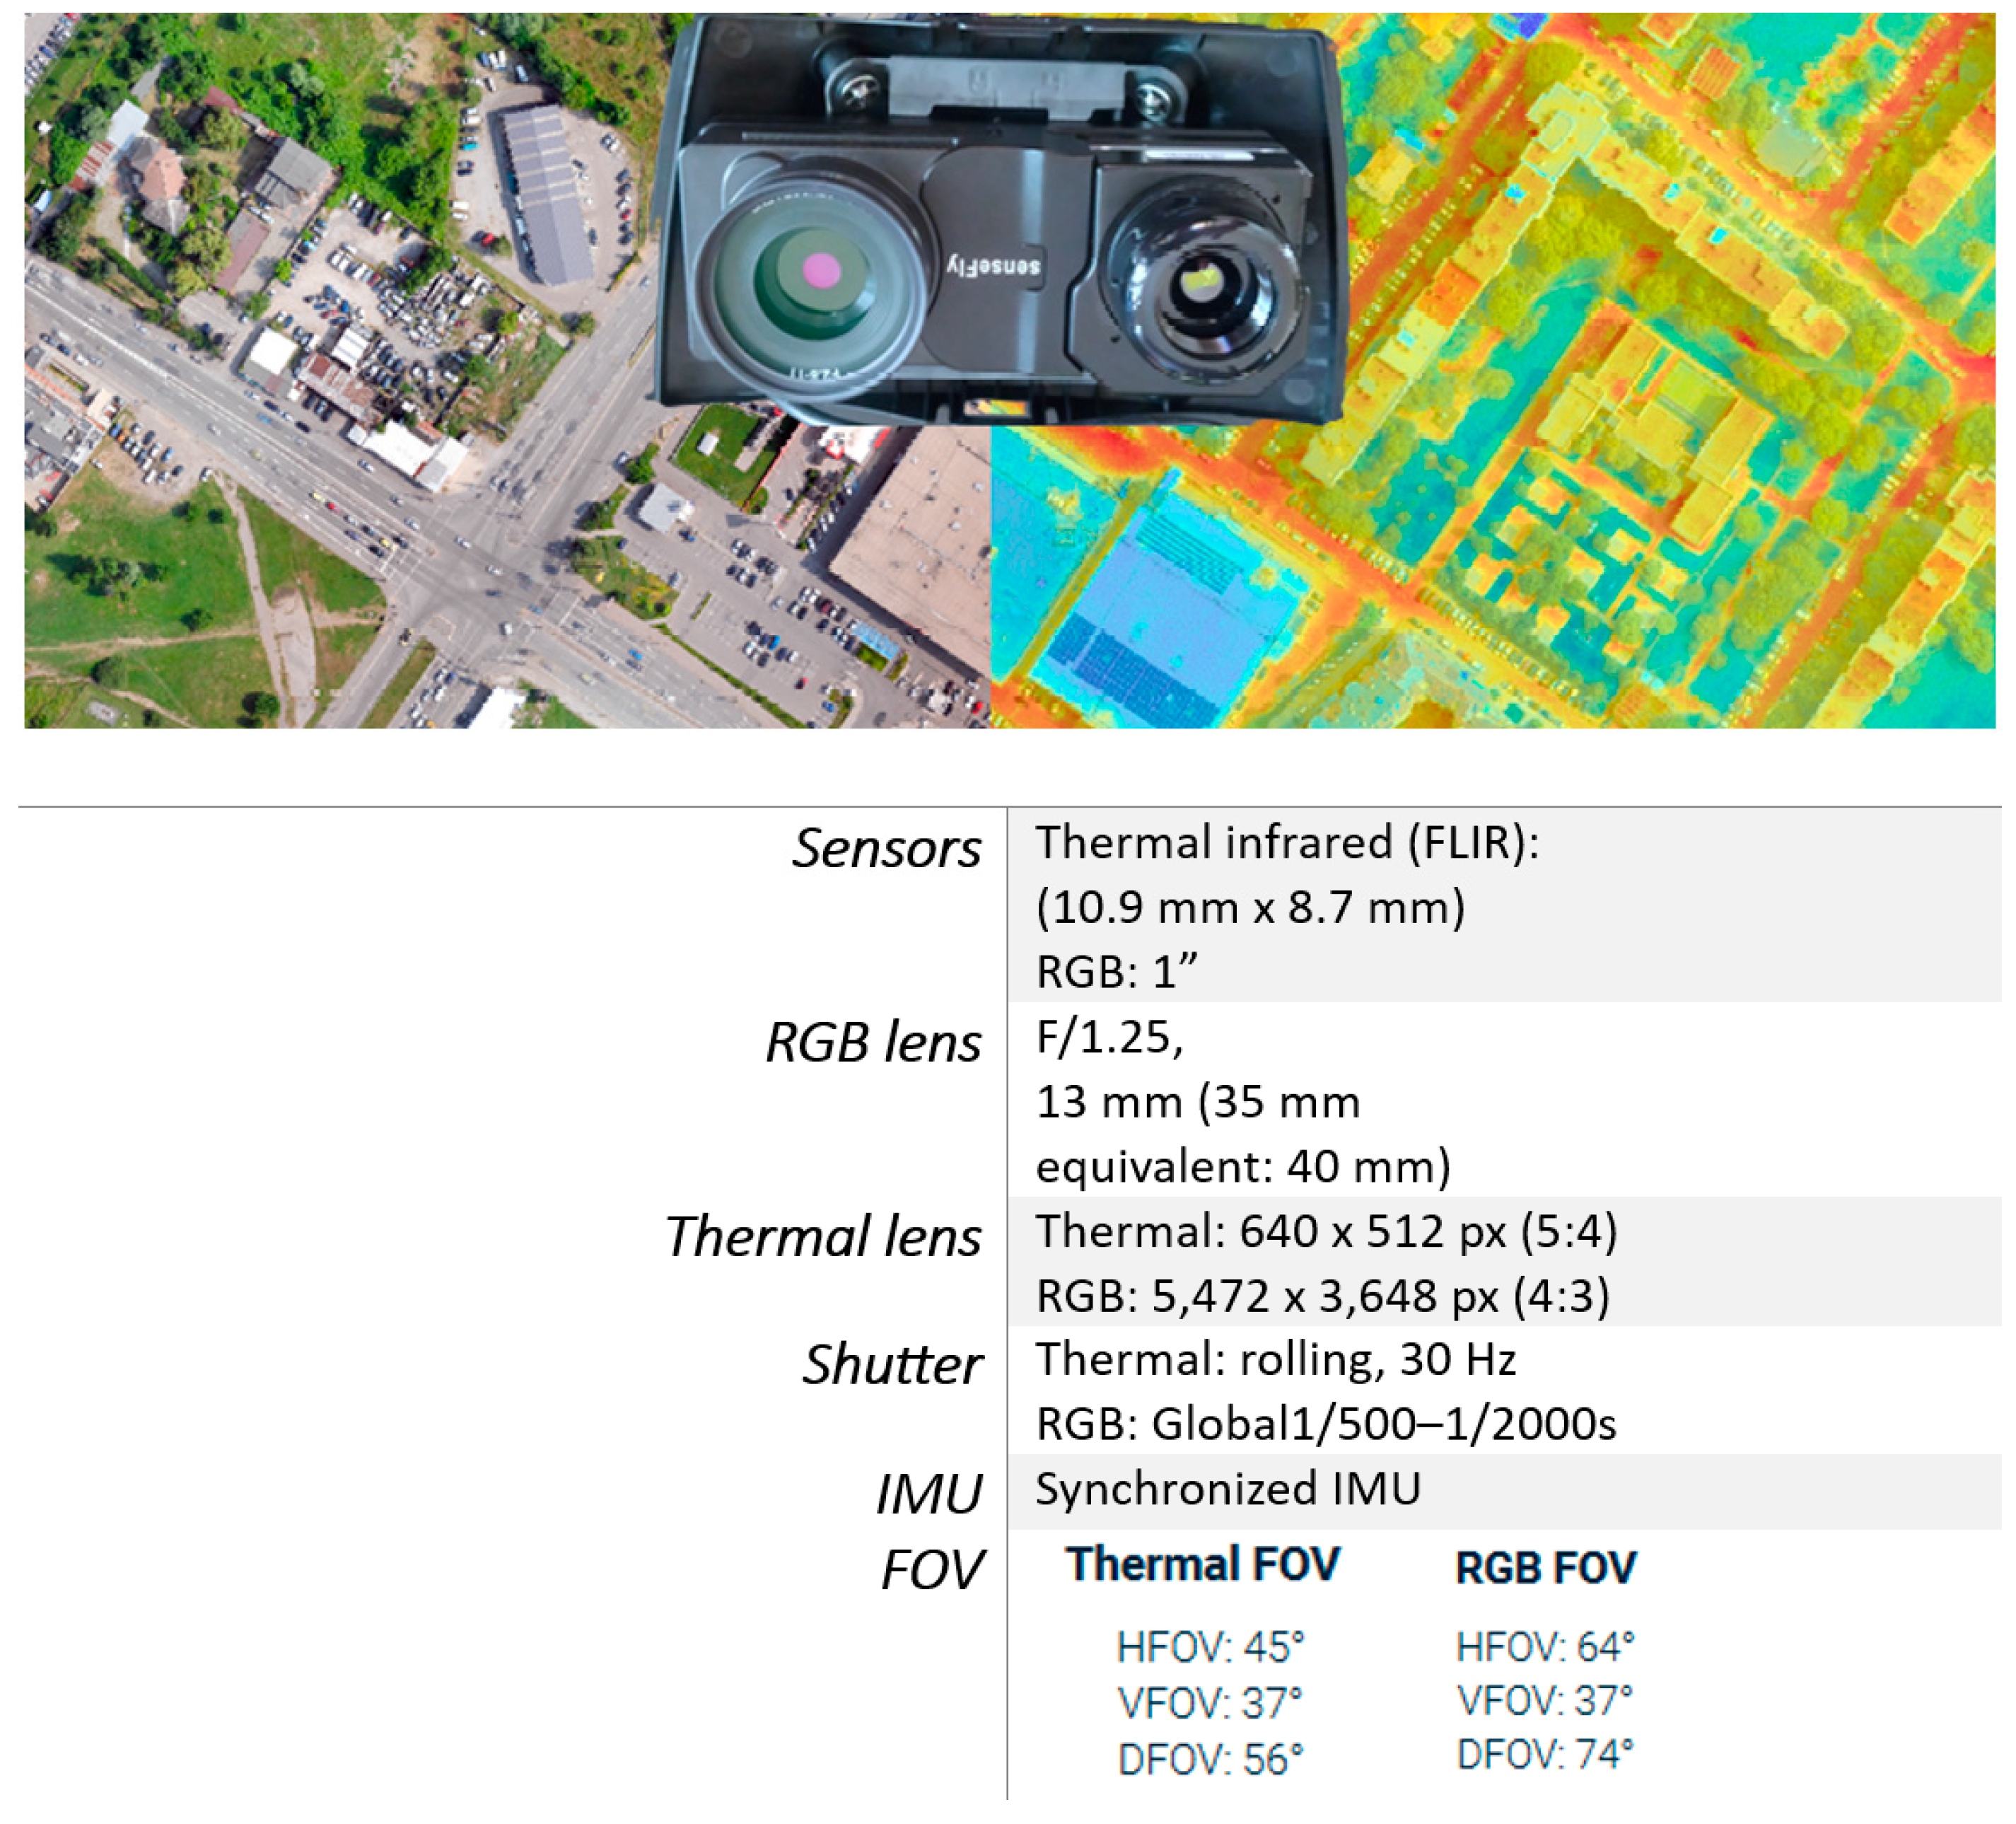
4.2. Methodology of Recording the Phenomenon and Instrumentation

The study shows that the application of a fixed-wing type UAV equipped with an integrated thermal and photogrammetric sensor appears to be effective for such investigations because it provides relatively large coverage for limited time periods. The main limitation in our methodology is related to the high cost of the technique, as well as the need to have more than one device to be able to survey synchronously larger parts of urban areas. In the present survey, we had one such platform, which did not allow for 2 h after sunset to fly over and generate data for the entire area of the housing complex, namely the subject of our survey. The results would have been much more conclusive if we had had the technical capability to cover the entire area within four consecutive dates and on each of the days of the deepening heat wave.

4.3. Applicability of the Results

The fourth important focus of the present discussion relates to the applicability of the results. Based on the data collected, this methodology offers data that is easy to understand and can be directly used in the urban planning process. The latter also raises the question of their potential compatibility with other urban planning inputs. Representing the characteristics of SUHI and its intra-urban variability in a form suitable for integration with others, e.g., socio-economic, information may be of defining importance for future interdisciplinary research and as a possible screening tool for policy making [73]. The conditions of use by urban planners and architects of new scientific data on environmental quality have been repeatedly discussed [74]. This stems from the lack of correspondence between the range of environmental phenomena and the spatial extent of urban units. In the context of the latter, pragmatically oriented scientific analyses and data specifically addressing areas of interest can serve this relationship and make new scientific data crucial for sustainable forms of urban planning. In the data presented for the residential area of Lyulin, it is evident that the highest magnitude of SUHI is observed in sectors with development densities above 80% (parts where the artificial and impervious covers and objects are forming 80% of the surface) at the contact of major transport arteries (with major importance for the center-periphery connection) and adjacent commercial facilities and open parking lots. An additional highly unfavorable factor is sealed spaces with a disturbed structure (Figure 9). The large number of open inter-block spaces in Lulin fails to help mitigate the effect.
The SUHI methodology, its accuracy, and operational feasibility are of fundamental importance for monitoring the phenomenon [75]. The calculation approach proposed here is an interpretation of the traditional approach focusing on the precision of the results with emphasis on the intensity of the phenomenon and its specific spatial parameters of occurrence. The results of applying such an approach are conducive to a discussion of the relationship between SUHI magnitude with urban development patterns and geographically specific combinations of land cover types. Of particular interest would be an analysis of the manifestation of SUHI in urban areas where there are active contemporary variables—population growth, overdevelopment and the emergence of new public facilities, increased traffic congestion, etc., which are also emphasized in the test area. The latter gives us a reason to point out the objective necessity of reorientation of the urban model of Sofia Municipality, and in particular of the Lyulin district, towards a more sustainable and adequate future regarding the new geographical environment perspective.

5. Conclusions

The integration of geospatial technologies and UAS-based thermal photogrammetry for mapping and assessment of the SUHI provides information with high accuracy and spatial correctness about the intensity of the phenomenon. The approach has a high potential for tracking thermal urban issues at local and micro scales.
Data from a test of the approach in a heat wave period in the largest and relatively self-contained urban unit, a residential area of the Bulgarian capital and Bulgaria, confirm that this methodology allows one to correctly reflect the influence of environmental heterogeneity on the intensity of the SUHI manifestation.
This information base is very favorable for combining with other information from the functioning of the urban structure and systems—social, economic, and service (in energy and transport) to define both effective short-term measures (to mitigate thermal stress during a heat wave) and long-term strategic measures to establish urban patterns resilient to the changing geographical environment.

Author Contributions

Conceptualization, S.D.; methodology, S.D. and M.I.; software, M.I.; validation, B.B., L.S. and S.P.; formal analysis, S.D., B.B., M.I., L.S. and S.P.; writing—original draft preparation, S.D., B.B., M.I., L.S. and S.P.; writing—review and editing, S.D., B.B. and L.S.; visualization, M.I. All authors have read and agreed to the published version of the manuscript.

Funding

This study is financed by the European Union-NextGenerationEU, through the National Recovery and Resilience Plan of the Republic of Bulgaria, project No BG-RRP-2.004-0008-C01 “Sofia University Marking Momentum for Innovation and Technological Transfer”.

Institutional Review Board Statement

Not applicable.

Informed Consent Statement

Not applicable.

Data Availability Statement

Data are contained within the article.

Acknowledgments

We are very grateful for the support from the project No BG-RRP-2.004-0008-C01. (SUMMIT-Sofia University Marking Momentum For Innovation and Technological Transfer), funded by the European Union—NextGenerationEU, through the National Recovery and Resilience Plan of the Republic of Bulgaria. We also thank the reviewers and the academic editors for their valuable comments that helped to improve the paper’s quality.

Conflicts of Interest

The authors declare no conflict of interest.

References

  1. Nuissl, H.; Siedentop, S. Urbanisation and Land Use Change. In Sustainable Land Management in a European Context. Human-Environment Interactions; Weith, T., Barkmann, T., Gaasch, N., Rogga, S., Strauß, C., Zscheischler, J., Eds.; Springer: Cham, Switzerland, 2021; Volume 8. [Google Scholar] [CrossRef]
  2. Yang, J.; Yang, Y.; Sun, D.; Jin, C.; Xiao, X. Influence of urban morphological characteristics on thermal environment. Sustain. Cities Soc. 2021, 72, 103045. [Google Scholar] [CrossRef]
  3. Mills, G. Luke Howard and the climate of London. Weather 2008, 63, 153–157. [Google Scholar] [CrossRef]
  4. Zhou, B.; Rybski, D.; Kropp, J.P. The role of city size and urban form in the surface urban heat island. Sci. Rep. 2017, 7, 4791. [Google Scholar] [CrossRef]
  5. Vásquez-Álvarez, P.E.; Flores-Vázquez, C.; Cobos-Torres, J.-C.; Cobos-Mora, S.L. Urban Heat Island Mitigation through Planned Simulation. Sustainability 2022, 14, 8612. [Google Scholar] [CrossRef]
  6. Pacheco, P.; Mera, E.; Fuentes, V. Intensive Urbanization, Urban Meteorology and Air Pollutants: Effects on the Temperature of a City in a Basin Geography. Int. J. Environ. Res. Public Health 2023, 20, 3941. [Google Scholar] [CrossRef]
  7. Constantinescu, D.; Cheval, S.; Caracaş, G.; Dumitrescu, A. Effective monitoring and warning of Urban Heat Island effect on the indoor thermal risk in Bucharest (Romania). Energy Build. 2016, 127, 452–468. [Google Scholar] [CrossRef]
  8. Li, X.; Zhou, Y.; Asrar, G.R.; Imhoff, M.; Li, X. The surface urban heat island response to urban expansion: A panel analysis for the conterminous United States. Sci. Total Environ. 2017, 605–606, 426–435. [Google Scholar] [CrossRef] [PubMed]
  9. Li, X.; Zhou, Y.; Yu, S.; Jia, G.; Li, H.; Li, W. Urban heat island impacts on building energy consumption: A review of approaches and findings. Energy 2019, 174, 407–419. [Google Scholar] [CrossRef]
  10. Zhou, Y.; Weng, Q.; Gurney, K.R.; Shuai, Y.; Hu, X. Estimation of the relationship between remotely sensed anthropogenic heat discharge and building energy use. ISPRS J. Photogramm. Remote Sens. 2012, 67, 65–72. [Google Scholar] [CrossRef]
  11. Zhao, L.; Oppenheimer, M.; Zhu, Q.; Baldwin, J.W.; Ebi, K.L.; Bou-Zeid, E.; Guan, K.; Liu, X. Interactions between urban heat islands and heat waves. Environ. Res. Lett. 2018, 13, 034003. [Google Scholar] [CrossRef]
  12. Ko, J.; Schlaerth, H.; Bruce, A.; Sanders, K.; Ban-Weiss, G. Measuring the impacts of a real-world neighborhood-scale coo pavement deployment on albedo and temperatures in Los Angeles. Environ. Res. Lett. 2022, 17, 044027. [Google Scholar] [CrossRef]
  13. Chapman, S.; Watson, J.E.M.; Salazar, A.; Thatcher, M.; McAlpine, C.A. The impact of urbanization and climate change on urban temperatures: A systematic review. Landsc. Ecol. 2017, 32, 1921–1935. [Google Scholar] [CrossRef]
  14. Heaviside, C.; Macintyre, H.; Vardoulakis, S. The urban heat island: Implications for health in a changing environment. Curr. Environ. Health 2017, 4, 296–305. [Google Scholar] [CrossRef]
  15. Estrada, F.; Botzen, W.W.; Tol, R.S. A global economic assessment of city policies to reduce climate change impacts. Nat. Clim. Change 2017, 7, 403. [Google Scholar] [CrossRef]
  16. Li, Y.; Schubert, S.; Kropp, J.P.; Rybski, D. On the influence of density and morphology on the Urban Heat Island intensity. Nat. Commun. 2020, 11, 2647. [Google Scholar] [CrossRef]
  17. Huang, K.; Li, X.; Liu, X.; Seto, K.C. Projecting global urban land expansion and heat island intensification through 2050. Environ. Res. Lett. 2019, 14, 114037. [Google Scholar] [CrossRef]
  18. Mcdonnell, M.J.; Macgregor-Fors, I. The ecological future of cities. Science 2016, 352, 936–938. [Google Scholar] [CrossRef] [PubMed]
  19. Irfeey, A.M.M.; Chau, H.-W.; Sumaiya, M.M.F.; Wai, C.Y.; Muttil, N.; Jamei, E. Sustainable Mitigation Strategies for Urban Heat Island Effects in Urban Areas. Sustainability 2023, 15, 10767. [Google Scholar] [CrossRef]
  20. Almeida, C.R.d.; Teodoro, A.C.; Gonçalves, A. Study of the Urban Heat Island (UHI) Using Remote Sensing Data/Techniques: A Systematic Review. Environments 2021, 8, 105. [Google Scholar] [CrossRef]
  21. Parsaee, M.; Joybari, M.M.; Mirzaei, P.A.; Haghighat, F. Urban heat island, urban climate maps and urban development policies and action plans. Environ. Technol. Innov. 2019, 14, 100341. [Google Scholar] [CrossRef]
  22. Pena Acosta, M.; Vahdatikhaki, F.; Santos, J.; Hammad, A.; Dorée, A.G. How to bring UHI to the urban planning table? A data-driven modeling approach. Sustain. Cities Soc. 2021, 71, 102948. [Google Scholar] [CrossRef]
  23. Alves, E.; Anjos, M.; Galvani, E. Surface urban heat island in middle city: Spatial and temporal characteristics. Urban Sci. 2020, 4, 54. [Google Scholar] [CrossRef]
  24. Stewart, I.D.; Krayenhoff, E.S.; Voogt, J.A.; Lachapelle, J.A.; Allen, M.A.; Broadbent, A.M. Broadbent Time evolution of the surface urban heat Island. Earth’s Future 2021, 9, e2021EF002178. [Google Scholar] [CrossRef]
  25. Dimitrov, S.; Popov, A.; Iliev, M. An Application of the LCZ Approach in Surface Urban Heat Island Mapping in Sofia, Bulgaria. Atmosphere 2021, 12, 1370. [Google Scholar] [CrossRef]
  26. Oke, T.R. The distinction between canopy and boundary-layer urban heat islands. Atmosphere 1976, 14, 268–277. [Google Scholar] [CrossRef]
  27. Li, D.; Yan, S.; Chen, G. Effects of Urban Redevelopment on Surface Urban Heat Island. IEEE J. Sel. Top. Appl. Earth Obs. Remote Sens. 2023, 16, 2366–2373. [Google Scholar] [CrossRef]
  28. Weng, Q. Thermal infrared remote sensing for urban climate and environmental studies: Methods, applications, and trends. ISPRS J. Photogramm. Remote Sens. 2009, 64, 335–344. [Google Scholar] [CrossRef]
  29. Voogt, J.A.; Grimmond, C.S.B. Modeling Surface Sensible Heat Flux Using Surface Radiative Temperatures in a Simple Urban Area. J. Appl. Meteorol. Climatol. 2000, 39, 1679–1699. [Google Scholar] [CrossRef]
  30. Wu, Y.; Shan, Y.; Lai, Y.; Zhou, S. Method of calculating land surface temperatures based on the low-altitude UAV thermal infrared remote sensing data and the near-ground meteorological data. Sustain. Cities Soc. 2022, 78, 103615. [Google Scholar] [CrossRef]
  31. Voogt, J.A.; Oke, T.R. Thermal remote sensing of urban climates. Remote Sens. Environ. 2003, 86, 370–384. [Google Scholar] [CrossRef]
  32. Soux, A.; Voogt, J.A.; Oke, T.R. A model to calculate what a remote sensor “sees” of an urban surface. Bound. Layer Meteorol. 2003, 111, 109–132. [Google Scholar] [CrossRef]
  33. Tomlinson, C.J.; Chapman, L.; Thornes, J.E.; Baker, C. Remote sensing land surface temperature for meteorology and climatology: A review. R. Meteorol. Soc. Meteorol. Appl. 2011, 18, 296–306. [Google Scholar] [CrossRef]
  34. Elmes, A.; Healy, M.; Geron, N.; Andrews, M.; Rogan, J.; Martin, D.; Sangermano, F.; Williams, C.A.; Weil, B. Mapping spatiotemporal variability of the urban heat island across an urban gradient in Worcester, Massachusetts using in-situ Thermochrons and Landsat-8 Thermal Infrared Sensor (TIRS) data. GISci. Remote Sens. 2020, 57, 845–864. [Google Scholar] [CrossRef]
  35. Eliasson, I. Infrared thermography and urban temperature patterns. Int. J. Remote Sens. 1992, 13, 869–879. [Google Scholar] [CrossRef]
  36. Saaroni, H.; Ben-Dor, E.; Bittan, A.; Potchter, O. Spatial distribution and microscale characteristics of the urban heat island in Tel-Aviv, Israel. Landsc. Urban Plan. 2000, 48, 1–18. [Google Scholar] [CrossRef]
  37. Skarbit, N.; Gál, T.; Unger, J. Airborne surface temperature differences of the different Local Climate Zones in the urban area of a medium sized city. In Proceedings of the 2015 Joint Urban Remote Sensing Event (JURSE), Lausanne, Switzerland, 30 March–1 April 2015; pp. 1–4. [Google Scholar]
  38. Bartesaghi Koc, C.; Osmond, P.; Peters, A.; Irger, M. Mapping Local Climate Zones for urban morphology classification based on airborne remote sensing data. In Proceedings of the 2017 Joint Urban Remote Sensing Event (JURSE), Dubai, United Arab Emirates, 6–8 March 2017; pp. 1–4. [Google Scholar]
  39. Shandas, V.; Voelkel, J.; Williams, J.; Hoffman, J. Integrating Satellite and Ground Measurements for Predicting Locations of Extreme Urban Heat. Climate 2019, 7, 5. [Google Scholar] [CrossRef]
  40. Voelkel, J.; Shandas, V. Towards Systematic Prediction of Urban Heat Islands: Grounding Measurements, Assessing Modeling Techniques. Climate 2017, 5, 41. [Google Scholar] [CrossRef]
  41. Jin, M.S. Developing an index to measure urban heat island effect using satellite land skin temperature and land cover observations. J. Clim. 2012, 25, 6193–6201. [Google Scholar] [CrossRef]
  42. Um, J.-S. Performance evaluation strategy for cool roof based on pixel dependent variable in multiple spatial regressions. Spat. Inf. Res. 2017, 25, 229–238. [Google Scholar] [CrossRef]
  43. Xiang, T.; Xia, G.; Zhang, L. Mini-Unmanned Aerial Vehicle-Based Remote Sensing: Techniques, applications, and prospects. IEEE Geosci. Remote Sens. Mag. 2019, 7, 29–63. [Google Scholar] [CrossRef]
  44. Dimitrov, S.; Popov, A.; Iliev, M. Mapping and assessment of urban heat island effects in the city of Sofia, Bulgaria through integrated application of remote sensing, unmanned aerial systems (UAS) and GIS. In Proceedings of the Eighth International Conference on Remote Sensing and Geoinformation of the Environment (RSCy2020), Paphos, Cyprus, 16–18 March 2020; p. 115241A. [Google Scholar] [CrossRef]
  45. Fan, C.X.; Han, J.; Xiong, Z.J.; Zhao, Y. Application and status of unmanned aerial vehicle remote sensing technology. Sci. Surv. Mapp. 2009, 34, 214–215. [Google Scholar]
  46. Feng, L.; Tian, H.; Qiao, Z.; Zhao, M.; Liu, Y. Detailed variations in urban surface temperatures exploration based on unmanned aerial vehicle thermography. IEEE J. Sel. Top. Appl. Earth Obs. Remote Sens. 2019, 13, 204–216. [Google Scholar] [CrossRef]
  47. Naughton, J.; McDonald, W. Evaluating the variability of urban land surface temperatures using drone observations. Remote Sens. 2019, 11, 1722. [Google Scholar] [CrossRef]
  48. Tepanosyan, G.; Muradyan, V.; Hovsepyan, A.; Pinigin, G.; Medvedev, A.; Asmaryan, S. Studying spatial-temporal changes and relationship of land cover and surface Urban Heat Island derived through remote sensing in Yerevan, Armenia. Build. Environ. 2021, 187, 107390. [Google Scholar] [CrossRef]
  49. Cui, S.Z.; Zhou, J.G. Application of UAV aerial system on surveying and mapping of topographic map at scale 1:1000. Surv. Mapp. Geol. Miner. Resour. 2014, 4, 29–31. [Google Scholar]
  50. Tang, L.; Guofan, S. Drone remote sensing for forestry research and practices. J. For. Res. 2015, 26, 791–797. [Google Scholar] [CrossRef]
  51. Ming, H.; Zhang, H.; DeJonge, K.C.; Comas, L.H.; Thomas, J. Trout. Estimating maize water stress by standard deviation of canopy temperature in thermal imagery. Agric. Water Manag. 2016, 177, 400–409. [Google Scholar]
  52. Zhang, Z.T.; Bian, J.; Han, W.T.; Fu, Q.P.; Chen, S.B.; Cui, T. Cotton moisture stress diagnosis based on canopy temperature characteristics calculated from UAV thermal infrared image. Trans. Chin. Soc. Agric. Eng. 2018, 34, 77–84. [Google Scholar] [CrossRef]
  53. Koh, L.P.; Wich, S.A. Dawn of drone ecology: Low-cost autonomous aerial vehicles for conservation. Trop. Conserv. Sci. 2012, 5, 121–132. [Google Scholar] [CrossRef]
  54. Ren, P.; Meng, Q.; Zhang, Y.; Zhao, L.; Yuan, X.; Feng, X. An unmanned airship thermal infrared remote sensing system for low-altitude and high spatial resolution monitoring of urban thermal environments: Integration and an experiment. Remote Sens. 2015, 7, 14259–14275. [Google Scholar] [CrossRef]
  55. Alba, M.I.; Barazzetti, L.; Scaioni, M.; Rosina, E.; Previtali, M. Mapping infrared data on terrestrial laser scanning 3D models of buildings. Remote Sens. 2011, 3, 1847–1870. [Google Scholar] [CrossRef]
  56. Sham, J.F.C.; Lo, T.Y.; Memon, S.A. Verification and application of continuous surface temperature monitoring technique for investigation of nocturnal sensible heat release characteristics by building fabrics. Energy Build. 2012, 53, 108–116. [Google Scholar] [CrossRef]
  57. Yuan, X.; Meng, Q.L. Analysis on Correlation between Surface Thermal Infrared Bright Temperature and Nearby Air Temperature of the Underlay. Appl. Mech. Mater. 2013, 357, 438–443. [Google Scholar] [CrossRef]
  58. Comprehensive Programme for Improvement of Ambient Air Quality of Sofia Municipality for the Period 2021–2026, Adopted by Decision No 204/22.04.2021 of the Sofia Municipal Council, Sofia Municipality. Available online: https://www.sofia.bg/documents/20121/1088172/2021-05-05-%D0%9F%D1%80%D0%B8%D0%BB.1.pdf/2835466e-f861-49c0-94f8-a5b9d61755a5 (accessed on 17 February 2024). (In Bulgarian).
  59. Meteoblue. Weather Forecast Data. Available online: http://www.meteoblue.com (accessed on 17 February 2024).
  60. Lopes, A.; Alves, E.; Alcoforado, M.J.; Machete, R. Lisbon urban heat island updated: New highlights about the relationships between thermal patterns and wind regimes. Adv. Meteorol. 2013, 2013, 487695. [Google Scholar] [CrossRef]
  61. Oke, T.R. Initial Guidance to Obtain Representative Meteorological Observations at Urban Sites; IOM Report No. 81, WMO/TD. No. 1250; World Meteorological Organization (WMO): Geneva, Switzerland, 2006. [Google Scholar]
  62. Martin-Vide, J.; Sarricolea, P.; Moreno-García, M.C. On the definition of urban heat island intensity: The ‘rural’ reference. Front. Earth Sci. 2015, 3, 24. [Google Scholar] [CrossRef]
  63. Alves, E. Seasonal and spatial variation of surface urban heat island intensity in a small urban agglomerate in Brazil. Climate 2016, 4, 61. [Google Scholar] [CrossRef]
  64. Miao, S.; Chen, F.; LeMone, M.A.; Tewari, M.; Li, Q.; Wang, Y. An observational and modeling study of characteristics of urban heat island and boundary layer structures in Beijing. J. Appl. Meteorol. Climatol. 2009, 48, 484–501. [Google Scholar] [CrossRef]
  65. AgEagle. Available online: https://ageagle.com (accessed on 27 January 2024).
  66. World Meteorological Organization (WMO). Available online: https://wmo.int/topics/heatwave (accessed on 17 February 2024).
  67. Zhou, Y.; Zhao, H.; Mao, S.; Zhang, G.; Jin, Y.; Luo, Y.; Huo, W.; Pan, Z.; An, P.; Lun, F. Exploring surface urban heat island (SUHI) intensity and its implications based on urban 3D neighborhood metrics: An investigation of 57 Chinese cities. Sci. Total Environ. 2022, 847, 157662. [Google Scholar] [CrossRef] [PubMed]
  68. Gaitani, N.; Burud, I.; Thiis, T.; Santamouris, M. High-resolution spectral mapping of urban thermal properties with Unmanned Aerial Vehicles. Build. Environ. 2017, 121, 215–224. [Google Scholar] [CrossRef]
  69. Soto-Estrada, E.; Correa-Echeveria, S.; Posada-Posada, M.I. Thermal analysis of urban environments in Medellin, Colombia, using an unmanned aerial vehicle (UAV). J. Urban Environ. Eng. 2017, 11, 142–149. [Google Scholar]
  70. Heaphy, M.; Watt, M.; Dash, J.; Pearse, G. UAVs for data collection-plugging the gap. N. Z. J. For. 2017, 62, 23–30. [Google Scholar]
  71. Van Hove, L.W.A.; Jacobs, C.M.J.; Heusinkveld, B.G.; Elbers, J.A.; Van Driel, B.L.; Holtslag, A.A.M. Temporal and spatial variability of urban heat island and thermal comfort within the Rotterdam agglomeration. Build. Environ. 2015, 83, 91–103. [Google Scholar] [CrossRef]
  72. Jia, S.; Wang, Y. Effects of land use and land cover pattern on urban temperature variations: A case study in Hong Kong. Urban Clim. 2020, 34, 100693. [Google Scholar]
  73. Chakraborty, T.; Hsu, A.; Manya, D.; Sheriff, G. A spatially explicit surface urban heat island database for the United States: Characterization, uncertainties, and possible applications. ISPRS J. Photogramm. Remote Sens. 2020, 168, 74–88. [Google Scholar] [CrossRef]
  74. Panagopoulos, T.; Duque, J.А.G.; Dan, M.B. Urban planning with respect to environmental quality and human well-being. Environ. Pollut. 2016, 208 Pt A, 137–144. [Google Scholar] [CrossRef]
  75. Zhang, W.; Li, Y.; Zheng, C.; Zhu, Y. Surface urban heat island effect and its driving factors for all the cities in China: Based on a new batch processing method. Ecol. Indic. 2023, 146, 109818. [Google Scholar] [CrossRef]
Figure 1. Study area—Lyulin housing complex.
Sustainability 16 01766 g001
Figure 2. EbeeX fixed-wing UAS (a) and Duet T dual-purpose thermal and mapping camera (b).
Sustainability 16 01766 g002
Figure 3. Duet T major characteristics (from https://ageagle.com, accessed on 17 February 2024).
Sustainability 16 01766 g003
Figure 4. Fragment of the obtained thermal raster layer of the Lulin housing complex.
Sustainability 16 01766 g004
Figure 5. Vectorized polygon layer with information on surface types: yellow: grassy; green: medium and tall vegetation; orange: buildings; grey: sealed surface.
Sustainability 16 01766 g005
Figure 6. Average temperature and standard deviations for different surface types measured on four consecutive days between 21:00 and 22:00.
Sustainability 16 01766 g006
Figure 7. Magnitude map of an UHI within the boundaries of a housing complex Lulin for the period 11–14 July 2023.
Sustainability 16 01766 g007
Figure 8. Fragments of SUHI intensity with higher level of detail: (A) areas dominated by sealed artificial surfaces; (B) areas with an even ratio of sealed and natural surface types; (C) areas with a predominant proportion of natural surface types.
Sustainability 16 01766 g008
Figure 9. Sealed areas (a) with disturbed surface structure (b) suitable for undertaking redevelopment and landscaping.
Sustainability 16 01766 g009
Table 1. Percentage coverage of each surface type within the study area.
Surface TypeCoverage (%)
Sealed surfaces29.83
Buildings15.74
Medium and tall vegetation31.20
Herbaceous vegetation23.23
Table 2. Average minimum LST of the natural land cover class for different days of thermal survey.
Day 1 (11 July 2023)Day 2 (12 July 2023)Day 3 (13 July 2023)Day 4 (14 July 2023)
15 °C15.5 °C17.5 °C16 °C
Disclaimer/Publisher’s Note: The statements, opinions and data contained in all publications are solely those of the individual author(s) and contributor(s) and not of MDPI and/or the editor(s). MDPI and/or the editor(s) disclaim responsibility for any injury to people or property resulting from any ideas, methods, instructions or products referred to in the content.

