Abstract
This study investigates energy label awareness among Gazi University staff, exploring the influence of demographic factors on attitudes and perceptions. Using the Theory of Planned Behavior (TPB), the research examines individual attitudes, subjective norms, and perceived behavioral control in shaping energy efficiency awareness. A cross-sectional survey of academic and administrative staff reveals significant differences in awareness across demographic groups. Gender-specific variations in attitudes towards energy-efficient products are evident, with the greatest difference observed between female (M = 3.93, SD = 1.16) and male staff (M = 3.58, SD = 1.30) on Capacity (I-11) (Z = −2.805, p = 0.005 < 0.05). Education level also significantly influences awareness scores, particularly on the status symbol item (I-18) (χ2 = 24.543, p = 0.00 < 0.05). These findings, analyzed through Wilcoxon Rank Sum and Kruskal–Wallis Tests, provide nuanced insights into the demographic factors impacting energy label awareness. Interpretation of the findings on the complex relationship between demographic characteristics and energy label awareness with TPB provided valuable insights. The practical implications of the study highlight the imperative for tailored communication strategies and targeted interventions to raise awareness among different staff groups. By addressing these nuanced factors, the study significantly contributes to the development of effective energy policies, fostering a sustainable and energy-conscious academic community.
1. Introduction
Energy efficiency is pivotal in the urgent global effort to reduce carbon footprint emissions and combat climate change. By optimizing the utilization of energy resources and minimizing wastage, energy efficiency measures offer a dual benefit: they help organizations and individuals reduce their energy consumption while simultaneously curbing the release of greenhouse gases into the atmosphere [1]. From improved building insulation and energy-efficient appliances to developing clean and renewable energy sources, energy efficiency initiatives are a cornerstone of climate mitigation strategies. These measures contribute to significant cost savings and pave the way for a sustainable future by reducing the reliance on fossil fuels and mitigating the environmental impacts of energy production and consumption. As we navigate the challenges of climate change, fostering energy efficiency remains a vital imperative for achieving a low-carbon and environmentally responsible global economy [2]. At the same time, broader efforts to reduce greenhouse gas emissions in the pursuit of a sustainable future hold promise for reducing the carbon footprint associated with transportation fuels [3,4]. In expanding our understanding of sustainable energies with a global impact, it is crucial to delve into various sources that highlight the diverse forms of sustainable energy. Recent research emphasizes the significance of renewable sources such as solar, wind, and hydroelectric power in mitigating environmental challenges and promoting energy sustainability [5,6]. Additionally, the exploration of emerging technologies like geothermal and biomass energy contributes to the comprehensive landscape of sustainable energy solutions [7,8]. By incorporating these references, our study aims to situate itself within the broader discourse on sustainable energies and their implications for a more environmentally conscious future.
Energy labels, an integral component of environmental policies worldwide, play a pivotal role in informing consumers about the energy efficiency of various products [9]. The relationship between energy efficiency and these labels is direct and highly significant, visualizing a product’s energy efficiency and guiding consumers toward more energy-efficient choices [1,10]. Energy efficiency, fundamentally interconnected with sustainable development and environmental conservation, has far-reaching implications for reducing overall energy consumption, mitigating climate change, and promoting responsible energy use [11,12,13,14]. Moreover, consumer awareness is critical in fostering energy-efficient behaviors, impacting various consumption and lifestyle choices [15,16,17]. The awareness about energy efficiency leads to tangible behavioral changes, such as adopting energy-saving habits and supporting government policies for energy efficiency [18]. Due to several key factors, understanding energy efficiency awareness is crucial for achieving broader sustainability goals [19,20,21].
The energy label awareness discourse has recently gained prominence in academic literature. Studies have explored the factors influencing individuals’ perceptions of energy labels, emphasizing the role of demographics and social contexts [22,23,24,25]. Furthermore, the TPB offers a theoretical framework to understand how attitudes, subjective norms, and perceived behavioral control shape energy-related behaviors [26,27]. While these studies contribute valuable insights, a notable gap persists in understanding the nuanced variations in energy label awareness among diverse demographic groups, particularly within academic institutions. Existing knowledge gaps include limited data on specific demographics, understanding barriers, the impact of socioeconomic factors, cultural and behavioral aspects, policy and program efficacy, and the need for long-term studies with a global perspective [28,29,30]. This study addresses this gap by applying the TPB to assess how demographic factors influence energy label awareness among Gazi University academic and administrative staff. By building upon and extending the existing literature, this research aims to offer a more comprehensive understanding of the intricate dynamics that shape energy label awareness. Addressing these gaps is crucial for developing effective strategies that promote energy efficiency equitably across diverse demographic groups.
The TPB serves as the theoretical foundation of our study, examining how attitudes, subjective norms, and perceived behavioral control influence energy-related behaviors [31,32]. The TPB posits that individual intentions, shaped by these psychological factors, play a central role in determining one’s engagement with energy efficiency. By incorporating the TPB, our research aims to unravel the intricate interplay between these psychological elements and demographic characteristics, shedding light on the factors influencing energy label awareness among Gazi University academic and administrative staff. The choice of university employees as our research samples is deliberate and grounded in universities’ unique role in promoting environmental awareness and sustainability. This study significantly advances our understanding of ecological sustainability and consumer behavior by investigating the awareness and impact of energy labels among Gazi University staff. Utilizing an online survey and leveraging advanced statistical tools for analysis, our research explores how socio-demographic factors such as marital status, age, and education level shape knowledge and attitudes toward energy efficiency labels. Gazi University’s involvement in the ‘Sustainable and Climate Friendly Campus Project,’ a collaborative effort recognized by the Council of Higher Education, extends the scope and relevance of our study. This nationwide initiative encompasses several universities. The project underscores a collective commitment to environmental sustainability, energy efficiency, and addressing climate change across higher education institutions in Turkey. Our study, conducted in collaboration with experts from the Ministry of Energy and Natural Resources and Gazi University, is part of this comprehensive initiative. Academic and administrative staff, integral parts of an educational institution, directly influence the university’s efforts toward a sustainable campus. By focusing on this group, we aim to capture perspectives closely tied to the university’s sustainability initiatives. Their daily activities and decision-making processes can significantly impact the overall energy efficiency culture within the university. This selection aligns with our goal of understanding and enhancing energy label awareness within the academic community. Therefore, the insights garnered from our research extend beyond Gazi University, contributing to a broader understanding of energy efficiency and awareness among academic and administrative staff in institutions actively participating in the Sustainable and Climate Friendly Campus Project.
The study adopts a survey to investigate energy efficiency awareness among university staff. Participants will include university staff from diverse demographic backgrounds, encompassing variables such as gender, age, marital status, staff type, education level, and income. Including a wide range of demographic factors ensures a comprehensive examination of energy efficiency awareness across diverse groups within the university setting. Data collection will be conducted through the online survey assessing participants’ attitudes and energy efficiency awareness. Quantitative data will be analyzed using statistical methods, including descriptive statistics and inferential tests. These analyses will explore the relationships between demographic variables, energy efficiency awareness, and consumer preferences. Bridging existing gaps in the literature will aid in developing targeted and effective strategies to enhance understanding, ensure inclusivity, and address the needs of diverse populations. The study’s findings will provide valuable information for policymakers, educators, and businesses promoting energy efficiency.
Our study makes a crucial contribution by pinpointing specific demographic groups that demand customized communication strategies to enhance their understanding and appreciation of energy labels. This insight holds paramount significance for policymakers, educators, and sustainability advocates who aspire to create more effective interventions promoting energy conservation and reducing carbon footprints within and beyond institutional settings. Consequently, our research enriches academic discourse on sustainability and consumer behavior and provides practical implications for amplifying energy efficiency awareness in institutional contexts. Aligned with the broader objective of fostering a more sustainable and energy-efficient society, this article significantly enhances our understanding of energy efficiency awareness within Gazi University’s academic and administrative staff.
In bridging the critical gap regarding nuanced variations in energy label awareness, particularly within academic institutions, our study utilizes the TPB to evaluate how demographic factors influence energy label awareness among Gazi University academic and administrative staff. Our research aims to comprehensively understand the intricate dynamics shaping energy label awareness within this specific demographic context. Identifying specific demographic groups requiring tailored communication strategies is essential to our study. This insight is paramount for policymakers, educators, and sustainability advocates striving to design more effective interventions that promote energy conservation and reduce carbon footprints within and beyond institutional settings.
After the “Introduction,” readers will encounter the Literature Review (Section 2), where existing research on energy labels and consumer behavior is examined. The Theoretical Framework (Section 3) then outlines the Theory of Planned Behavior’s role in understanding attitudes towards energy efficiency. The Materials and Methods (Section 4) details the survey methodology and statistical analysis. In Results (Section 5), the findings on energy label awareness among Gazi University staff are presented, followed by the Discussion (Section 6), where these findings are interpreted and linked to the theoretical framework. The study concludes with the Conclusions (Section 7) section, summarizing the key insights and their implications for promoting sustainability within institutional settings.
2. Literature Review
The evolution of energy labels and efficiency standards has been dynamic, responding to the pressing concerns of energy consumption, environmental impact, and resource conservation. Historically, these standards were scarce, resulting in energy-inefficient appliances contributing to higher energy bills and environmental degradation [9]. Recognizing the need for change, governments and organizations initiated efforts during the 1970s and 1980s, leading to the establishment of initial energy efficiency standards and labels for specific products [33].
Over subsequent decades, governments globally implemented more stringent measures, and the Energy Star program gained prominence in the United States, marking significant progress in energy labels and standards development [34,35,36]. This evolution expanded the scope of energy labels to cover diverse products, and international harmonization efforts ensured consistency and accuracy [37,38]. Today, energy labels and efficiency standards are integral to global energy and environmental policies, playing a vital role in reducing energy consumption, lowering greenhouse gas emissions, and promoting sustainable living.
The European Commission has recognized that enhancing energy efficiency is essential for decreasing energy consumption and reducing greenhouse gas emissions by a minimum of 32.5% by 2030, in line with worldwide efforts. The Eco-design Directive, established in 2005, sets standards for enhancing the environmental efficiency of energy-related products. It has already implemented 31 laws, leading to substantial energy savings. Case studies from Japan, South Korea, and China show effective regulatory regimes that encourage ongoing enhancements in energy efficiency, offering valuable lessons for the EU’s planned front-runner approach [39].
The Energy Label’s application helps decrease residential electricity usage by enhancing the energy efficiency of domestic equipment, benefiting both the public and private sectors [40]. Moreover, including energy cost data in the EU energy label has been proven to alter the purchasing pattern towards less expensive and lower-rated items without raising energy expenses. Internationally, energy label programs have successfully impacted consumers’ understanding and attitudes toward energy-efficient appliances on a global scale [41]. The rescaled A to G labeling scheme notably boosts the estimated willingness to pay (WTP) compared to the old A+++ to D method [42]. Requiring energy labels has been shown to somewhat increase the average assessment of energy expenses, decreasing “internalities” [28].
Understanding consumer behavior is crucial for energy efficiency, with psychological factors influencing decisions being essential [43]. Policymakers and businesses can nudge consumers toward energy-efficient choices by employing interventions informed by behavioral economics, such as financial incentives and real-time energy usage data. Y. Zhang et al. [44] delve into the issue of energy consumption and its impact on environmental challenges, highlighting the willingness of consumers to pay a premium for energy-saving appliances. Their study identifies key factors influencing consumer attitudes, perceived quality, price, and emotional and environmental values, shedding light on strategies to promote the adoption of energy-saving appliances.
Exploring the impact of energy labels on consumer behavior, having an Energy Label (EL) result in a greater perceived ecological value of the product while raising the perceived social risk associated with buying the goods. The new EL diminishes ecological value, heightens perceived danger, and lowers buy intention. Yet, when the old and new ELs are compared, the negative impact of the new EL on perceived ecological value, perceived social risk, and purchase intention is lessened [45]. Changes in Minimum Energy Performance Standards (MEPS) and energy labels have been proven to boost the market share of energy-efficient appliances, reduce the market share of less efficient appliances, and exhibit differing efficacy among label categories, carrying significant policy consequences [46].
Energy labels, providing transparent information about the energy performance of products, play a crucial role in empowering consumers [47]. Andor et al. [48] demonstrate the impact of energy labels on consumer purchasing decisions, emphasizing the importance of including annual operating cost information alongside labels.
Concurrently, the awareness of energy efficiency has become foundational for sustainable living, with governments and businesses actively disseminating information through campaigns and educational programs to educate consumers on the importance of energy conservation [49].
Gródek-Szostak et al. [50] underscore the impact of energy education on students’ behavior, highlighting its effectiveness in promoting the adoption of renewable energy sources, comparable to government policies and subsidies. This emphasizes the significance of energy education in shaping future decision-makers, investors, consumers, scientists, and skilled labor forces in new energy technologies.
While the existing body of literature has delved into energy label awareness and consumer attitudes in diverse settings [51,52,53,54,55], a more specific exploration of energy consumption attitudes among university employees is relatively scarce. Recognizing this gap, we aim to contribute to the existing knowledge by focusing on academic and administrative staff’s distinctive perspectives and behaviors within the university context.
Our study contributes to the existing discourse on energy label awareness by offering a nuanced examination within the unique context of Gazi University. While previous research has extensively explored the global evolution of energy labels and efficiency standards, emphasizing their role in sustainable living, our work extends this conversation by focusing on academic and administrative staff within a university setting. Aligned with the global emphasis on regulatory schemes and international case studies, we provide insights into the effectiveness of these measures at the institutional level. Furthermore, our exploration of the psychological factors influencing energy efficiency behavior, tailored to the demographic of university staff, deepens the understanding of attitudes, values, and perceptions within this specific group. In responding to the limited research on energy consumption attitudes among university employees, our study addresses this gap and establishes connections between energy label awareness, consumer behavior, and the distinctive dynamics of a university environment. Overall, our work is a nuanced addition to the existing literature, offering valuable perspectives contributing to informed decision-making for sustainable practices within educational institutions.
The interconnected elements of energy efficiency awareness, consumer behavior, and influential energy labels are pivotal in creating a sustainable and energy-conscious society. Collaboration between governments, businesses, and consumers is essential for achieving the shared goals of reducing energy consumption, mitigating climate change, and promoting responsible energy use.
3. Theoretical Framework: Theory of Planned Behavior
The TPB is a sophisticated and widely recognized psychological framework instrumental in understanding and forecasting human actions, especially within decision-making processes [56]. Its application to the study of energy efficiency awareness offers a comprehensive approach to dissecting the psychological elements influencing sustainable consumer behavior. Using TPB, researchers can search how attitudes, social norms, and perceived behavioral control shape the inclination towards energy-efficient choices. This theory not only aids in dissecting the cognitive underpinnings of behavior but also serves as a foundational structure for crafting targeted interventions and policies. These strategies, built on the TPB framework, can foster positive perceptions, reinforce supportive social norms, and enhance the sense of agency among consumers regarding their energy-efficient decisions. Integrating this theory in research and policy-making paves the way for more nuanced, psychology-based approaches to promoting sustainable behavior in the context of energy efficiency. Building upon the TPB, our study seeks to delve into the subtle dynamics of energy-related attitudes and behaviors among college employees at Gazi University. In applying the TPB to our research, we aim to bridge the gap between theoretical constructs and practical interventions. The TPB, emphasizing attitudes, subjective norms, and perceived behavioral control, is a robust foundation for understanding energy label awareness. To clarify practical implications, we underscore that interventions targeting attitudes, normative influences, and perceived control can significantly impact energy-related behaviors. This alignment guides our interpretation of gender-specific variations, age-related considerations, and educational influences on awareness. By elucidating the practical implications of TPB components, we strive to contribute to theoretical advancements and the development of targeted strategies for promoting energy efficiency within academic communities.
3.1. Attitude toward Behavior
In the TPB, “Attitude Toward Behavior” refers to an individual’s positive or negative evaluation of performing a specific behavior [57]. Within the framework of energy efficiency awareness, the study emphasizes the pivotal role of attitudes towards energy-efficient products and practices. These attitudes encompass a spectrum of factors including, but not limited to, low energy consumption, water usage efficiency, product durability, and the significance of the energy efficiency class of products. These elements are intricately connected to the TPB, where they are not merely peripheral considerations but integral components. In this extended framework, attitudes toward energy-efficient options are critical in shaping consumer behavior. By understanding and addressing these attitudes, interventions can be more effectively tailored to enhance awareness and adoption of energy-efficient practices. The study’s approach to integrating these attitudes into the TPB framework provides a comprehensive understanding of the psychological drivers behind sustainable consumer choices in energy efficiency.
3.2. Subjective Norms
The TPB significantly highlights the impact of social norms on individual behavior [58]. This study focuses on the disparities in energy efficiency awareness across various demographic groups, including differences based on gender, marital status, staff type, age, and education level. Such variations underscore the influence of subjective norms within these groups. It is critical to understand how individuals’ perceptions of societal expectations regarding energy efficiency shape their awareness and behaviors. This involves analyzing how the collective views of their reference groups affect personal attitudes and actions toward energy efficiency. The study thereby contributes to a more nuanced grasp of the social underpinnings that drive energy efficiency awareness, which is vital for designing more effective educational and policy interventions.
3.3. Perceived Behavioral Control
Perceived behavioral control, a core element of the TPB, relates to an individual’s beliefs about their capacity to perform a specific behavior [59]. In the context of energy efficiency, this study reveals differential levels of awareness between academic and administrative staff, highlighting variations in perceived control over making energy-efficient choices. This aspect underscores the importance of exploring individuals’ self-assessed ability to adopt energy-efficient practices or purchase energy-efficient products. Such an exploration is crucial for understanding the barriers and facilitators to energy-efficient behavior, which can guide the development of more targeted and effective interventions in promoting energy efficiency within different staff demographics.
3.4. Intention and Behavior
The TPB asserts that behavioral intentions serve as a crucial intermediary between one’s attitudes, subjective norms, and actual behavior [60]. This theory emphasizes the importance of understanding how individual awareness of energy efficiency translates into intentions to make energy-efficient choices. Further, examining how these intentions subsequently manifest into concrete behaviors is vital. Such an examination is key in the TPB framework, as it helps decipher the psychological processes that drive the transition from awareness and intention to actual energy-efficient behavior.
3.5. Demographic Moderators
The TPB facilitates the integration of demographic factors as moderators in understanding behavior [61]. This study highlights the significance of gender, marital status, staff type, age, and education level in shaping energy efficiency awareness. Utilizing the TPB, researchers can search into how these demographic variables moderate the intricate interplay between attitudes, subjective norms, perceived behavioral control, intentions, and actual behavior. This approach allows for a comprehensive analysis of the varying influences of these demographic factors on decision-making and behavior adoption in the context of energy efficiency.
4. Materials and Methods
4.1. Research Design
The research design for investigating energy label awareness among Gazi University staff adopts a cross-sectional survey approach. This approach allows for the collection of comprehensive data from diverse academic and administrative staff members at a single point in time, enabling a nuanced understanding of their current level of awareness regarding energy labels. The cross-sectional design facilitates the formulation of targeted recommendations to enhance sustainability communication strategies.
4.2. Participant Selection
The target population for this study consists of academic and administrative staff from various faculties and departments at Gazi University, which was selected as a pilot university by the Council of Higher Education of the Republic of Türkiye in the “Sustainable and Climate Friendly Campus” project. Gazi University was chosen as the primary research site for its unique characteristics and as a representative sample of academic institutions in our study’s context. The decision to focus on one university allowed for an in-depth exploration of energy label awareness among its diverse academic and administrative staff. Gazi University was selected due to its comprehensive representation of various disciplines, demographic profiles, and institutional structures. While the study’s findings are based on the context of Gazi University, efforts were made to ensure that the university indicates broader trends within academic institutions in our study’s scope. However, it is essential to acknowledge that the generalizability of the findings to other universities may vary based on contextual factors.
To ensure representation across disciplines and departments, the study includes all staff registered in the Gazi University personnel database at the time of the research. The sample size is determined as 429, considering a 95% confidence level and an error margin of ±4.7%, and the survey is distributed to 1.5 times the calculated sample size (644 participants) to account for potential non-responsiveness. Sampling units are randomly selected using simple random sampling, with gender and staff type as stratification criteria.
4.3. Survey Instrument: Energy Labels & Consumer Choices Survey
The survey employs the “Energy Labels & Consumer Choices Survey” to measure awareness levels regarding energy labels among staff. The survey is adapted from existing scales in the field. It consists of items exploring various dimensions, including the perceived importance of energy efficiency, water consumption, and the influence of status symbols when purchasing products with energy labels. The survey incorporates Likert scale questions and demographic inquiries to facilitate a comparative analysis of findings among participant groups. The survey comprises two main sections: First Section: Collecting socio-demographic information such as gender, age, marital status, staff type, and income. Second Section: Employ the Likert-scale questions to assess awareness levels and consumer preferences related to 18 items like quality, capacity, energy efficiency, water consumption, brand image, durability, low maintenance cost, and the perceived status symbol when purchasing labeled products.
4.4. Data Collection
The cross-sectional study collects data from academic and administrative staff members at Gazi University. The survey, distributed electronically, reaches 644 participants, ensuring anonymity and confidentiality. Participants receive email invitations encouraging their engagement, and reminders are sent to maximize response rates and provide a representative sample.
Throughout the data collection process, we implemented several strategies to address potential social desirability bias inherent in self-reported energy-related behaviors. Firstly, participants were assured of the confidentiality and anonymity of their responses, emphasizing that honest and accurate feedback would contribute to more meaningful insights. Secondly, we employed carefully crafted survey questions to minimize response bias, ensuring that queries were framed objectively without inducing socially desirable responses. Thirdly, the survey design incorporated randomized question orders and response formats to mitigate potential bias further. Moreover, participants were explicitly informed that the study’s purpose was not to evaluate individual behaviors but to aggregate insights for comprehensive analysis. By adopting these measures, we aimed to create a conducive environment for participants to provide candid responses, minimizing the impact of social desirability bias on self-reported energy-related behaviors.
4.5. Data Analysis
Our study employed a combination of descriptive and inferential statistical analyses to ensure robust statistical inference. Descriptive statistics, such as means and standard deviations, were calculated to summarize the central tendencies and variability of awareness scores across various demographic factors. Additionally, inferential analyses included parametric tests, such as t-tests for independent samples, to compare means between two groups, and non-parametric tests, such as the Kruskal–Wallis Test, to assess differences among multiple groups. The choice of statistical tests was guided by the nature of the variables and the distributional characteristics of the data. Importantly, these analyses were conducted with a predetermined significance level (α = 0.05), and effect sizes were examined to evaluate the practical significance of the observed differences. By providing this detailed account, we aim to offer readers a thorough understanding of the analytical methods employed in our study.
The study examines the impact of socio-demographic characteristics (marital status, age, staff type) on various dimensions of energy label awareness. Statistical comparisons are conducted using non-parametric tests, considering the ordinal nature of Likert scale data. The analysis includes Kruskal–Wallis and Wilcoxon Rank Sum tests to identify significant differences among participant groups. Firstly, to assess the differences in awareness scores among demographic groups, we employed the Kruskal–Wallis Test, a non-parametric method suitable for comparing more than two independent groups. The Wilcoxon Rank Sum Test revealed awareness score variations between academic and administrative staff. These statistical approaches were chosen based on their appropriateness for our study’s design and the non-normal distribution of our data.
The acquired data underwent a robust study in MATLAB R2021b, and the findings are presented with overall estimations and error margins. Ethical considerations are paramount, and the study follows rigorous protocols, including anonymization and secure data storage, to uphold participant privacy.
The awareness of energy efficiency is gauged through 18 items (Table 1) employing a 5-point Likert scale, indicating the respondents’ agreement levels from 1 (strongly disagree) to 5 (strongly agree). The high internal consistency, as noted in a Cronbach alpha of 0.91, ensures the scale’s reliability.

Table 1.
Research items.
To assess potential differences in awareness scores based on gender, marital status, and staff type, non-parametric Wilcoxon Rank Sum tests were conducted due to the non-normal distribution of the Likert scale data. The effect size, measured by the Cliff delta, provides additional insights into the practical significance of observed differences. The scale items, encompassing the importance of energy efficiency, consumption, and related factors, directly align with the attitude component of TPB. The diverse responses across demographic groups indicate potential variations in individual attitudes toward energy efficiency.
4.6. Consideration of External Factors
Our study recognizes the multifaceted nature of energy label awareness and acknowledges the potential influence of external factors beyond demographic variables. External factors such as institutional policies, cultural influences, and ongoing sustainability initiatives may shape individuals’ awareness of energy-labeled products. While our primary focus is on demographic characteristics, we also acknowledge the potential impact of these external elements. The study design considers the broader university context, and we encourage further research to delve deeper into the specific dynamics of external factors influencing energy label awareness among university staff.
5. Results
5.1. Scale and Demographic Data
The primary objective of this study is to assess the degree of awareness regarding energy efficiency among university academic and administrative personnel. To accomplish this, a survey was performed among the academic and administrative staff at Gazi University. The questionnaire includes demographic information about the participants, including their gender, age, marital status, staff type, education level, and income. The sample comprised a gender-diverse group, with 62% male and 38% female participants, aligning with the broader gender composition within Gazi University’s academic and administrative staff. The age distribution was well-represented across various cohorts, with a significant proportion (40%) falling within the 35–44 age range. Additionally, the sample included academic (62%) and administrative (38%) staff, further categorized into various professional titles. A diverse educational background was observed, with the majority holding MSc (24%) and PhD (40%) degrees. The corresponding descriptive statistics may be seen in Table 2.
Table 2.
Demographic Characteristics of the Sample Respondents.
The demographic characteristics of the sample individuals are visually depicted in Figure 1, Figure 2, Figure 3, Figure 4, Figure 5, Figure 6 and Figure 7. Figure 1 depicts the gender distribution among academic and administrative staff at Gazi University, showcasing the relative proportions of male and female participants. Of the people surveyed, 62% were male and 38% were female.
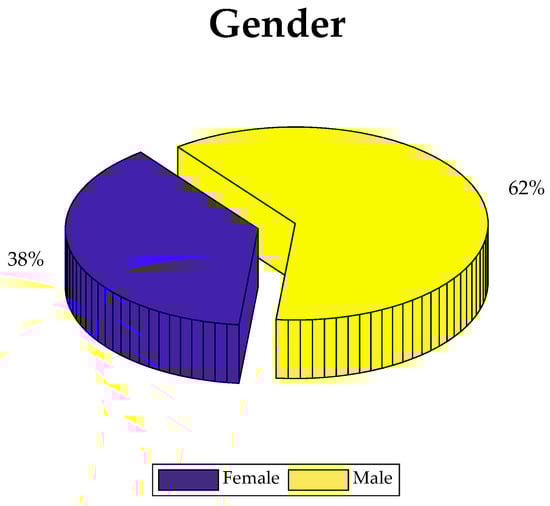
Figure 1.
Distribution of Participants by Gender.
Figure 2 illustrates the age distribution among several cohorts, providing insight into the variety of individuals within specific age groups. The age was categorized into four distinct groups. A total of 40% of the participants were aged between 35 and 44, 27% were between 18 and 34, 26% were between 45 and 54, and 7% were over 55.
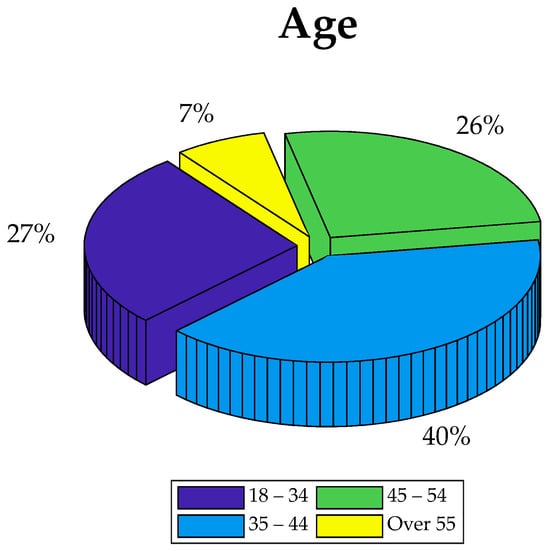
Figure 2.
Distribution of Participants by Age.
Figure 3 offers insights into the participants’ marital status, emphasizing potential factors affecting their energy efficiency awareness. In total, 76% of the participants were married, while 24% were single.
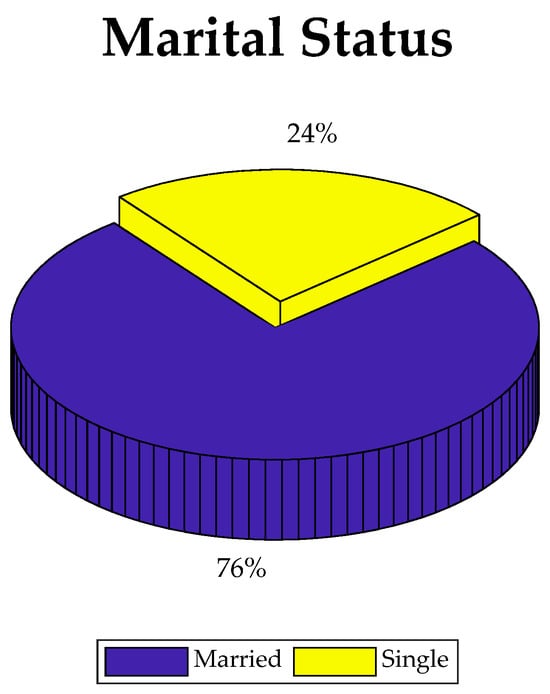
Figure 3.
Distribution of Participants by Marital Status.
The education level of the participants was categorized into five distinct groups, as depicted in Figure 4. Most participants had a PhD, comprising 40% of the total. The second largest group consisted of those with an MSc degree, accounting for 24% of the participants. Graduates from high school constituted the third largest group, comprising 18% of the total. Those with a bachelor’s degree included the fourth largest group, representing 15% of the participants. The smallest group, comprising 3% of the total, held an associate degree.
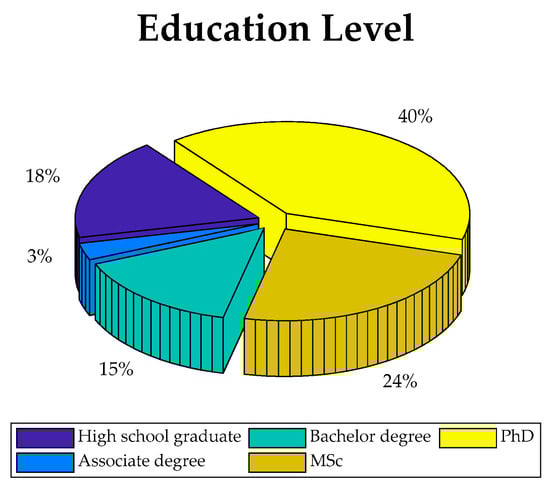
Figure 4.
Distribution of Participants by Education Level.
Figure 5 shows that 62% of the participants were academic staff, whereas 38% were administrative workers.
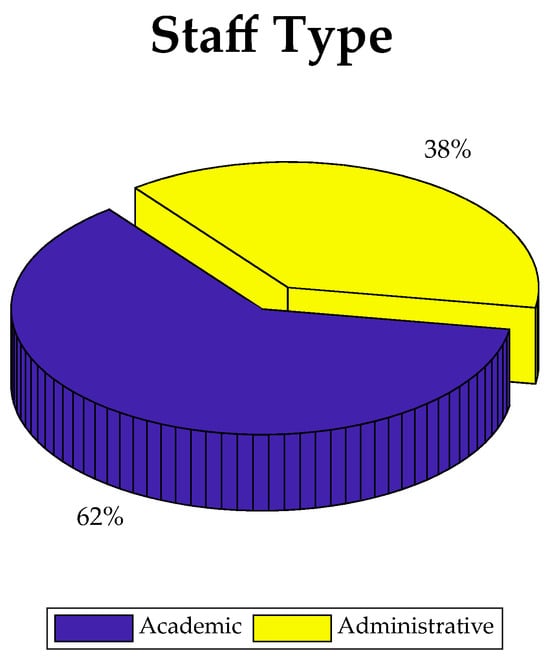
Figure 5.
Distribution of Participants by Staff Type.
The participants were classified into eight groups based on their titles, as depicted in Figure 6. The administrative personnel comprised the most significant proportion, accounting for 38%. The remaining portions were distributed equally among participants with the titles of professor, research assistant, and associate professor, representing 17%, 15%, and 10%, respectively. Conversely, 9%, 6%, 3%, and 2% of participants had the titles of instructor, associate professor, research assistant with a PhD, and instructor with a PhD, respectively.
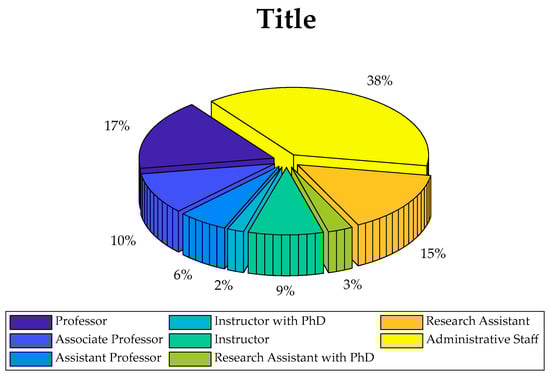
Figure 6.
Distribution of Participants by Titles.
The participants’ income was evenly distributed, as depicted in Figure 7. A total of 18% had a monthly income over USD 2040, the highest proportion. Approximately 16% of the participants reported a monthly income ranging from USD 766 to USD 1020.
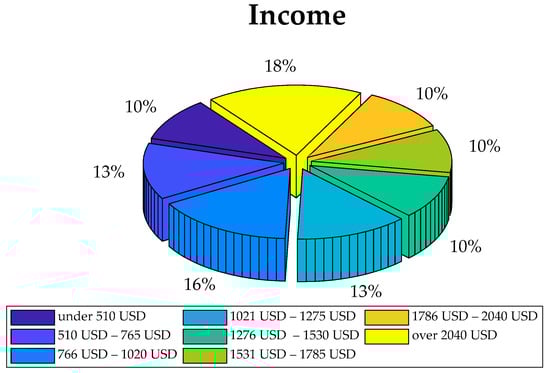
Figure 7.
Distribution of Participants by Income (USD 1 was approximately TRY 19.6 when the study was conducted).
5.2. Wilcoxon Rank Sum Test
As the 5-point Likert scale was used in the questionnaire, the normality assumption was violated to use the parametric test. Therefore, the non-parametric Wilcoxon Rank Sum test was performed to compare the university staff’s awareness scores regarding gender, marital status, and staff type. The null hypothesis states that the medians of the two groups in the sample are identical, while the alternative hypothesis states that they are not. The significance level (α) is first established, followed by calculating the test statistic and determining the p-value. The null hypothesis is determined by comparing the p-value with the significance level (α). The null hypothesis is rejected when the p-value is less than the significance level α. The null hypothesis exhibits statistical significance. If the p-value is more significant than α, there is insufficient statistical evidence to reject the null hypothesis. Hence, the null hypothesis is upheld. The hypothesis test does not yield statistically significant results. The Cliff delta value was employed to quantify the magnitude of the effect. The significance level in the Wilcoxon Rank Sum test is set at 0.05.
5.3. Gender
There was a significant difference in seven items (low energy consumption (I-6), low water consumption (I-7), quality (I-10), capacity (I-11), durability (I-15), widespread service network (I-16) and status symbol (I-18)) awareness scores of product purchasing decision with energy labels for female and male staff. The obtained statistical results are detailed in Table 3.
Table 3.
The results of Wilcoxon Rank Sum Test for Gender.
Low energy consumption: The test statistic is calculated as −2.475 (Z Value) and the p-value is obtained as 0.013. The null hypothesis is rejected since the p-value (0.013) is lower than the significance level (α = 0.05). Therefore, there was a significant difference in low energy consumption awareness scores for female and male staff. In contrast, the effect size measured by the Cliff delta is d = 0.117, indicating a negligible effect.
Low water consumption: The test statistic is calculated as −2.624 (Z Value) and the p-value is obtained as 0.009. The null hypothesis is rejected since the p-value (0.009) is lower than the significance level (α = 0.05). Therefore, there was a significant difference in low water consumption awareness scores for female and male staff. In contrast, the effect size measured by the Cliff delta is d = 0.138, indicating a negligible effect.
Quality: The test statistic is calculated as −2.185 (Z Value) and the p-value is 0.029. The null hypothesis is rejected since the p-value (0.029) is lower than the significance level (α = 0.05). Therefore, there was a significant difference in quality awareness scores for female and male staff, whereas the effect size measured by the Cliff delta is d = 0.108, indicating a negligible effect.
Capacity: The test statistic is calculated as −2.805 (Z Value) and the p-value is obtained as 0.005. The null hypothesis is rejected since the p-value (0.005) is lower than the significance level (α = 0.05). Therefore, there was a significant difference in capacity awareness scores for female and male staff. In contrast, as measured by the Cliff delta, the effect size is d = 0.154, indicating a small effect.
Durability: The test statistic is calculated as −2.318 (Z Value) and the p-value is obtained as 0.02. The null hypothesis is rejected since the p-value (0.02) is lower than the significance level (α = 0.05). Therefore, there was a significant difference in durability awareness scores for female and male staff, whereas the effect size measured by the Cliff delta is d = 0.117, indicating a negligible effect.
Widespread service network: The test statistic is −2.147 (Z Value) and the p-value is 0. 032. The null hypothesis is rejected since the p-value (0. 032) is lower than the significance level (α = 0.05). Therefore, there was a significant difference in overall service network awareness scores for female and male staff. In contrast, the effect size measured by Cliff delta is d = 0.113, indicating a negligible effect.
Status symbol: The test statistic is calculated as 2.517 (Z Value) and the p-value is obtained as 0.012. The null hypothesis is rejected since the p-value (0.012) is lower than the significance level (α = 0.05). Therefore, female and male staff had a significant difference in status symbol awareness scores. In contrast, the effect size measured by Cliff delta is d = 0.141, indicating a negligible effect.
5.4. Marital Status
There was a significant difference between groups of marital status concerning the importance of energy efficiency class (I-1), the importance of energy consumption (I-2), and the importance of capacity (I-4) for the decision to purchase products with energy labels. The obtained statistical results are detailed in Table 4.
Table 4.
The results of Wilcoxon Rank Sum Test for Marital Status.
Energy efficiency class: The test statistic is calculated as 3.463 (Z Value) and the p-value is obtained as 0.001. The null hypothesis is rejected since the p-value (0.001) is lower than the significance level (α = 0.05). Therefore, there was a significant difference in the importance of the energy efficiency class awareness scores for single and married staff. In contrast, as measured by Cliff delta, the effect size is d = 0.209, indicating a small effect.
Energy consumption: The test statistic is 2.282 (Z Value) and the p-value is 0.023. The null hypothesis is rejected since the p-value (0.023) is lower than the significance level (α = 0.05). Therefore, there was a significant difference in the importance of energy consumption awareness scores for single and married staff. In contrast, the effect size measured by Cliff delta is d = 0.141, indicating a negligible effect.
Capacity: The test statistic is calculated as −2.774 (Z Value) and the p-value is obtained as 0.006. The null hypothesis is rejected since the p-value (0.006) is lower than the significance level (α = 0.05). Therefore, there was a significant difference in the importance of capacity awareness scores for single and married academic staff. In contrast, as measured by Cliff delta, the effect size is d = 0.168, indicating a small effect.
5.5. Staff Type
There was a significant difference between groups of academic and administrative staff concerning the importance of energy consumption (I-2), the importance of water consumption (I-3), and awareness scores of status symbols when purchasing a product with energy labels (I-18). The obtained statistical results are detailed in Table 5.
Table 5.
The results of Wilcoxon Rank Sum Test for Staff Type.
Energy consumption: The test statistic is calculated as −2.006 (Z Value) and the p-value is obtained as 0.045. The null hypothesis is rejected since the p-value (0.045) is lower than the significance level (α = 0.05). Therefore, there was a significant difference in the importance of energy consumption awareness scores for academic and administrative staff. In contrast, the effect size measured by Cliff delta is d = 0.108, indicating a negligible effect.
Water consumption: The test statistic is calculated as 2.371 (Z Value) and the p-value is 0.018. The null hypothesis is rejected since the p-value (0.018) is lower than the significance level (α = 0.05). Therefore, there was a significant difference in the importance of water consumption awareness scores for academic and administrative staff. In contrast, the effect size measured by Cliff delta is d = 0.122, indicating a negligible effect.
Status Symbol: The test statistic is calculated as −3.737 (Z Value) and the p-value is 0.000. The null hypothesis is rejected since the p-value (0.000) is lower than the significance level (α = 0.05). Therefore, there was a significant difference in awareness scores of status symbols when purchasing a product with energy labels (Z Value −3.737, p = 0.000) awareness scores for academic and administrative staff. In contrast, the effect size measured by Cliff delta is d = 0.210, indicating a negligible effect.
5.6. Kruskal–Wallis Test
The Kruskal–Wallis Test, a nonparametric version ANOVA, was conducted in this study since the 5-point Likert scale was used in the questionnaire. Therefore, the normality assumption was violated to use a parametric test. The Kruskal–Wallis Test was conducted to determine whether age, education level, title, and income statistically affected awareness scores. The Kruskal–Wallis Test is used when two or more independent groups exist. The null hypothesis indicates that the medians of groups in the research item are the same for each group. Conversely, the alternative hypothesis suggests they are the same for each group. The significance level (α) is defined, then the test statistic is calculated, and the p-value is determined. The decision on the null hypothesis is based on comparing the p-value and significance level (α). The null hypothesis is rejected if the p-value is lower than α. The null hypothesis is statistically significant. The Eta square ()value was used to measure effect size. The ages of participants were divided into four categories (18–34, 35–44, 45–54, over 55), and the education level of participants was divided into five categories (high school graduate, Associate degree, Bachelor degree, MSc, Ph.D.); the title of participants were divided into eight categories (Professor, Associate Professor, Assistant Professor, Instructor with PhD, Instructor, Research Assistant with PhD, Research Assistant and Administrative Staff) and the income of participants was divided into eight categories (under USD 510, USD 510–765, USD 766–1020, USD 1021–1275, USD 1276–1530, USD 1531–1785, USD 1786–2040 and over USD 2040). Only age and education level had a statistically significant effect on awareness scores. Therefore, the results of two demographic characteristics have been explained in the following subsections.
5.7. Age
The test statistic is calculated as 12.062 ( Value) and the p-value is obtained as 0.007. The null hypothesis is rejected since the p-value (0.007) is lower than the significance level (α = 0.05). Therefore, age significantly affected awareness scores for the importance of energy efficiency class (I-1). The detailed results of the Kruskal–Wallis Test are presented in Table 6. Furthermore, the effect size () was 0.021, indicating a small effect.
Table 6.
Kruskal–Wallis Test results for the effect of age on awareness scores for importance of energy efficiency class.
To compare the difference between age categories in awareness scores for the importance of energy efficiency class, a post hoc analysis was conducted, and the related statistics are briefly summarized in Table 7. The main idea in post hoc analysis is the same as comparing the median of two independent groups. When the p-value is lower than the significance level (α), the null hypothesis is rejected; otherwise (the p-value is greater than α), there is insufficient statistical evidence to reject the null hypothesis. It is easy to see that there exists a statistical difference between awareness scores for the importance of energy efficiency class between age groups 18–34 and 45–54 since the p-value (0.004) is lower than the significance level (α = 0.05). The mean rank values of age groups 18–34 and 45–54 equal 238.392 and 187.337, respectively. The mean rank difference between the two groups is 51,054, and the value is 0.004.
Table 7.
The results of post hoc analysis of age on awareness scores for importance of energy efficiency class.
The test statistic is calculated as 8.087 () and the p-value is obtained as 0.044. The null hypothesis is rejected since the p-value (0.044) is lower than the significance level (α = 0.05). Therefore, age significantly affected awareness scores regarding the importance of capacity (I-4). The detailed results of the Kruskal–Wallis Test are presented in Table 8. Furthermore, the effect size () was 0.012, indicating a small effect.
Table 8.
Kruskal–Wallis Test results for the effect of age on awareness scores of capacity.
To compare the difference between age categories in awareness scores for the importance of capacity, a post hoc analysis was conducted, and the related statistics are briefly summarized in Table 9. A statistical difference exists between awareness scores for the importance of capacity between age groups 18–34 and 45–54 since the p-value (0.041) is lower than the significance level (α = 0.05). The mean rank values of age groups 18–34 and 45–54 equal 200.263 and 240.306, respectively. The mean rank difference between the two groups is −40.043, and the value is 0.041.
Table 9.
The results of post hoc analysis of age on awareness scores of capacity.
The test statistic is calculated as 8.746 () and the p-value is obtained as 0.033. The null hypothesis is rejected since the p-value (0.033) is lower than the significance level (α = 0.05). Therefore, age significantly affected awareness scores of quality (I-10) when purchasing a product with energy labels. The detailed results of the Kruskal–Wallis Test are presented in Table 10. Furthermore, the effect size () was 0.014, indicating a small effect.
Table 10.
Kruskal–Wallis Test results for the effect of age on awareness scores of quality.
To compare the difference between age categories in awareness scores for the importance of quality when purchasing a product with energy labels, a post hoc analysis was conducted, and the related statistics are briefly summarized in Table 11. It is easy to see that there exists a statistical difference between awareness scores for the importance of capacity between age groups 18–34 and 45–54 since the p-value (0.018) is lower than the significance level (α = 0.05). The mean rank values of age groups 18–34 and 45–54 equal 238,392 and 187,337, respectively. The mean rank difference between the two groups is 41,295 and the p-value is 0.018.
Table 11.
The results of post hoc analysis of age on awareness scores of quality.
5.8. Education Level
The test statistic is calculated as 11.941 () and the p-value is obtained as 0.017. The null hypothesis is rejected since the p-value (0.017) is lower than the significance level (α = 0.05). Therefore, education significantly affected low energy consumption awareness scores when purchasing a product with energy labels (I-6). The detailed results of the Kruskal–Wallis Test are presented in Table 12. Furthermore, the effect size () was 0.019, indicating a small effect.
Table 12.
Kruskal–Wallis Test results for the effect of education level on low energy consumption awareness scores.
To compare the difference between age categories in awareness scores of low energy consumption when purchasing a product with energy labels, a post hoc analysis was conducted, and the related statistics are briefly summarized in Table 13. It is easy to see that there exists a statistical difference between awareness scores of low energy consumption when purchasing a product with energy labels between age groups MSc and high school graduates since the p-value (0.019) is lower than the significance level (α = 0.05). The mean rank values of the age group MSc and high school graduates equal 240.406 and 193.544, respectively. The mean rank difference between the two groups is 46.862 and the value is 0.019.
Table 13.
The results of post hoc analysis of education level on awareness scores of low energy consumption.
The test statistic is calculated as 12.838 () and the p-value is obtained as 0.012. The null hypothesis is rejected since the p-value (0.012) is lower than the significance level (α = 0.05). Therefore, education significantly affected awareness scores of durability when purchasing a product with energy labels (I-15). The detailed results of the Kruskal–Wallis Test are presented in Table 14. Furthermore, the effect size () was 0.021, indicating a small effect.
Table 14.
Kruskal–Wallis Test results for the effect of education level on awareness scores of durability.
To compare the difference between age categories in awareness scores of durability when purchasing a product with energy labels, a post hoc analysis was conducted, and the related statistics are briefly summarized in Table 15. A statistical difference between awareness scores of durability when purchasing a product with energy labels between age groups Ph.D. and MSc is easy to see since the p-value (0.029) is lower than the significance level (α = 0.05). The mean rank values of the age groups PhD and MSc are equal to 201.440 and 240.99, respectively. The mean rank difference between the two groups is −39.551 and the value is 0.029.
Table 15.
The results of post hoc analysis of education level on awareness scores of durability.
The test statistic is calculated as 24.543 () and the p-value is obtained as 0.00. The null hypothesis is rejected since the p-value (0.00) is lower than the significance level (α = 0.05). Therefore, education significantly affected awareness scores of status symbols when purchasing a product with energy labels (I-18). The detailed results of the Kruskal–Wallis Test are presented in Table 16. Furthermore, the effect size () was 0.048, indicating a small effect.
Table 16.
Kruskal–Wallis Test results for the effect of education level on awareness scores of status symbol.
To compare the difference between age categories in awareness scores of status symbols when purchasing a product with energy labels, a post hoc analysis was conducted, and the related statistics are briefly summarized in Table 17. It is easy to see that there exists a statistical difference between awareness scores of status symbols when purchasing a product with energy labels between age groups Ph.D. and high school graduate, bachelor’s degree and high school graduate, MSc and high school graduate, since the p-values (0.00, 0.00 and 0.002) are lower than the significance level (α = 0.05), respectively. The mean rank values of the age group PhD and high school graduates are equal to 203.698 and 271.532, respectively. The mean rank difference between the two groups is −67,834 and the p-value is 0.00. The mean rank values of the age groups bachelor’s degree and high school graduate are equal to 184,659 and 271.532, respectively. The mean rank difference between the two groups is −86,873 and the p-value is 0.00. The mean rank values of the age group MSc and high school graduates are equal to 204,985 and 271.532, respectively. The mean rank difference between the two groups is −66,547 and the value is 0.002. It is easy to see that when the education level increases, the awareness scores of status symbols when purchasing a product with energy labels decrease. A negative correlation exists between education level and the awareness scores of status symbols.
Table 17.
The results of post hoc analysis of education level on awareness scores of status symbol.
6. Discussion
This study, rooted in the TPB, delved into how demographic factors may shape individual attitudes, subjective norms, and perceived behavioral control, ultimately influencing energy efficiency awareness among Gazi University academic and administrative staff. The TPB serves as a guiding framework for translating theoretical insights into actionable interventions. The components of the TPB: attitudes, subjective norms, and perceived behavioral control, play a pivotal role in shaping individuals’ energy efficiency awareness. To translate these theoretical constructs into practical strategies, interventions can be designed to target specific components identified in our study. By explicitly linking our theoretical framework to practical implications, our study offers a roadmap for developing targeted and effective interventions that contribute to fostering a more energy-conscious community.
Findings highlight gender-specific variations in attitudes towards various aspects of energy efficiency, as identified by the TPB’s attitude component. Addressing these differences through targeted interventions and educational strategies can enhance overall awareness and contribute to a more sustainable and energy-efficient academic community at Gazi University. The observed differences between academic and administrative staff highlight the importance of tailoring energy label awareness campaigns to specific professional roles. While the effect sizes are generally small, indicating subtle differences, addressing these distinctions could lead to more effective and targeted interventions. Future initiatives should consider academic and administrative staff’s specific needs and perceptions, aiming for a holistic approach that aligns with the TPB components, mainly focusing on attitudes and perceptions. The findings underscore the relevance of incorporating age-specific considerations into energy label awareness initiatives. As the TPB posits, attitudes and perceptions significantly influence behavioral intentions. Therefore, aligning awareness campaigns with the distinct perspectives of various age groups can contribute to fostering a more energy-conscious university community at Gazi University. The results underscore the importance of considering education in designing energy-label awareness interventions. Aligning campaigns with the unique perceptions and priorities of individuals with different educational backgrounds can contribute to a more nuanced and practical approach to promoting energy-conscious behaviors within the Gazi University staff community. The negative correlation between education level and the perceived status symbol highlights the importance of addressing potential misconceptions or biases associated with energy labels. Understanding these dynamics is crucial for fostering positive attitudes and behaviors. The implications of these findings are discussed in terms of designing targeted interventions and strategies to enhance awareness and promote energy-efficient behaviors within this academic context.
6.1. Demographic Data
The TPB can be applied to interpret these findings. As outlined in the TPB, individual attitudes, subjective norms, and perceived behavioral control are crucial components influencing energy efficiency awareness. The demographic data act as influential factors that may shape these components. Age, income, and education can affect perceived control over adopting energy-efficient practices. Younger individuals or those with higher education might feel more control over incorporating such practices.
The demographic characteristics of the participants in this study provide a comprehensive understanding of the sample and form the basis for exploring how these factors may influence energy efficiency awareness among Gazi University academic and administrative staff. Table 1 and Figure 1, Figure 2, Figure 3, Figure 4, Figure 5, Figure 6 and Figure 7 illustrate the distribution of participants across various demographic variables.
The sample is gender-diverse, with 62% male and 38% female participants. This distribution reflects the broader gender composition within the academic and administrative staff at Gazi University. The age distribution is well-represented across different cohorts, with a significant proportion (40%) falling within the 35–44 age range. This diversity allows insights into how awareness might vary among different age groups. Most participants are married (76%), while 24% are single. This demographic factor introduces the potential influence of marital status on energy efficiency awareness. Participants exhibit a diverse educational background, with the majority holding MSc (24%) and PhD (40%) degrees. The impact of education on awareness can be explored through this diverse group. The participants include academic (62%) and administrative (38%) staff, further categorized into various titles. Marital status, income, and education level may contribute to perceived societal expectations and influence subjective norms.
Beyond the demographic factors explored in our study, it is imperative to acknowledge the potential impact of external factors on energy label awareness. Institutional policies and cultural influences can significantly shape individuals’ perceptions and behaviors concerning energy efficiency. Institutional initiatives, such as sustainability programs or awareness campaigns at Gazi University, may play a pivotal role in influencing energy label awareness among academic and administrative staff. Additionally, cultural norms within the broader societal context can contribute to variations in energy awareness behaviors. Recognizing the importance of these external elements provides a more comprehensive view of the dynamics surrounding energy label awareness. Future research endeavors should delve deeper into these external factors, considering their nuanced interactions with demographic influences, to develop more effective and contextually sensitive interventions.
6.2. Gender
The findings indicate significant differences in awareness scores for specific items related to product purchasing decisions with energy labels between female and male academic staff. This discussion will interpret these results within the TPB framework and its components: Attitude, Subjective Norms, and Perceived Behavioral Control.
- Low Energy Consumption (I-6): Gender differences may influence how individuals perceive the importance of low energy consumption in their purchasing decisions. Strategies to enhance positive attitudes toward energy efficiency may benefit both genders.
- Low Water Consumption (I-7): Gender-related variations may influence attitudes toward the importance of water efficiency. Educational interventions can target both genders to improve awareness and attitudes.
- Quality (I-10): Gender differences may shape perceptions of the quality of energy-efficient products. Addressing these variations could be crucial in fostering positive attitudes.
- Capacity (I-11): Gender-related variations may influence perceptions of product capacity concerning energy efficiency. Strategies to highlight the importance of capacity for both genders may enhance awareness.
- Durability (I-15): Gender-related variations may influence perceptions of durability concerning energy-efficient products. Educational campaigns can target both genders to improve awareness.
- Widespread Service Network (I-16): Gender differences may shape perceptions of the significance of a widespread service network for energy-efficient products. Strategies can aim at enhancing positive attitudes in both genders.
- Status Symbol (I-18): Gender-related variations may influence perceptions of products as status symbols in the context of energy efficiency. Educational efforts can address these variations to improve awareness.
6.3. Staff
The findings of the Wilcoxon Rank Sum Test reveal significant differences in awareness scores among academic and administrative staff regarding certain aspects of energy labels, explicitly focusing on the importance of energy consumption (I-2), the importance of water consumption (I-3), and awareness scores of the status symbol (I-18) during product purchasing decisions.
- Importance of Energy Consumption (I-2): The findings suggest that differences in the importance attached to energy consumption may exist between academic and administrative staff. Addressing these differences through targeted awareness campaigns may help align attitudes and promote energy-efficient practices.
- Importance of Water Consumption (I-3): Variations in the importance placed on water consumption suggest the need for tailored interventions. Strategies to enhance awareness among academic and administrative staff could be implemented to foster a common understanding of the significance of water efficiency.
- Awareness Scores of Status Symbol (I-18): The status symbol associated with purchasing energy-labeled products may have a more pronounced influence on one group compared to the other. Strategies to leverage this perception, such as emphasizing the prestige of energy-efficient choices, could be explored.
Kruskal–Wallis Test: The Kruskal–Wallis Test indicates that age and education level statistically affect awareness scores, suggesting the importance of considering these demographic factors in designing targeted awareness programs.
6.4. Age
The Kruskal–Wallis Test results indicate a significant effect of age on awareness scores for three key aspects: the importance of energy efficiency class (I-1), the importance of capacity (I-4), and awareness scores of quality when purchasing a product with energy labels (I-10).
- Importance of Energy Efficiency Class (I-1): A significant difference exists between age groups 18–34 and 45–54, suggesting variations in perceptions of the importance of energy efficiency class among these age categories.
- Importance of Capacity (I-4): The difference is particularly pronounced between age groups 18–34 and 45–54, suggesting that individuals in the 45–54 age category may have distinct perceptions regarding the importance of capacity in energy-labeled products.
- Awareness Scores of Quality (I-10): A significant difference is observed between age groups 18–34 and 45–54, highlighting potential divergences in perceptions of quality considerations when choosing energy-labeled products.
Understanding the nuanced perspectives of different age cohorts allows for developing educational strategies that resonate with diverse age-related concerns and priorities.
6.5. Education Level
The Kruskal–Wallis Test results indicate a significant effect of education level on awareness scores for low energy consumption (I-6), durability (I-15), and status symbol (I-18) when purchasing a product with energy labels.
- Awareness Scores of Low Energy Consumption (I-6): Statistically significant differences exist between individuals with an MSc and those with a high school graduate education, indicating distinctions in perceptions regarding the importance of low energy consumption when purchasing energy-labeled products.
- Awareness Scores of Durability (I-15): Significant differences are observed between individuals with a PhD and those with an MSc, suggesting variations in perceptions of the importance of durability in energy-labeled products.
- Awareness Scores of Status Symbol (I-18): A consistent pattern emerges where awareness scores decrease as education level increases. Specifically, there are significant differences between individuals with a Ph.D. and those with a high school graduate education, between those with a bachelor’s degree and high school graduates, and between individuals with an MSc and high school graduates. This suggests a negative correlation between education level and the perceived status symbol associated with energy-labeled products.
6.6. Consistency of Awareness Differences across Energy-Labeled Products
To further deepen our exploration, we scrutinized the data to understand whether observed differences in awareness persist consistently across various energy-labeled products. Our analysis revealed nuanced variations in attitudes towards specific products, such as those emphasizing low energy consumption, low water consumption, quality, capacity, durability, and the significance of a widespread service network. These variations shed light on the intricate interplay between demographic factors and the perceived importance of different energy efficiency attributes. By examining these differences across distinct product categories, our study contributes valuable insights into tailoring interventions for specific energy-labeled products, thus fostering a more targeted and practical approach to energy label awareness campaigns.
6.7. Navigating the Intersection of Awareness and Behavior
Our findings, rooted in the TPB, bear direct relevance to interventions aimed at enhancing energy label awareness. For instance, recognizing the gender-specific variations in attitudes toward energy efficiency suggests the potential for targeted interventions addressing these differences. Educational strategies tailored to specific age groups and academic backgrounds align with the TPB’s emphasis on attitudes and perceptions. As we delve into the practical implications of our study, we emphasize the need for interventions that resonate with the unique perspectives of diverse demographic groups. By aligning with the TPB components, our study contributes to academic discourse and offers actionable insights for crafting effective energy label awareness initiatives.
A pivotal aspect of our study involves elucidating the intricate relationship between variations in awareness and the manifestation of actual energy-related behaviors among the diverse staff at Gazi University. Grounded in the Theory of Planned Behavior, which emphasizes the interplay of individual attitudes, subjective norms, and perceived behavioral control, our research probes into the nuanced dynamics that influence behavioral intentions within the academic community. Our findings underscore the significance of demographic-specific variations in awareness, pointing towards the potential divergence in energy-related behaviors among distinct groups. Notably, gender-specific differences in attitudes towards energy efficiency may give rise to discernible behavioral patterns, necessitating precisely tailored interventions for effective alignment with sustainability objectives. Additionally, the observed distinctions between academic and administrative staff highlight the importance of tailored strategies to bridge the gap between heightened awareness and tangible actions.
As we weave together the intricate threads connecting demographic factors, attitudes, and behaviors, our study presents valuable insights that extend beyond the specific context of Gazi University. By fortifying these connections and contributing to the broader behavior change literature, we aspire to enhance the theoretical foundations of the TPB and offer actionable recommendations for designing interventions to cultivate sustainable behaviors within academic settings. This holistic understanding enriches the academic discourse and holds practical implications for developing targeted and effective sustainability interventions.
6.8. Methodological and Contextual Limitations
Our study contributes valuable insights into energy label awareness among Gazi University’s academic and administrative staff, acknowledging the dynamic nature of awareness over time and the influence of various external factors. The cross-sectional nature of our research provides a snapshot of awareness at a specific time, limiting our ability to discern causal relationships and temporal changes in energy label awareness over an extended period. To address this limitation, future longitudinal studies could be instrumental in capturing the evolving nature of energy label awareness, allowing for a more nuanced understanding of trends or shifts in perceptions.
Furthermore, while providing meaningful insights within this institutional context, our study’s exclusive focus on Gazi University’s academic and administrative staff raises considerations about the generalizability of findings to other institutions with different demographic compositions and contextual factors. The unique demographic composition, institutional culture, and geographical location of Gazi University contribute to its distinguishing characteristics. Therefore, caution is warranted when extrapolating our results to diverse contexts, and future research efforts could enhance external validity by including a more diverse range of institutions.
Additionally, our study identifies the potential influence of ongoing initiatives within Gazi University, such as sustainability programs or awareness campaigns, on energy label awareness. These external interventions may introduce confounding variables that our study must fully encapsulate for a comprehensive understanding. As we acknowledge these methodological limitations, it becomes evident that capturing the temporal dimensions and external influences necessitates ongoing research efforts to refine and deepen our understanding of the factors shaping energy label awareness among academic and administrative staff.
Moreover, we recognize that energy label perceptions are subject to evolving societal trends and technological advancements, potentially impacting the stability of awareness over time. While our research aims to provide a comprehensive snapshot of energy efficiency awareness, readers should consider these methodological constraints when interpreting the study’s outcomes, emphasizing the need for ongoing research to capture the evolving dynamics in energy label awareness.
While our study strives to make meaningful contributions to understanding energy-related perceptions within the university setting, we also acknowledge the potential for variations in perceptions and attitudes across different countries, regions, and economies. This diversity should be considered in future research, prompting subsequent studies to explore energy efficiency awareness across various universities and institutions. Conducting cross-cultural studies could comprehensively examine potential differences, considering cultural norms, economic conditions, and regional policies that significantly shape energy efficiency awareness. Understanding these variations will contribute to developing targeted interventions that are culturally and regionally sensitive, fostering a more sustainable and energy-conscious global community.
7. Conclusions
In this comprehensive exploration of energy label awareness among Gazi University staff, our study employed the TPB as a guiding framework to investigate the influence of various demographic factors on attitudes and perceptions toward energy-labeled products. The conclusions drawn in this study are firmly grounded in the evidence and arguments presented throughout the research. Notably, our findings on gender-specific variations in attitudes toward energy efficiency, significant differences among academic and administrative staff, and the influence of demographic factors on energy label awareness converge to answer the main research question regarding the impact of demographics on energy efficiency awareness at Gazi University. We have comprehensively understood the dynamics influencing energy label awareness by addressing each aspect of the TPB and demographic factors. Each identified difference or pattern directly answers the overarching research question, creating a cohesive narrative that aligns with the evidence amassed.
The findings provide valuable insights into the factors shaping awareness, preferences, and decision-making processes related to energy efficiency. Significant differences emerged among marital status groups regarding the importance of energy efficiency class, energy consumption, and capacity when purchasing products with energy labels. Single and married individuals displayed variations in their attitudes, indicating the need for tailored awareness strategies addressing the diverse concerns within these subgroups. Academic and administrative staff exhibited significant differences in their awareness of energy consumption, water consumption, and the perceived status symbol associated with energy-labeled products.
In light of the observed variations in energy label awareness among different demographic groups, our study underscores the importance of tailoring interventions to address specific practical challenges and opportunities. For instance, the gender-specific differences identified in attitudes towards various aspects of energy efficiency suggest that targeted educational campaigns can effectively enhance awareness for both male and female staff members. Similarly, the significant distinctions noted between academic and administrative staff call for tailored strategies, ensuring that energy label awareness initiatives align with these professional roles’ distinct priorities and perspectives. By thoroughly understanding and addressing these demographic nuances, we aim to contribute to academic discourse and the development of practical, impactful interventions that foster a more energy-conscious community at Gazi University and beyond.
It is important to note that our study focused specifically on the academic and administrative staff of Gazi University, providing valuable insights into energy efficiency awareness within this institutional context. While the findings offer meaningful contributions to understanding energy-related perceptions within the university setting, the potential for variations in perceptions and attitudes across different countries, regions, and economies must be considered. We acknowledge the potential benefits of expanding the participant pool in future research. Subsequent studies could explore energy efficiency awareness across a more diverse range of universities and institutions, allowing for a broader examination of the factors influencing energy-conscious behaviors in various academic settings. Future research endeavors could consider conducting cross-cultural studies to explore these potential differences comprehensively. Cultural norms, economic conditions, and regional policies may significantly shape energy efficiency awareness. Understanding these variations can contribute to developing targeted interventions that are culturally and regionally sensitive, fostering a more sustainable and energy-conscious global community.
Tailoring interventions to academic and administrative staff’s specific needs and priorities can enhance the effectiveness of energy label awareness initiatives. Age significantly influenced awareness scores for energy efficiency class, capacity, and quality. Targeted interventions based on age categories, particularly emphasizing the importance of capacity, can foster more relevant and impactful awareness campaigns. Education level significantly influenced awareness scores for low energy consumption, durability, and the perceived status symbol. Tailoring educational campaigns to the unique perspectives of different academic backgrounds is crucial, particularly in addressing potential misconceptions related to the perceived status symbol associated with energy-labeled products. Designing awareness programs considering marital status, staff type, age, and education level can enhance their relevance and effectiveness. Recognizing the negative correlation between education level and the perceived status symbol associated with energy labels is essential. Efforts should focus on dispelling potential biases and promoting positive associations with energy-conscious choices. Future research endeavors should consider expanding the scope to include a broader demographic representation and assessing the longitudinal impact of awareness campaigns on actual energy-related behaviors. Our study provides a foundation for targeted and nuanced energy label awareness initiatives. By understanding the subtle influences of demographic factors, policymakers, and practitioners can tailor interventions to create a more sustainable and energy-conscious community within Gazi University and beyond.
Author Contributions
Conceptualization, H.N.D.S. and B.D.; methodology, H.N.D.S. and F.E.B.; software, F.E.B.; formal analysis, F.E.B.; investigation, H.N.D.S. and B.D.; data curation, F.E.B.; writing—original draft preparation, H.N.D.S.; writing—review and editing, H.N.D.S., B.D. and F.E.B.; visualization, F.E.B. All authors have read and agreed to the published version of the manuscript.
Funding
This research received no external funding.
Institutional Review Board Statement
The study was conducted by the Declaration of Helsinki and approved by the Ethics Committee of GAZI UNIVERSITY (protocol code 2022—1249 and date of approval: 22 November 2022).
Informed Consent Statement
Informed consent was obtained from all subjects involved in the study.
Data Availability Statement
The data presented in this study are available on request from the corresponding author. The data are not publicly available due to organizational restrictions.
Acknowledgments
We would like to thank Gazi University for granting the necessary permissions to conduct the research in the academic and administrative units of Gazi University.
Conflicts of Interest
The authors declare no conflicts of interest.
References
- Economidou, M.; Todeschi, V.; Bertoldi, P.; D’Agostino, D.; Zangheri, P.; Castellazzi, L. Review of 50 years of EU energy efficiency policies for buildings. Energy Build. 2020, 225, 110322. [Google Scholar] [CrossRef]
- Ahmed, F.E.; Hashaikeh, R.; Hilal, N. Hybrid technologies: The future of energy efficient desalination—A review. Desalination 2020, 495, 114659. [Google Scholar] [CrossRef]
- Torres, G.O.; Morales, J.Y.R.; Martinez, M.R.; Valdez-Martínez, J.S.; Calixto-Rodriguez, M.; Sarmiento-Bustos, E.; Cantero, C.A.T.; Buenabad-Arias, H.M. Active Fault-Tolerant Control Applied to a Pressure Swing Adsorption Process for the Production of Bio-Hydrogen. Mathematics 2023, 11, 1129. [Google Scholar] [CrossRef]
- Núñez, A.R.L.; Morales, J.Y.R.; Villalobos, A.U.S.; De La Cruz-Soto, J.; Torres, G.O.; Cerda, J.C.R.; Calixto-Rodriguez, M.; Mendoza, J.A.B.; Molina, Y.A.; Durán, O.A.Z.; et al. Optimization and Recovery of a Pressure Swing Adsorption Process for the Purification and Production of Bioethanol. Fermentation 2022, 8, 293. [Google Scholar] [CrossRef]
- Kumar, S.; Rathore, K. Renewable Energy for Sustainable Development Goal of Clean and Affordable Energy. Int. J. Mater. Manuf. Sustain. Technol. 2023, 2, 1–15. [Google Scholar] [CrossRef]
- Haldorai, A. A Survey of Renewable Energy Sources and their Contribution to Sustainable Development. J. Enterp. Bus. Intell. 2022, 2, 211–222. [Google Scholar] [CrossRef]
- Jamil, F.; Shafiq, I.; Sarwer, A.; Ahmad, M.; Akhter, P.; Inayat, A.; Shafique, S.; Park, Y.-K.; Hussain, M. A critical review on the effective utilization of geothermal energy. Energy Environ. 2023, 35, 438–457. [Google Scholar] [CrossRef]
- Alper, K.; Tekin, K.; Karagöz, S.; Ragauskas, A.J. Sustainable energy and fuels from biomass: A review focusing on hydrothermal biomass processing. Sustain. Energy Fuels 2020, 4, 4390–4414. [Google Scholar] [CrossRef]
- Arguedas, C.; Rousseau, S. Energy-efficient design, consumer awareness, and public policy. SERIEs 2021, 12, 231–254. [Google Scholar] [CrossRef]
- Weiss, M.; Cloos, K.C.; Helmers, E. Energy efficiency trade-offs in small to large electric vehicles. Environ. Sci. Eur. 2020, 32, 46. [Google Scholar] [CrossRef]
- Chen, Y.; Zhao, Z.J. The rise of green bonds for sustainable finance: Global standards and issues with the expanding Chinese market. Curr. Opin. Environ. Sustain. 2021, 52, 54–57. [Google Scholar] [CrossRef]
- Paramati, S.R.; Shahzad, U.; Doğan, B. The role of environmental technology for energy demand and energy efficiency: Evidence from OECD countries. Renew. Sustain. Energy Rev. 2022, 153, 111735. [Google Scholar] [CrossRef]
- Rasoulinezhad, E.; Taghizadeh-Hesary, F. Role of green finance in improving energy efficiency and renewable energy development. Energy Effic. 2022, 15, 14. [Google Scholar] [CrossRef]
- Zakari, A.; Khan, I.; Tan, D.; Alvarado, R.; Dagar, V. Energy efficiency and sustainable development goals (SDGs). Energy 2022, 239, 122365. [Google Scholar] [CrossRef]
- Brugger, H.; Eichhammer, W.; Mikova, N.; Dönitz, E. Energy Efficiency Vision 2050: How will new societal trends influence future energy demand in the European countries? Energy Policy 2021, 152, 112216. [Google Scholar] [CrossRef]
- Dolšak, J.; Hrovatin, N.; Zorić, J. Analysing Consumer Preferences, Characteristics, and Behaviour to Identify Energy-Efficient Consumers. Sustainability 2020, 12, 9870. [Google Scholar] [CrossRef]
- Żywiołek, J.; Rosak-Szyrocka, J.; Mrowiec, M. Knowledge Management in Households about Energy Saving as Part of the Awareness of Sustainable Development. Energies 2021, 14, 8207. [Google Scholar] [CrossRef]
- Blasch, J.; Boogen, N.; Daminato, C.; Filippini, M. Empower the consumer! energy-related financial literacy and its implications for economic decision making. Econ. Energy Environ. Policy 2021, 10, 149–180. [Google Scholar] [CrossRef]
- Ansari, M.F.; Dash, B.; Sharma, P.; Yathiraju, N. The Impact and Limitations of Artificial Intelligence in Cybersecurity: A Literature Review. IJARCCE 2022, 11, 81–90. [Google Scholar] [CrossRef]
- Klein, J.T. Sustainability and Collaboration: Cross disciplinary and Cross-Sector Horizons. Sustainability 2020, 12, 1515. [Google Scholar] [CrossRef]
- Tobin, K.; Alexakos, K. Global challenges need attention now: Educating humanity for wellness and sustainability. Cult. Stud. Sci. Educ. 2021, 16, 651–673. [Google Scholar] [CrossRef]
- Stasiuk, K.; Maison, D. The Influence of New and Old Energy Labels on Consumer Judgements and Decisions about Household Appliances. Energies 2022, 15, 1260. [Google Scholar] [CrossRef]
- Elsen, M.; Leenheer, J. Energy efficiency of consideration sets and choices: The impact of label format. Eur. J. Mark 2022, 56, 2484–2505. [Google Scholar] [CrossRef]
- Robinson, E.; Polden, M.; Langfield, T.; Clarke, K.; Calvert, L.; Colombet, Z.; O’flaherty, M.; Marty, L.; Tapper, K.; Jones, A. Socioeconomic position and the effect of energy labelling on consumer behaviour: A systematic review and meta-analysis. Int. J. Behav. Nutr. Phys. Act. 2023, 20, 1–15. [Google Scholar] [CrossRef]
- Skourtos, M.; Damigos, D.; Tourkolias, C.; Kontogianni, A. Efficient energy labelling: The impact of information content and style on product choice. Energy Effic. 2021, 14, 58. [Google Scholar] [CrossRef]
- Li, X.; Dai, J.; Zhu, X.; Li, J.; He, J.; Huang, Y.; Liu, X.; Shen, Q. Mechanism of attitude, subjective norms, and perceived behavioral control influence the green development behavior of construction enterprises. Humanit. Soc. Sci. Commun. 2023, 10, 1–13. [Google Scholar] [CrossRef]
- Brehmer, M. Perceived Moral Norms in an Extended Theory of Planned Behavior in Predicting University Students’ Bystander Intentions toward Relational Bullying. Eur. J. Investig. Health Psychol. Educ. 2023, 13, 1202–1218. [Google Scholar] [CrossRef]
- Huse, C.; Lucinda, C.; Cardoso, A.R. Consumer response to energy label policies: Evidence from the Brazilian energy label program. Energy Policy 2020, 138, 111207. [Google Scholar] [CrossRef]
- Toft, M.B.; Schuitema, G.; Thøgersen, J. Responsible technology acceptance: Model development and application to consumer acceptance of Smart Grid technology. Appl. Energy 2014, 134, 392–400. [Google Scholar] [CrossRef]
- De Ayala, A.; Galarraga, I. The role of label information on consumer preferences for energy efficient appliances in spain. In Heading Towards Sustainable Energy Systems: Evolution or Revolution? Proceedings of the 15th IAEE European Conference, Vienna, Austria, 3–6 September 2017; International Association for Energy Economics: Mt Royal, NJ, USA; p. 2008.
- Ajzen, I. From intentions to actions: A theory of planned behavior. In Action Control: From Cognition to Behavior; Springer: Berlin/Heidelberg, Germany, 1985; pp. 11–39. [Google Scholar]
- Schifter, D.E.; Ajzen, I. Intention, perceived control, and weight loss: An application of the theory of planned behavior. J. Pers. Soc. Psychol. 1985, 49, 843. [Google Scholar] [CrossRef] [PubMed]
- Lonergan, S.C.; Cocklin, C. In the aftermath of the energy crisis New Zealand’s energy policy in the 1970s and 1980s. Energy Policy 1990, 18, 100–116. [Google Scholar] [CrossRef]
- An, X.; Pivo, G. Green Buildings in Commercial Mortgage-Backed Securities: The Effects of LEED and Energy Star Certification on Default Risk and Loan Terms. Real Estate Econ. 2020, 48, 7–42. [Google Scholar] [CrossRef]
- Bergman, N.; Foxon, T.J. Reframing policy for the energy efficiency challenge: Insights from housing retrofits in the United Kingdom. Energy Res. Soc. Sci. 2020, 63, 101386. [Google Scholar] [CrossRef]
- de Salvo Junior, O.; de Souza, M.T.S.; de Almeida, F.G.V. Implementation of new technologies for reducing fuel consumption of automobiles in Brazil according to the Brazilian Vehicle Labelling Programme. Energy 2021, 233, 121132. [Google Scholar] [CrossRef]
- Kallbekken, S.; Hermansen, E. Consumer preferences for energy efficient cars in Norway. In Heading Towards Sustainable Energy Systems: Evolution or Revolution? Proceedings of the 15th IAEE European Conference, Vienna, Austria, 3–6 September 2017; International Association for Energy Economics: Mt Royal, NJ, USA, 2017; p. 8. [Google Scholar]
- Jägerbrand, A.K. Synergies and trade-offs between sustainable development and energy performance of exterior lighting. Energies 2020, 13, 2245. [Google Scholar] [CrossRef]
- Schuberth, J.; Ebert, T.; Schlegel, M.-C.; Rödig, L.; Jepsen, D.; Memelink, R.; Hauschke, F. The Front-Runner Approach & mdash; Facilitating Progressive Product Policy by Using Information from EU Product Databases. Energies 2024, 17. [Google Scholar] [CrossRef]
- Zhang, G.; Zhang, C.; Nie, H. An Overview of China’s Energy Labeling Policy Portfolio: China’s Contribution to Addressing the Global Goal of Sustainable Development. SAGE Open 2021, 11, 2158244020988858. [Google Scholar] [CrossRef]
- Zha, D.; Yang, G.; Wang, W.; Wang, Q.; Zhou, D. Appliance energy labels and consumer heterogeneity: A latent class approach based on a discrete choice experiment in China. Energy Econ. 2020, 90, 104839. [Google Scholar] [CrossRef]
- Faure, C.; Guetlein, M.C.; Schleich, J. Effects of rescaling the EU energy label on household preferences for top-rated appliances. Energy Policy 2021, 156, 112439. [Google Scholar] [CrossRef]
- Mohan, R.; Kinslin, D. The Theory of Planned Behaviour and Examining Consumer Purchase Behaviours of Energy-Efficient Lighting Products. Int. J. Prof. Bus. Rev. 2022, 7, e0422. [Google Scholar] [CrossRef]
- Zhang, H. Behind the Scenes: Exploring Context and Audience Engagement Behaviors in YouTube Vlogs. In Lecture Notes in Computer Science; Meiselwitz, G., Ed.; Springer International Publishing: Berlin/Heidelberg, Germany, 2022; pp. 227–244. [Google Scholar] [CrossRef]
- Beck, M.; Toulouse, N.Ö. Assessing the impact of energy labels on attitude and behavioral intention: An empirical investigation. J. Clean. Prod. 2023, 415, 137751. [Google Scholar] [CrossRef]
- Schleich, J.; Durand, A.; Brugger, H. How effective are EU minimum energy performance standards and energy labels for cold appliances? Energy Policy 2021, 149, 112069. [Google Scholar] [CrossRef]
- Bertoldi, P. Overview of the European Union policies to promote more sustainable behaviours in energy end-users. In Energy and Behaviour; Elsevier: Amsterdam, The Netherlands, 2020; pp. 451–477. [Google Scholar]
- Andor, M.A.; Gerster, A.; Sommer, S. Consumer Inattention, Heuristic Thinking and the Role of Energy Labels. Energy J. 2020, 41, 83–112. [Google Scholar] [CrossRef]
- Jiang, C.; Fan, T.; Gao, H.; Shi, W.; Liu, L.; Cérin, C.; Wan, J. Energy aware edge computing: A survey. Comput. Commun. 2020, 151, 556–580. [Google Scholar] [CrossRef]
- Gródek-Szostak, Z.; Malinowski, M.; Suder, M.; Kwiecień, K.; Bodziacki, S.; Vaverková, M.D.; Maxianová, A.; Krakowiak-Bal, A.; Ziemiańczyk, U.; Uskij, H.; et al. Energy conservation behaviors and awareness of polish, czech and ukrainian students: A case study. Energies 2021, 14, 5599. [Google Scholar] [CrossRef]
- Alfaoyzan, F.A.; Almasri, R.A. Benchmarking of Energy Consumption in Higher Education Buildings in Saudi Arabia to Be Sustainable: Sulaiman Al-Rajhi University Case. Energies 2023, 16, 1204. [Google Scholar] [CrossRef]
- Yildiz, Y.; Kocyigit, M. Energy consumption analysis of education buildings: The case study of balikesir university. Gazi Univ. J. Sci. 2021, 34, 665–677. [Google Scholar] [CrossRef]
- Bastida-Molina, P.; Torres-Navarro, J.; Honrubia-Escribano, A.; Gómez-Lázaro, E. Electricity consumption analysis for university buildings. Empirical approach for University of Castilla-La Mancha, campus Albacete (Spain). Renew. Energy Power Qual. J. 2022, 20, 216–221. [Google Scholar] [CrossRef]
- Hajjaji, I.; El Alami, H.; El Alami, R.; Dahmouni, H. Energy Consumption Characterization in University Campus Microgrid Based on Power Data Analysis. In Proceedings of the 2022 International Conference on Future Internet of Things and Cloud, FiCloud 2022, Rome, Italy, 22–24 August 2022. [Google Scholar] [CrossRef]
- Broujeny, R.S.; Ayed, S.B.; Matalah, M. Energy Consumption Forecasting in a University Office by Artificial Intelligence Techniques: An Analysis of the Exogenous Data Effect on the Modeling. Energies 2023, 16, 4065. [Google Scholar] [CrossRef]
- Ajzen, I. The theory of planned behavior: Frequently asked questions. Hum. Behav. Emerg. Technol. 2020, 2, 314–324. [Google Scholar] [CrossRef]
- Ajzen, I.; Schmidt, P. Changing behavior using the theory of planned behavior. In The Handbook of Behavior Change; Cambridge University Press: Cambridge, UK, 2020; pp. 17–31. [Google Scholar]
- La Barbera, F.; Ajzen, I. Control interactions in the theory of planned behavior: Rethinking the role of subjective norm. Eur. J. Psychol. 2020, 16, 401. [Google Scholar] [CrossRef] [PubMed]
- Sultan, P.; Tarafder, T.; Pearson, D.; Henryks, J. Intention-behaviour gap and perceived behavioural control-behaviour gap in theory of planned behaviour: Moderating roles of communication, satisfaction and trust in organic food consumption. Food Qual. Prefer. 2020, 81, 103838. [Google Scholar] [CrossRef]
- Si, H.; Shi, J.; Tang, D.; Wu, G.; Lan, J. Understanding intention and behavior toward sustainable usage of bike sharing by extending the theory of planned behavior. Resour. Conserv. Recycl. 2020, 152, 104513. [Google Scholar] [CrossRef]
- Gibson, L.P.; Magnan, R.E.; Kramer, E.B.; Bryan, A.D. Theory of Planned Behavior Analysis of Social Distancing during the COVID-19 Pandemic: Focusing on the Intention-Behavior Gap. Ann. Behav. Med. 2021, 55, 805–812. [Google Scholar] [CrossRef]
Disclaimer/Publisher’s Note: The statements, opinions and data contained in all publications are solely those of the individual author(s) and contributor(s) and not of MDPI and/or the editor(s). MDPI and/or the editor(s) disclaim responsibility for any injury to people or property resulting from any ideas, methods, instructions or products referred to in the content. |
© 2024 by the authors. Licensee MDPI, Basel, Switzerland. This article is an open access article distributed under the terms and conditions of the Creative Commons Attribution (CC BY) license (https://creativecommons.org/licenses/by/4.0/).