1. Introduction
The food industry is one of the most important consumers of fresh water in the world, and, at the same time, one of the largest wastewater producers [
1]. It has been estimated that up to 4 trillion m
3/y are used by the industrial sectors, and this poses a severe risk for the environment, when directly discharged, for example, by increasing the chance of eutrophication [
2]. Furthermore, it has an economic drawback because of the high cost of wastewater treatment.
Among the different types, the dairy industry is one of the most important. Cheese production accounts for ca. 18 Mton/y [
3], with cheese whey being the main undesired by-product [
4]. The chemical oxygen demand (COD) of this effluent has a high range depending on the technique and equipment used (0.8–102 g/L), but it generally has a low pH (it can range from 3 to 9, but it is commonly lower than 5), and lactose can typically be considered the main organic component [
5]. In addition, inorganic compounds are present, such as chloride, nitrate, and phosphate. The conventional approach used for its treatment is via aerobic or anaerobic digestion [
6]. However, these technologies lead to high reactor volume because of the long reaction time, and hence to high capital investment [
7]. Recently, alternative treatment and valorization pathways have been investigated. Najar-Almanzor et al. reviewed the utilization of cheese whey as medium growth for microalgae, which contemporaneously reduces the contamination level of the wastewater effluent [
8]. Petrovič et al. performed the hydrothermal co-carbonization of sewage sludge and whey, resulting in a hydrochar with increased nutrients [
9]. Elia and coworkers evaluated electrocoagulation, electrooxidation, and their coupling for the safe disposal of goat cheese wastewater [
10]. Other examples of new processes and technologies of valorization pathways can be found in a recent work by Pires et al. [
11].
In this work, the possibility of obtaining hydrogen as an energetic carrier from a synthetic mixture representative of cheese whey via aqueous phase reforming (APR) was investigated [
12]. Nowadays, hydrogen is mainly produced by fossil sources, predominantly through the steam reforming process of natural gas, thus contributing to the depletion of natural resources as well as to global warming. The scientific community is engaged in the development of innovative processes and the technological optimization of alternative hydrogen-producing pathways [
13,
14], and aqueous phase reforming is a valuable option. APR is a catalytic process carried out at temperatures between 220 and 270 °C, under autogenous pressure. In these conditions, the thermodynamic tendency of oxygenated compounds (e.g., alcohols) towards hydrogen production is much higher than light hydrocarbons (e.g., methane), allowing milder reaction conditions with respect to conventional steam reforming. Furthermore, the low temperature range allows for the water–gas shift to be carried out in the same reactor, with a significant advantage under the capital expenditure point of view. APR has been investigated with light alcohols and poly-alcohols, such as methanol, ethylene glycol, glycerol, etc. Typically, the aim of the work is the synthesis of active, selective and stable catalysts, to maximize hydrogen production [
15]. Aqueous phase reforming is considered a promising pathway to mitigate the environmental footprint of carbon-laden wastewater deriving from several sources [
16,
17,
18], and our research group summarized in a previous work the possible different application contexts, which are especially suitable when sugar or alcohols are present [
19]. For this reason, the aqueous phase reforming of lactose was explored in this work.
To our knowledge, only two works were previously dedicated to this topic. Remon et al. evaluated for the first time the application of APR to a lactose solution using a Ni-based catalyst [
20]. The authors observed that the carbon conversion to gas, as well as the gas composition, vary largely with the reaction conditions, such as temperature, pressure, lactose concentration, and weight hourly space velocity. The same research group also compared APR to steam reforming using real cheese whey, highlighting that both technologies have a key bottleneck related to the production of a solid by-product [
21]. The authors highlighted that further investigation should be dedicated to the possible pre-treatment. Furthermore, the choice of alumina support for the Ni catalyst was suggested as one of the possible causes for the catalyst deactivation during APR.
In order to further investigate this promising technology, a systematic evaluation on a batch system using a Pt/C catalyst was carried out in this work. The choice of this catalyst was based on the higher hydrothermal stability of carbon support with respect to a metal oxide, and particularly to alumina, which is prone to convert into boehmite under hydrothermal conditions [
15].
Section 1 is hence devoted to evaluating the influence of the reaction temperature and lactose concentration on the performance of the process, pointing out the role of homogeneous reactions thanks to analogous non-catalytic tests. Starting from the knowledge of our previous work on simpler molecules (glucose and xylose) [
22], where a pre-hydrogenation step was able to stabilize the feed and led to a net hydrogen production, a similar configuration also in the case of lactose was investigated, looking at the fate of carbon. The results related to the implementation of this pretreatment are reported in
Section 2. Finally, the possible use of the produced energy carrier to satisfy the energy needs of the dairy industry itself was investigated. For this reason,
Section 3 shows a preliminary assessment conducted to evaluate the potential impact of the development of this technology on the energetic sustainability of the cheese-making industry.
Overall, this research aims at contributing to the sustainable management of waste effluents together with the generation of renewable energy. In doing so, this work paves the way towards the development of a novel treatment technology, by investigating two important issues often neglected: on one side, the development of new strategies for the mitigation of catalyst deactivation and the maximization of carbon efficiency; on the other side, the assessment of the coupling with the waste-generating industry. The latter issue is particularly important because the size of these plants is often limited; therefore, it is important in minimizing the costs related to the transportation of the feed/product.
2. Materials and Methods
2.1. Materials
Monohydrate lactose was purchased from Sigma Aldrich (St. Louis, MO, USA). 5% Pt/C and 5% Ru/C catalysts (in powder form) were provided by a commercial supplier and used without any pretreatment. Deionized water was produced in the laboratory using an RO Cubic S2, equipped with a low-pressure reverse osmosis system and ion exchange resins.
2.2. Catalytic Tests
The APR and hydrogenation reactions were carried out in a 4566 Parr reactor (300 mL total volume), equipped with a 4848-model reactor controller for the temperature and stirring. In a typical experiment, 120 mL of aqueous phase were used, together with the desired amount of catalyst (0.375 g Pt/C for APR tests, 0.2 g Ru/C for hydrogenation tests). The chosen catalyst quantity was based on previous works of the authors and with the aim of guaranteeing a significant conversion of the feed to derive reliable results. A small sample (0.5 mL) of the initial solution was taken for HPLC characterization to ensure the reliability of the analytical system and verify the initial feed concentration.
Once the reactor was fastened, the atmosphere in the reactor was flushed by pure nitrogen. The final initial pressure was set at 0.3 MPa of nitrogen for the APR tests and at 3 MPa of hydrogen for the hydrogenation tests. Please note that even in the latter case, 0.1 MPa of nitrogen was left as internal standard. Once the set temperature was reached (ca. 50 min), the stirring rate was fixed at 200 rpm to exclude external mass transfer limitations and the reaction time started.
The reaction was stopped by using an external water bath. The value of the final pressure, measured by a digital transducer, was used for quantification by using the ideal gas law. The gas phase was then collected in a syringe for the μGC characterization. The liquid phase was filtered to separate the residual catalyst and analyzed by HPLC. Further information on the analytical techniques are reported in the following section. The catalytic tests were carried out in duplicate, and the results reported below refer to the average.
2.3. Analytical Techniques
The gas phase was analyzed by μGC (SRA Instruments (Cernusco sul Naviglio, Italy)) to derive information on its composition. The system is equipped with a Molsieve 5A (using argon as carrier) and PoraPLOT U (using helium as carrier) columns, and with a TCD detector.
The liquid phase was characterized by HPLC (Prominence Shimadzu). The separation was conducted using a Rezex ROA-Organic acid H+ (8%) column (size 300 mm · 7.8 mm). The mobile phase was 5 mM H2SO4 aqueous solution. The flowrate was set at 0.7 mL/min and the column oven at 50 °C. A refractive index detector (RID) was used for the quantification of the compounds, which were preliminarily calibrated using the corresponding standards. Total carbon (TC) analysis was performed using a Shimadzu TOC-VCSH analyzer equipped with a nondispersive infrared detector.
The textural properties of the catalysts were measured using a Micromeritics Tristar 3020 instrument, performing N2 adsorption/desorption isotherms of the fresh and spent samples at 77 K. After a pretreatment at 200 °C under nitrogen flow for 2 h, by means of a Micromeritics Flow Prep 060 degassing system, the specific surface area was calculated according to the Brunauer–Emmet–Teller (BET) equation, whereas the pore size distribution and the pore volume were calculated in accordance with the Barrett–Joyner–Halenda (BJH) method.
2.4. Evaluation of Catalytic Performance
Several indicators were used to describe the APR performance and quantify the relationship between the operating variables and the final output. For our scope, one of the most important indicators is the carbon to gas (CtoG) conversion (Equation (1)), defined as the ratio between the carbon in the gas effluent and the carbon in the wastewater stream. This is important because it measures the ability of the system to clean the aqueous phase.
Similarly, the carbon to liquid (CtoL) and carbon to solid (CtoS) were defined (Equation (2) and Equation (3), respectively), to estimate the carbon distribution. The former was evaluated by TC analysis, while the latter was calculated by difference.
The gas composition was evaluated by μGC analysis. In Equation (4), the definition of volume (or, that is the same, molar) concentration of hydrogen is reported for the sake of example.
Finally, the APR H
2 selectivity (Equation (5)) was defined to evaluate the accordance of the produced H
2 and CO
2 ratio with respect to the APR stoichiometry, reported in Equation (6). This indicator, which should be theoretically equal to 2, is particularly useful to discriminate how much the product distribution is coherent with the desired pathway, or if it is affected by parasite reactions (decarboxylation, hydrogenation, methanation, etc.).
2.5. Energetic Assessment
With the aim of evaluating the possible integration of APR in the cheese-making value chain, an energetic assessment was conducted.
Figure 1 depicts the simplified process flow diagram with the main equipment units. The effluent from the cheese-making process is first pressurized up to the desired value. The minimum investigated value is equal to 60 bar, i.e., slightly higher than the vapor pressure of water at the reaction temperature (270 °C) to ensure the liquid phase. Pump efficiency of 90% was assumed to estimate the energy duty.
Afterwards, the stream is sent to a feed-effluent heat exchanger (HE), which allows the feed to be heated up to 260 °C (a minimum temperature approach equal to 10 °C was assumed). Then, an external trim heater (H1) is responsible for reaching the set temperature (270 °C). The energy duty was calculated considering the enthalpy change, taking into account the dependence of the specific heat capacity with the temperature. The APR reactor was assumed to be working isothermally thanks to an external source of heat (Q) necessary to compensate for its endothermal behavior. In fact, it is important to note that two phenomena were involved that act as a sink of energy: on one side, the enthalpy of reaction; on the other side, the vaporization of water. The latter was reported by Sladkovskiy et al., and it refers to the unavoidable water evaporation necessary for the saturation of the produced gas phase [
23].
At the outlet, the products were cooled down in HE and separated in a gaseous mixture, i.e., fuel gas, whose energetic value was attributed to the hydrogen content, and a liquid phase (AP), which theoretically should not contain any organic content, with the hypothesis of complete carbon conversion to gas. In order to perform the energetic assessment, the net energy produced by the APR unit was evaluated as difference between the energetic content of the fuel gas (obtained by multiplying the lower calorific value with the flowrate) and the energetic expenditure of the unit, i.e., the pressurization, the heat provided in H1 and the heat provided in the APR reactor. This net energy was then compared with literature values for thermal and electric duties of dairy industries. For the electricity generation, the use of a proton exchange membrane fuel cell was assumed, with a precautionary 50% efficiency [
24].
3. Results and Discussion
3.1. Direct APR
3.1.1. Influence of Temperature
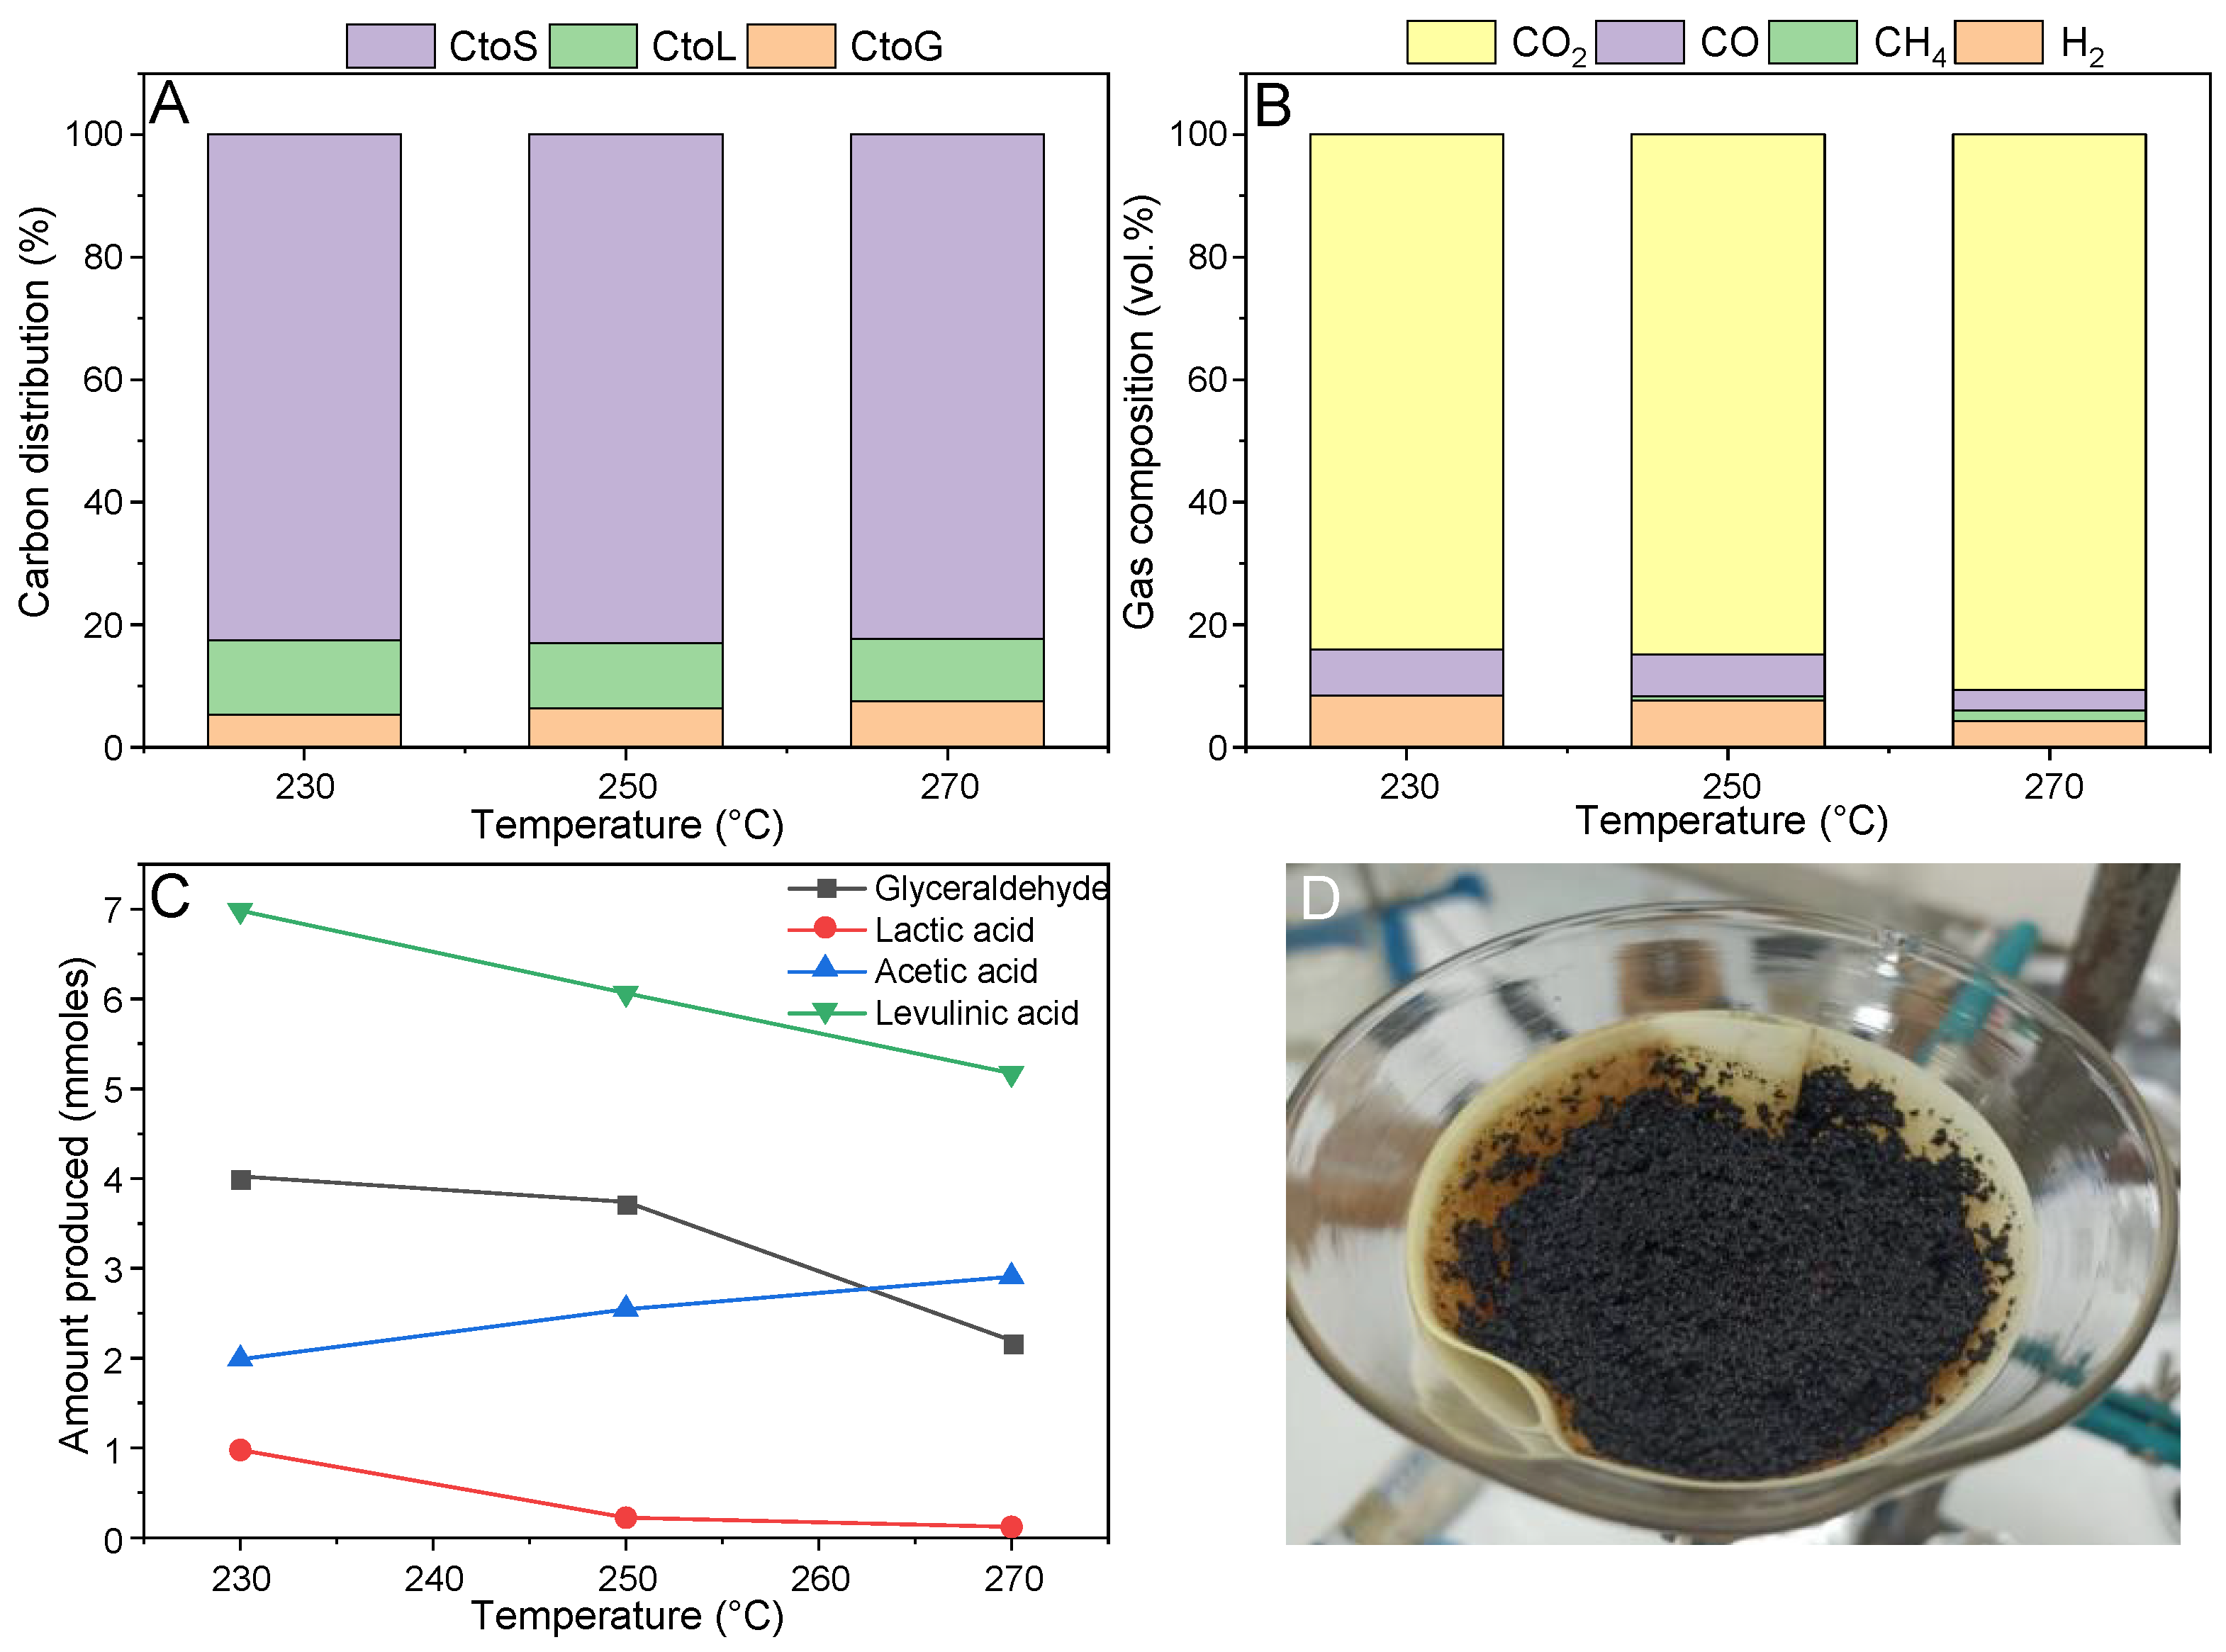
The influence of temperature on the carbon distribution is reported in
Figure 2A. The APR reaction mechanism foresees a sequence of dehydrogenation, C-C bond cleavage, and water–gas shift reaction steps [
15], where the second one is commonly considered as the rate-determining step. For this reason, despite a tradeoff with the exothermicity of the water–gas shift reaction, working under a higher temperature may favor the hydrogen production.
It can be observed that in working under concentrated solutions, most of the carbon ended up in the solid phase (ca. 82%) independently from the reaction temperature, while ca. 11% remained in the liquid phase, and 7% in the gas phase. Going deeper into the characterization of each phase, the gas composition was analyzed in
Figure 2B. The gas was mainly constituted by carbon dioxide, and then an approximately equal concentration of carbon monoxide and hydrogen, while methane was present in negligible content. It is not straightforward to elaborate an explanation for the composition of the gas phase, since the reaction pathways for the solid formation under hydrothermal conditions are still not well understood. The high fraction of carbon dioxide is in accordance with [
22], and it can be attributed to the decomposition of glucose and fructose under hydrothermal conditions. Calderon et al. reported, among the possible liquid intermediates, the production of levulinic acid and formic acid [
25], which may be responsible for the subsequent formation of hydrogen and carbon dioxide, as shown in our previous work [
26]. Consequently, the APR H
2 selectivity was very low, between 4.4% and 2.5% increasing the temperature.
Looking at the composition of the liquid phase, a complete conversion of lactose was shown, even at the lowest investigated temperature. This is a sign of the high reactivity of this compound. Furthermore, neither glucose nor fructose were detected, suggesting that these primary intermediates were also quite reactive.
Looking at the main identified liquid compounds in
Figure 2C, levulinic acid was the main liquid by-product, with a composition that is almost constant with the temperature. Levulinic acid can derive from a cascade reaction, where glucose isomerizes to fructose, which is dehydrated to HMF, which further decomposes into formic acid and levulinic acid [
27].
As reported above, most of the carbon was present in the form of a solid residue.
Figure 2D depicts the filter used for the solid separation after the reaction. The high presence of a residue which filled the filter is clearly observed. This is the consequence of homogeneous reactions in which HMF is involved, as well as water-soluble oligomers of glucose [
28]. We showed in a previous work that this reaction is already favored at a lower sugar concentration (ca. 4.5 wt.%); therefore, it is meaningful that it played an even more prevalent role in the conditions used in this work, given its unitary reaction order [
22]. The solid reported in the figure is a mixture of the residual catalyst and the produced solid phase from sugar decomposition. Performing the N
2 adsorption/desorption isotherms on this solid phase, the specific surface area was equal to ca. 27 m
2/g, which is not surprisingly much lower than the fresh catalyst, being ca. 918 m
2/g. The pore volume decreased as well, from 0.618 cm
3/g to 0.124 cm
3/g, while the average pore size increased from 5.1 nm to 10.5 nm, likely since the smallest pores in the catalyst were completely blocked by the carbonaceous deposits. This fouling phenomenon likely affected the catalytic performance, covered the active sites, and deactivated the catalyst.
Overall, there was no significant influence of the reaction temperature on the APR performance under the investigated conditions. This differs from the results reported by Oliveira et al. [
29], likely because of the much higher organic concentration investigated here. It is suggested that, being the solid formation pathway preferred under these conditions, the temperature is not able to affect its further reactivity, hence leading to similar results in the investigated range.
3.1.2. Influence of Lactose Concentration
It is known that the sugar initial concentration greatly affects the performance of the hydrothermal treatment [
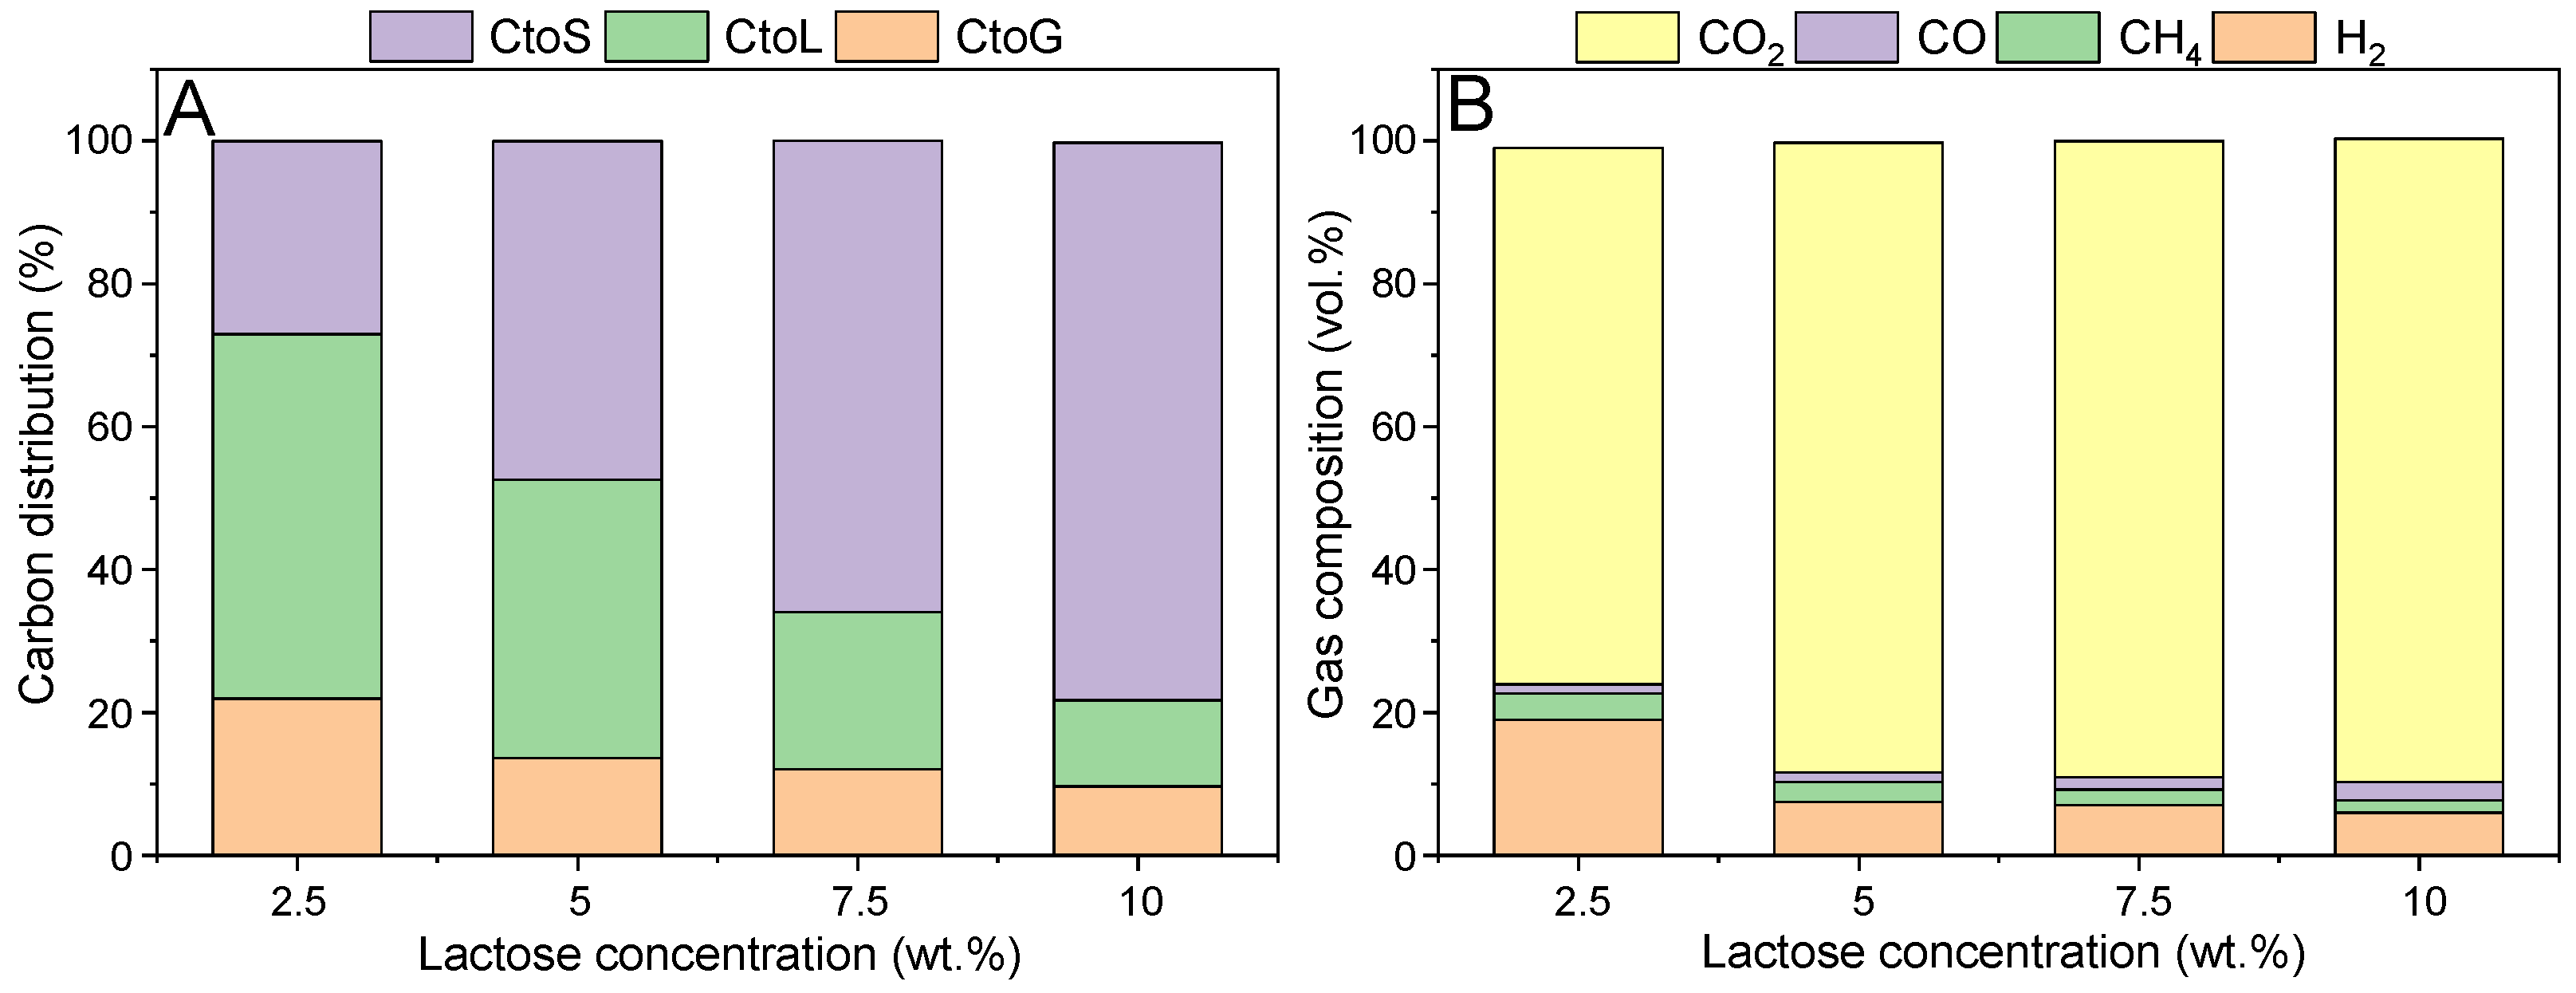
22]. For this reason, the influence of lactose concentration was evaluated in the range 2.5–10 wt.%, and the results are reported below.
Figure 3A highlights the strong dependence of the carbon distribution from the initial concentration. The rise in temperature gradually shifted the carbon fate towards the solid formation, from 27% to 82% (+204% increase); on the other hand, the carbon to gas conversion decreased from 22% to 7.5% (−66%), similarly to the carbon conversion to liquid, which moved from 51% to 10% (−80%). Overall, it can be observed that, at low concentration, there was a predominant role of the liquid products, while at high concentration the solid phase was the primary product. This behavior is different with respect to the work of Remon et al.: the discrepancy may be primarily attributed to the different type of catalyst (Ni in the cited reference) [
30]. However, as will be seen later, the catalyst may not be so impactful on the performance at this level of concentration; therefore, another difference may be the operating temperature (which is at max 240 °C in the cited reference). This is because sugar compounds underwent thermal decomposition, which is primarily a homogenous phenomenon, where hence the catalyst plays a minimum role. Peculiarly, solid formation kinetics followed a first-order dependence on the lactose concentration. In fact, the linear correlation between the feed concentration and the CtoS led to a correlation coefficient equal to 0.9874, suggesting the good fitting. The higher reaction order of sugars decomposition with respect to the fractional order of reforming reactions was already pointed out by Davda et al. [
31], and is a pivotal point for confirming the importance of developing alternative strategies to circumvent their inherently low selectivity. In this work,
Section 3.2 is devoted to this issue.
Looking at the gas composition (
Figure 3B), there was a major difference in the most diluted range of investigated values, where the concentration of hydrogen increased significantly working at 2.5 wt.%, while just minor differences were observed from a concentration higher than 5 wt.%. Again, this could be the sign of a more prevalent function of the catalyst, which is responsible for hydrogen-producing reaction pathways. The APR H
2 selectivity decreased as well, moving from 8.8% up to 2.5%.
The liquid phase composition was qualitatively similar to the one reported in
Figure 2C. However, a constant decrease in production was found, in accordance with the decrease in the CtoL. It is important to highlight that despite levulinic acid deriving from 5-HMF, the latter was not detected. It can be supposed, in accordance with the literature, that it has a high reactivity, and hence its concentration remained low [
27]. Like the outcome reported above, the second most important liquid product was acetic acid, followed by glyceraldehyde. Each of these compounds strongly decreased with the increasing carbon concentration.
Finally, it is important to observe that despite the lower formation of the solid phase at diluted conditions, the analysis of its textural properties still showed a strong decrease in the surface area (ca. 43 m2/g). Therefore, even if working under diluted conditions, there is still a challenge for the stability of the catalyst. In this sense, it is noted here that the use of a hydrophobic support, such as the activated carbon, despite its advantage in terms of inertness under the hydrothermal conditions, may lead to a higher affinity with such products, favoring the fouling phenomenon.
3.1.3. Influence of Catalyst Presence
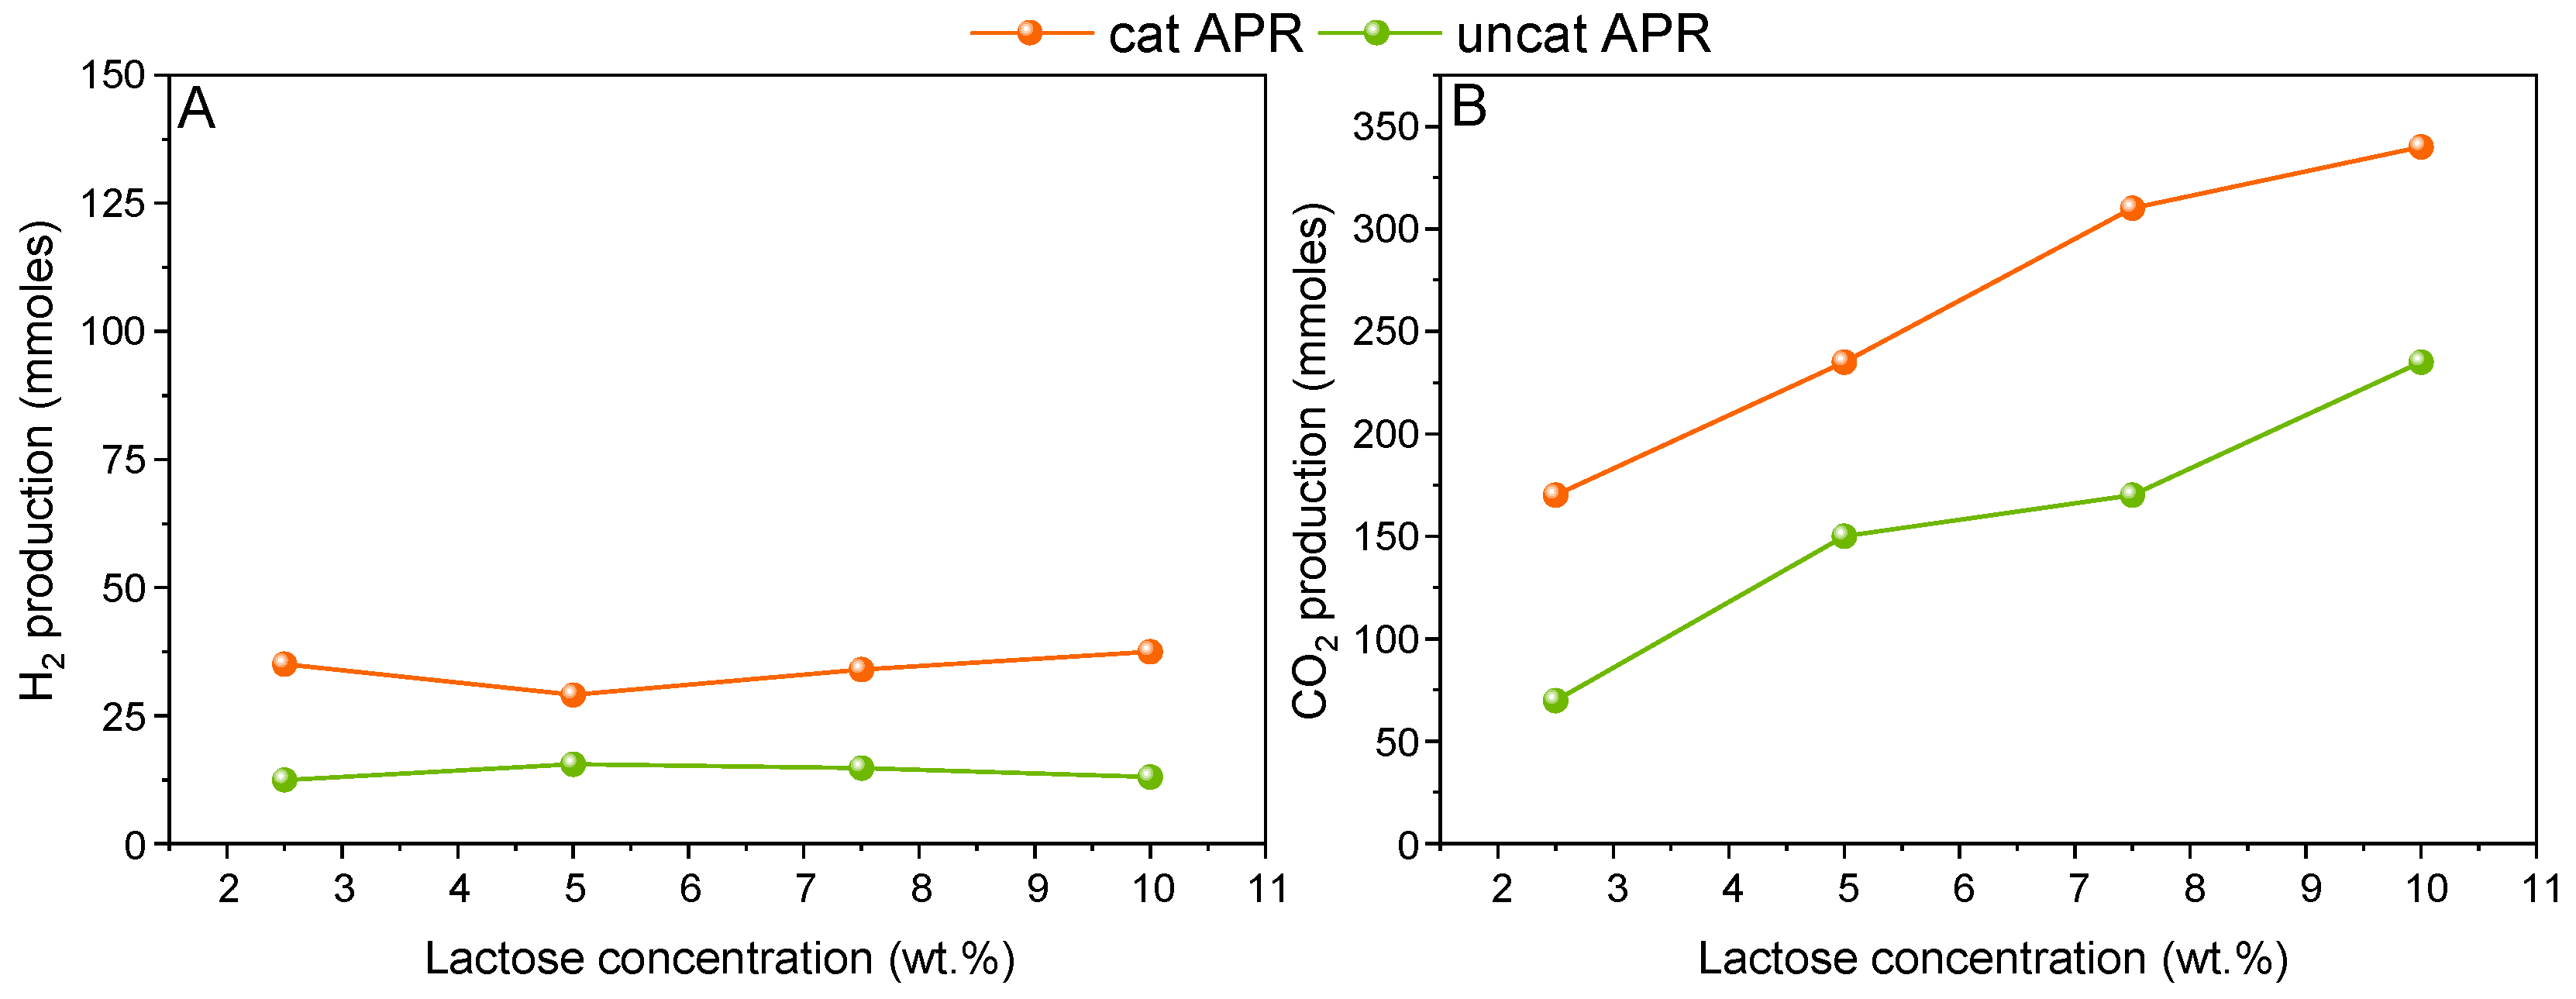
It was shown in the previous section that homogeneous reactions, i.e., not linked to the presence of the catalyst, may affect the APR performance specifically when a concentrated lactose solution was used. For this reason, this variable was investigated by performing uncatalyzed APR reactions at different initial concentrations.
Figure 4 reports the hydrogen (A) and carbon dioxide (B) production in the case of catalyzed and uncatalyzed APR, respectively.
It can be seen in
Figure 4A that the hydrogen production remained constant independently from the initial lactose concentration. Therefore, it is assumed that an apparent zero-order reaction can describe the kinetic of hydrogen formation under the investigated conditions. It is interesting to observe that there is a contribution of hydrogen derived from homogeneous reactions, which is approximately 35% of the total observed hydrogen under catalyzed conditions.
On the other hand, in
Figure 4B, the catalytic carbon dioxide amount increased almost linearly with the increase in the concentration. This increase reflects the increase reported for the uncatalyzed CO
2 production, which shows a linear dependence from the lactose concentration as well. As a matter of fact, the R
2 for the linearization of the uncatalyzed CO
2 production was equal to 0.9562. This result suggests that a significant fraction of the CO
2 found in the gas phase from the catalytic tests was not deriving from the APR stoichiometry, and its contribution increased from 41% at 2.5 wt.% of lactose, up to 70% at 10 wt.%. Since the uncatalyzed CO
2 formation was assessed, some further discussion on the catalytic one can be conducted. Looking at the 2.5 wt.% concentration, 22.5 and 100 mmoles of “catalytic” H
2 and CO
2 were present, respectively. The discordance with respect to the stoichiometry suggests that either hydrogen was further consumed in parasite reactions, or carbon dioxide can be further produced through different catalyst-mediated reactions.
Overall, it seems that the catalyst performance was severely limited by the high adsorption of the lactose molecule. The apparent zeroth-order for hydrogen production suggests that the active sites were completely covered by the reactant, and there was no room for enhancing the conversion under heterogeneous conditions. Improving the dispersion of the active sites may play a role to deal with such concentrated solutions; alternatively, increasing the catalyst/feed ratio may also favor the reforming reactions with respect to the decomposition pathway.
3.2. Hydrogenation + APR
As reported in the literature regarding the hydrothermal treatment of sugary solution, and confirmed in the previous section, the solid formation was ascribed to the presence of high glucose concentration [
32,
33]. We demonstrated in a previous work with glucose, xylose, and hydrolysate from ethanol production that the pre-hydrogenation of a sugar solution may be a solution to mitigate this undesired pathway, because it would hinder the production of 5-HMF, being a precursor for solid formation [
22]. Despite apparent nonsense, this approach is worthy of consideration if a net hydrogen production is obtained. Alvear et al. and Aho et al. used formic acid as a hydrogen donor for the APR of xylose and birch/pine hemicellulose hydrolysates, respectively, without obtaining a significant advantage [
34,
35]. Oliveira et al. used a similar technological coupling for the APR of maltose for simulating brewery wastewater, observing higher H
2 selectivity [
29]. To our knowledge, this approach has never been tested before for lactose, and in the following, the results of our investigation are provided.
The typical reaction temperature range for the hydrogenation step is lower than the APR one. This is mainly due to the more favorable kinetics of the aldehyde group for sugars with respect to C-C bond breaking, necessary in the APR mechanism. In accordance with previous works of the authors and similar to the industrial practice, herein it was varied between 180 and 220 °C [
22,
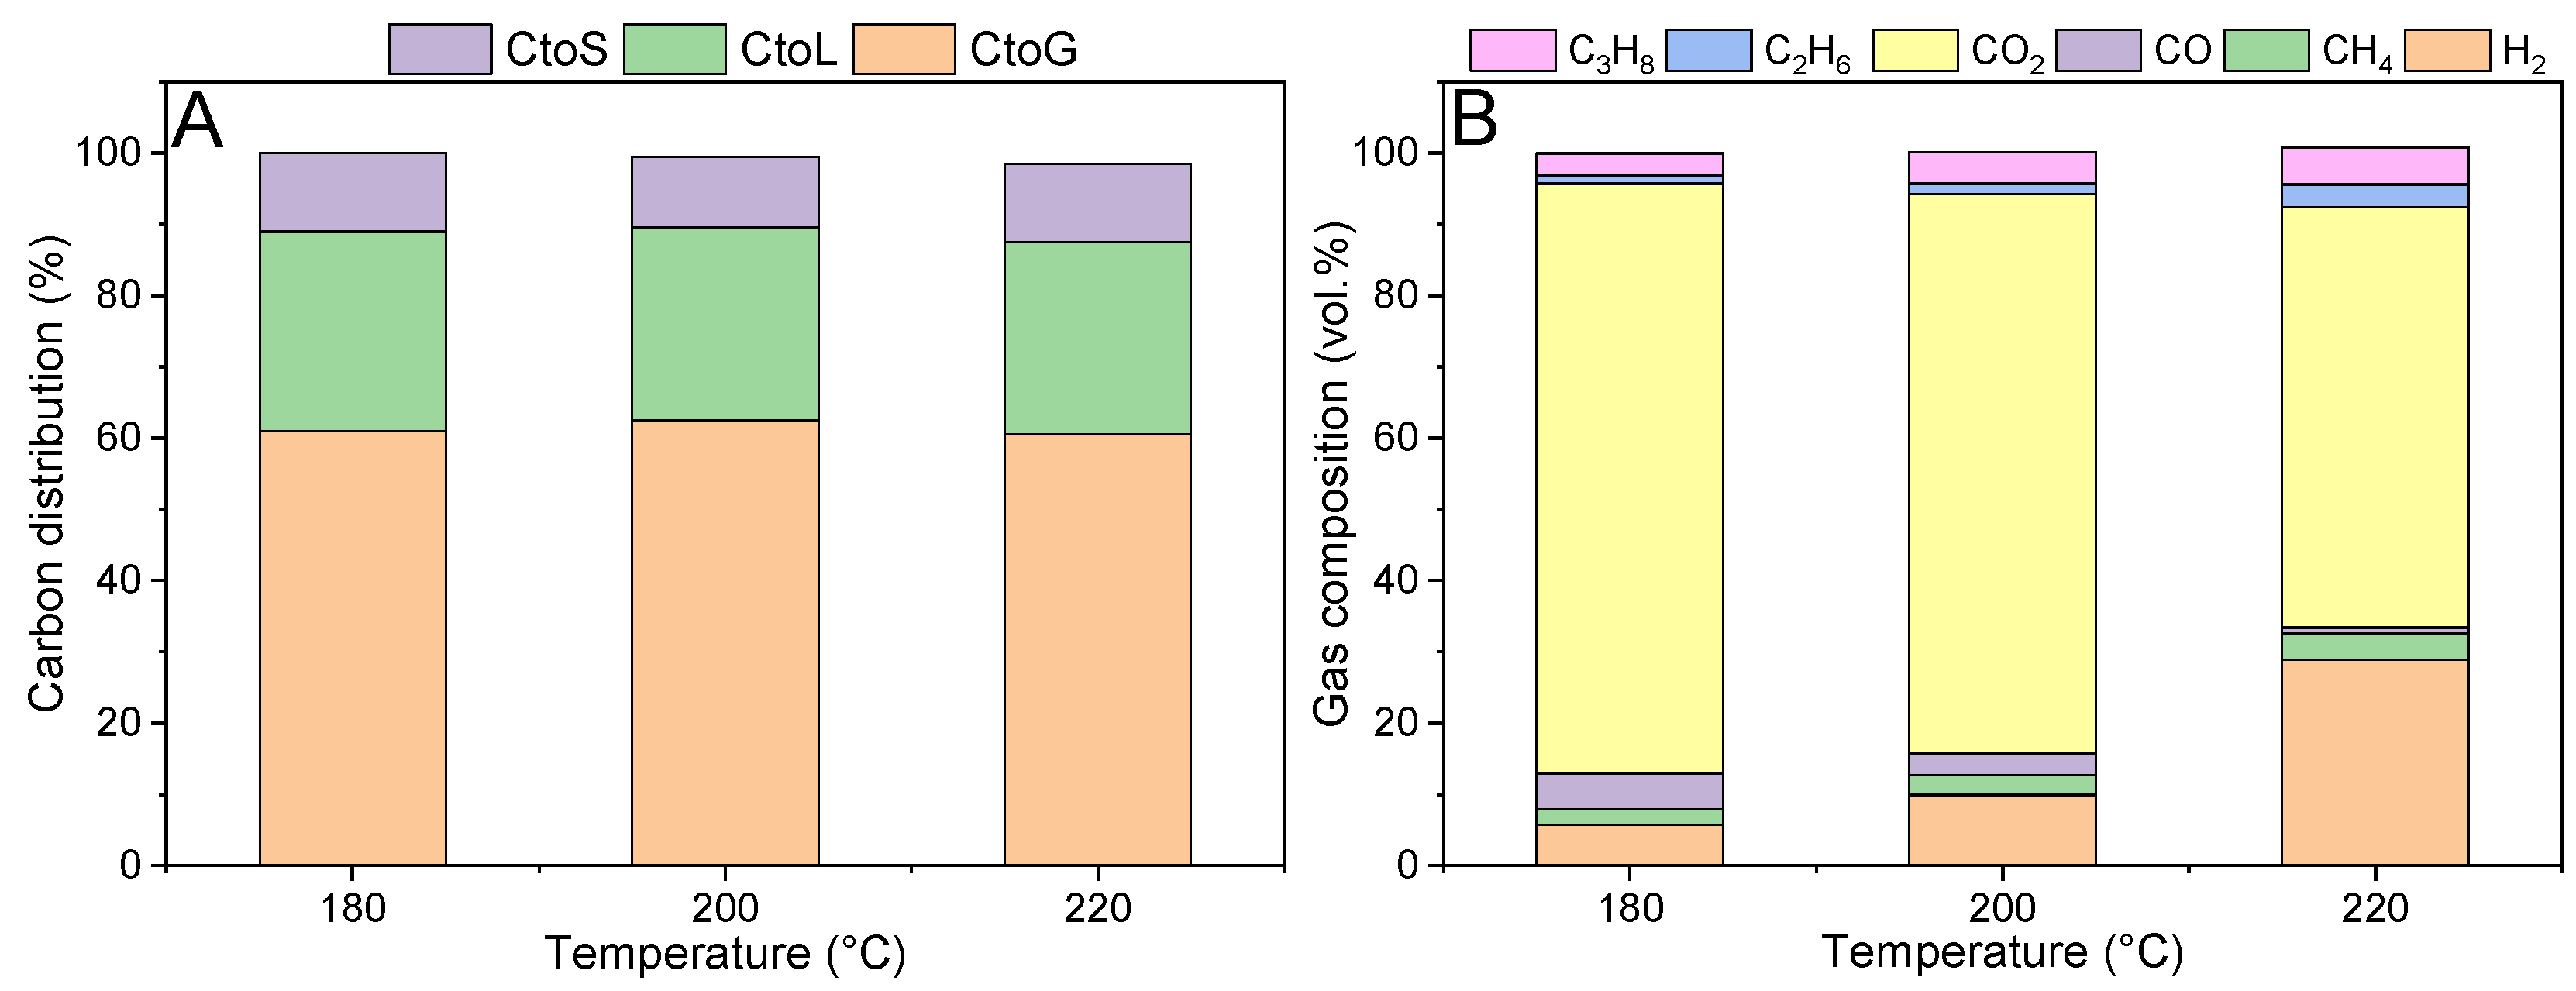
36]. The consequences of this pretreatment on the APR performance are depicted in
Figure 5. Please note that the values reported in the x-axis refer to the temperature used in the pre-hydrogenation step, while the subsequent APR step was still performed at 270 °C.
Figure 5A shows the carbon distribution among the different phases. It is clearly observed that the hydrogenation step drastically modified the carbon fate with respect to the APR-alone configuration (
Figure 2). Carbon ended up prominently in the gaseous phase, followed by the liquid phase, while the solid residue accounted for approximately 10% of the initial carbon content. This result confirms the effectiveness of the hydrogenation pretreatment to stabilize the feed and hinder undesired pathways. Looking at the gas phase composition (
Figure 5B), it was also different with respect to the APR-alone case. There was a gradual increase in the hydrogen concentration with the increase in the hydrogenation temperature: therefore, a gas phase with a higher calorific value was gradually produced. Even other small hydrocarbons were present, such as propane and ethane, which were not detected previously. Finally, carbon monoxide concentration was significantly lower. The improvement of the performance was also reflected by the strong increase in the APR H
2 selectivity, which reached 70% (while it was ca. 8% in the one-pot configuration).
In the liquid phase, lactose was not detected, as well as lactitol, which is the direct hydrogenation product of lactose. Galactose was not identified, while a small percentage of glucose was still detected. This is due to the further hydrolysis of lactitol, which can be hydrolyzed into glucose and sorbitol. The formation of the former may be the cause of the slight solid formation. It can be expected that glucose may undergo two possible pathways: on one side, its catalytic (heterogeneous) hydrogenation into sorbitol, which will subsequently lead to hydrogen production via APR; on the other side, its non-catalytic (homogeneous) decomposition into humins.
Focusing on the catalyst textural properties, it was observed that the specific surface area after APR thanks to the pre-hydrogenation conducted at 220 °C was equal to 347 m2/g, which was significantly higher with respect to the stand-alone APR, even if it was still ca. 62% lower than the fresh one. Even the pore volume increased up to 0.528 cm3/g, and the average pore size was more similar to the fresh one, i.e., 5.9 nm.
It is finally important to look at the net hydrogen consumption. Analyzing the results for 2.5 wt.% of lactose for the direct APR, the hydrogen production was equal to 3.4 mol H2/mol lactose, and hence with a 14% H2 yield (normalized with respect to the theoretical stoichiometry which should give 24 moles of hydrogen per mole of lactose). If the pre-hydrogenation step is considered, the hydrogen yield strongly increased up to 87%, but there was not a net hydrogen production, since the hydrogen consumed during the pretreatment was higher than the amount obtained during the APR itself.
These results highlight not only the importance of a pretreatment like the pre-hydrogenation to reduce the solid formation (and hence increase the catalyst lifetime) and improve the hydrogen selectivity, but point out at the same time the need for further investigation, especially in the hydrogenation step, which should be optimized to avoid unselective reactions.
3.3. Energetic Assessment
Given the experimental results reported above, we were finally interested in evaluating the possible coupling of the cheese whey APR with the cheese-making industry itself. Chinese et al. pointed out that a significant amount of energy is used in these processes due to the milk pasteurization step, as well as for heating and refrigeration [
37].
For this reason, an energetic assessment was carried out taking into consideration an average energetic consumption and the energy produced from the APR step to see if this coupling is potentially feasible.
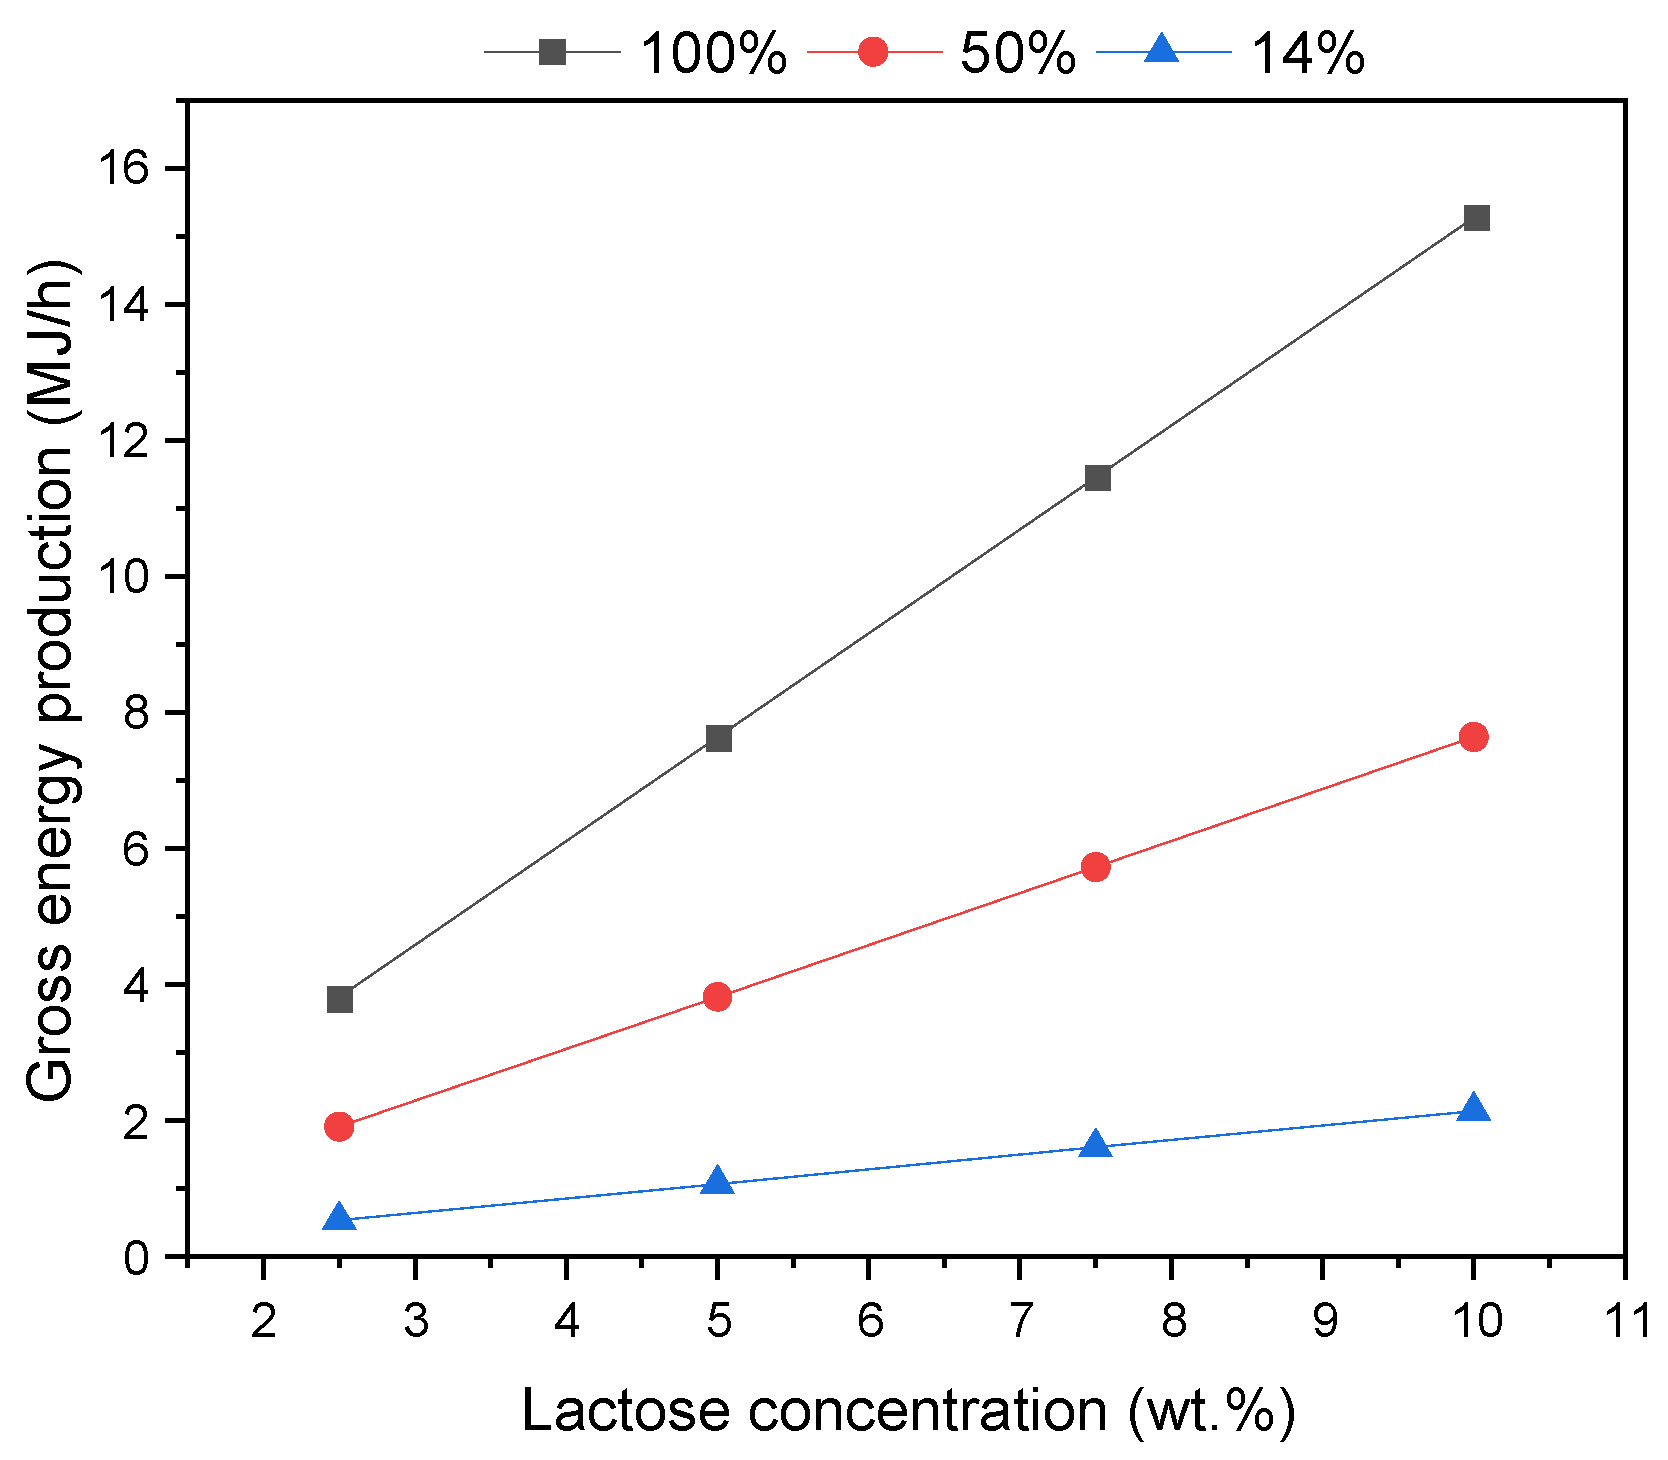
An amount of 1 kg/h of cheese production was assumed as the basis. According to Lappa et al., it can be assumed that approximately 9 kg/h of cheese whey are produced [
38]. The amount of lactose can vary in such effluent: in our assessment, a sensitivity study considering a range between 2.5 and 10 wt.% was performed. The gross energy production was estimated considering three scenarios: 100%, 50%, and 14% hydrogen yield, where the latter was the one obtained in the APR-alone configuration. As observed in
Figure 6, the energy production increased with the initial lactose concentration and the hydrogen yield, as can be expected. This energy was obtained from the lower heating value of the produced gas stream.
In order to estimate the net energy production, it was necessary to estimate the energy duty of the process. With regards to the pressurization step, it varied between 0.05 and 0.09 MJ/h, depending on the final pressure, modified between 60 and 100 bar, respectively. With regards to the energy necessary for heating the feed up to the desired 270 °C, it accounted for 0.45 MJ/h.
However, the main energetic expense regarded the APR reactor. This was due to two main aspects, i.e., the heat of water vaporization and the enthalpy of reaction.
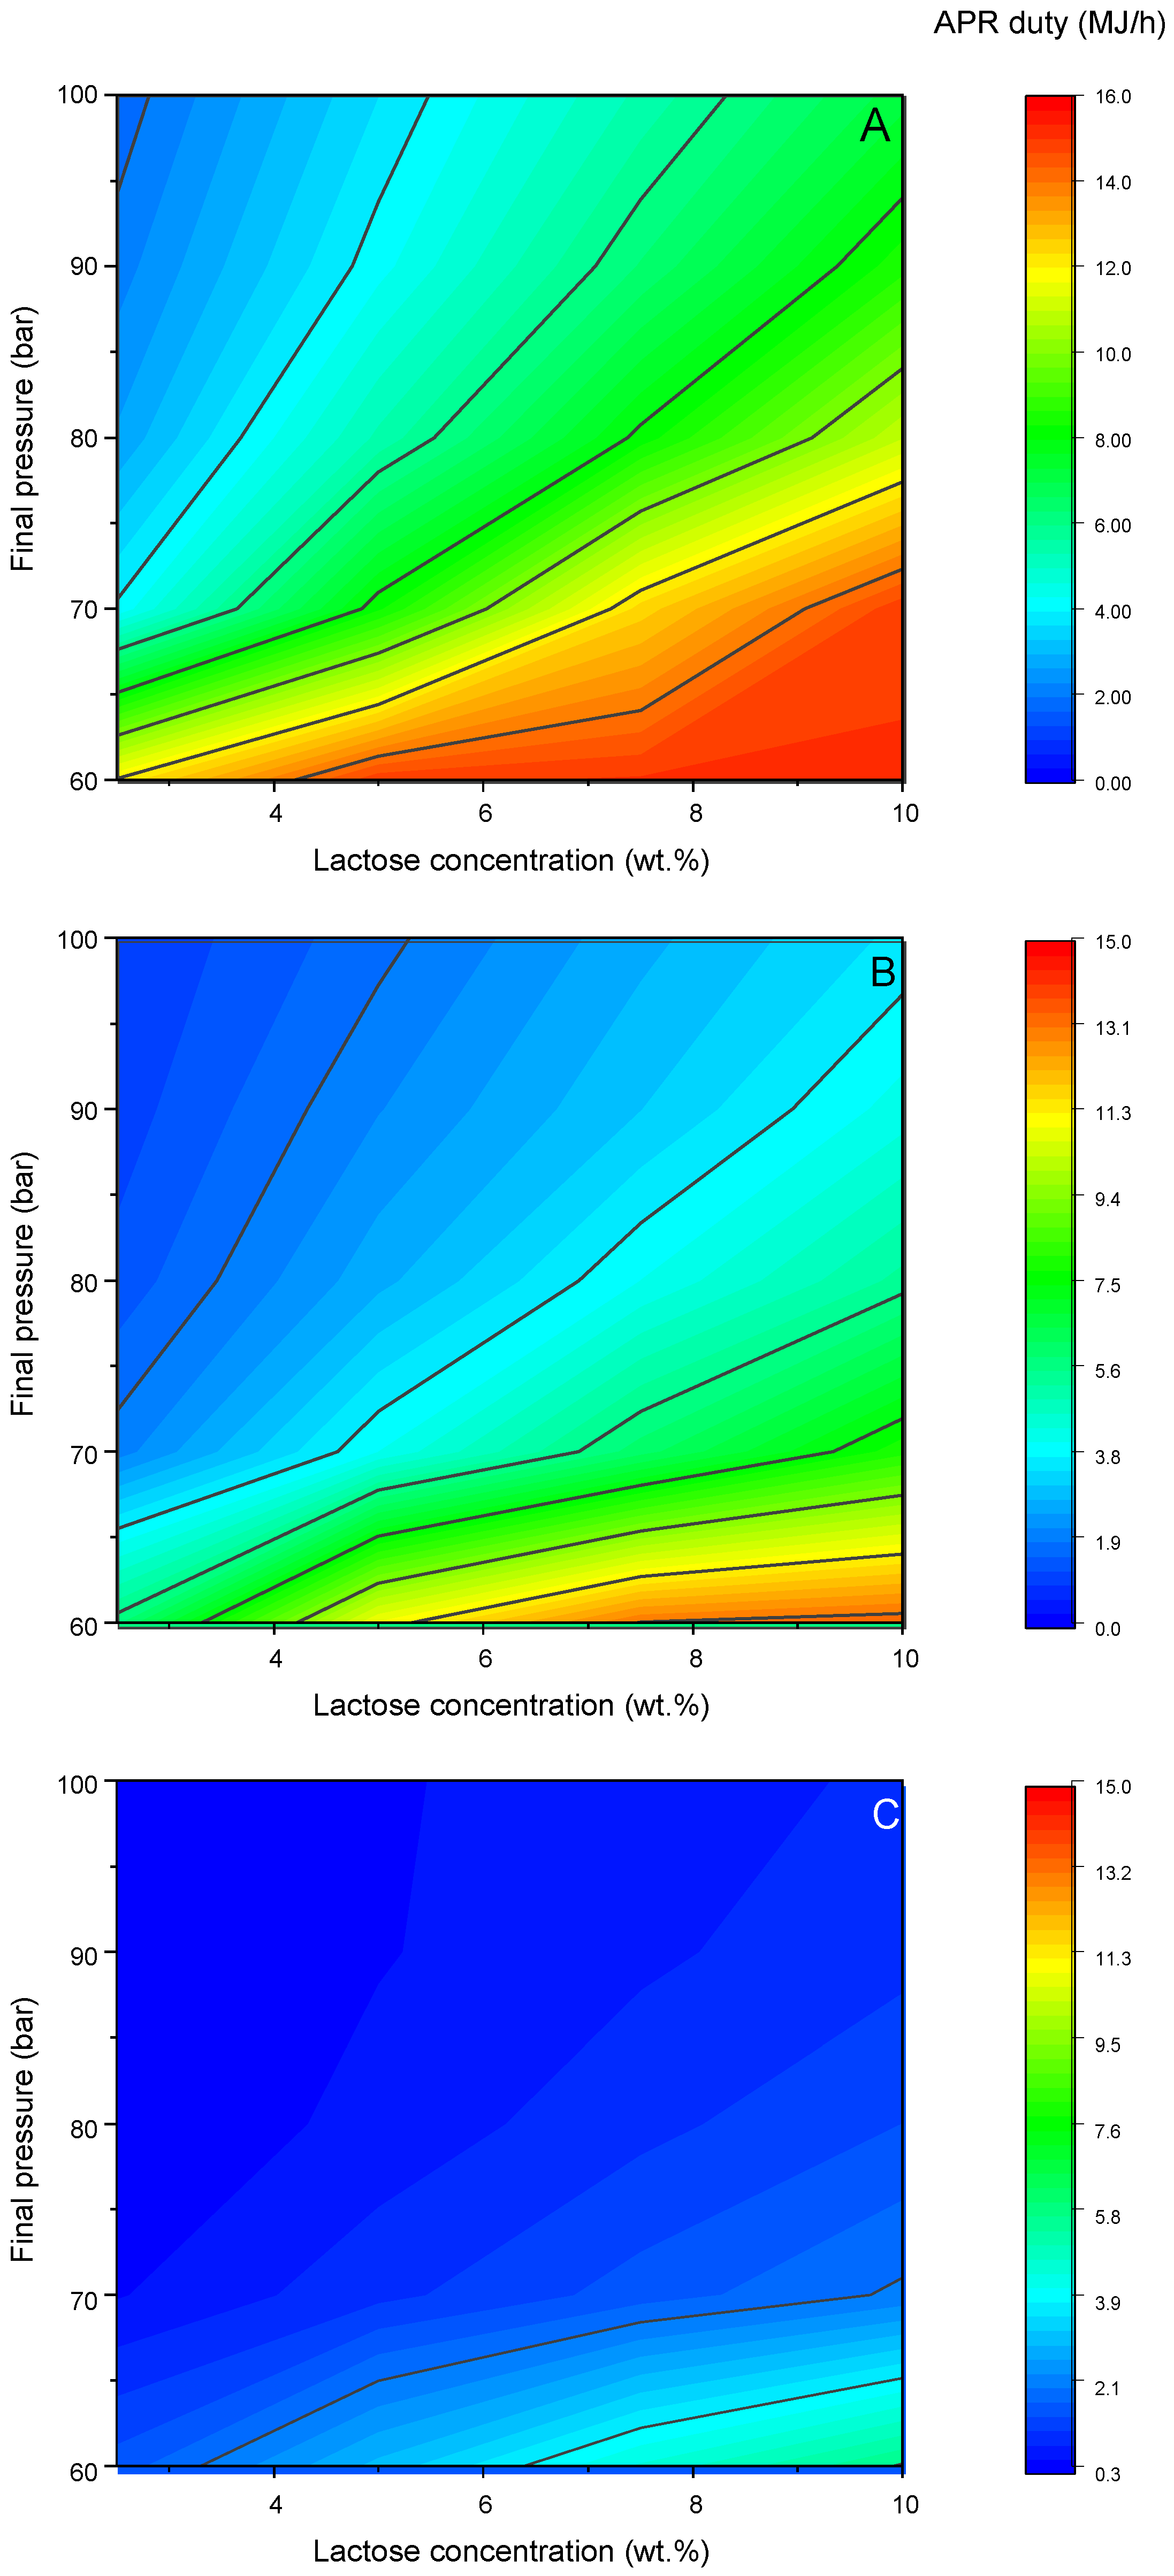
Figure 7 reports the results of this evaluation in a contour plot. The reactor duty increased with the lactose concentration because of the endothermicity of the reaction. Furthermore, with a fixed lactose concentration, it decreased with the decrease in the conversion. These outcomes are quite trivial. Far more interesting is the effect of the pressure. It can be observed that increasing the pressure of the system led to a drastic decrease in the energy duty. Let us take as an example the case with 2.5 wt.% lactose, at 60 and 100 bar (
Figure 7A). The energy duty moved from 12.1 to 1.8 MJ/h spanning from the lowest to the highest pressure level. This dramatic drop was not caused by the extent of the reaction, but rather by the vaporization of water. In fact, when the gas phase was produced inside the reactor, water evaporated because of its tendency to saturate the just-produced gas bubble. The extent of such evaporation decreased with the increase in the system pressure, since it is directly proportional to the partial pressure of water: consequently, with the total pressure being higher, the molar fraction will be lower, and hence the endothermicity associated with the lower evaporation. The importance of this phenomenon increased also with the extent of the gas yield, since the lower the production, the lower the amount of water necessary for the saturation. Moving towards lower H
2 yields (50% in
Figure 7B and 14% in
Figure 7C), the same trend in the energy requirement was observed: it increased with the lactose concentration, while it decreased with the pressure. The duty was significantly lower because of two reasons. On one side, lower hydrogen yield means lower lactose reactivity, and hence there is a lower influence attributed to the endothermicity of the reaction. At the same time, a lower hydrogen yield means a lower gas production, which is associated with a minor amount of water necessary to saturate the gas phase. Since the evaporation leads to a loss of energy, a lower duty will be required.
Overall, it appeared that increasing the pressure of the system can be advantageous since the small expense for the pressurization was rewarded by the amount saved due to the vaporization of water.
Figure 8 depicts the net energy of the system, calculated as the difference between the gross energy production in the APR step and all the energy duties of the process, i.e., the pressurization, the trim heater requirement, and the reactor duties. As can be observed from the complex geometry of the contour plots, the net result was due to a tradeoff between the higher production at the higher lactose concentration, but also the higher expense because of the water vaporization associated with it. For this reason, by increasing the conversion level, the span of the net energy increased strongly (from ca. 1 MJ/h at 14% H
2 yield to ca. 16 MJ/h at 100% H
2 yield).
Independently from the H2 yield level, a minimum pressure of 70 bar appeared necessary to have a net energy higher than zero (the only exception was at a high lactose concentration and 100% H2 yield).
Finally, it is necessary to compare these values with the cheese-making industry duties. According to Chinese et al., the range is wide, moving from 0.2 to 3 kWh/kg for electricity and 0.1 to 8 MJ/kg for thermal energy [
37]. Considering the scenario with the highest net energy production (10% lactose and 100% H
2 yield), APR was able to produce 8 MJ/kg of thermal energy. According to the numbers cited above, it means that it may be sufficient to satisfy entirely the thermal requirement of the most demanding scenario. In the case where the electrical energy is the target, it can be supposed that hydrogen may be fed to a fuel cell. Therefore, assuming 50% efficiency, ca. 1 kWh of electricity may be obtained. Looking at the range of electricity requirement cited above, it means that APR may be able to satisfy up to 33% of the most demanding scenario, which was supposed to be equal to 3 kWh/kg.
Additionally, one further consideration regards the lowest energetic requirement, i.e., 0.2 kWh/kg and 0.1 MJ/kg. In order to satisfy this need, APR should produce approximately 0.8 MJ/h of energy: this value may be reached also with the actual yields (i.e., 14%), if working at a high pressure and lactose concentration (P > 90 bar and lactose > 7.5 wt.%). However, one final remark here is related to the low catalyst stability, which would not allow a stable performance.
4. Conclusions
In this work, the aqueous phase reforming of lactose was carried out to mimic the composition of dairy wastewater effluent. In the frame of the circular economy, by reducing the carbon content of the aqueous stream and obtaining hydrogen out of it, it is possible to close the loop, minimizing the impact on the environment, but also reducing the need for freshwater in other sectors (like the agricultural one) and recovering energy. The first goal of the investigation was to increase the understanding of the carbon distribution among the phases and evaluate possible mitigation strategies to decrease the carbon to a solid. The tests conducted without any pretreatment showed that increasing the temperature between 230 and 270 °C did not affect the performance significantly, while increasing the lactose concentration between 2.5 and 10 wt.% led to a strong increase in the carbon to solid conversion, at the expense of both carbon to gas and liquid. Specifically, the carbon to solid was ca. 82% at each temperature working at 10 wt.% lactose, while it decreased at 27% when initial lactose concentration was equal to 2.5 wt.%. Moreover, the maximum hydrogen selectivity was reached in these latter conditions, and it was equal to 8.8%. Interestingly, comparing catalytic and non-catalytic reactions, a relevant role of homogeneous reactions was observed even at the lowest lactose concentration. The use of a pretreatment step to hydrogenate the feed allowed the reduction of the carbon formation and an increase in the hydrogen selectivity: in particular, the hydrogen yield increased from 14% to 87%, and the selectivity reached 70%, but a net hydrogen production was not reached. Finally, an energetic assessment starting from the obtained experimental results was performed to evaluate the technical feasibility of this technology for the deployment of the circular economy, since anaerobic digestion is often the most investigated option when wastewater streams are involved. It was pointed out that in working at a higher pressure and lactose concentration, APR may be able to produce the energy necessary to satisfy the thermal and electrical requirement of the cheese-making industry. The limit conditions depend greatly on the reached hydrogen yield. Despite the stability of the catalyst seeming to be a key challenge in this field, this work provides a clear example of the possible benefits associated with the development of APR as a tool for the circular economy, paving the way to further investigation to improve this technology.


