Article

Impact of Problem-Based Learning on the Perception, Understanding, and Application of Statistical Concepts in Business Administration and Management Students

1
Department of Applied Economics, Faculty of Economics and Business, University of Zaragoza, Gran Vía 2, 50005 Zaragoza, Spain
2
Grupo Decisión Multicriterio Zaragoza (GDMZ), University of Zaragoza, 50005 Zaragoza, Spain
3
IEDIS-Instituto Universitario de Investigación en Empleo, Sociedad Digital y Sostenibilidad, University of Zaragoza, 50005 Zaragoza, Spain
*
Author to whom correspondence should be addressed.
Sustainability 2024, 16(4), 1591; https://doi.org/10.3390/su16041591
Submission received: 20 January 2024 / Revised: 10 February 2024 / Accepted: 12 February 2024 / Published: 14 February 2024
(This article belongs to the Special Issue Sustainable Development of Teaching Methods and Education System)

Abstract

:
We investigate the impact of the Problem-Based Learning (PBL) approach supplemented by student-created videos on the teaching of Probability Calculation and Inference Statistics in Business Administration and Management Studies. To that aim, we analyse survey results gathered from a sample of students from the Business Administration and Management and Law-Business Administration and Management degrees at the University of Zaragoza who participated in the PBL experience, focusing on their perceptions, skill development, dynamics of collaboration, and communication with teachers and classmates. Additionally, a comparative study of their final grades is conducted, comparing them with that obtained by students who did not engage in PBL. Our findings reveal that PBL significantly enhances students’ understanding and motivation, along with their communication with teachers, particularly among repeating students, and teamwork skills, particularly among beginners. Furthermore, students participating in PBL activities tended to achieve significantly higher grades than their nonparticipating counterparts did. Moreover, our study contributes to the discourse on sustainable education by highlighting the potential of PBL as a pedagogical approach aligned with the Sustainable Development Goals. By promoting active learning, collaborative problem solving, and communication skills, PBL fosters a culture of lifelong learning and empowers students to address real-world challenges in a sustainable manner. These findings have implications for educators, policymakers, and researchers seeking to promote sustainability in higher education through effective pedagogical practices.

1. Introduction

In the current educational landscape, the constant search for innovative pedagogical methods that promote meaningful learning, and the development of practical skills, has led to the exploration and adoption of approaches that transcend the boundaries of traditional education. One such approach that has gained attention is Problem-Based Learning (PBL), recognised for its ability to engage students in an active process of learning and applying knowledge to solve practical and real problems [1,2].
Statistics, as a fundamental discipline in the training of future professionals in the field of Business Administration and Management, plays an essential role in informed and strategic decision making. Statistics courses should focus on the development of literacy, critical thinking, and the correct use of statistics [3]. However, the mere understanding of statistical concepts is not enough; it is crucial that students are able to apply these concepts in real business situations [4]. It is in this context that PBL emerges as a promising pedagogical approach as it focuses on collaborative and authentic problems [5,6], fostering a deeper and more applicable understanding of statistical concepts.
PBL was originally designed in 1969 at the Medical College of McMaster University in Canada by Howard Barrows as a teaching method for graduate medical admissions, and it has been widely used in social science courses [7]. In a typical PBL environment, learning is triggered by a problem to be solved [8]. The methodology goes beyond the passive memorisation of information and advocates for deeper and more meaningful learning. PBL encourages learner autonomy, informed decision making, and the ability to communicate and collaborate with others to solve problems [9,10]. PBL has been applied in different fields such as business studies, engineering, psychology, teacher education [11], and educational levels, and for this reason perhaps, there is no single agreed approach to its application [12].
This approach also aligns with society’s changing expectations of education. Employers are looking for candidates who not only possess sound knowledge but who are also able to approach problems creatively and work in teams to find solutions [13]. PBL nurtures these skills by offering students practical opportunities to explore, experiment, and learn in a supportive environment.
Instead of receiving predigested information, students become researchers and knowledge builders. PBL not only encourages active learning but also fosters the development of transferable skills such as problem solving, critical thinking, effective communication, and team collaboration [14,15,16]. It also enables students to deal with the complexity and ambiguity inherent in real-world situations, preparing them to deal effectively with challenges in their future professional lives.
In summary, in a constantly evolving world, PBL emerges as a pedagogical strategy that addresses the pressing need to equip students with the skills necessary to tackle the challenges of the 21st century, particularly in the realm of statistics education. These challenges include issues such as low levels of statistical literacy, negative attitudes towards statistics, and a lack of engagement among learners [17]. Moreover, there is a growing demand for critical thinking, problem solving, and collaborative abilities in today’s data-centric society. PBL’s emphasis on active engagement and practical skills positions it as a pertinent and valuable approach within the educational landscape. By equipping students with the tools needed to address complex statistical problems, PBL enables them to communicate their findings within real-world contexts effectively. This aligns closely with the objectives of our study, emphasising the relevance of PBL in preparing students for the tasks they will encounter in their academic and professional worlds from a sustainable perspective.
In this context, this research focuses on the implementation of PBL in the Statistics course for students of the Business Administration and Management (Administración y Dirección de Empresas, ADE in Spanish) and Law-Business Administration and Management (Derecho y Administración y Dirección de Empresas, DADE in Spanish) degrees in their second year of study at the University of Zaragoza. Statistics II is a mandatory course within the ADE and DADE degrees, designed to provide an introduction to Probability Calculation and Statistical Inference. It serves as a crucial element in the education of future professionals in Business Administration and Management, equipping them with essential tools to address problems and make data-driven decisions in the business environment. Despite its significance, the transition from theoretical knowledge to practical application frequently presents substantial challenges. Traditional learning methods often fail to establish a clear connection between statistical concepts, hindering students from recognising the applicability of statistical problem solving to various areas of business content [18].
We find it highly appropriate to incorporate into the PBL technique the creation of videos by students to present their solutions creatively to their course peers. We firmly believe that the inclusion of videos not only provides them with an additional means to understand and apply statistical concepts but also allows them to develop more effective communication skills. By interacting with the videos and engaging in related activities, students have the opportunity to enhance their ability to express ideas clearly and persuasively. Moreover, as these videos are carefully reviewed by their professors, and modified if necessary to ensure quality, they serve as a repository for all students to study the subject. Therefore, this practice not only enhances students’ presentation skills in explaining concepts to their peers but also provides a valuable resource for self-directed learning and material review.
With these backgrounds in mind, this paper is guided by the following research question (RQ): How does the implementation of PBL, along with students’ creation of videos, influence their perception of their learning process in Statistics II and their ability to apply statistical concepts in real business contexts?
To achieve this RQ, the following specific key issues (KI) are analysed:
  • (KI1) Analyse Students’ Perceptions in the Learning Process: Investigate how ADE students in the subject Statistics II perceive the PBL methodology and the use of videos compared to traditional educational approaches. This involves exploring their level of engagement, motivation, and satisfaction when participating in Problem-Based Learning activities supported by videos.
  • (KI2) Explore Applicable Skills Development: Analyse how the implementation of PBL and the use of videos influence the development of practical skills and transferable competencies in Statistics. This includes problem solving, critical thinking, effective communication, and application of concepts in real business contexts [4].
  • (KI3) Examine the Application of Concepts in Business Contexts: Investigate how students apply statistical concepts acquired through PBL and the use of videos in real business situations. This involves identifying specific examples of how they have transferred learning to practical and authentic scenarios.
  • (KI4) Analyse the Dynamics of Collaboration and Communication: Evaluate how the implementation of PBL and the use of videos influence interactions between students, as well as communication with the teacher. This includes aspects such as team collaboration, discussion of solutions, and openness to express doubts and opinions.
  • (KI5) Identify Challenges and Perceived Benefits: Explore the challenges students may face when engaging in PBL activities with the use of videos and how these challenges compare to the perceived advantages. This provides information on factors that may influence the effectiveness of the approach and the incorporation of videos.
These key issues, centred on students’ perceptions, encompass aspects such as effectiveness of the approach, skill development, collaboration dynamics, communication patterns, and the challenges and benefits associated with PBL and video integration, serving as focal points in our analysis. Therefore, we formulate hypotheses to guide our investigation based on the insights gleaned from these key issues, reflecting our suspicions regarding the effectiveness of PBL and video-based learning in enhancing student learning outcomes and preparing them for real-world applications:
Hypothesis 1 (H1):
Students’ perceptions of the learning process in Statistics II, specifically regarding the PBL methodology and the use of videos, will be more positive compared to traditional educational approaches.
Hypothesis 2 (H2):
The implementation of PBL and the use of videos will significantly influence the development of practical skills and transferable competencies in Statistics II.
Hypothesis 3 (H3):
Students who engage in PBL activities and utilise videos will exhibit a higher propensity to apply statistical concepts in authentic business situations.
Hypothesis 4 (H4):
The implementation of PBL and the use of videos will positively influence the dynamics of collaboration and communication among students, as well as with the teacher.
Hypothesis 5 (H5):
The perceived benefits of engaging in PBL activities with the use of videos will outweigh the challenges faced by students.
These hypotheses serve as guiding principles for our investigation, shaping the direction of our research inquiries and providing a framework for analysing the data collected.
The importance of this research lies in its potential to enrich the learning experience in Statistics II. By understanding how students perceive PBL and videos as pedagogical tools, teaching can be adapted to align with the needs and expectations of ADE and DADE students more effectively. Furthermore, this research contributes to the advancement of knowledge at the intersection between statistics education and business education by exploring how an innovative pedagogical approach can influence students’ ability to apply statistical concepts in real-world situations, thereby improving their preparedness to face challenges in the business world.
In summary, this research not only aims to explore the impact of PBL and the use of videos on the education of business students in Statistics II but also strives to establish a robust foundation for enhancing the teaching and learning of statistical concepts within the business context. By contributing to the evolving body of literature in applied statistics education, this research serves as a valuable resource for educators, researchers, and practitioners interested in effectively preparing future leaders in Business Administration and Management.
The remainder of this paper is organised as follows: Section 2 outlines the research design and the procedures employed for data collection and analysis. In Section 3, the findings from the surveys and student responses are examined, with a particular focus on their correlation with the final grades achieved in Statistics II. Section 4 synthesises the results, discusses their implications, and analyses the merits of the method for enhancing the implementation of the methodology in Statistics II and, by extension, in other similar educational contexts. Finally, Section 5 concludes this study and provides some future research lines.

2. Methodology

2.1. Study Design

During the academic year 2022-2023, we implemented the PBL methodology [19] in the Statistics II course, which is part of the second-year curriculum in the ADE and DADE degrees at the Faculty of Economics and Business of the University of Zaragoza. This course is allocated 6 ECTS (European Credit Transfer and Accumulation System) credits, comprising 30 hours of lectures and 60 hours of practical activities using R Commander. The course is structured with two hours of lectures and two hours of practical activities per week, divided into two groups. In the traditional learning approach, students receive study materials in PDF and PowerPoint formats for lecture sessions, along with data files for practical activities. All materials are accessible throughout the semester on the Moodle platform, which serves as both a resource hub and a communication channel between teachers and students. In those groups, characterised by the traditional methodology, students experience passive learning, where the teacher delivers lectures without much opportunity for reflection or active engagement from the students. Consequently, this format often limits students’ ability to deeply comprehend and apply course concepts as they may not have sufficient time for critical thinking or discussion. Hence, this is why we are interested in innovating with the PBL methodology, which allows for a more interactive and participatory approach in the classroom, providing students with the opportunity to actively engage in their learning and promoting critical and reflective thinking. This contrasts significantly with the traditional learning approach, where passivity may restrict deep understanding and application of the concepts taught.
The PBL methodology typically involves seven steps for study groups to follow, as outlined by Schmidt [20]. These steps are as follows: (1) clarification of terms and concepts; (2) definition of the problem; (3) analysis of the problem; (4) performing an inventory of explanations obtained from the previous steps; (5) formulation of learning objectives; (6) collection of additional information; and (7) synthesis and testing of acquired information.
To tailor the methodology to the business environment and facilitate the creation of shared study resources, we established and implemented the following steps:
  • Step 1: Identification of concepts and understanding of the problem. Students were tasked with solving problems similar to the exercises covered in class and presented in the course’s problem booklet. Participants were randomly grouped into teams of three for active participation and discussion.
  • Step 2: Analysis of the problem. Each group of students carried out a study of the assigned problem, making use of the available bibliography and the concepts acquired in traditional classes. This stage holds significant importance as it mirrors real-world scenarios in the business environment, where individuals from the same or different departments collaborate as a team to devise solutions for a given problem.
  • Step 3: Development of solutions. Once the problems had been analysed, the groups embarked on planning and discussing solutions. This phase facilitated student discussions on various approaches, strategies, and possible solutions. The collaboration among group members not only fostered communication and critical thinking but also encouraged exposure to different perspectives.
  • Step 4: Group tutoring. Teachers take on a facilitating role, offering guidance and support as groups move forward with their problems. This involves organising a group tutorial where members must present their analysis and developed solutions to the given problem. The objective was to identify shortcomings and misconceptions while reinforcing the statistical knowledge acquired, helping students articulate mathematical expressions both in written and oral form.
  • Step 5: Recording an explanatory video. After reaching consensus on their solutions, the groups proceeded to record explanatory videos showing their approaches and reasoning. These videos served as a means to demonstrate the understanding and application of their acquired knowledge. Students were not only required to provide correct solutions but also to justify and communicate their thought processes clearly and effectively. The recorded videos underwent review by the teachers, who played a crucial role in offering feedback and corrections. This stage allowed teachers to identify errors, provide clarifications, and offer suggestions to enhance the students’ presentations. The interaction between teachers and students at this stage was essential to ensure the quality and accuracy of the shared information. It should be taken into account that the teacher’s involvement in the elaboration of videos makes the students who elaborate on them understand the course better and, at the same time, transmit the lessons learned to their classmates in a closer way. It should be noted that the teacher not only analyses whether or not the problem is correctly solved but also how to express the solution in a rigorous way.
  • Step 6: Sharing the problem in an online platform. Once the videos were reviewed, corrected, and improved, they were published on a website accessible to all students in the course. This platform served as a central repository of shared resources, where the videos became additional study tools. Students could access a variety of solutions and approaches, thereby enriching their understanding and perspectives of the problems presented.

2.2. Population and Sample

The target population comprises all students enrolled in the Statistics II course in the second year of the ADE and DADE degrees at the Faculty of Economics and Business of the University of Zaragoza during the course years of 2022-2023. For this study, a sample of 82 students was selected who voluntarily agreed to participate in this research. The sample was selected to ensure a diverse representation of opinions and experiences. The sample consisted of 43.9% men and 56.1% women, with an average age of 20.70 years ranging from 20 to 28 years. The median and mode were both 20 years, and the standard deviation was 1.39 years. Among the participants, 28.05% had previously taken the course in other years. Regarding their degree programs, 45.12% were pursuing the ADE degree, while 54.88% were enrolled in the DADE degree. We conducted an analysis of the grades obtained with respect to the previous year. Each year, there were two exam sessions. As there were repeating students in the analysis, the number of exam sessions attended varied between 0 and 4, with 64.63% of students having attended only one session.

2.3. Instruments

A structured questionnaire served as the primary instrument for data collection. The questionnaire, adapted from [21,22], included closed-ended questions aimed at capturing students’ perceptions of various aspects of PBL implementation. The questions focused on students’ perceptions of the effectiveness of the approach, their level of engagement and satisfaction, the development of practical skills, the student–teacher relationship, and the challenges encountered versus the benefits gained. In addition, specific questions on the usefulness of the videos for documenting and presenting solutions were included (see Appendix A). The questions were measured on a 5-level scale, with the following meanings: 1 (totally disagree), 2 (strongly disagree), 3 (neutral), 4 (strongly agree), and 5 (totally agree).

2.4. Data Analysis

The findings of this study are grounded in the examination of responses gathered through a structured questionnaire completed by 82 second-year students pursuing degrees in ADE and DADE during the Statistics II course. The detailed responses provide valuable insights into students’ perceptions regarding the implementation of PBL and the utilisation of videos in this educational context. An exploratory analysis was carried out for each question, supplemented by factor analysis and cluster techniques to identify relevant multivariate patterns. Furthermore, a comparative study of factor scores was undertaken, classifying students based on attributes such as gender, age, degree, and first enrolment (i.e., whether students were repeaters or not in the course). Finally, the impact of the implementation of the 6-step PBL methodology supplemented by videos (from now on, we will refer to this as “Project”) on the final grades in Statistics II was assessed using regression models.

3. Results

3.1. Univariate Exploratory Analysis

In Table A2 (see Appendix B), we show the results of a descriptive statistical analysis of the responses to questions Q1 to Q16 in the questionnaire. Every response expresses positive views of the project, as indicated by average scores exceeding a value of 3. Notably, the highest ratings are attributed to questions related to collaboration and communication with teachers and classmates (questions Q11, Q15, Q16), formation (Q8), and understanding of the subject matter (Q2). Furthermore, a significant proportion of students favoured project activities over traditional methods (theory and exercises led by the teacher, Q1) and exhibited a high level of commitment to the project (Q5). A graphical summary of the responses can be found in Figure A1 of Appendix B.

3.2. Multivariate Analysis

In this section, we carry out a multivariate analysis of the responses from the 82 students to the survey questions. Our goal is to identify existing multivariate patterns in these data to assess the impact of the learning project on the topics examined in the paper: utility, motivation, student engagement, learning tools, personal skills, and benefits. To that aim, we first perform a factor analysis to unveil the underlying factors influencing these responses. Subsequently, we conduct a comparative study of factor scores among students grouped by first enrolment, gender, age, and degree to identify differences in opinions between these groups. Thirdly, we implement a cluster analysis of the students to explore potential differences in opinions not explained by the aforementioned groups. Finally, the impact of the project on the final grade in Statistics II is assessed using regression models. All results were obtained using the R 4.1.3 statistical package.

3.2.1. Factor Analysis

To assess the appropriateness of the factor analysis, we conducted Bartlett’s sphericity test and calculated the Kaiser–Meyer–Olkin (KMO) and Measures of Sampling Adequacy (MSA). The results are shown in Table 1. Additionally, the correlation matrix of the variables is provided in Appendix C (Figure A2), along with matrix scatter plots, where the variables are grouped according to the identified factors (Figure A3 and Figure A4). All results indicate the high adequacy of the factor analysis. Bartlett’s test rejects the hypothesis that the correlation matrix is equal to the identity matrix; the KMO is 0.81, signalling the adequacy of the factor analysis; and the MSA for the analysed variables ranges between 0.64 and 0.91, indicating that all the survey items are suitable for use in the factor analysis.
By applying the Kaiser criterion and analysing the correlation matrix of the variables, we estimated the number of factors to be four. In Table 2, we present the factor loading matrix, which was calculated using the Principal Components Method and Varimax Rotation. Furthermore, we provide the communalities and specificities of each variable, which indicate the percentage of variance explained and unexplained by the common factors, respectively. Additionally, we present the complexity index, which estimates the number of factors associated with each variable. The identified factors explained 63.89% of the total variance. Finally, in Appendix C (Figure A2 and Figure A3), the matrix scatter plots depict variables grouped according to their strongest associations with factors.
The first factor assesses students’ preference for PBL (question Q1), followed by the utility that students attribute to the project in their statistical education (question Q2), the learning of the concepts and techniques of the subject (questions Q8, Q10, Q12), their motivation (question Q7), and interest in statistics (questions Q3, Q4, Q9). For this reason, we have named it "Utility of the Project" (Utility). The second factor is related to questions about teamwork skills (questions Q13, Q14, and Q15), and we have named it "Teamwork Skills" (Teamwork). The third factor is related to questions Q5 (full commitment to the project) and Q6 (satisfaction with the work done), which is why we have named it "Degree of Involvement with the Project" (Involvement). Finally, the fourth factor is related to questions about the degree of interaction with the Statistics teacher (questions Q11 and Q16), and we have named it "Degree of Communication with the Teacher" (Teacher).

3.2.2. Comparative Study

After identifying the common factors, in this subsection, we carry out a comparative study of their scores among students grouped by their first enrolment, gender, age, and degree. We compare their mean and median scores both graphically (using boxplots, see Figure 1, Figure 2, Figure 3 and Figure 4) and numerically (utilising Student’s t-test or Snedecor’s F-test in the case of age, and the Kruskal–Wallis test, respectively; see Table 3, Table 4, Table 5 and Table 6).
When grouping students by the variable First Enrolment, statistically significant differences are observed regarding Utility and Teacher (Table 3 and Figure 1). Repeating students (first enrolment = No) have shown greater communication with the teacher and have found more utility in the project. This positive effect is noteworthy, as motivating and engaging these students were among the main objectives of implementing the project.
When comparing factor scores based on the gender of the students, statistically significant differences emerge, particularly concerning the Teacher factor (Table 4). Males have shown a higher tendency to be involved in the project compared to females (Table 4 and Figure 2). This outcome likely reflects the relatively lower performance of men in this subject. Notably, 33.3% of men have a non-first enrolment in the subject, contrasting with 23.9% of women, suggesting that men tend to repeat the course more frequently. This increased communication with teachers of men in the project is viewed as a positive effect, offering them an alternative means to enhance their performance in the subject.
If we compare the factor scores based on the age of the students, we observe statistically significant differences in the Utility and Teamwork factors (Table 5). Younger students tend to perceive less utility in the project, while exhibiting greater teamwork skills (Table 5 and Figure 3). The decreased perceived utility among younger students may be attributed to their higher likelihood of being enrolled in the subject for the first time. Regarding the Teamwork factor, older students are likely more experienced in collaborative work from other subjects, allowing them to discern the advantages and disadvantages of such projects.
If we compare the factor scores according to the degree of the student, there are no significant differences between the students of the two degrees in any of the factors (Table 6 and Figure 4).
Finally, and to explore the existence of more complex differences, Table 7 presents the results of the regression models estimating the factor scores based on the first enrolment, gender, age, and degree variables. Additionally, second-order interactions among these variables have been considered. The models were selected based on the maximum adjusted R2, employing an exhaustive search for variable selection.
It can be observed that in terms of the Utility factor, higher scores tend to correspond to older male students who are studying the DADE degree for the first time. Regarding the Teamwork factor, higher scores tend to correspond to younger females studying DADE. For the Involvement factor, higher scores tend to correspond to males with an age over 21 who are studying DADE. Finally, for the Teacher factor, higher scores correspond to males who are repeating the course.

3.2.3. Cluster Analysis

In this section, we explore the existence of more general patterns in the survey answers without imposing any restrictions based on the observed variables. To achieve this, we employ cluster analysis techniques applied to the factor scores, using a combination of hierarchical and nonhierarchical methods. Initially, we determine the number of groups using an agglomerative method with a Ward link, and subsequently, we refine the obtained solution through a k-means algorithm.
The selected number of groups was two, with Group 1 containing 35 students (42.68%) and Group 2 containing 47 students (57.32%). Figure 5 illustrates the group profiles, indicating that members of Group 1 tend to give lower scores to questions related to the four factors (Utility, Teamwork, Involvement, and Teacher) compared to members of Group 2.
Table 8 presents the results of cross-referencing the group variable with student characteristics (first enrolment, gender, age, and degree). Specifically, we display the column profiles and the results of the Chi-Square test. It is evident that Group 1 tends to have more first enrolment, female, and students under 21, as well as ADE students compared to Group 2, with significant differences in terms of the first enrolment variable. These findings align well with those obtained in the previous sections, applying robustness to the analysis conducted.

3.2.4. Statistical Analysis of Statistics II Grades

In this section, we assess the impact of the project on the final grades obtained by students in Statistics II. For this purpose, we analyse the final grades achieved in the first call of Statistics II within the ADE and DADE degrees. The total number of students amounted to 149, with 69 (46.31%) enrolled in the ADE degree and 80 (53.69%) in the DADE degree. Among them, 68 (45.64%) were male and 81 (54.36%) were female; 75 (50.34%) took the exam in the first call, while 74 (49.66%) participated in subsequent calls; 90 (60.40%) were under 21 years old, 34 (22.82%) were 21 years old, and 25 (16.78%) were over 21 years old. Furthermore, 43 students (28.26%) did not partake in the project, while 106 (71.14%) did. Lastly, the mean and median final grades were 5.27 and 5.33, respectively.
In Table 9, we compare the Statistics II grades of students who participated in the project with those who did not. The mean and median grades for students who engaged in the project were 5.48 and 5.81, respectively, which were significantly greater (95% significance level) than those of nonparticipating students (mean: 4.75, median: 5.00). Thus, the project had a significant positive impact on the final grades of participating students.
To examine the consistency of the project’s impact on final grades and identify which student characteristics tend to yield the best results, Table 10 presents the results of a regression analysis of grades on student characteristics, project participation, and their two-way interactions. We utilised a variable selection procedure to identify the model with the highest adjusted R2 coefficient through an exhaustive exploration of all the possible models.
It is evident that, along with a significantly positive impact of participating in the project, this effect increases significantly by 95% if the student is 21 years old, and it decreases if the student belongs to the DADE degree or if he/she is a repeater.
These effects could arise, in the case of repeaters, from the fact that they generally tend to have a lower academic level, which may affect their ability to benefit from the project. In the case of DADE students, this effect is poorly supported due to the small number of students (only 11) who did not participate in the project, who mostly achieved good grades.

4. Discussion

The results of our study provide compelling evidence supporting the acceptance of the hypotheses formulated in this research. Through a comprehensive analysis of the data collected from students enrolled in the ADE and DADE degrees at the University of Zaragoza, we have observed significant positive outcomes attributed to the implementation of the PBL approach, particularly when supplemented with video resources, in teaching Statistics II. Below, we discuss these findings in detail.

4.1. Hypotheses Discussion

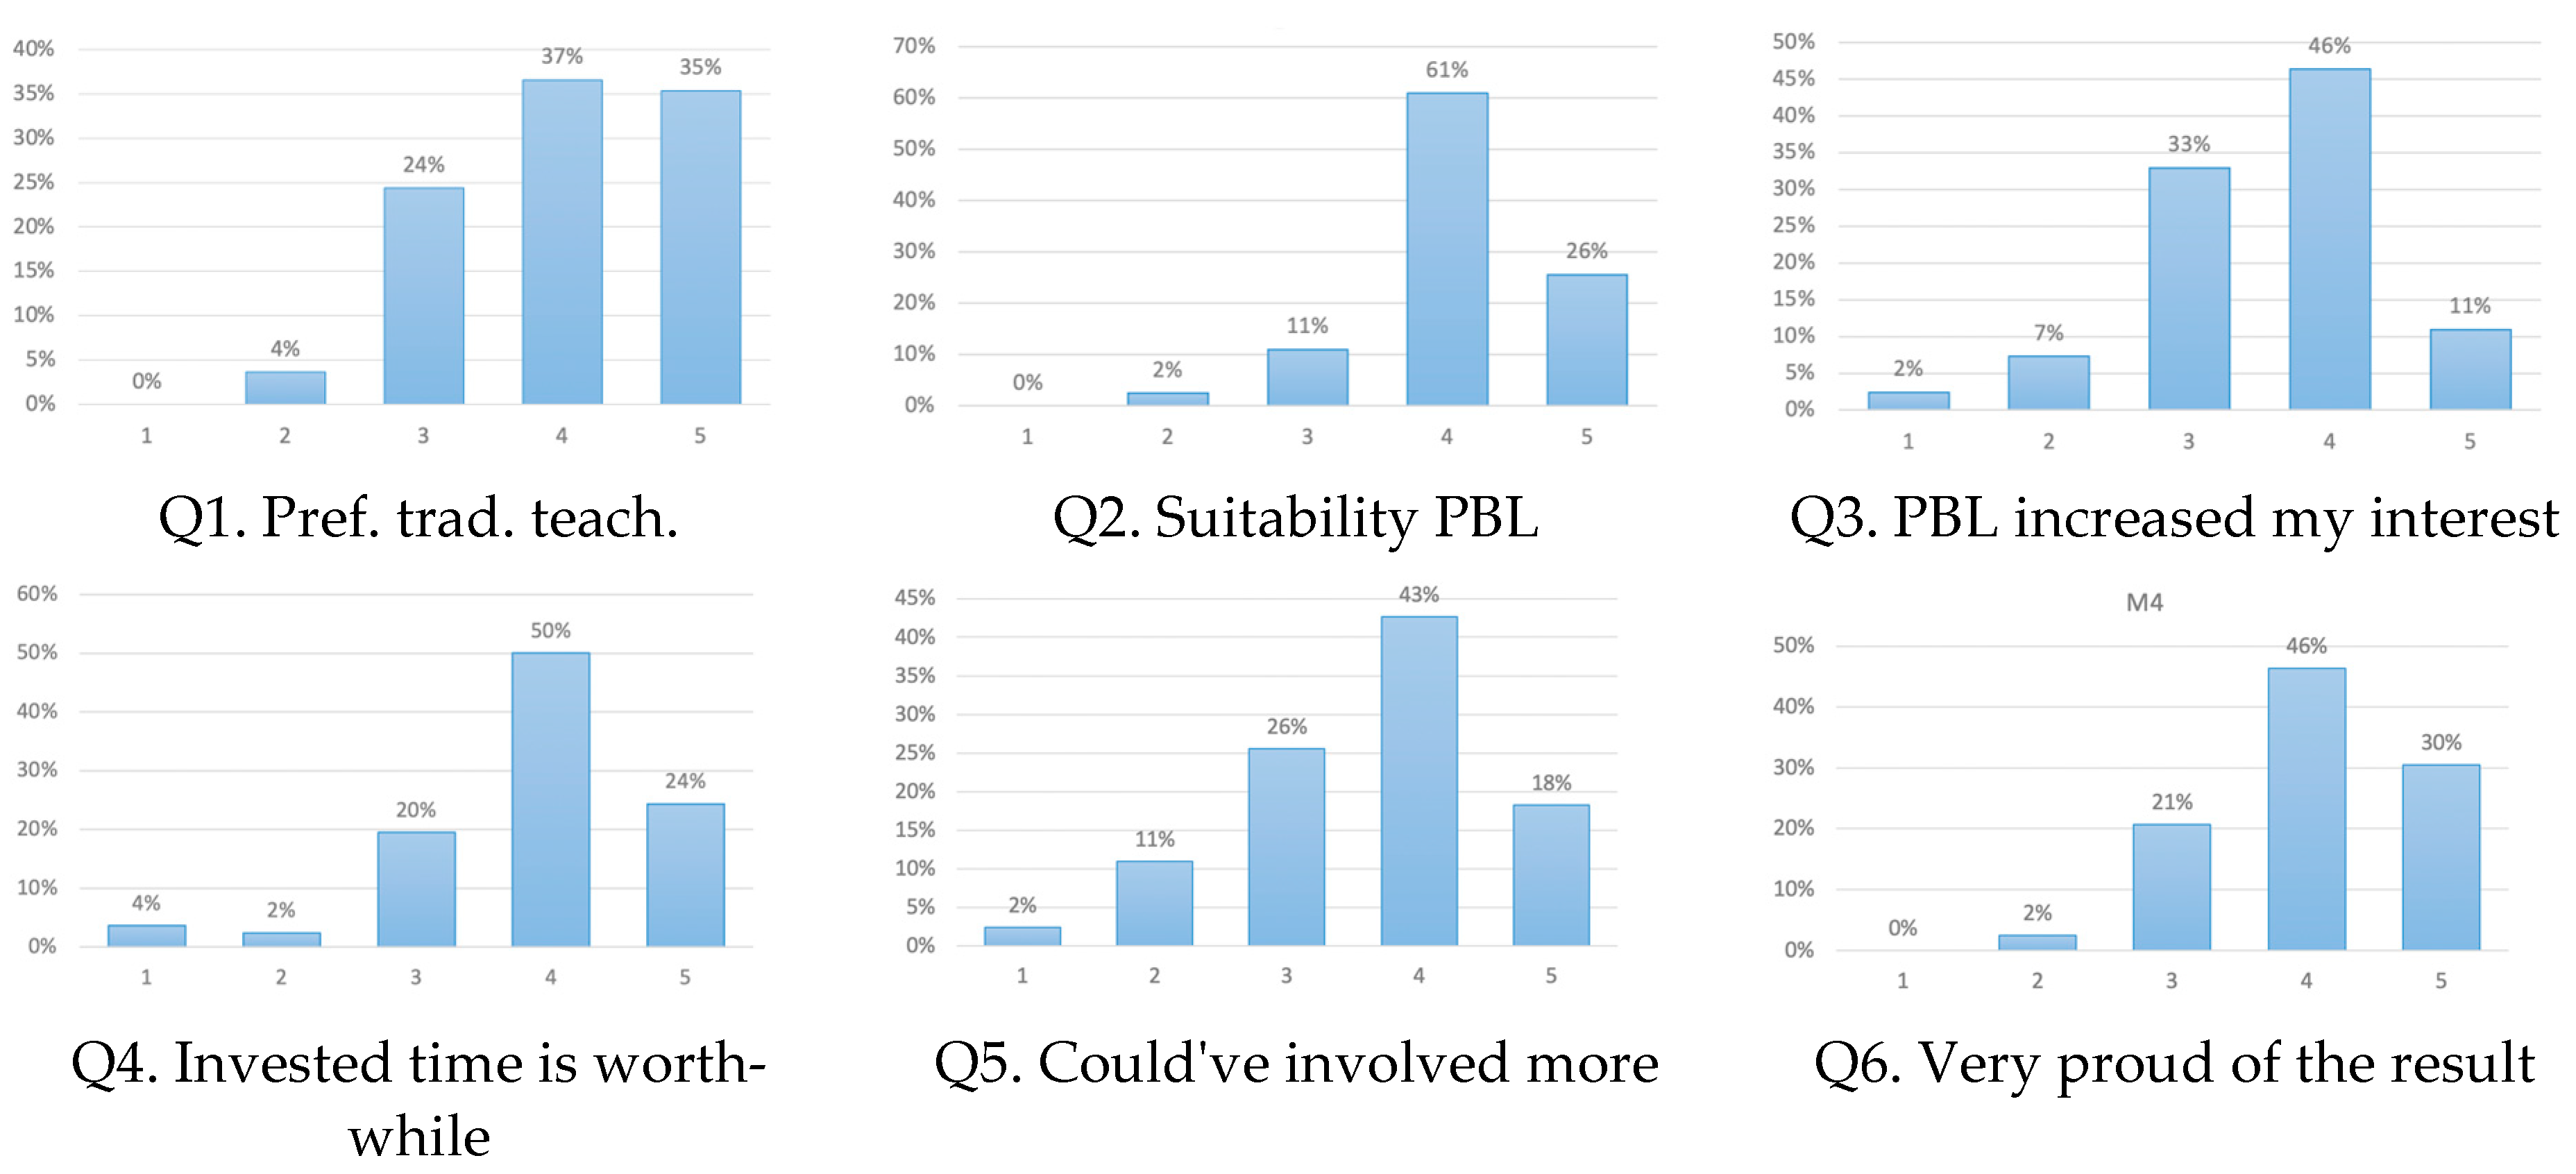
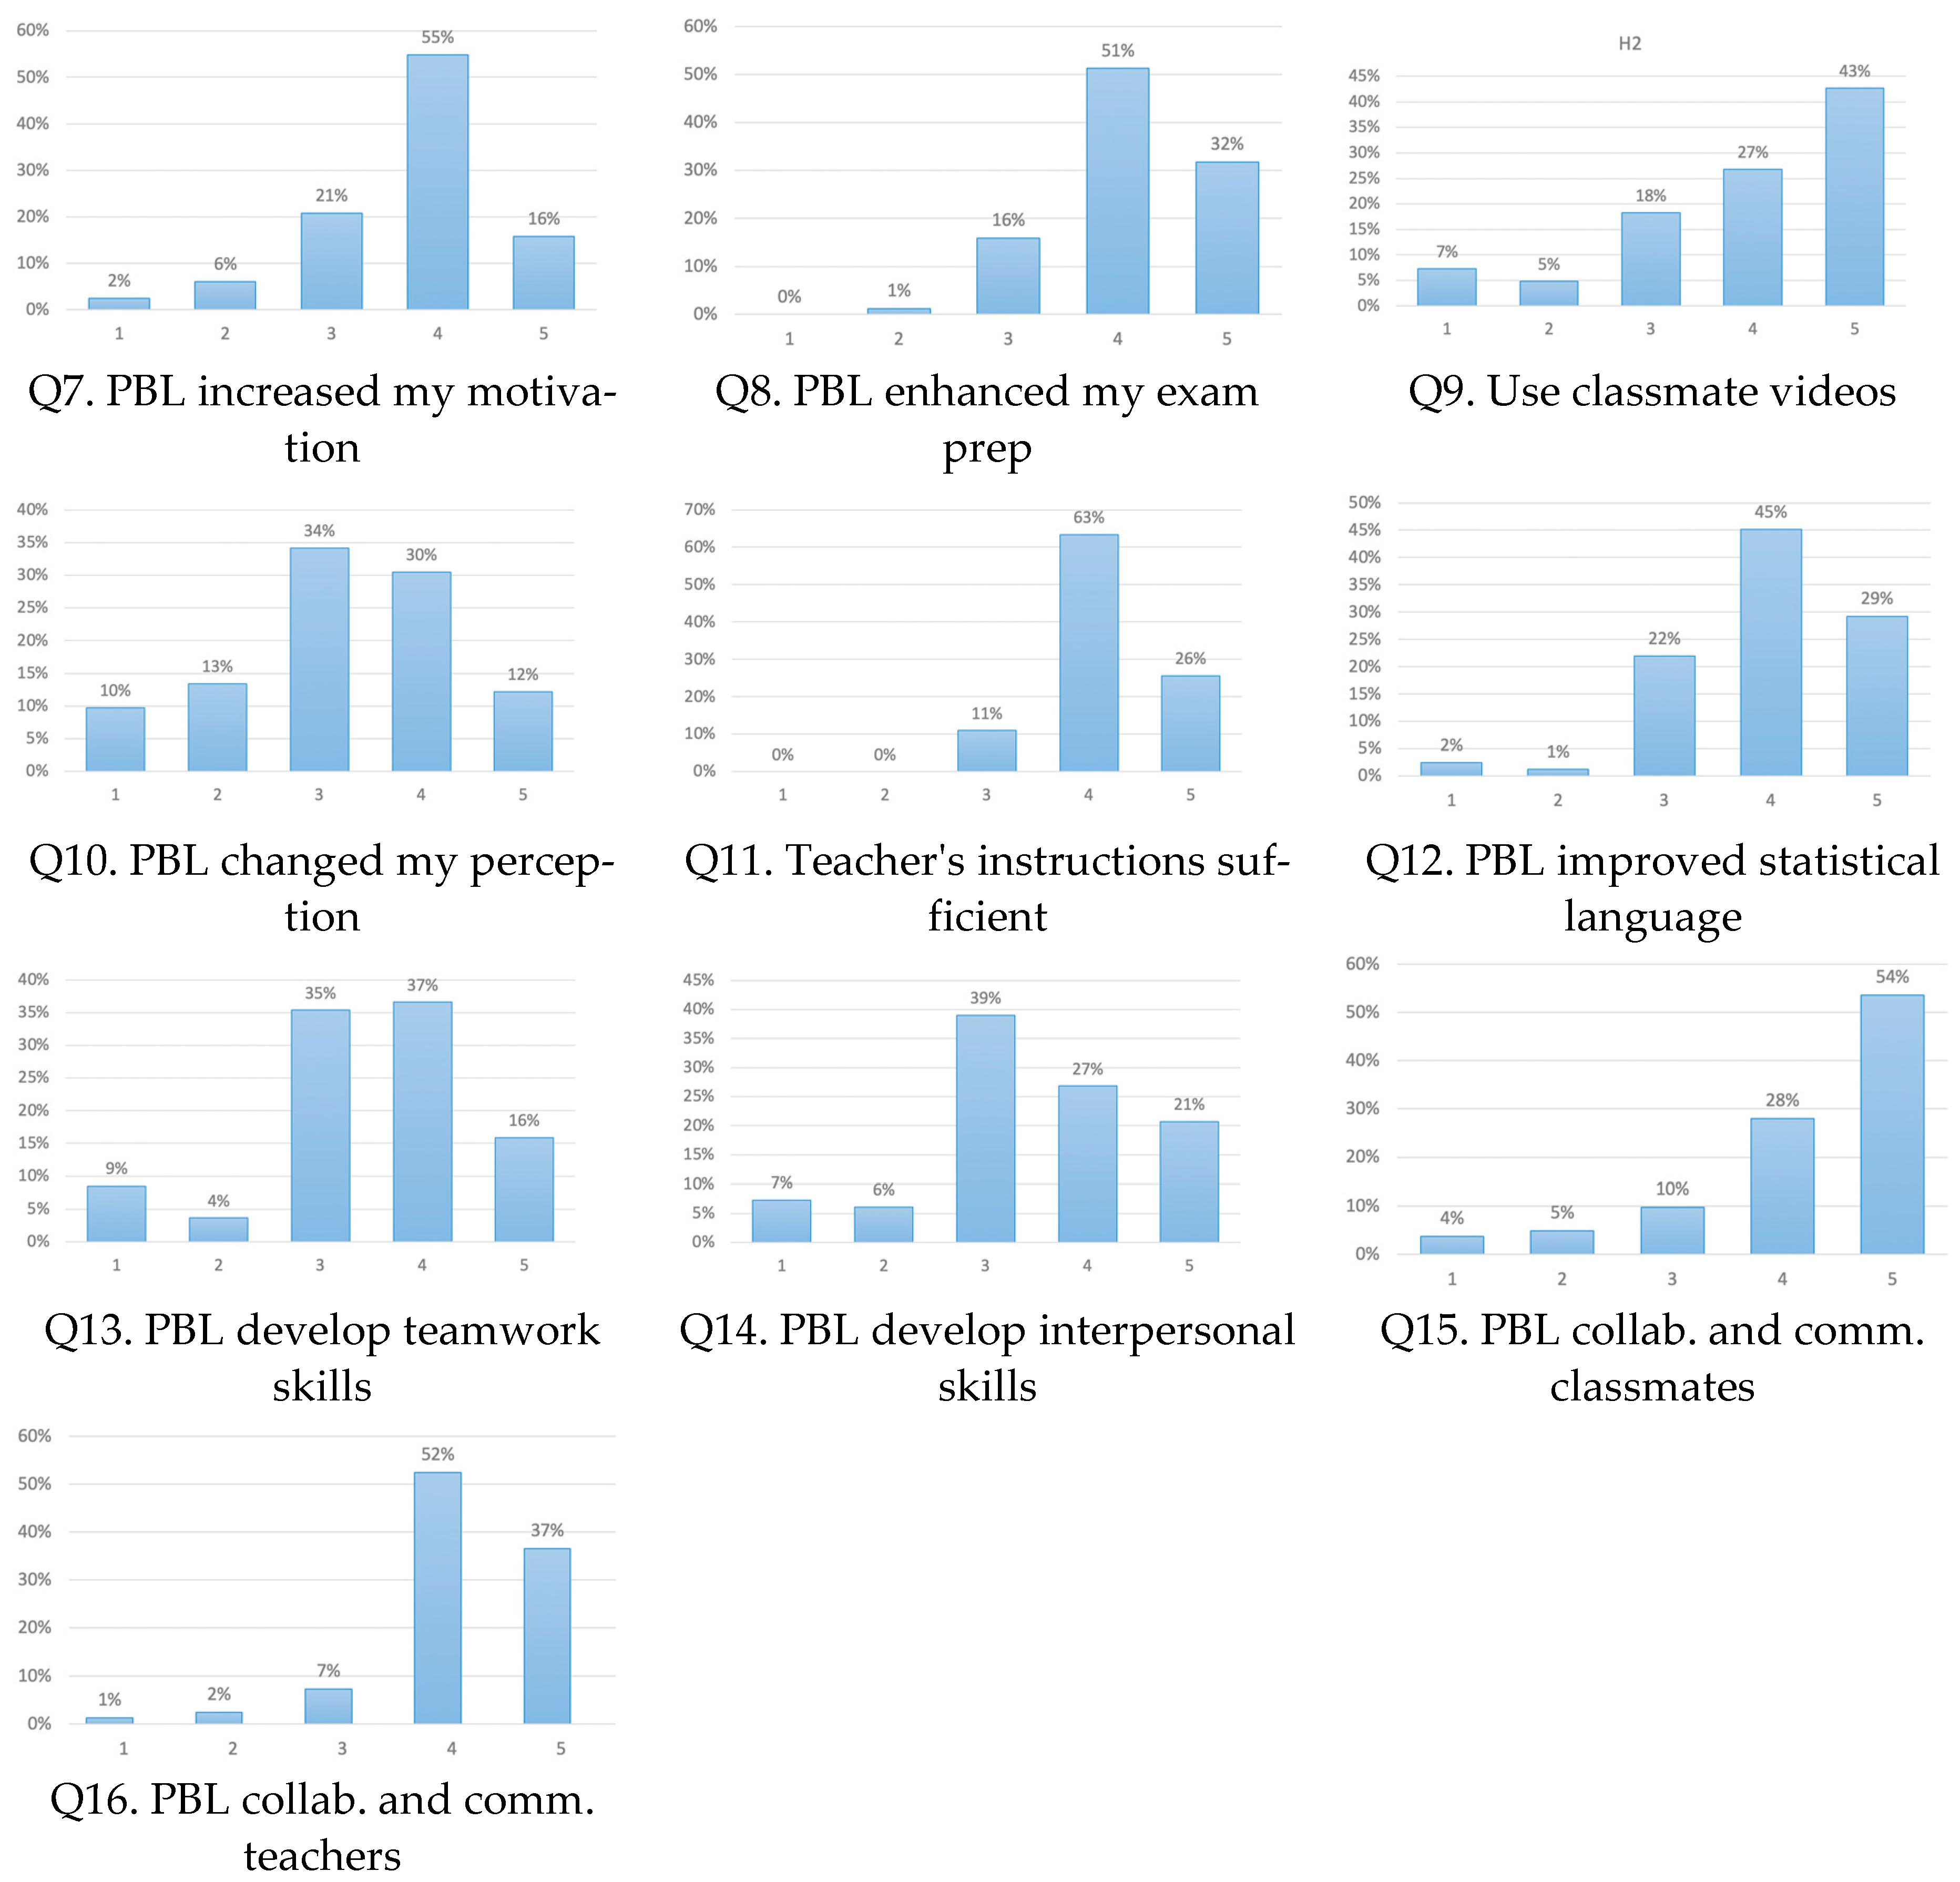
If we analyse students’ perceptions in the learning process (KI1), our results show that 71% of students increased their motivation towards the subject, and 61% of students indicated a high level of commitment to the project. Furthermore, most participants (87%) perceived PBL as suitable for learning statistics. This aligns with the initial goal of the project to motivate and support students who may face challenges in this subject.
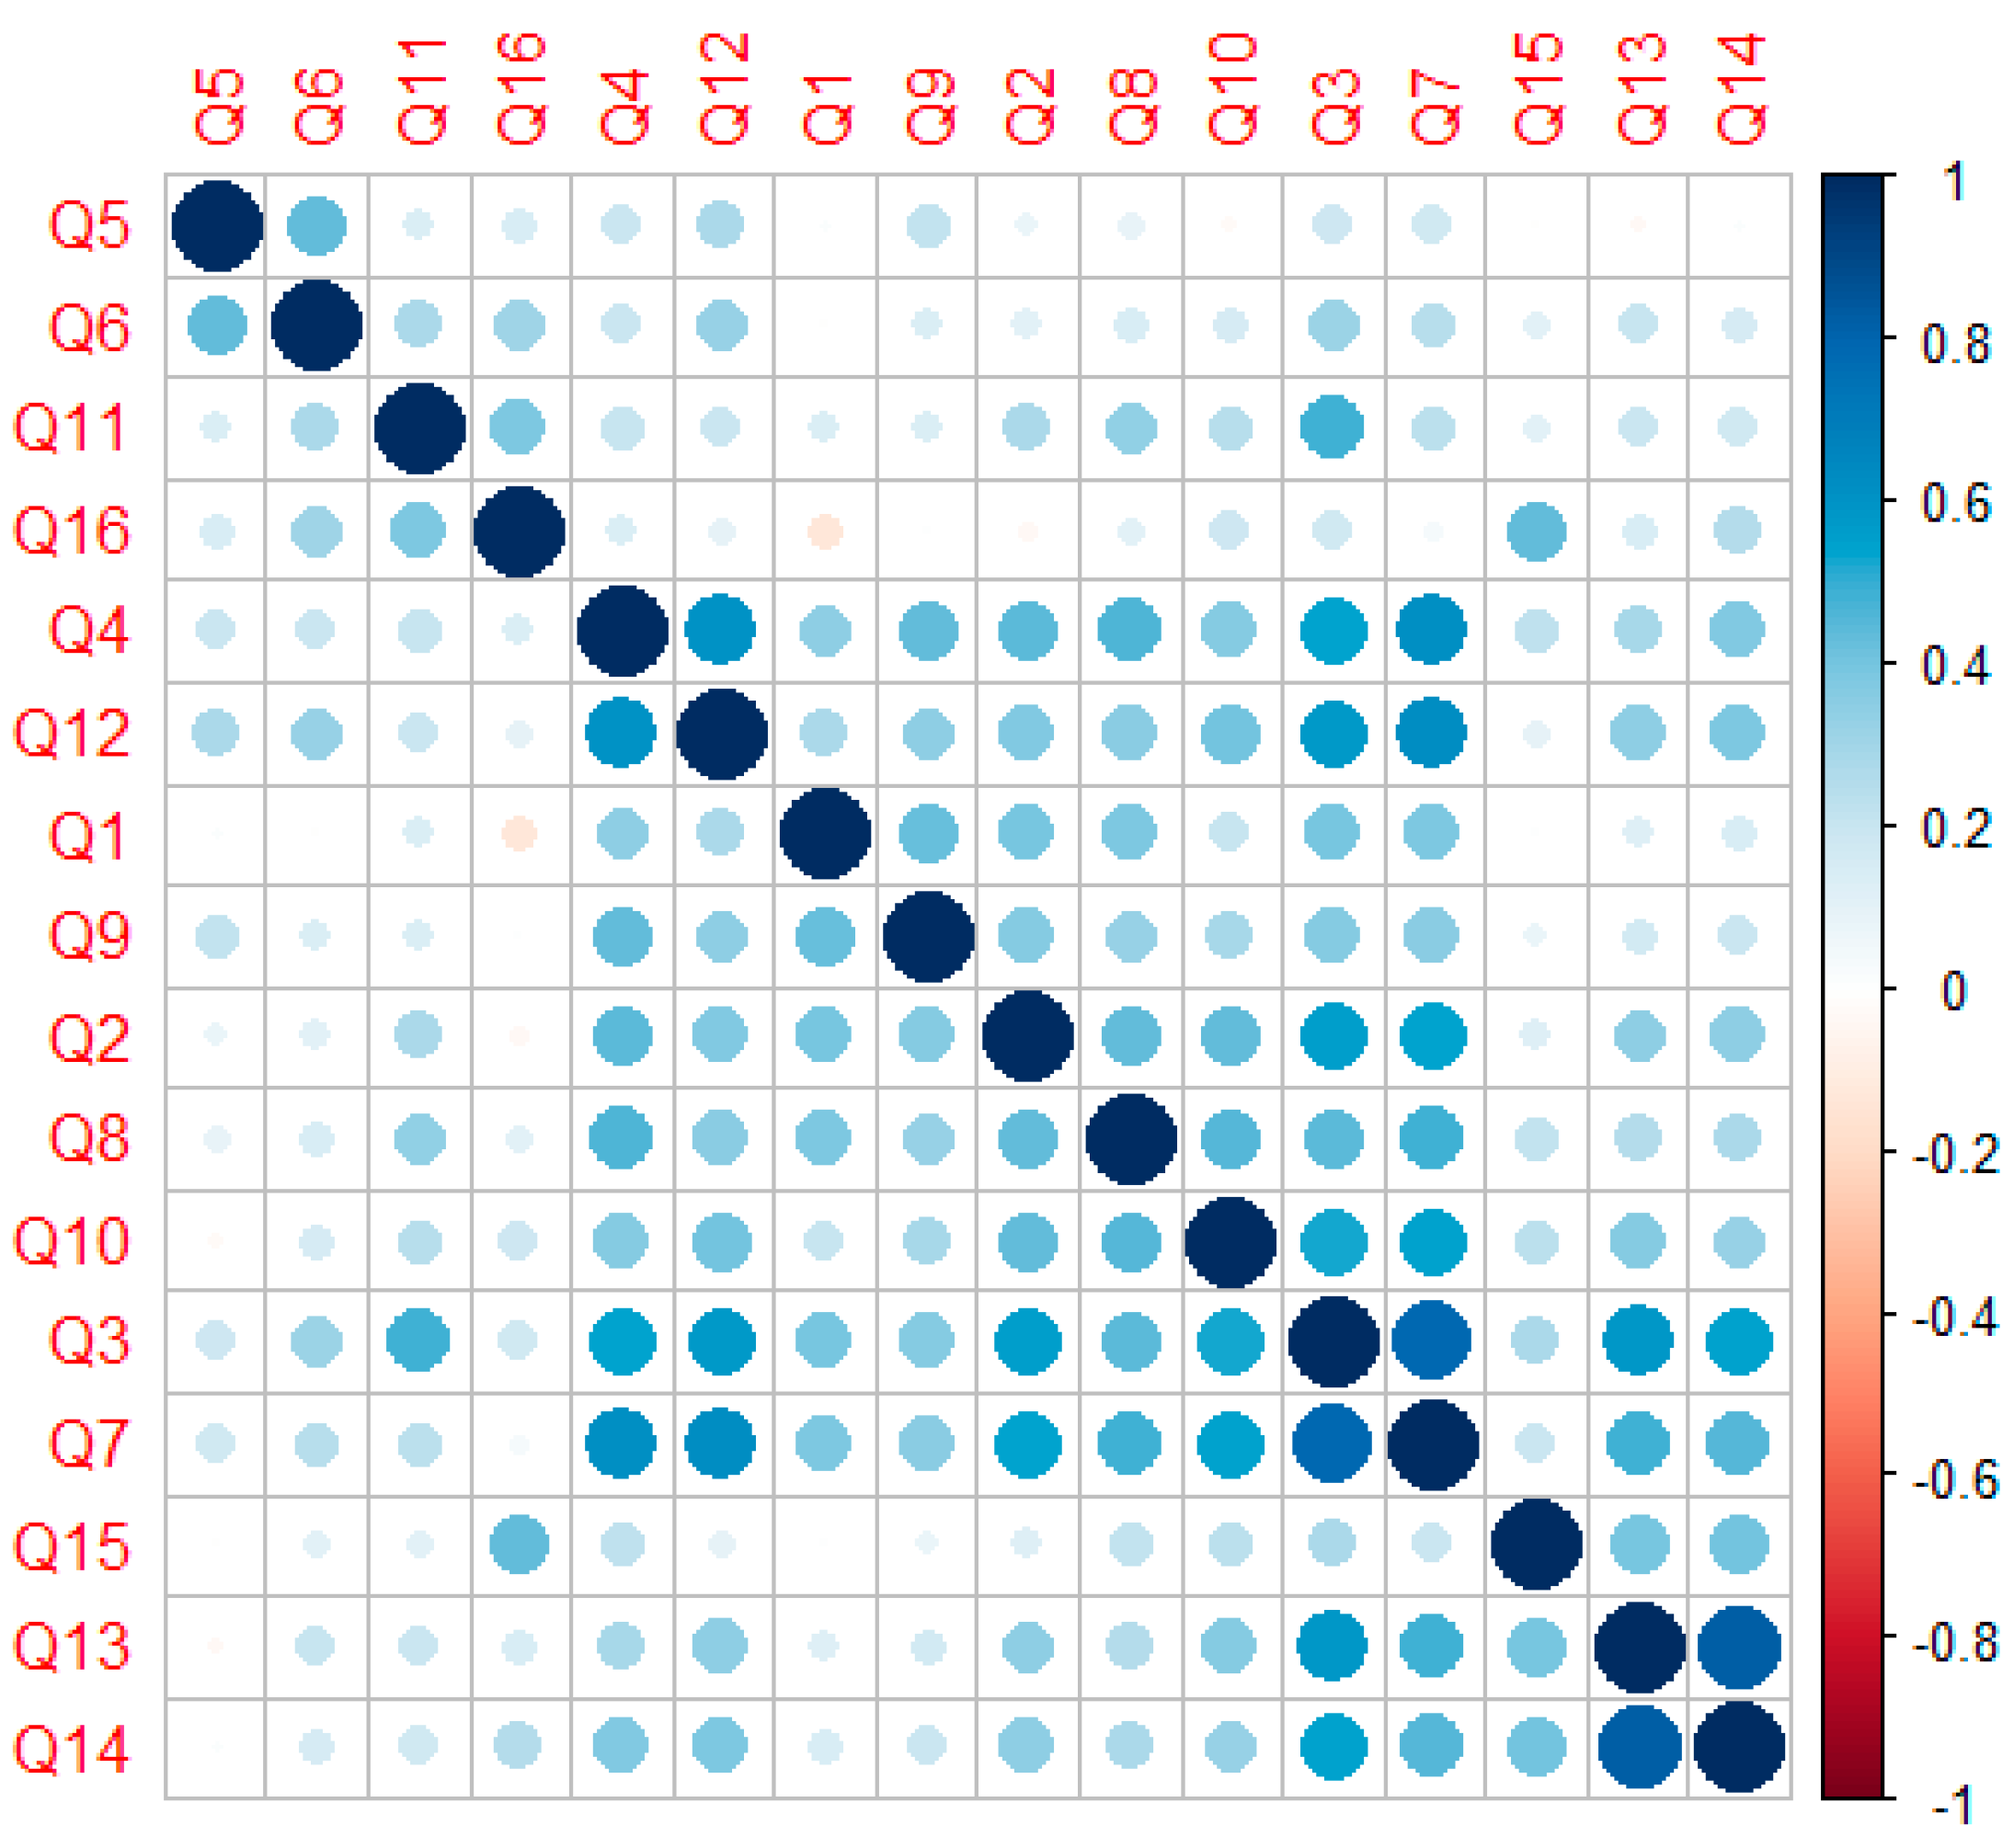
Therefore, according to these findings, our research supports H1. The results demonstrate that the PBL methodology and the integration of video resources were positively perceived by students compared to traditional educational approaches. This positivity manifested in increased motivation towards the subject, heightened commitment to the project, and an overall recognition of the suitability of PBL for learning statistics. Our analysis also revealed a positive correlation between students’ perceived utility of the project and their active engagement in the learning process. This positive attitude is partly attributed to the collaborative and applied nature of the PBL approach, which fosters proactive student involvement in addressing real-world problems.
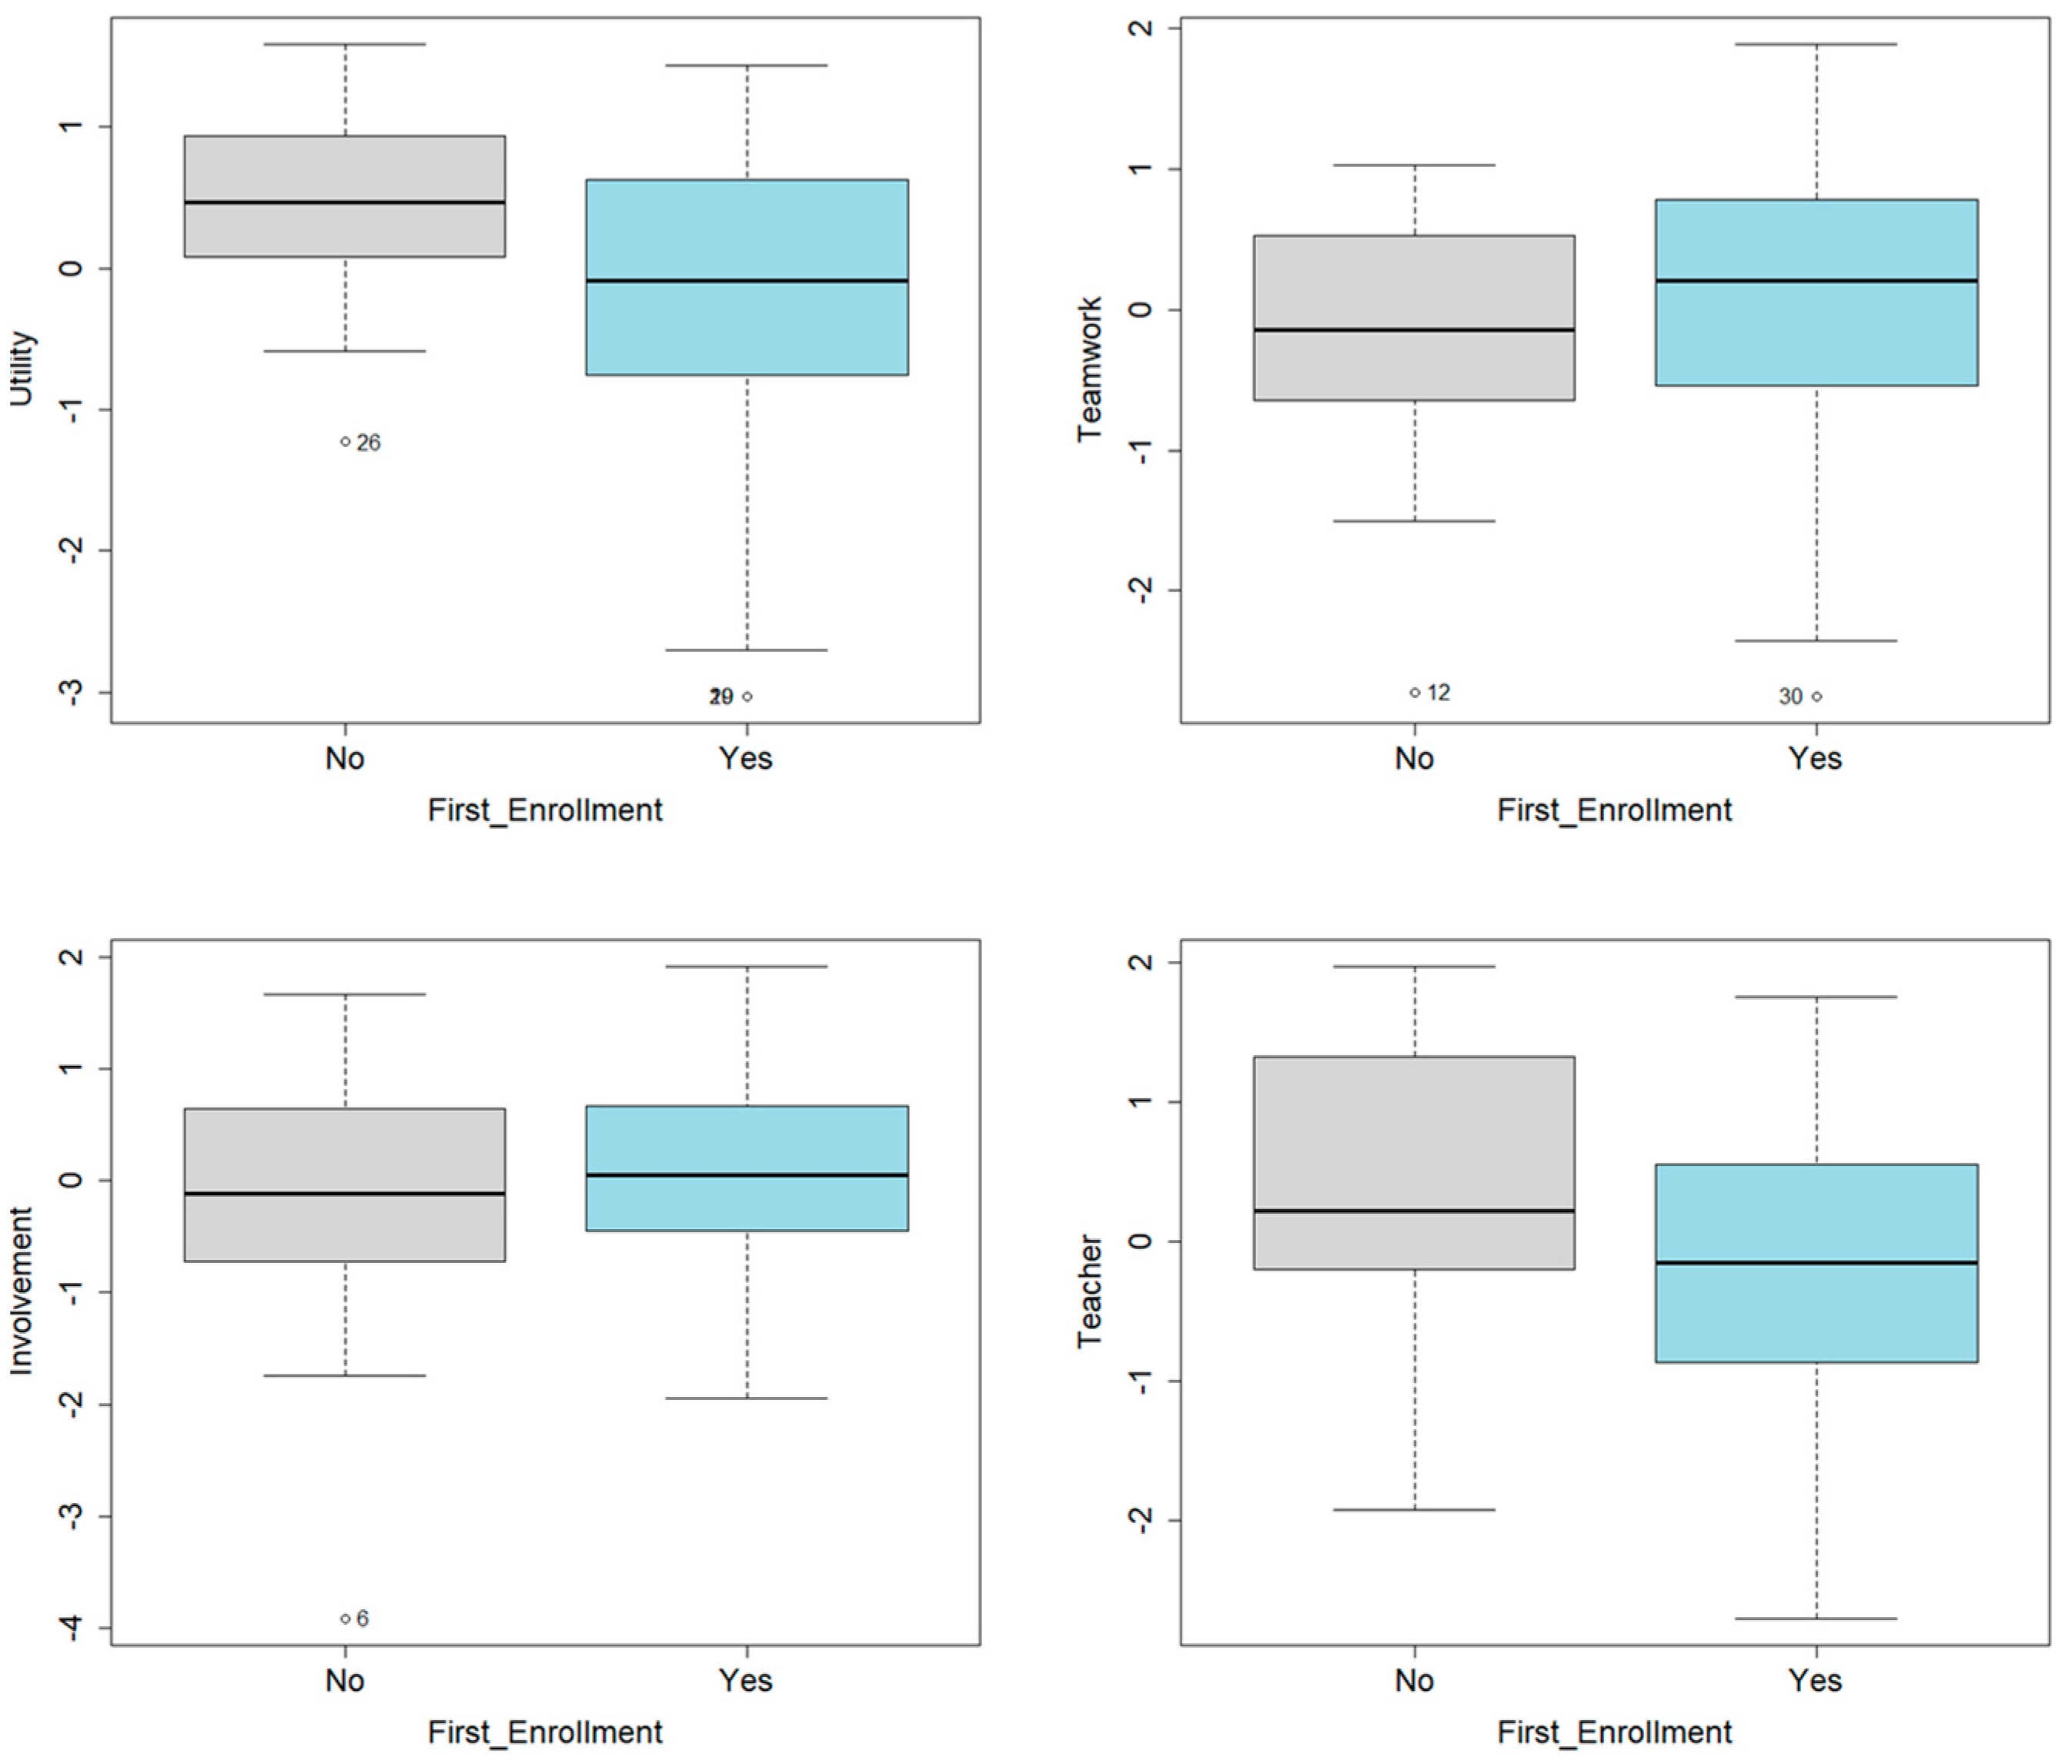
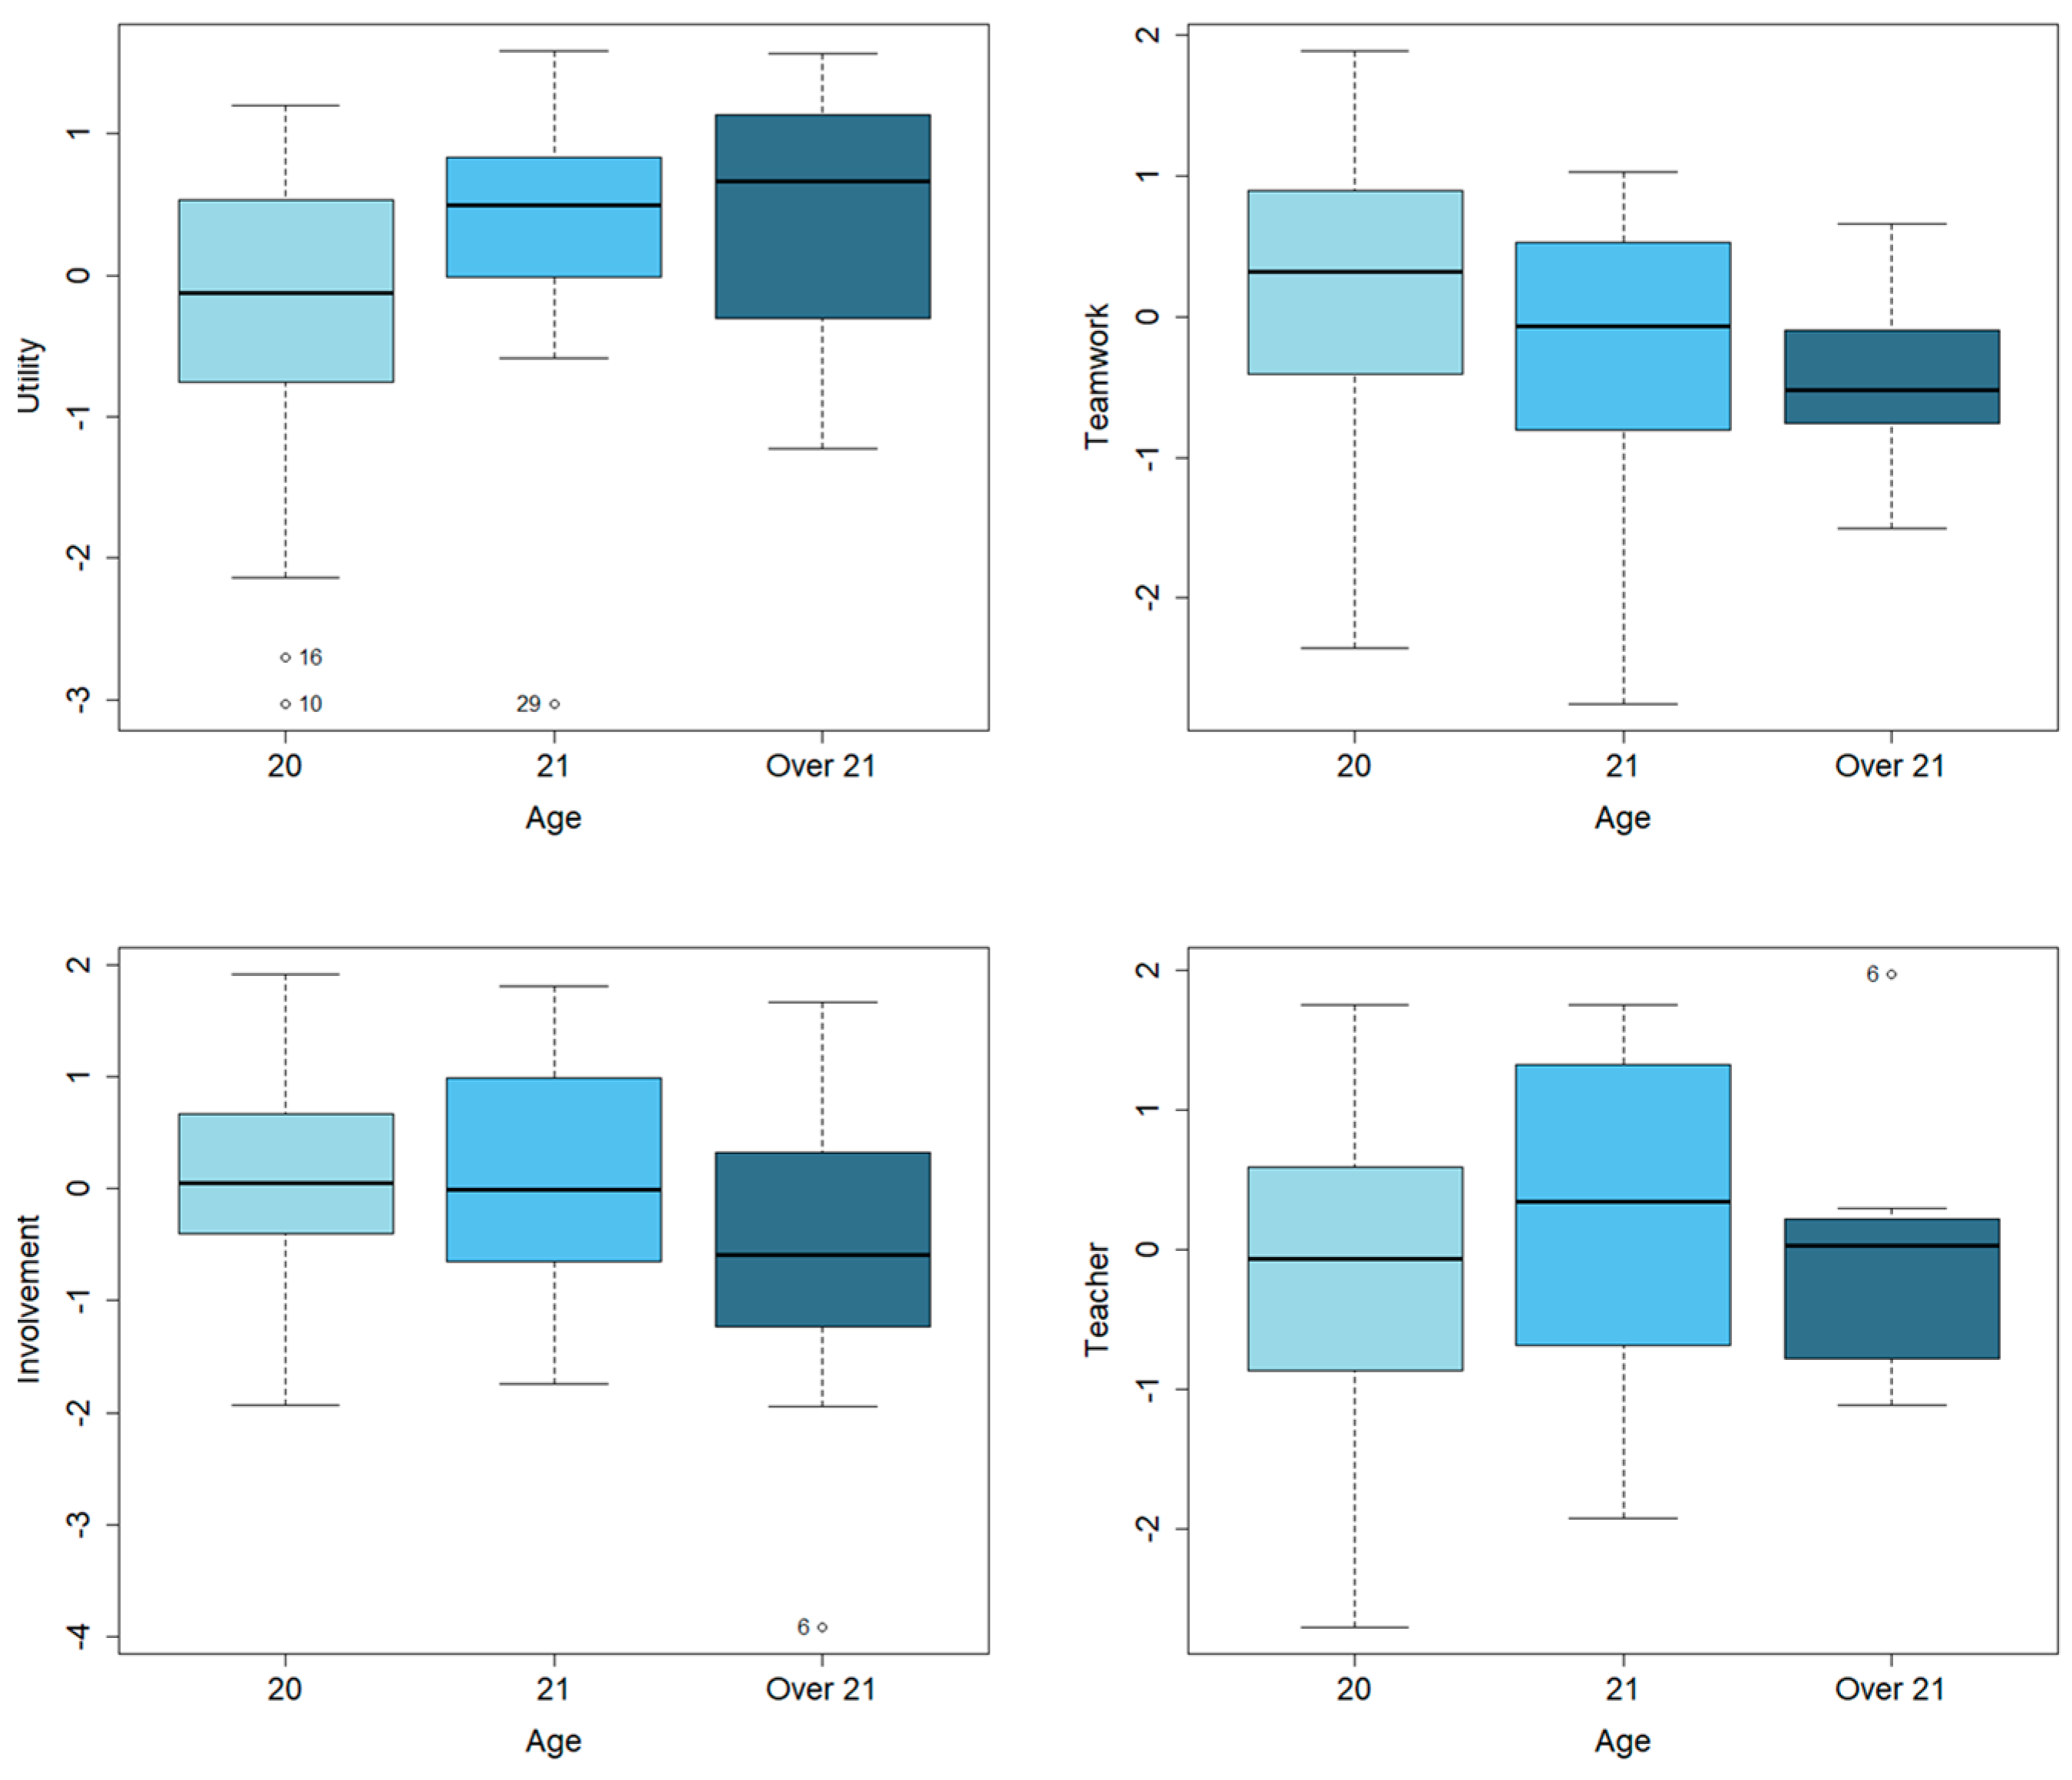
Notably, our study identified that older male students exhibited a greater appreciation for the project’s utility, indicating potential influences of age and gender on students’ perceptions. Additionally, the project’s benefits were particularly pronounced for repeating students, facilitating deeper comprehension of statistical concepts, and reinforcing our initial aim to support and motivate students facing academic challenges. Therefore, our findings underscore the significance of adapting teaching strategies to meet the diverse needs of student populations, emphasising the necessity for tailored instructional approaches that accommodate varied learning styles, ages, and genders. By prioritising adaptable teaching methods, educators can create inclusive learning environments conducive to sustainable educational practices. Future research endeavours could delve deeper into exploring the effectiveness of such strategies in enhancing student engagement across different profile groups, contributing to the ongoing discourse on innovative pedagogical practices within the realm of sustainable education and approaches.
With respect to the development of practical skills and transferable competencies in statistics (KI2), we observe that 53% of students perceived positively that the project had helped them to develop their teamwork skills (35% were neutral towards this statement). In addition, the methodology used was perceived very positively in terms of improving communication between students, as 82% felt that they had improved in this aspect. This result is consistent with the one obtained by Najah et al. [23]. The authors analysed how the implementation of PBL through lesson study impacted oral communication skills; they found that there was a 5% improvement.
Similar results were obtained in terms of statistical language improvement. Our aim was for students to understand and know how to apply the statistical concepts studied in the course by solving real problems in the field of Business Administration and Management (KI3). In total, 74% of the participants perceived how the methodology used facilitated the learning of statistical language. This result can be attributed to the tutoring that was carried out with the students. Teachers not only show students how to solve problems but also how to communicate their mathematical (statistical) thinking to peers, in a similar way to the creative process developed in [24]. In addition, the correction that the teachers carried out through the editing of the video that the students presented that was available for the whole class can justify this observed improvement.
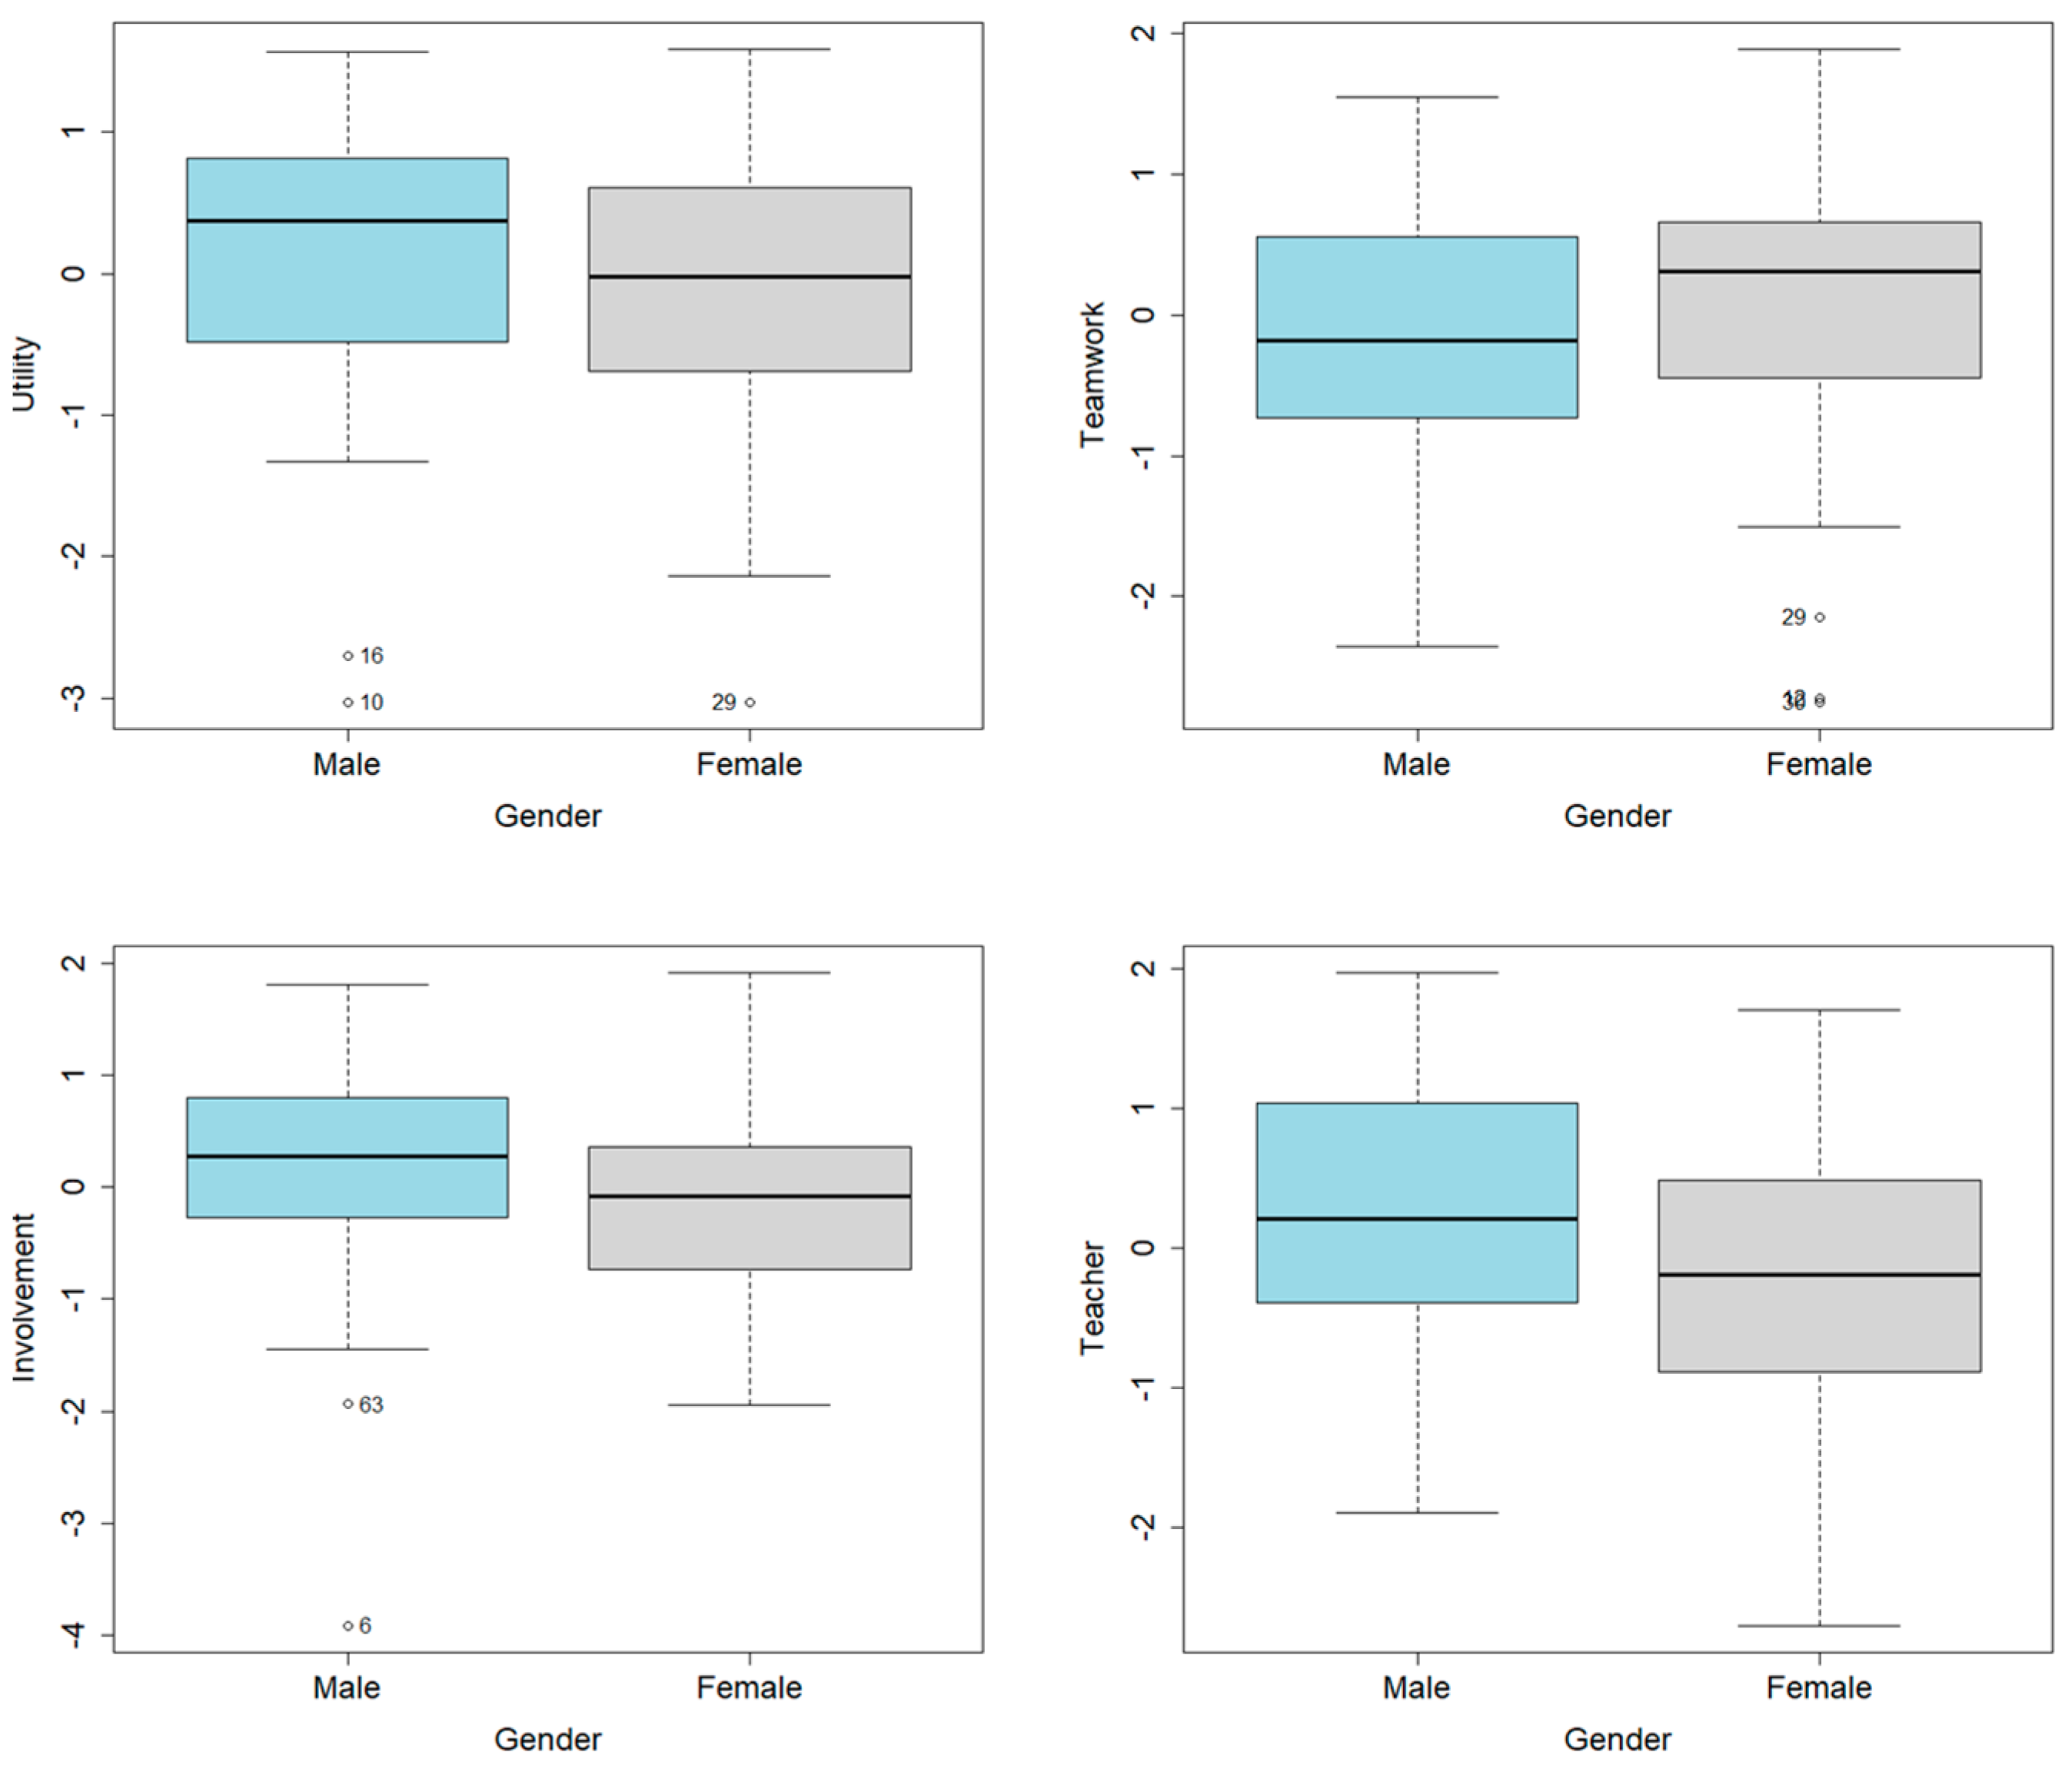
The results also highlighted a gender-based difference in terms of teamwork skills, with males exhibiting a higher level of involvement in the project. This might be linked to a potential performance gap between male and female students in Statistics II. The project’s ability to engage male students more actively suggests its effectiveness at addressing varying learning needs based on gender.
Therefore, our findings provide robust support for H2 regarding the development of practical skills and transferable competencies in statistics. Specifically, our study reveals a significant enhancement in terms of teamwork and communication skills among students engaged in PBL activities supplemented by video resources. This positive outcome underscores the efficacy of PBL in fostering the acquisition of crucial skill sets essential for success in Statistics II.
Moreover, our research highlights that the use of videos not only facilitates students’ understanding of statistical concepts but also cultivates their ability to present and explain these concepts and reports to their peers effectively. Through the process of creating and designing video content, students develop proficiency in articulating complex ideas, structuring information logically, and engaging their audience visually. This approach not only enhances students’ statistical competency but also nurtures their creativity, digital literacy, and presentation skills, which are highly valued in both academic and professional contexts.
Furthermore, the integration of statistical language within the context of problem-solving scenarios provides students with a practical understanding of how statistical concepts are applied in real-world situations. By interpreting statistical language within the framework of the specific problems they are solving, students learn to communicate effectively, using the appropriate statistical terminology to convey their analyses and findings accurately.
Our study makes a contribution in terms of offering concrete evidence of the effectiveness of integrating PBL and video resources to enhance specific competencies vital for students’ academic and professional growth in the field of statistics. By elucidating the tangible benefits of such pedagogical approaches, our research provides actionable insights for educators seeking to optimise student learning outcomes in similar courses.
Another fundamental of PBL is the promotion of peer learning through small group discussions, as argued by the developer of the methodology [25]. If we analyse the dynamics of collaboration and communication (KI4) between the students and the teacher, the results display that 89% of the participants showed smooth collaboration and communication with the teacher throughout the project. The analysis also revealed that males repeating the course tended to have higher scores in terms of communication with teachers. Effective communication between teachers and students is crucial for academic success, and the project appears to enhance this aspect, especially for male students repeating the course. In addition, it was observed that as the project progressed through the course, students became more proactive during class sessions in establishing discussion, finding solutions to the problems posed, and being more open in expressing doubts and opinions. Our results are in line with those obtained in the experiment carried out by Mirzaei et al. [26].
Therefore, our investigation strongly supports H3, demonstrating that students actively engaged in PBL activities and utilising video resources exhibit a significantly heightened propensity to apply statistical concepts in authentic business situations. This finding underscores the profound impact of PBL and video-based learning interventions in fostering practical application skills among students, bridging the gap between theoretical knowledge and real-world scenarios.
Moreover, our research delves deeper into elucidating the mechanisms through which PBL and video-based learning interventions facilitate the application of statistical concepts in real-world settings. By immersing students in experiential learning environments where they grapple with authentic business challenges, guided problem-solving activities and interactive video resources empower students to not only acquire theoretical knowledge but also develop the critical thinking skills and analytical acumen necessary for addressing complex business problems. This emphasis on practical application not only enhances students’ academic proficiency but also equips them with transferable skills essential for success in their future careers.
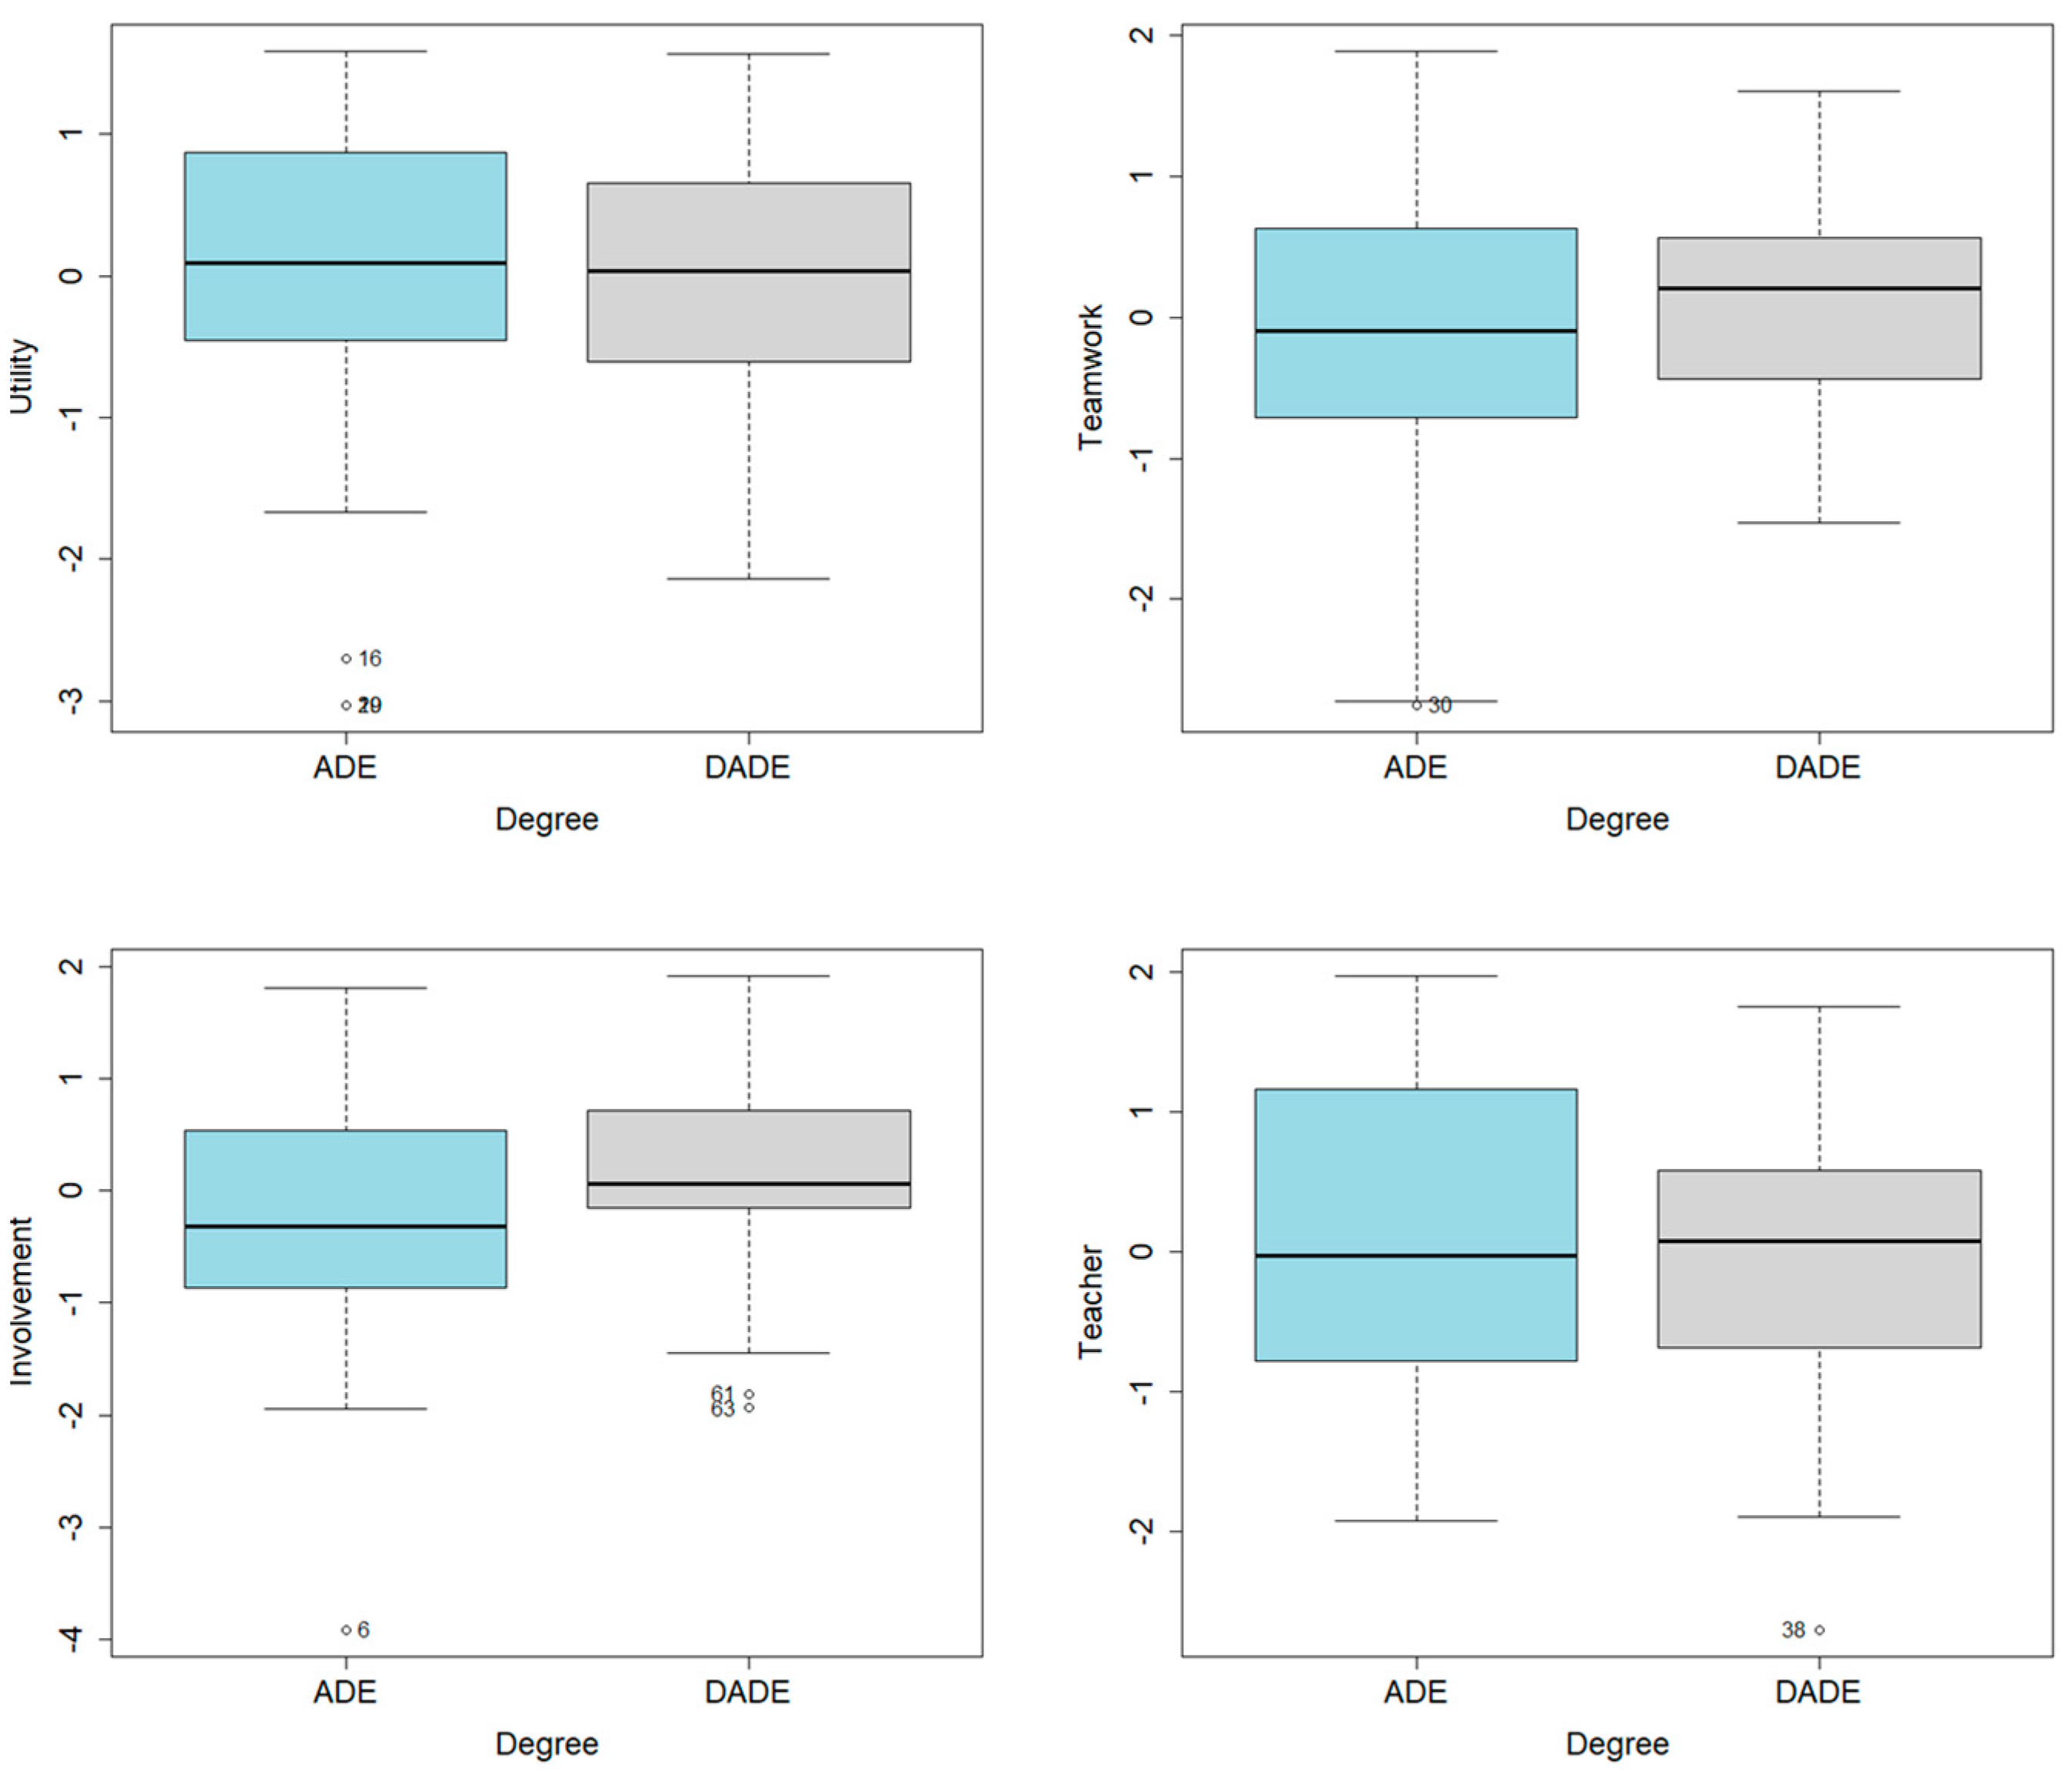
The project was voluntary in both degrees. In ADE, 54% of those enrolled had already taken the subject, while in DADE, most participants were newly enrolled (93%). Traditionally, the academic profile of the students of the two degrees is different, where DADE students tend to achieve better grades and have a more participative character. Therefore, this project has been perceived as beneficial by both groups of students, although their motivations for joining the project were different. Our study found that male students over the age of 21 enrolled in the DADE degree demonstrated higher involvement in the project. This implies that the project effectively caters to the needs and preferences of certain student demographics. The adaptability of the PBL approach to different student profiles displays its versatility and inclusivity. Student profiles and mindsets are also highlighted in the research carried out by Tan [27] as one of the factors to be taken into account when evaluating the effectiveness of the methodology.
In terms of challenges and perceived benefits (KI5), the following stand out. It was observed that skills had been improved in terms of positive feelings, e.g., people’s sense of pride in the work done (76%), and the PBL had helped to improve students’ preparation for the exam (83%). In addition, traditionally, students have had a negative perception of statistics-based courses [28]. It is important to note that we did not conduct a formal study to validate this perception. Rather, it is based on teachers’ observations and the challenges expressed by students during class sessions, as well as their feedback provided in the final evaluations of teaching staff. Nevertheless, it is essential to acknowledge that not all students participated in this survey, which limits its statistical significance; although, in our view, it does capture the primary sentiments of the students.
However, once the project was carried out, it was found that the students’ perception of the subject had changed in this respect (42%, with 34% being neutral in this regard). In addition, project-based learning has helped participants to develop their interpersonal skills, with more degree of agreement from ADE students than DADE students (51% versus 44%). This may be because in the ADE degree, the groups were formed by the teachers of the subject, whereas in DADE, the groups were formed by the students themselves, so they knew each other beforehand.
From a teacher perspective, the challenge of implementing a PBL approach is to move the role of the teacher from being a knowledge provider to a tutor as a learning manager and facilitator [29]. We observed that although these students are part of the so-called digital native generation, some of them had no previous experience with this type of methodology where video recording is necessary.
Our findings strongly support H4, indicating that the implementation of Problem-Based Learning (PBL) and the integration of video resources positively influenced the dynamics of collaboration and communication among students, as well as with their teacher. This suggests that the utilisation of PBL methodology and videos fosters smoother and more constructive interactions within the classroom, thereby contributing to the establishment of an inclusive and participatory learning environment. Notably, our study provides detailed insights into how PBL and video integration enhance collaboration and communication dynamics, offering practical strategies for promoting student engagement and facilitating teacher–student interactions in similar educational settings. Unlike the experience provided by Lewis et al. [30] where videos are created by teachers and teachers are perceived as central to learning, in our research, teachers are central to the learning process in terms of tutoring and correction, but leadership is assumed by the students themselves.
In addition, there was a great disparity in the presentation of the results, showing great creativity in communicating, which is one of the benefits more recognised in the literature [31,32]. The students had to learn to manage their time, as during the semester they had to cope with all the other activities proposed by the other subjects. It is very important to know that, for 74% of the participating students, the time invested was worthwhile. The students also worked on autonomy and their adaptation to a methodology that is not usually used in the ADE and DADE degrees. The selected problems presented a grade of difficulty similar to that of the problems solved in class and were relevant to the everyday experience of students following the recommendations outlined by Hung [33] and Schmidt et al. [34].
Our findings strongly support H5, revealing that the perceived benefits of engaging in PBL activities with the use of videos outweighed the challenges faced by students. Despite potential obstacles such as time management and adaptation to new methodologies, students positively valued their experience. What distinguishes our study is the comprehensive exploration of both the benefits and challenges associated with PBL and video integration, providing a nuanced understanding of students’ perceptions and experiences. Our research offers valuable insights for educators seeking to optimise student engagement and learning outcomes while mitigating potential challenges.

4.2. Impact on Grades

Additionally, one of the most significant findings of our study was the positive impact of the project on final grades in Statistics II. Improved academic performance is also one of the benefits reported by Tarmizi and Bayat [35] because of the implementation of the PBL. Students who participated in the project achieved significantly higher mean and median grades compared to those who did not engage in the project. This underscores the effectiveness of the PBL approach in enhancing students’ academic performance and suggests its potential to contribute to sustainable educational practices. By promoting active learning, collaboration, and real-world application of statistical concepts, PBL equips students with the skills and knowledge necessary for success in their academic endeavours and future careers.

4.3. Implications for Sustainable Future Implementation

The study’s outcomes suggest that the PBL approach is well received and beneficial for students in Statistics II. Future implementations could focus on refining aspects related to gender-based differences, age-related preferences, and degree-based differences. Tailoring the project to address these nuances could further enhance its effectiveness and inclusivity.
Exploring the integration of PBL and video resources underscores a dynamic approach to education aligned with sustainable pedagogical practices. By embracing PBL, students are immersed in active problem-solving experiences that transcend traditional didactic methods, fostering deeper understanding and long-term retention of statistical concepts. Complementing this immersive learning approach with video resources adds a multimedia dimension, offering visual and auditory reinforcement that caters to diverse learning styles and preferences. Together, these methodologies create an engaging and inclusive learning environment where students are empowered to apply theoretical knowledge to real-world scenarios, enhancing their critical thinking, problem-solving, and collaboration skills [36].
In conclusion, our study provides compelling evidence supporting the positive outcomes of the PBL approach in Statistics II. Our findings can contribute to the debate on innovative teaching methodologies in statistical education, emphasising the need for flexible and student-centric approaches to foster engagement and success.

5. Conclusions

In this investigation, our primary goal was to assess the impact of PBL enhanced by student-created videos on the instruction of Probability Calculation and Inference Statistics in the second-year Statistics II course for ADE and DADE students at the University of Zaragoza. This study involved both survey analysis and a comparative examination of final grades between students who participated in PBL and those who did not.
In summarising the key findings and their implications, it is evident that engagement in our project was associated with elevated levels of involvement, motivation, and satisfaction in comparison to traditional educational methods. The methodology received positive feedback, emphasising active involvement, encouragement of autonomy, and a deeper grasp of statistical concepts. Additionally, the project had a positive impact on the development of practical skills and transferable competencies, encompassing problem solving, critical thinking, effective communication, and the application of concepts in real business scenarios. Project participants demonstrated a superior ability to apply statistical concepts in authentic business situations, providing specific examples of applied learning transfer. Notably, improvements were observed in student interaction and communication with teachers, fostering teamwork, solution discussion, and openness to expressing doubts and opinions.
All this underscores the effectiveness of this methodology as a pedagogical approach in teaching statistics to Business Administration and Management students. Its findings provide valuable insights for educators and policymakers interested in enhancing the quality of business education. Successful implementation of the methodology not only strengthens statistical comprehension but also equips students with confidence and applicable skills to tackle challenges in the business world.
Looking forward, our research opens doors to promising avenues for further inquiry. Exploring the broader application of PBL enhanced by student-created videos in various academic domains presents an intriguing opportunity to understand its comprehensive impact. Addressing the inherent challenges in implementing this methodology provides a pathway for refining this innovative educational approach. Moreover, our study contributes to the discourse on sustainable education by highlighting the potential of PBL enhanced by student-created videos as a pedagogical approach aligned with the Sustainable Development Goals. By promoting active learning, collaborative problem solving, and effective communication, PBL fosters a culture of lifelong learning [37] and empowers students to address real-world challenges in a sustainable manner. Furthermore, a crucial next step involves assessing the lasting effects of this methodology on students’ professional trajectories. However, every exploration has its own considerations. While our study offers valuable insights, expanding the sample size could bolster the reliability of future investigations. Recognising the potential influence of external factors emphasises the need for meticulous scrutiny in subsequent research endeavours. These reflections can serve as guiding principles, prompting future researchers to navigate these intricacies with care.
In terms of future research directions, we propose exploring the application of the PBL methodology, combined with videos, across different academic degrees within the faculty. To achieve this, we plan to conduct a comprehensive study where the experience would be implemented in one group while excluding it in another, allowing us to compare the outcomes between the two groups. This will enable us to make robust claims about the effectiveness of the methodology. Furthermore, exploring gender-based differences in engagement and other student characteristics could provide valuable insights into optimising educational approaches for diverse student populations.

Author Contributions

Conceptualization, V.M., P.G., M.S. and A.T.; methodology, V.M., P.G., M.S. and A.T.; software, P.G. and M.S.; validation, V.M., P.G. and M.S.; formal analysis, M.S.; investigation, V.M. and P.G.; data curation, V.M.; writing—original draft preparation, V.M., P.G. and M.S.; writing—review and editing, V.M., P.G., M.S. and A.T.; visualization, V.M. and M.S.; supervision, P.G. and M.S.; project administration, V.M.; funding acquisition, M.S. and A.T. All authors have read and agreed to the published version of the manuscript.

Funding

This research was partially funded by the Regional Government of Aragon, under grants number S35_23R: Grupo Decisión Multicriterio Zaragoza (GDMZ) and S41_23R: Métodos Estadísticos No Paramétricos y Bayesianos sobre Datos Sesgados.

Institutional Review Board Statement

Not applicable.

Informed Consent Statement

Informed consent was obtained from all subjects involved in the study.

Data Availability Statement

The questionnaire data are available from the corresponding author upon reasonable request.

Acknowledgments

The authors are grateful for the institutional support of the Competitive Call for Innovation Projects of the University of Zaragoza (PI_DTOST) in the year 2022/2023, reference 719, and the students participating in this research.

Conflicts of Interest

The authors declare no conflicts of interest. The funders had no role in the design of the study; in the collection, analyses, or interpretation of the data; in the writing of the manuscript; or in the decision to publish the results.

Appendix A. Questionnaire Developed

Please answer the questions carefully according to the experience you have had during your participation in the project.
Section 1: General information
  • Is this your first time enrolling in the subject? ( ) Yes  ( ) No
  • Please specify your gender: ( ) Male  ( ) Female
  • Please specify your age: ( ) 20  ( ) 21  ( ) ≥22
  • Please select your degree: ( ) ADE  ( ) DADE
Section 2: PBL experience
Indicate your degree of agreement with the following statements (please mark with an X where appropriate on a scale of 1 to 5): 1—totally disagree, 2—strongly disagree, 3—neutral, 4—strongly agree, 5—totally agree (Table A1).
Table A1. Questionnaire.
12345
Q1. I prefer the project to a totally traditional course (theory/exercises solved by the teacher)
Q2. I consider Problem-Based Learning to be a suitable methodology for my training in statistics
Q3. The project has increased my interest in the course
Q4. The time invested in the project was worth it
Q5. I have fully committed to the project
Q6. I am very proud of the work done
Q7. The realization of the project has increased my motivation towards the course
Q8. The project has helped me to better assimilate the concepts and content of the course when preparing for the exam
Q9. I have used the material prepared by my classmates (videos) to prepare for the exam
Q10. Once the project was completed, my perception of the subject has changed
Q11. The teacher’s indications on how to approach the tasks were sufficient
Q12. The project has helped me to express myself rigorously using the appropriate statistical language
Q13. The project has helped me to develop my teamwork skills
Q14. The project has helped me to develop my interpersonal skills with my colleagues
Q15. There has been smooth collaboration and communication throughout the project with my colleagues
Q16. There has been fluid collaboration and communication with the teacher throughout the project

Appendix B. Descriptive Analysis

Table A2. Descriptive study of the answers to the questions.
QuestionMeanStd. Dev.MinP5P25MedianP75P95Max
Q14.040.872334555
Q24.100.6823444.7555
Q33.560.881234455
Q43.890.9312.053.254455
Q53.630.991234455
Q64.050.782344555
Q73.760.881234455
Q84.130.722344555
Q93.931.211134555
Q103.221.131133455
Q114.150.5933444.7555
Q123.980.89133.254555
Q133.481.081134455
Q143.481.111133455
Q154.231.061245555
Q164.210.781344555
Figure A1. Descriptive analysis. Bar diagrams of questions Q1 to Q16.
Sustainability 16 01591 g0a1aSustainability 16 01591 g0a1b

Appendix C. Factor Analysis

Figure A2. Corplot of the correlation matrix.
Sustainability 16 01591 g0a2
Figure A3. Matrix scatter plot of questions related to the utility factor.
Sustainability 16 01591 g0a3
Figure A4. Matrix scatter plot of questions related to the teamwork, involvement, and teacher factors.
Sustainability 16 01591 g0a4

References

  1. Neves, R.M.; Lima, R.M.; Mesquita, D. Teacher Competences for Active Learning in Engineering Education. Sustainability 2021, 13, 9231. [Google Scholar] [CrossRef]
  2. Crespi, P.; García-Ramos, J.M.; Queiruga-Dios, M. Project-Based Learning (PBL) and Its Impact on the Development of Interpersonal Competences in Higher Education. J. New Approaches Educ. Res. 2022, 11, 259–276. [Google Scholar] [CrossRef]
  3. Kovacs, P.; Kuruczleki, E.; Kazar, K.; Liptak, L.; Racz, T. Modern Teaching Methods in Action in Statistical Classes. Stat. J. IAOS 2021, 37, 899–919. [Google Scholar] [CrossRef]
  4. Gonda, D.; Pavlovičová, G.; Ďuriš, V.; Tirpáková, A. Implementation of Pedagogical Research into Statistical Courses to Develop Students’ Statistical Literacy. Mathematics 2022, 10, 1793. [Google Scholar] [CrossRef]
  5. Duch, B.J.; Groh, S.E.; Allen, D.E. Why problem-based learning? A case study of institutional change in undergraduate education. In The Power of Problem Based Learning; Duch, B.J., Groh, S.E., Allen, D.E., Eds.; Stylus: Sterling, VA, USA, 2001; pp. 3–11. [Google Scholar]
  6. Hung, W.; Jonassen, D.H.; Liu, R. Problem-based learning. In Handbook of Research on Educational Communications and Technology; Erlbaum: Mahwah, NJ, USA, 2008; Volume 3, pp. 485–506. [Google Scholar] [CrossRef]
  7. Xu, X.; Wang, Y.; Zhang, S.; Liu, F. Performance of Problem-Based Learning Based Image Teaching in Clinical Emergency Teaching. Front. Genet. 2022, 13, 931640. [Google Scholar] [CrossRef] [PubMed]
  8. Yew, E.H.J.; Goh, K. Problem-Based Learning: An Overview of its Process and Impact on Learning. Health Prof. Educ. 2016, 2, 75–79. [Google Scholar] [CrossRef]
  9. Hmelo-Silver, C.E. Problem-Based Learning: What and How Do Students Learn? Educ. Psychol. Rev. 2004, 16, 235–266. [Google Scholar] [CrossRef]
  10. Hoidn, S.; Kärkkäinen, K. Promoting Skills for Innovation in Higher Education: A Literature Review on the Effectiveness of Problem-based Learning and of Teaching Behaviours; OECD Education Working Papers, No. 100; OECD Publishing: Paris, France, 2014. [Google Scholar] [CrossRef]
  11. Michalsky, T.; Cohen, A. Prompting socially shared regulation of learning and creativity in solving STEM problems. Front. Psychol. 2021, 12, 722535. [Google Scholar] [CrossRef]
  12. Lombardi, P. Instructional Methods Strategies and Technologies to Meet the Needs of All Learners; LibreTexts: Davis, CA, USA, 2022. [Google Scholar]
  13. Reedy, A.K.; Guerrero-Farias, M.L.; Reyes, L.H.; Pradilla, D. Improving employability skills through non-placement work-integrated learning in chemical and food engineering: A case study. Educ. Chem. Eng. 2020, 33, 91–101. [Google Scholar] [CrossRef]
  14. Savery, J.R. Comparative pedagogical models of problem-based learning. In The Wiley Handbook on Problem-Based Learning; Moallem, M., Hung, W., Dabbagh, N., Eds.; John Wiley: Hoboken, NJ, USA, 2019; pp. 81–104. [Google Scholar]
  15. Smith, K.; Maynard, N.; Berry, A.; Stephenson, T.; Spiteri, T.; Corrigan, D.; Mansfield, J.; Ellerton, P.; Smith, T. Principles of Problem-Based Learning (PBL) in STEM Education: Using Expert Wisdom and Research to Frame Educational Practice. Educ. Sci. 2022, 12, 728. [Google Scholar] [CrossRef]
  16. Lonergan, R.; Cumming, T.M.; O’Neill, S.C. Exploring the efficacy of problem-based learning in diverse secondary school classrooms: Characteristics and goals of problem-based learning. Int. J. Educ. Res. 2022, 112, 101945. [Google Scholar] [CrossRef]
  17. Tishkovskaya, S.; Lancaster, G.A. Statistical Education in the 21st Century: A Review of Challenges, Teaching Innovations and Strategies for Reform. J. Stat. Educ. 2012, 20, 1–24. [Google Scholar] [CrossRef]
  18. Levine, D.M.; Stephan, D.F. Teaching Introductory Business Statistics Using the DCOVA Framework. Decis. Sci. J. Innov. Educ. 2011, 9, 395–400. [Google Scholar] [CrossRef]
  19. Barrows, H.S.; Tamblyn, R.M. Problem-Based Learning: An Approach to Medical Education; Springer: New York, USA, 1980. [Google Scholar]
  20. Schmidt, H.G. Problem-based learning: Rationale and description. Med. Educ. 1983, 17, 11–16. [Google Scholar] [CrossRef]
  21. Gavin, K. Case study of a project-based learning course in civil engineering design. Eur. J. Eng. Educ. 2011, 36, 547–558. [Google Scholar] [CrossRef]
  22. Molina-Torres, M.-P. Project-Based Learning for Teacher Training in Primary Education. Educ. Sci. 2022, 12, 647. [Google Scholar] [CrossRef]
  23. Najah, A.A.; Rohmah, A.F.; Usratussyarifah, S.H. The Implementation of Problem Based Learning (PBL) Model Improving Student’s Oral Communication Skillthrough Lesson Study. J. Phys. Conf. Ser. 2019, 1227, 012004. [Google Scholar] [CrossRef]
  24. Huang, M.C.-L.; Chou, C.-Y.; Wu, Y.T.; Shih, J.-L.; Yeh, C.Y.C.; Lao, A.C.C.; Fong, H.; Lin, Y.-F.; Chan, T.-W. Interest-driven video creation for learning mathematics. J. Comput. Educ. 2020, 7, 395–433. [Google Scholar] [CrossRef]
  25. Barrows, H.S. The Tutorial Process; Southern Illinois University School of Medicine: Springfield, IL, USA, 1992. [Google Scholar]
  26. Mirzaei, F.; Phang, F.A.; Kashefi, H. Measuring Teachers Reflective Thinking Skills. Procedia Soc. Behav. Sci. 2014, 141, 640–647. [Google Scholar] [CrossRef]
  27. Tan, O.-S. Problem-Based Learning Innovation: Using Problems to Power Learning in the 21st Century; Thomson: Singapore, 2003. [Google Scholar]
  28. Peiró-Signes, Á.; Trull, O.; Segarra-Oña, M.; García-Díaz, J.C. Anxiety towards Statistics and Its Relationship with Students’ Attitudes and Learning Approach. Behav. Sci. 2021, 11, 32. [Google Scholar] [CrossRef]
  29. Rézio, S.; Andrade, M.P.; Teodoro, M.F. Problem-Based Learning and Applied Mathematics. Mathematics 2022, 10, 2862. [Google Scholar] [CrossRef]
  30. Lewis, N.; Lewis, R.; Luca, C. Impact of video-based learning in business statistics: A longitudinal study. Humanit. Soc. Sci. Commun. 2023, 10, 146. [Google Scholar] [CrossRef]
  31. Mursid, R.; Saragih, A.H.; Hartono, R. The effect of the blended project-based learning model and creative thinking ability on engineering students learning outcomes. Int. J. Educ. Math. Sci. Technol. 2022, 10, 218–235. [Google Scholar] [CrossRef]
  32. Sattarova, U.; Groot, W.; Arsenijevic, J. Student and Tutor Satisfaction with Problem-Based Learning in Azerbaijan. Educ. Sci. 2021, 11, 288. [Google Scholar] [CrossRef]
  33. Hung, W. The 3C3R model: A conceptual framework for designing problems in PBL. Interdiscip. J. Prob. Based Learn. 2006, 1, 55–77. [Google Scholar] [CrossRef]
  34. Schmidt, H.G.; Rotgans, J.I.; Yew, E.H. The process of problem-based learning: What works and why. Med. Educ. 2011, 45, 792–806. [Google Scholar] [CrossRef]
  35. Tarmizi, R.A.; Bayat, S. Effects of Problem-based Learning Approach in Learning of Statistics among University Students. Procedia Soc. Behav. Sci. 2010, 8, 384–392. [Google Scholar] [CrossRef]
  36. Tiwari, R.; Arya, R.; Bansal, M. Motivating students for project-based learning for application of research methodology skills. Int. J. Appl. Basic. Med. Res. 2017, 7, 4–7. [Google Scholar] [CrossRef]
  37. Sohmen, V.S. Project-based learning (PBL) in a higher education project: Introduction of an accelerated PBL (A-PBL) model. In Handbook of Research on Adult Learning in Higher Education; Okojie, M.C.P.O., Boulder, T.C., Eds.; IGI Global: Hershey, PA, USA, 2020; pp. 118–150. [Google Scholar]
Figure 1. Boxplots of the factor scores according to first enrolment.
Sustainability 16 01591 g001
Figure 2. Boxplots of the factor scores according to gender.
Sustainability 16 01591 g002
Figure 3. Boxplots of the factor scores according to age.
Sustainability 16 01591 g003
Figure 4. Boxplots of the factor scores according to degree.
Sustainability 16 01591 g004
Figure 5. Group profiles.
Sustainability 16 01591 g005
Table 1. Adequacy of the factor analysis.
Bartlett’s Statistic576.88DF120p-Value0.0000
KMO0.81------
Q1Q2Q3Q4Q5Q6Q7Q8
0.820.910.840.850.700.780.870.89
Q9Q10Q11Q12Q13Q14Q15Q16
0.840.870.670.900.710.720.750.64
Note: Q1 (Pref. PBL); Q2 (Suitability PBL); Q3 (PBL increased my interest); Q4 (Invested time is worthwhile); Q5 (Totally involved); Q6 (Very proud of the result); Q7 (PBL increased my motivation); Q8 (PBL enhanced my exam prep); Q9 (Use classmate videos); Q10 (PBL changed my perception); Q11 (Teacher’s instructions sufficient); Q12 (PBL improved statistical language); Q13 (PBL develops teamwork skills); Q14 (PBL develops interpersonal skills); Q15 (PBL collab. and comm. classmates); Q16 (PBL collab. and comm. teachers).
Table 2. Results of the factor analysis (excluding factor loadings below 0.5).
QuestionsUtility Teamwork Involvement TeacherCommunalitySpecificity
Q10.7253 0.55020.4498
Q20.7096 0.55210.4479
Q70.6998 0.74220.2578
Q80.6826 0.58270.4173
Q30.6538 0.75710.2429
Q40.6443 0.56770.4323
Q90.6247 0.43140.5686
Q100.5527 0.49080.5092
Q120.5469 0.64070.3593
Q13 0.8780 0.82000.1800
Q14 0.8661 0.80630.1937
Q15 0.5688 0.52900.4710
Q5 0.8325 0.71270.2873
Q6 0.7431 0.64870.3513
Q16 0.79340.74660.2534
Q11 0.71900.64380.3562
Utility Teamwork Involvement Teacher
SS loadings4.05712.70021.78741.6775
Proportion Var0.25360.16880.11170.1048
Cumulative Var0.25360.42230.53400.6389
Table 3. Comparative study of the factor scores based on first enrolment (5% significant differences highlighted in bold).
MeansMedians
FactorNoYest p-ValueNoYesKWp-Value
Utility0.45−0.183.120.000.46−0.096.850.01
Teamwork −0.200.08−1,190.24−0.140.211.240.26
Involvement−0.180.07−0.910.37−0.120.050.460.50
Teacher0.39−0.152.240.030.21−0.154.680.03
Table 4. Comparative study of the factor scores based on gender (5% significant differences highlighted in bold).
MeansMedians
FactorMaleFemalet p-ValueMaleFemaleKWp-Value
Utility0.09−0.070.700.490.37−0.020.900.34
Teamwork −0.090.07−0.750.46−0.180.311.480.22
Involvement0.13−0.101.010.320.28−0.093.210.07
Teacher0.26−0.212.170.030.21−0.194.170.04
Table 5. Comparative study of the factor scores based on age (5% significant differences highlighted in bold).
MeansMedians
Factor2021Over 21Fp-Value2021Over 21KWp-Value
Utility−0.200.320.403.030.07−0.130.500.677.720.02
Teamwork 0.21−0.33−0.454.440.020.32−0.07−0.526.600.04
Involvement0.090.09−0.630.980.390.05−0.00−0.592.230.33
Teacher−0.110.30−0.051.070.36−0.070.340.022.530.28
Table 6. Comparative study of the factor scores based on degree.
MeansMedians
FactorADEDADEt p-ValueADEDADEKWp-Value
Utility−0.050.05−0.430.670.090.030.020.89
Teamwork −0.180.15−1.410.17−0.090.210.850.36
Involvement−0.170.14−1.360.18−0.320.062.070.15
Teacher0.10−0.09−0.840.40−0.030.070.330.57
Table 7. Selected regression models for each factor (signaled in bold are the 10% significant coefficients).
Utility Teamwork Involvement Teachers
EstimateStd
Error
p-Value Estimate Std
Error
p-ValueEstimateStd
Error
p-Value Estimate Std
Error
p-Value
(Intercept)−0.81810.26280.0026−0.28530.22890.2166−0.52600.48560.28220.72220.24810.0047
Age211.10270.32210.0010 0.80420.49090.1056
AgeOver211.72220.43220.0002 −0.54050.45000.2335−0.40220.33960.2399
DegreeDADE 0.44180.32380.1766
GenderFemale 2.45640.76330.0019−0.53880.28630.0637−0.47040.21710.0333
First_EnrolmentYes 0.74660.45100.1020−0.56880.24390.0223
Age21*DegreeDADE
AgeOver21*DegreeDADE −0.71930.70570.31141.50620.79220.0611
Age21*GenderFemale −2.29700.68060.0012
AgeOver21*GenderFemale−1.66680.62640.0095−1.87580.68930.0081
DegreeDADE*GenderWoman −0.96490.50990.06240.39160.33520.2464
DegreeDADE*First_EnrolmentYes0.78110.29260.0093
GenderWoman*First_EnrolmentYes −1.42170.61860.0244
Residual Standard Error0.9077 0.9440 0.9556 0.9553
Adjusted R20.1761 0.1089 0.0868 0.0873
Fstatistic5.3290p-value0.00082.4150p-value0.027822840p-value0.04453.5830p-value0.0175
Note: Blanks are variables that were not include in the best model according to the adjusted R2 criterion. The best model was determined using an exhaustive search method implemented in the program regsubset of the R library leaps.
Table 8. Comparison of Groups 1 and 2 regarding student characteristics.
Group 1Group 2Chi Squarep-Value
First EnrolmentNo14.30%38.30%5.730.0167
Yes85.70%61.70%
GenderMale37.10%48.90%1.130.2872
Female62.90%51.10%
AgeLess2171.40%57.40%3.390.1833
2114.30%31.90%
Over2114.30%10.60%
DegreeADE45.70%44.70%0.010.9258
DADE54.30%55.30%
Table 9. Final grades in Statistics II based on participation in the project.
Participation in the ProjectnMeanStdMinMaxt MedianWilcoxon
No434.751.691.118.50−2.355.001692.50
Yes1065.481.760.008.75p-value5.81p-value
All1495.271.760.008.750.02005.330.0141
Table 10. Regression model of Statistics II grades based on student characteristics.
EstimateStd. Errorp-Value
Intercept4.02230.56400.0000
Female−1.97330.86450.0240
ProjectYes2.45050.86090.0051
FirstCallNo1.22000.61510.0494
DADE1.99140.96750.0415
Female*ProjectYes0.88070.70190.2117
Female*Age21−0.93280.73280.2052
Female*FistCallNo1.46230.70680.0405
Female*DADE0.75400.71070.2906
Age21*ProjectYes1.28010.63560.0460
FirstCallNo*ProjectYes−2.94330.90730.0015
ProjectYes*DADE−2.21330.80620.0069
Age21*DADE−1.86820.90430.0408
FirstCallNo*DADE−1.86030.78290.0189
Residual Standard Error1.5340--
Adjusted R-squared0.2426--
F-statistic:4.6460p-value0.0000
Disclaimer/Publisher’s Note: The statements, opinions and data contained in all publications are solely those of the individual author(s) and contributor(s) and not of MDPI and/or the editor(s). MDPI and/or the editor(s) disclaim responsibility for any injury to people or property resulting from any ideas, methods, instructions or products referred to in the content.

