Article

Regional Disparities in Safe and Clean Environments in Uzbekistan: Analysis of 2021–2022 Uzbekistan Multiple Indicator Cluster Survey Data

1
Department of Public Health, Graduate School, Korea University, 73 Goryeodae-ro, Seongbuk-gu, Seoul 02841, Republic of Korea
2
Institute for Environmental Health, Korea University, 73 Goryeodae-ro, Seongbuk-gu, Seoul 02841, Republic of Korea
3
Department of Preventive Medicine, College of Medicine, Korea University, 73 Goryeodae-ro, Seong-buk-gu, Seoul 02841, Republic of Korea
*
Author to whom correspondence should be addressed.
Sustainability 2024, 16(4), 1580; https://doi.org/10.3390/su16041580
Submission received: 25 December 2023 / Revised: 8 February 2024 / Accepted: 10 February 2024 / Published: 13 February 2024

Abstract

:
Background: Water, sanitation, and hygiene (WASH) services and clean fuels are representative factors of a clean and safe residential environment. Uzbekistan faces environmental issues and ranks low among countries on the Environmental Performance Index. This study aimed to identify regional disparities and wealth inequalities in WASH services and clean fuels in Uzbekistan. Methods: We employed raw data from the 2021–2022 Uzbekistan Multiple Indicator Cluster Survey (MICS) and the WASH and clean fuels coverage were analyzed. For each of the variables with the lowest coverage within WASH services and clean fuels variables, we evaluated the disparities between urban and rural areas and calculated the concentration index (CI). Results: Among WASH services and clean fuels, basic handwashing and clean fuels for space heating demonstrated the lowest coverage. In most regions, urban areas had higher coverage of basic handwashing and clean fuels for space heating compared to rural areas. The CI of clean fuels for space heating was 0.2141 or higher in five areas. The CI was notably high in areas with low coverage of WASH services and clean fuel for space heating. Conclusions: Basic handwashing and clean fuels for space heating showed varied regional coverage patterns and wealth-related inequalities. The results of this study can provide evidence for policy formulation, particularly in addressing disparities.

1. Introduction

A clean residential environment improves quality of life and is directly or indirectly related to achieving Sustainable Development Goals (SDGs), such as SDG 6 for clean water and sanitation, and SDG 7 for affordable and clean energy. Water, sanitation, and hygiene (WASH) services and clean air are important factors affecting public health. WASH services are effective in preventing the transmission of infectious diseases [1], as demonstrated during the COVID-19 pandemic [2,3]. The risk of stroke and ischemic heart disease increases when breathing polluted air [4]. Using unclean fuels for cooking or space heating at home causes indoor air pollution, affecting the health of women performing household chores and older adults who spend a significant amount of time at home [5].
Uzbekistan faces many environmental issues, including inadequate WASH services and high levels of air pollution [6]. In the 2022 Environmental Performance Index, Uzbekistan ranked 107th out of 180 countries, with a 10 year change of 1.90, which was below the average [7]. Uzbekistan’s clean drinking water coverage is higher than that of sub-Saharan African countries, but it is lower than that of Europe and Central Asia, excluding high-income countries [8]. Moreover, Uzbekistan’s water and sanitation system was established during the Soviet era and requires improvement because its quality has declined [9]. There are regional disparities in the coverage and quality of drinking water services in Uzbekistan [6].
In the case of air pollution in Uzbekistan, it has become a major environmental issue and ranks among the top 10 risk factors for mortality [10]. The average PM 2.5 concentration in Uzbekistan in 2022 was 6.7 times higher than the annual air quality guideline of the World Health Organization [11]. The prevalence of dust storms, with dust particles from dried parts in the Aral Sea, and the use of heating fuels, contribute to the high levels of air pollution [6]. Heating buildings accounts for more than 50% of energy consumption, due to the high proportion of low-rise buildings and large household sizes in Uzbekistan [12]. According to IQAir data in 2019, the PM 2.5 pollution level in Tashkent city was 36 μg/m³ in June and 75.5 μg/m³ in November. Given that pollution levels are twice as high in winter, there is a possibility that air pollution results from using unclean fuels for heating [11]. The air quality in rural areas is deteriorating due to the excessive use of agricultural chemicals, but the regional capacity to enforce the legislation regarding air quality is limited [9].
Previous studies on the environment and health in Uzbekistan have focused on the Republic of Karakalpakstan [13] and the Tashkent region [14]. Research on the psychosocial health of residents in the Republic of Karakalpakstan demonstrated that the shrinking of the Aral Sea was perceived to contribute to physical symptoms and negative health effects [13]. According to a study in the Tashkent region, poor sanitation practices were identified as significant predictors of waterborne disease [14]. Research has been conducted on the influence of proximity to industrial areas on congenital diseases, infant mortality, and lung cancer in certain regions. However, this research has limitations in that the analysis is restricted to communities rather than regions [15]. Thus, there is no nationwide comparative study on the environment and health in Uzbekistan.
Inequalities have been a significant issue in the health sector, with poorer individuals tending to experience higher mortality and morbidity compared to their wealthier counterparts. The concentration index (CI) is used to compare how socioeconomic inequalities vary across health-related variables [16]. The growth of the gross domestic product in Uzbekistan has played a role in reducing the poverty rate to 12.5% of the total population in 2016 [5], but wealth inequality has remained unchanged since 1995 [17]. While there are existing case studies of child and adult mortality by wealth in Uzbekistan [18] and the economic determinants of child nutrition factors in Uzbekistan [19], no research has been conducted on the impact of wealth inequality on clean and safe environments in Uzbekistan. Therefore, there is a need to analyze regional disparities in coverage and wealth inequality in Uzbekistan regarding WASH services and clean fuels for cooking, lighting and space heating.
This study aimed to examine the coverage of WASH services and clean fuels in Uzbekistan at a regional level using the most recent nationally representative survey. We analyzed whether there are differences in coverage by area (urban/rural) and inequalities by household wealth index for the variables with the lowest coverage among the WASH and clean fuel variables. Analyzing the status of WASH services, as well as clean fuels, and examining inequalities in access, can provide a comprehensive understanding of the current situation in Uzbekistan and insights to inform evidence-based policy formulation.

2. Materials and Methods

2.1. Data Source and Sample Selection

We analyzed raw data from the 2021–2022 Uzbekistan Multiple Indicator Cluster Survey (MICS). This is a nationwide household survey focusing on the well-being of children and women, and MICS data is publicly available on their website. The 2021–2022 Uzbekistan MICS was conducted by the State Committee of the Republic of Uzbekistan on Statistics, with technical support from the United Nations Children’s Fund.
The sampling strategy for the 2020–2021 Uzbekistan MICS was designed using a stratified three-stage sample design. In the first stage, 726 mahallas, which are part of autonomous districts, cities, or towns in Uzbekistan, were randomly selected as primary sampling units. Each mahalla was divided into segments of 80–120 households, with 20 households randomly sampled from each segment.
Owing to factors affecting survey quality, including the COVID-19 pandemic, the Uzbekistan MICS was conducted over two rounds, with the second round following the same stratification and clustering procedure as the first round. For the second round, the sampling design approach involved visiting the same clusters in which at least eight out of 20 households had completed the interview in the first round. The eight households that were not selected in the first round were selected systematically [20]. As only the second round included household information, this study was conducted on 4166 of the 4180 households that completed the interview in the second round (unweighted count = 4161).

2.2. Definition of Variables

The variables of interest in this study are WASH services and clean fuels. WASH services and clean fuels were defined and classified according to the standards set by the JMP (Joint Monitoring Program) and the MICS, respectively. Owing to the presence of missing values, the definition of limited services in the SDGs service ladder was applied to drinking water services, and the definition of basic services was applied to sanitation and handwashing. Improved drinking water services included piped water, tube well or borehole, protected dug well, protected spring, rainwater, and packaged or delivered water. Unprotected dug well, unprotected spring, surface water, and others were classified as unimproved drinking water services. Improved sanitation facilities refer to using improved facilities not shared with other households. Improved sanitation facilities include flush or pour facilities connected to piped sewerage systems, septic tanks, pit latrines, or unknown places; ventilated improved pit latrines; composting toilets; or pit latrines with slabs. Flush/pour to an open drain, pit latrines without a slab/open pit, buckets, hanging toilets/hanging latrines, and others were classified as unimproved. Handwashing facilities with water and soap indicate the availability of handwashing facilities with soap and water on the premises [21]. In the 2021–2022 Uzbekistan MICS, a handwashing facility in a dwelling, yard, or plot is considered to be a handwashing facility on the premises, serving as a valid proxy for water available at the handwashing facility [20].
Clean fuels and cooking technologies include electric stoves, solar cookers, liquefied petroleum gas (LPG)/cooking gas stoves, piped natural gas stoves, biogas stoves, or liquid fuel stoves that use alcohol/ethanol. Liquid fuel stoves not using alcohol/ethanol, manufactured solid fuel stoves, traditional solid fuel stoves, three stone stoves/open fires, or others were classified as other fuels for cooking. Households that used clean fuels for lighting included those that used electricity, solar lanterns, rechargeable or battery-powered flashlights, torches or lanterns, or biogas lamps. Polluting fuels used for lighting include kerosene or paraffin lamps, candles, or others. Clean fuels for space heating refer to either central heating in a household or specific energy sources for heaters, such as solar air heaters, electricity, piped natural gas, LPG/cooking gas, biogas, or alcohol/ethanol. On the contrary, using coal/lignite, charcoal, wood, crop residue/grass/straw/shrubs, animal dung/waste, garbage/plastic, sawdust, or other materials is classified as using polluting fuels for space heating.

2.3. Method of Inequality Analysis

The WASH services and clean fuels coverage were determined by calculating their percentages. Uzbekistan was divided into one independent city (Tashkent City), 12 regions, and one autonomous republic (Republic of Karakalpakstan) and compared by region. Additional analyses were conducted for each variable with the lowest coverage among WASH services and clean fuels to examine the differences between urban and rural areas.
This study measured wealth-based inequality in access to basic handwashing and clean fuels for space heating, using both simple and complex measures of inequality. The ratio of the richest to the poorest was used as a simple measure. The CI served as a com-plex measure to assess the degree of wealth-based inequality. CI analysis for each variable with the lowest coverage among WASH services and clean fuels was conducted because high coverage poses constraints in measuring regional differences in wealth inequality [22]. The CI analysis applies the Lorentz curve and Gini coefficient calculation method to indicators related to health status or access to health services. The formula for calculating the CI is as follows:
CI = (p1L2 − p2L1) + (p2L3 − p3L2) + … + (pT −1 LT − pT LT − 1)
where pt is the cumulative proportion of households ranked by wealth index in group t, Lt is the cumulative proportion of handwashing facilities and clean fuels for space heating, and T is the total number of groups by wealth index [16].
The maximum values of CI range from −1 to +1. Theoretically, if inequality does not exist the value of CI is 0. A value of −1 indicates the concentration in economically disadvantaged and low-income groups, whereas +1 denotes the opposite case. A value between 0.2 and 0.3 is considered to indicate a high level of relative inequality [22].
This study utilizes a relative measure of the wealth index of the MICS. As a composite indicator of wealth, the wealth index in the 2021–2022 Uzbekistan MICS was constructed using principal component analysis of information on household assets, goods, and living conditions such as water and sanitation facilities and housing construction. Households were then divided into five equal groups ranging from the poorest to the richest.
Calculating the CI and visualizing the concentration curve were performed using Microsoft Excel [16]. Data were weighted using the sample weights applied to the Uzbekistan MICS. All statistical analyses were performed using the IBM Statistical Package for Social Sciences version 22.0. We used the ArcGIS software V.10.8. to visualize maps indicating geographic variations.

3. Results

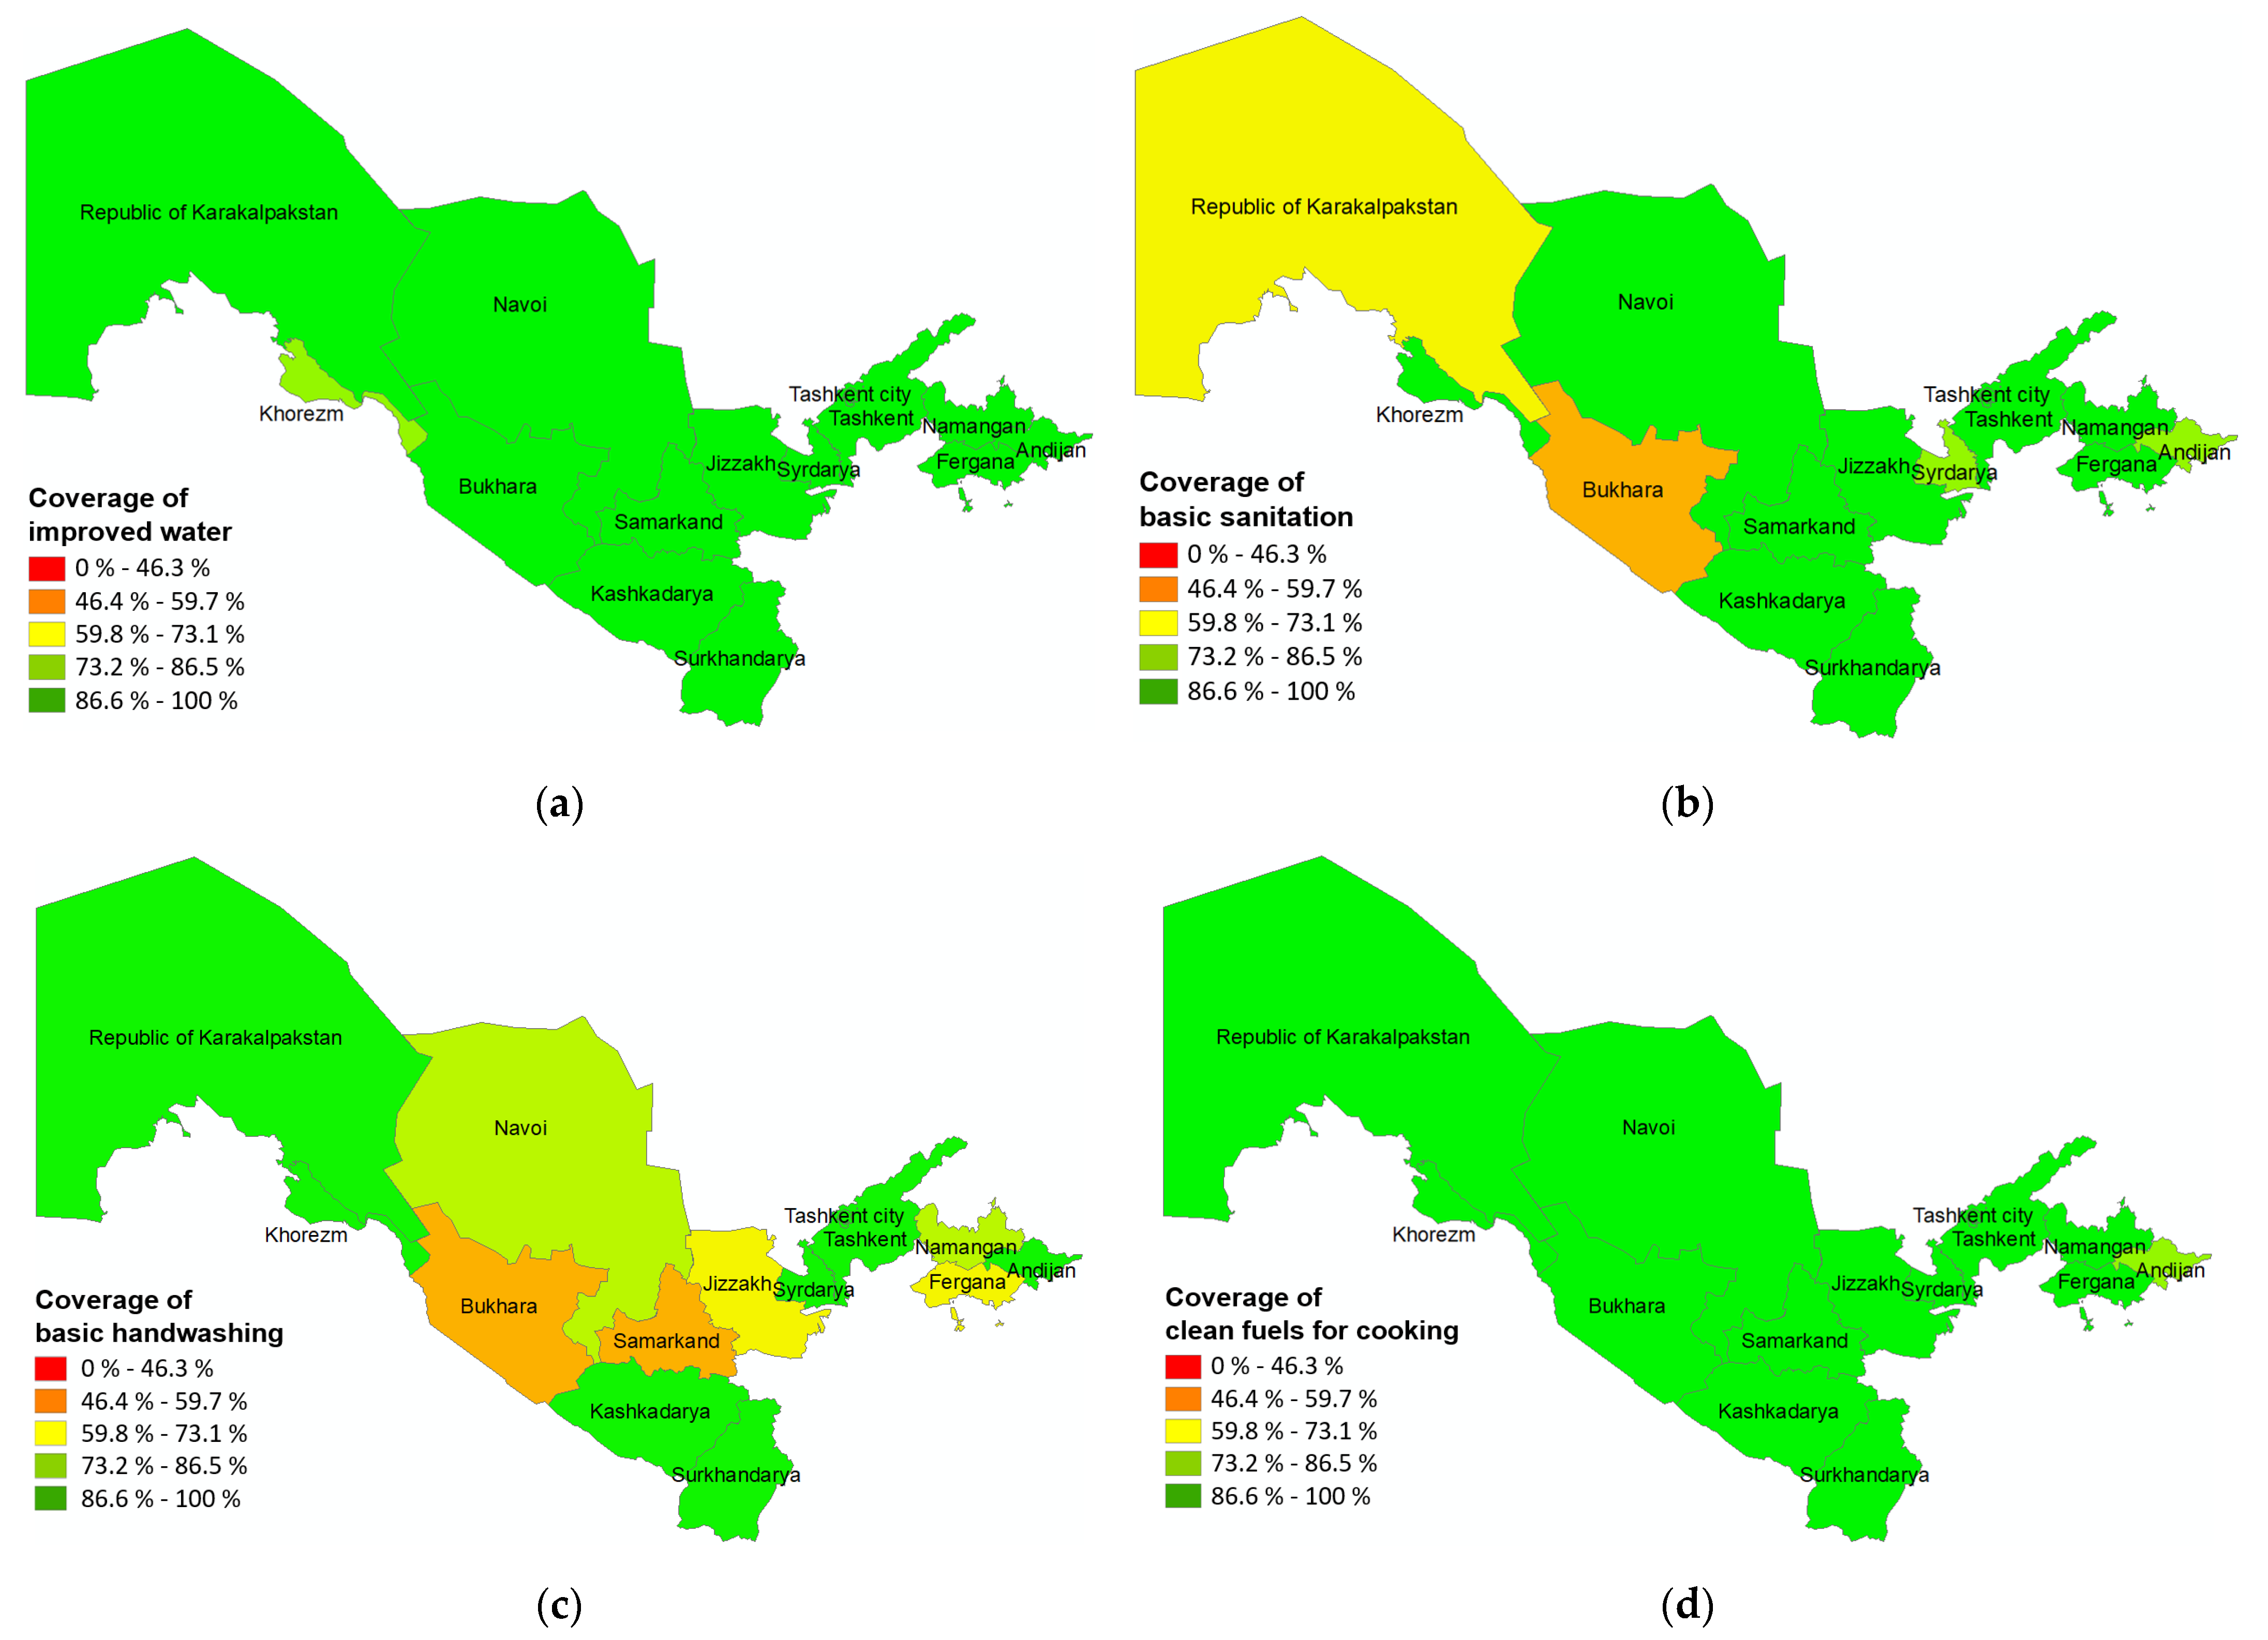
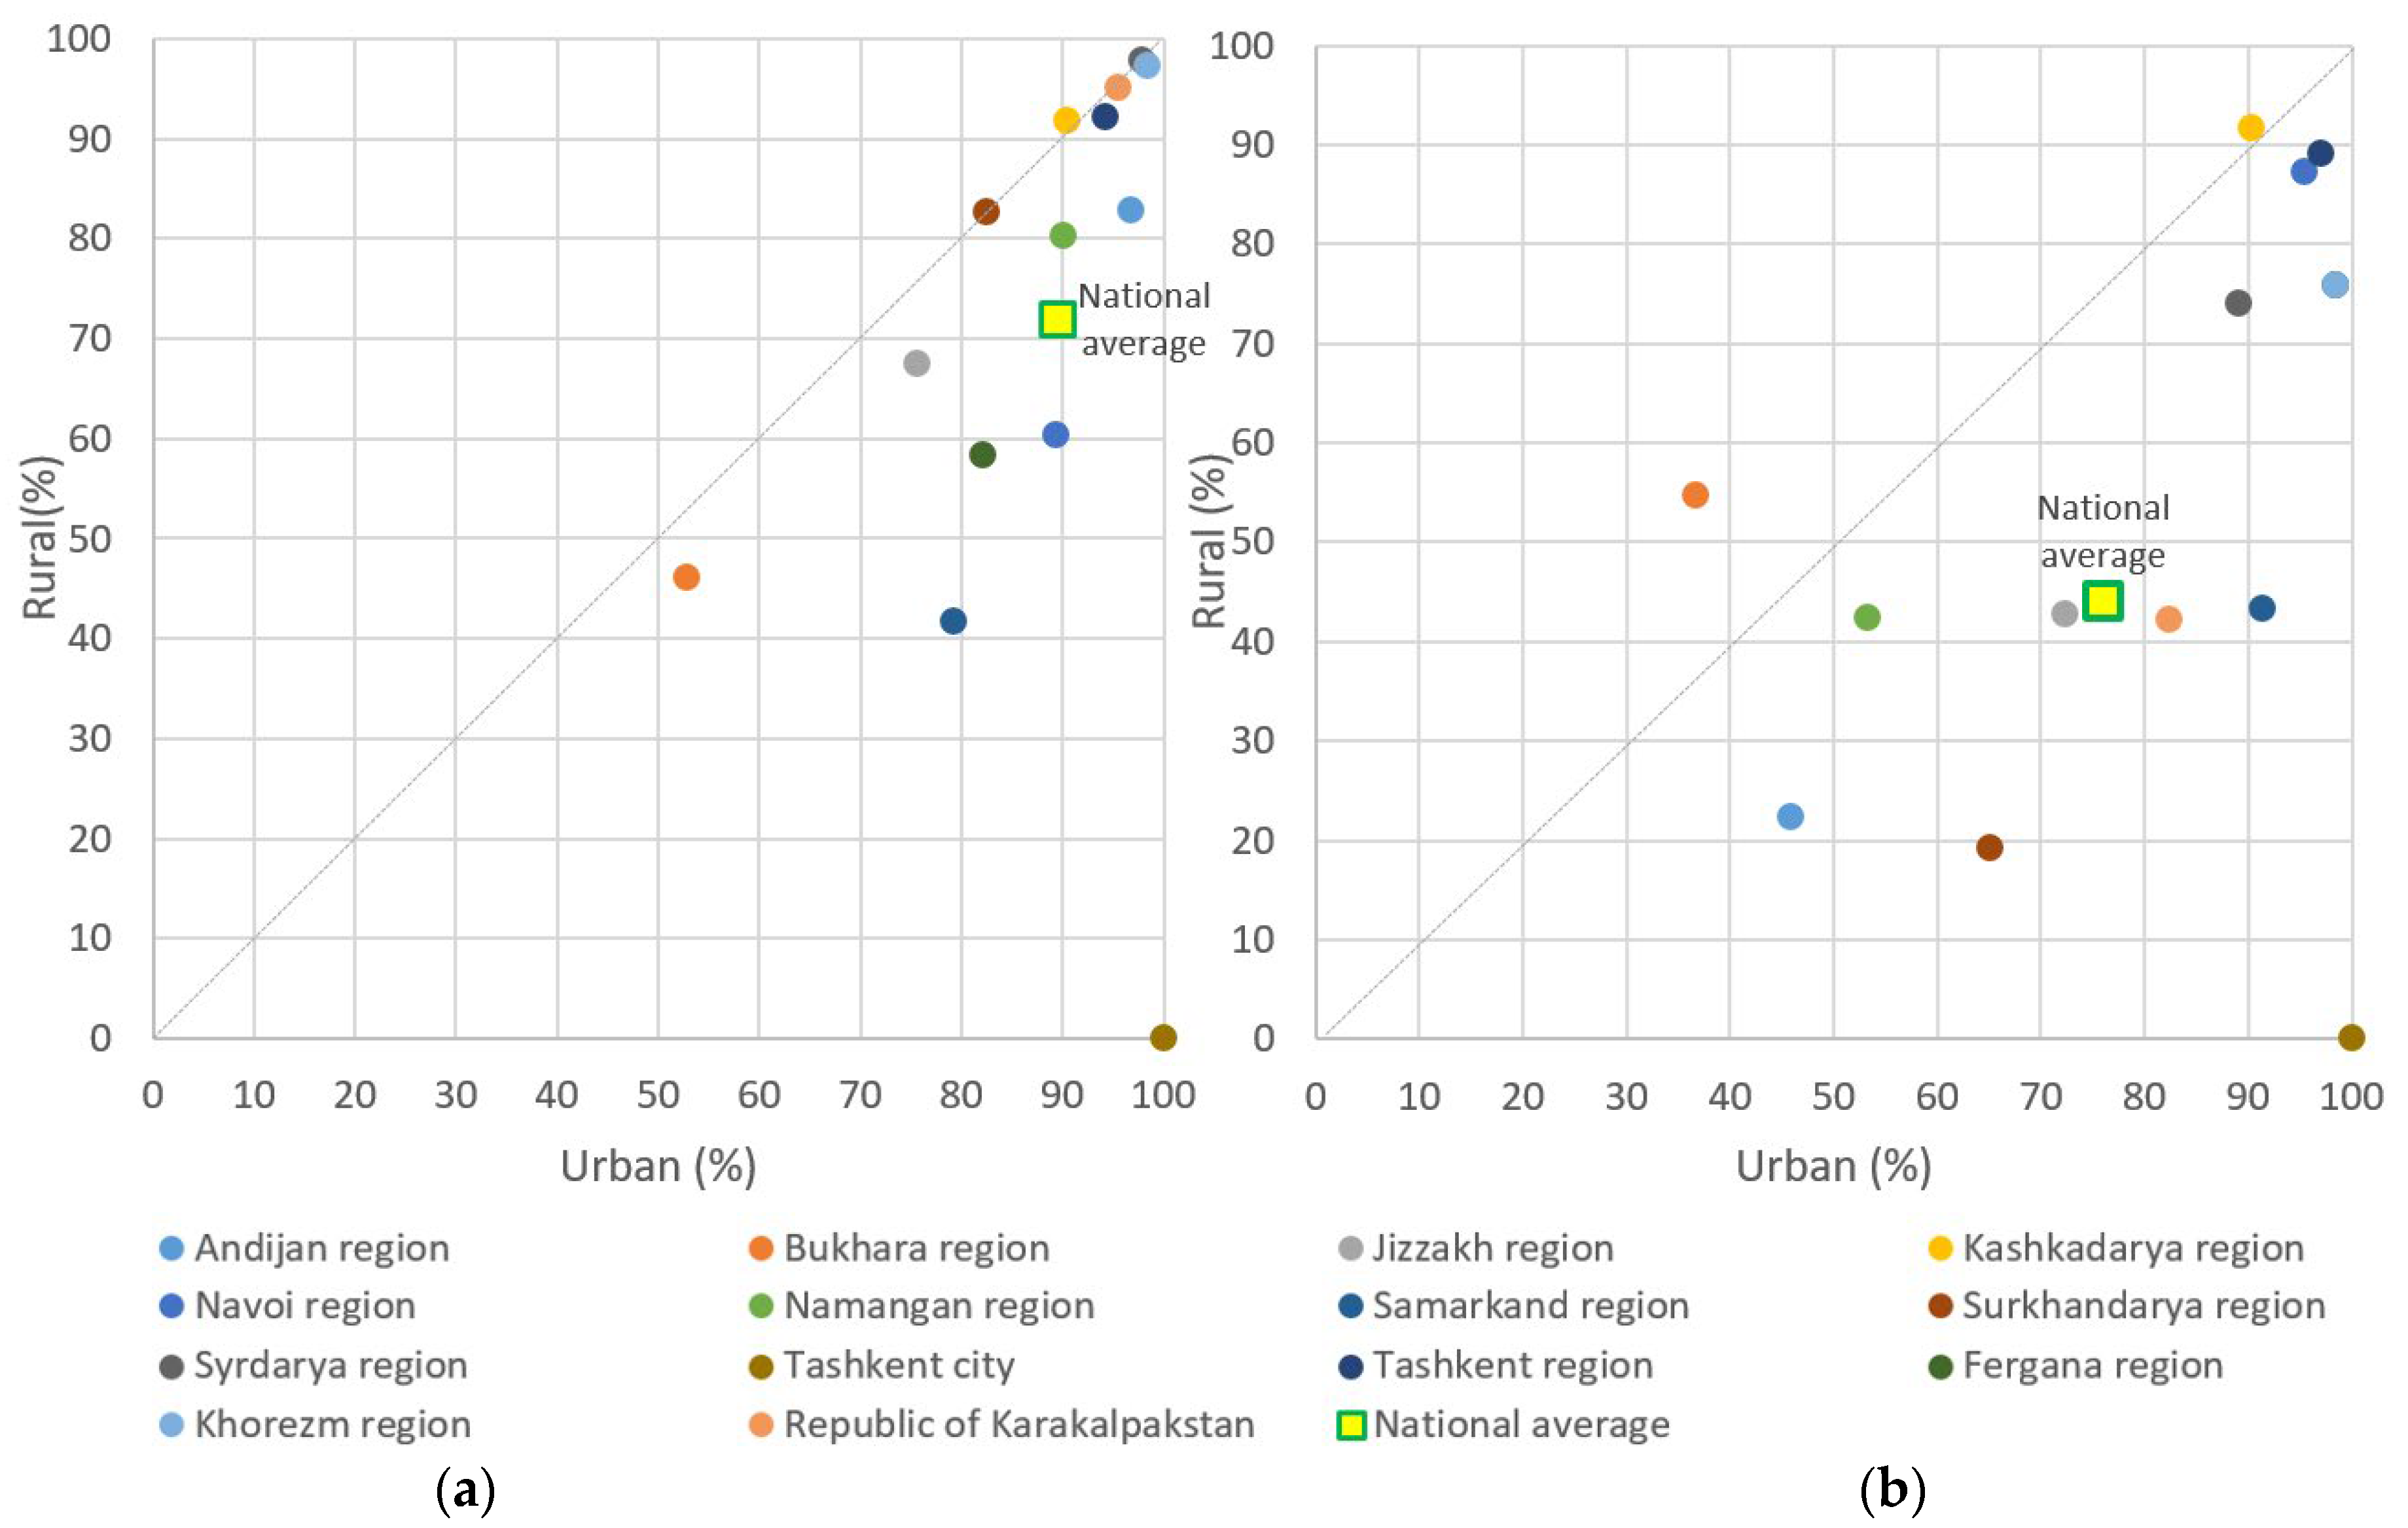
3.1. Regional Disparities in WASH and Clean Fuels Coverage

Figure 1 presents the geographical inequalities in WASH services and clean fuels coverage at the regional level. Improved water quality had the highest coverage among the WASH services variables. In all regions except for Khorezm, more than 86.6% of all households had an access to the improved water service. Tashkent city, the Tashkent region, and the southern regions (Kashkadarya and Surkhandarya) demonstrated the highest percentages for all three WASH services variables. However, more than 73.2% of households have access to basic sanitation facilities, excluding those in the Bukhara region and the Republic of Karakalpakstan. Basic handwashing exhibited the lowest coverage among the WASH services variables. Bukhara and Samarkand, belonging to the central-eastern region, had the lowest coverage of basic handwashing.
Tashkent city, the Tashkent region, and the Navoi region demonstrated high percentages of clean fuels. More than 86.6% of households in all regions used clean fuels for cooking and lighting, except for Andijan in the case of cooking. Clean fuels for space heating showed clear regional differences compared to the other two clean fuel variables. In the southern regions (Kashkadarya and Surkhandarya) and Andijan, WASH services and clean fuels coverage for cooking and lighting were high, but clean fuels for space heating had the lowest coverage.
In Figure 2, we further explore urban–rural discrepancies in basic handwashing and clean fuels for space heating, focusing on the variables with the lowest coverage among WASH services and clean fuels. All households in the Tashkent city were located in urban areas, so there were no rural residents. Compared to the national averages, coverage of handwashing and clean fuels for space heating were generally higher in urban areas than in rural areas. Regions with the largest urban–rural differences in basic handwashing were Samarkand (38 percentage points (pp)), Navoi (29 pp), and Fergana (24 pp). The use of clean fuels for space heating showed larger differences than basic handwashing. The urban coverage was higher than the rural coverage in all regions except the Bukhara region. In 10 of the 14 regions, the urban–rural gap was greater than 20 pp. Regions with wide gaps included Samarkand (48 pp), Surkhandarya (46 pp), Kashkadarya (40 pp), Khorezm (40 pp), and the Republic of Karakalpakstan (40 pp).

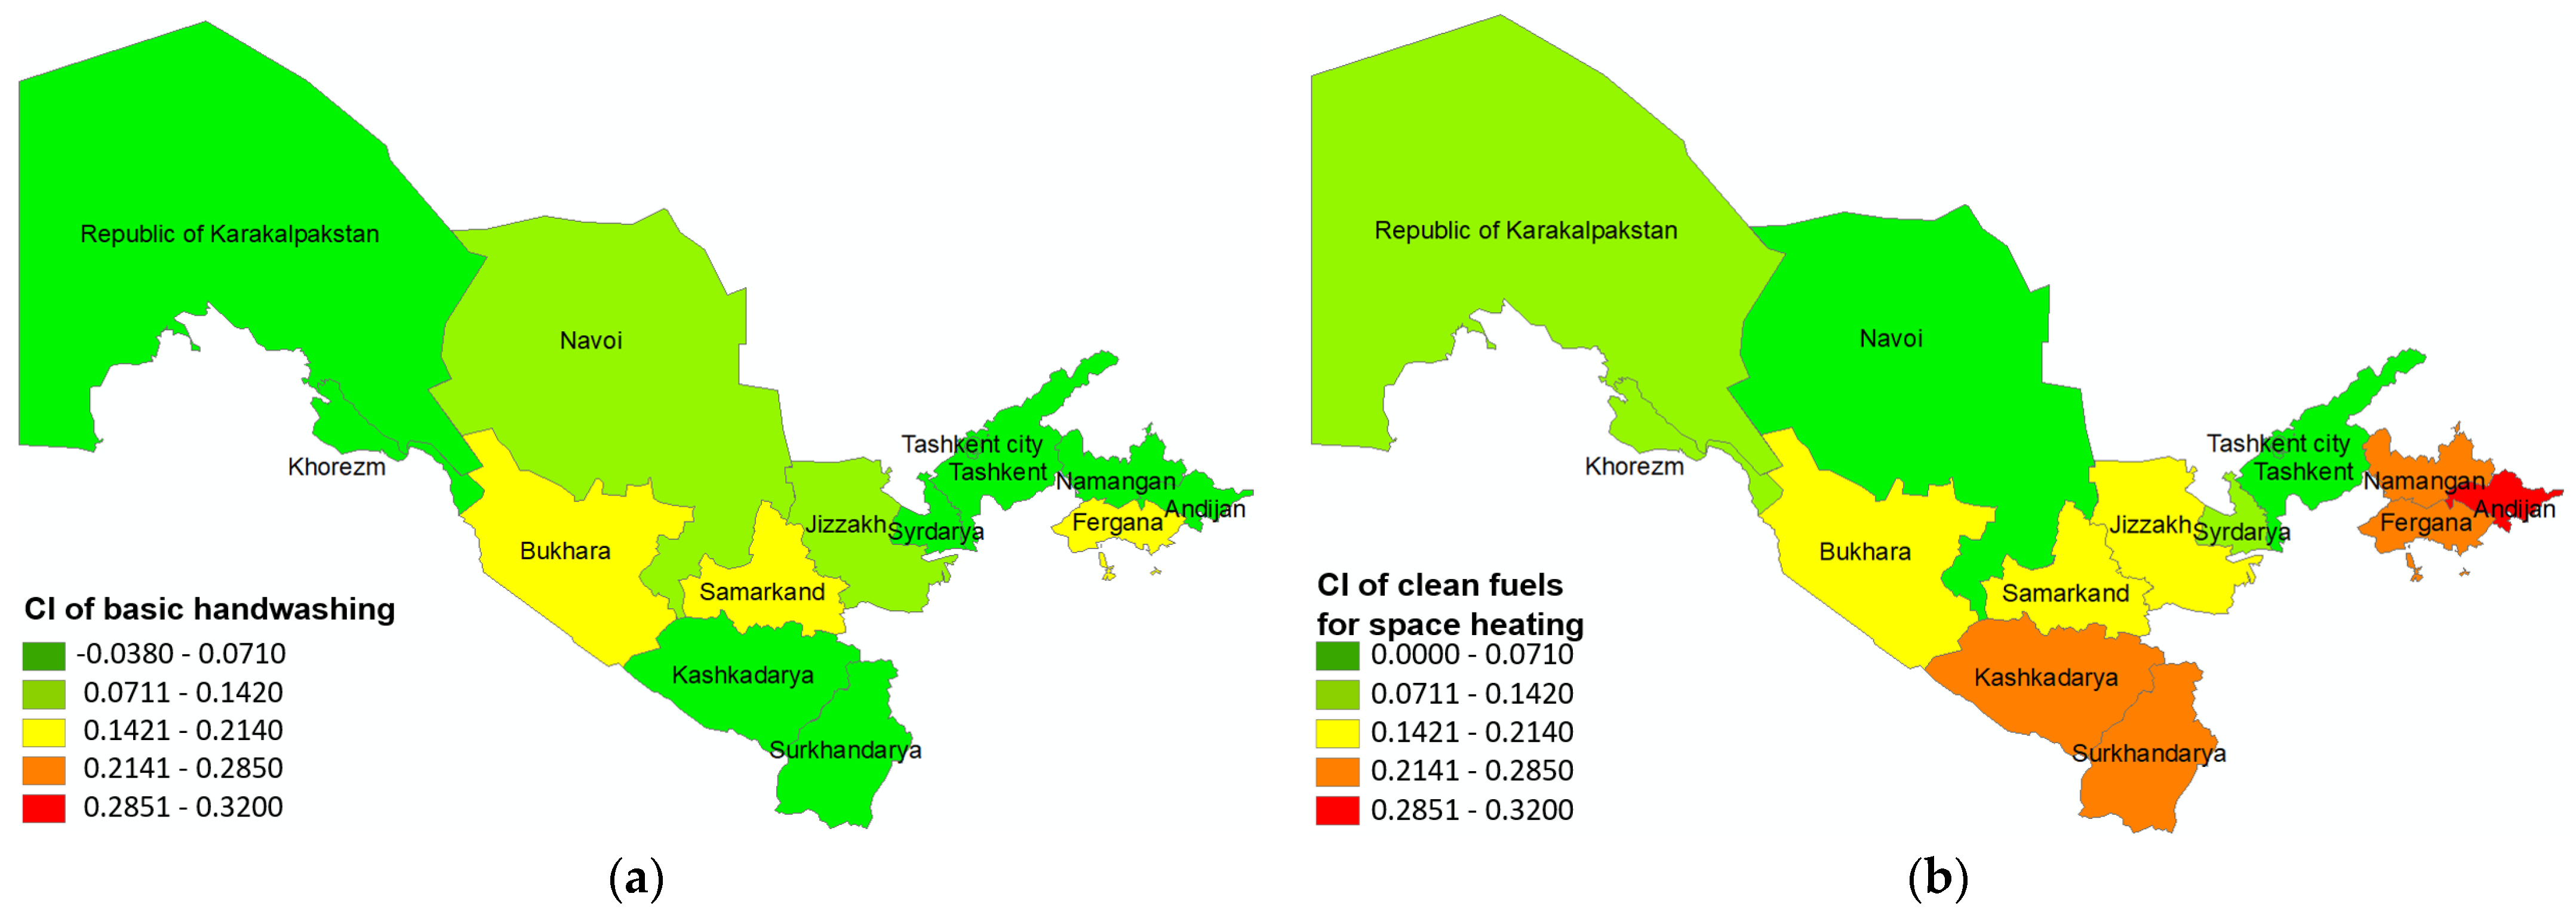
3.2. Measures of Inequality

The ratios and CIs for basic handwashing and clean fuels for space heating are presented in Table 1. The ratios of the national coverage for WASH services and clean fuels for space heating were 1.5 and 7.8, respectively. While WASH services had only one region with a ratio of five or higher, clean fuels for space heating had 10 regions. The mean CIs for basic handwashing and clean fuels for space heating at the national level were 0.0804 and 0.1697, respectively. In the Tashkent city, only the 4th and 5th quintiles existed. Samarkand (19.2) exhibited the greatest difference in ratios between the highest and lowest for basic handwashing. The ratios for the remaining regions, except for Samarkand, were less than three. Regarding clean fuels for space heating, the Republic of Karakalpakstan showed the greatest difference, with a ratio of 27.0 between the highest and lowest values. For basic handwashing, the area with a CI of 2.0 or higher was Bukhara (0.2061), whereas for heating, it was 2.0 or higher in the following five areas: Andijan (0.318), Surkhandarya (0.254), Fergana (0.243), Kashkadarya (0.220), and Namangan (0.218). Figure 3 illustrates the regional distribution of the CI for basic handwashing and clean fuels.
As shown in Figure 3, many areas had a higher CI for clean fuel for space heating than for basic handwashing. No area had a CI of 0.2141 or higher for basic handwashing, whereas the CI for clean fuels for space heating was 0.2141 or higher in five areas. Most regional patterns shown in Figure 2 and Figure 3 were similar. Specifically, the CI was high in areas where coverage of WASH services and clean fuels for space heating were low.

4. Discussion

This study explored WASH services and clean fuels coverage and analyzed the inequalities in basic handwashing and clean fuels for space heating using a nationally representative sample. The findings indicated that basic handwashing had the lowest coverage among WASH services variables. The use of clean fuels for cooking and lighting was high, whereas that for space heating was low. Compared to the national average, basic handwashing and clean fuels coverage for space heating was generally higher in urban areas than in rural areas. Regarding the CI, the use of clean fuels for space heating was higher than that for basic handwashing.
Regarding the WASH services, drinking water coverage was high in most areas, whereas basic sanitation and handwashing showed lower coverage than drinking water. Previous studies have also indicated that drinking water had the highest coverage among WASH-related variables [23,24]. In the case of basic handwashing facilities, most households (99.8%) had soap or detergent, but the lack of handwashing facilities (17.9%) contributed to lower basic handwashing coverage [20]. One possible explanation is that the majority of international cooperation in the WASH services sector is primarily focused on water supply [25]. Unlike water or sanitation infrastructure, handwashing facilities include mobile options such as buckets with taps, wash basins, or handwashing jugs, providing individuals with the flexibility to install them according to their own capabilities and willingness [20]. Therefore, it is necessary to investigate the reasons for the absence of facilities and encourage the utilization of mobile facilities through hygiene education or behavior change. As the first country in Central Asia to join the UNECE-WHO/Europe Protocol on Water and Health, Uzbekistan needs to prioritize handwashing services in its efforts to achieve access to clean and safe water, sanitation, hygiene, and health services for all [26].
Basic sanitation was low in Bukhara, and basic handwashing was also lacking in both Bukhara and Samarkand. Both regions face challenges related to the development of WASH services. First, the water resources in Bukhara and Samarkand are deficient and remote [25]. Second, both regions are known for their cultural heritage and historical sites. Therefore, the construction of WASH services infrastructure may be subject to restrictions because of its potential impact on World Heritage Sites [27].
In particular, the population of the Bukhara region faces limitations in access to water and sanitation services, and the number of patients treated for infectious diseases in the Bukhara region ranks fourth out of the 13 regions in Uzbekistan [28]. To mitigate these challenges in Bukhara and Samarkand, water supply projects by the World Bank were conducted from 2002 to 2010, with the main objective of rehabilitating the existing water supply system [25]. The Uzbekistan government has a strategy of developing these two regions into tourist destinations [29], which involves a potential influx of domestic and foreign tourists. Considering the increased risk of infection associated with travel [30,31], it is necessary to prioritize sanitation and hygiene services in these two regions.
Regarding clean fuels, the cooking and lighting coverage was high, whereas space heating coverage was low. Many public buildings in Uzbekistan were constructed during the 1970s and 1980s, without much consideration for energy efficiency [32]. The Uzbekistan government is striving to enhance energy efficiency through the implementation of a green building strategy. This strategy involves utilizing insulation to minimize the ingress of external cold air and incorporates heat recovery ventilation systems [33]. From a policy perspective, it is important to note that the obligation to reduce emissions of pollutants into the air and utilize energy-saving resources currently applies only to enterprises, institutions, and organizations. [34]. Thus, measures to reduce indoor air pollution and promote the use of clean fuels for heating need to be implemented at the household level as well.
Kashkadarya and Surkhandarya in the southern region, as well as Andijan, exhibited the lowest usage of clean fuels for heating. Owing to the neglected functions of the district heating sector, central heating services are regarded as unreliable, forcing households to rely on alternative heating methods that are unclean and unsafe [5]. The Kashkadarya, Surkhandarya, and Andijan regions have under 10% of households with central heating, and Andijan has the second lowest central heating in the country [20]. In particular, Andijan is a region where district heating services have been discontinued, and heaters or stoves are used instead [5].
Overall, basic handwashing and clean fuels coverage for space heating was higher in urban areas than in rural areas. According to the JMP, urban–rural discrepancies in improved water and sanitation are declining, but they still exist in all countries [35]. This result aligns with studies that highlight poor access to handwashing facilities in rural areas [2,24]. In a study examining rural and urban water and sanitation access in countries of the former Soviet Union, it was found that access to water and sanitation in rural areas was lower than in urban areas [36]. Another study on drinking water and sanitation in rural areas of Kazakhstan also indicated limited access to water and sanitation in rural areas [37]. The low coverage of clean fuels for heating in rural areas may be attributed to the lower central heating utilization rates in rural areas [20], potentially leading to the use of more polluting fuels for individual heating.
The Tashkent city and Tashkent regions were the only regions where all variables demonstrated the highest percentages. As of the first half of 2022, the Tashkent city accounted for the highest proportion of the gross regional product at 16.6%, followed by the Tashkent region at 10.5% [38]. The city’s State Unitary Enterprise, SuvSoz, provides water supply services to 99% of the population in Tashkent city [39]. Currently, the Asian Development Bank is implementing the Tashkent Province Water Supply Development Project [40]. Tashkent has the largest district heating system in the country and can provide heat to half the population [41]. Tashkent is the only region where a district heat infrastructure can be operated and maintained [5].
The Republic of Karakalpakstan has achieved high levels of WASH services coverage despite the environmental crisis in the Aral Sea and its low contribution to the gross regional product of 3.4% [38]. Karakalpakstan has garnered considerable attention from the international community because of the Aral Sea issue, resulting in the implementation of WASH services projects under the Aral Sea Program [25]. One such project was the Water Supply, Sanitation, and Health Project conducted from 1997 to 2008 by the World Bank. Recently, in 2022, WASH services projects were implemented for health facilities and schools in Karakalpakstan..
The CI for clean fuels was higher than that for WASH services. Although various WASH services projects have been conducted in Uzbekistan [25], the recent focus on clean energy may be a potential factor [42,43]. A study on economic inequalities in clean fuels for cooking reported inequalities favoring high-income households in the use of clean cooking fuels in Ghana [44]. Another study on household energy choices in Ghana found that price and household income were factors influencing household choices of fuels, with higher income households more likely to purchase modern fuels than traditional ones [45].
The southern and eastern regions demonstrated high CIs for clean fuels for space heating, indicating low clean fuels coverage. In the Andijan region, which had the highest CI, the district heating system has been inactive for more than eight years, forcing residents to use heaters or stoves instead [5].
This study makes a novel contribution to the literature, as it is the first to present WASH services and clean fuels coverage by region, utilizing the latest data from a nationally representative sample in Uzbekistan. By analyzing the regional characteristics of Uzbekistan, we present a basis for planning customized public health policies for each region. Additionally, examining wealth-related inequalities within each region can serve as a basis for improving coverage. Nevertheless, this study has some limitations. First, the quality of WASH services was not analyzed because the survey primarily focused on infrastructure [9,28]. Further studies with a focus on WASH service quality are required. Second, information on household members was omitted, as only overall household characteristics were collected. Future surveys including household member information would make it easier to identify the reasons for low coverage. Third, the survey is limited to demonstrate causal relationships, due to its descriptive design.

5. Conclusions

This study has identified regional gaps in the coverage of WASH services and clean fuels, as well as wealth-related inequalities in access to basic handwashing facilities and clean fuels for space heating in Uzbekistan. To address regional disparities, it is essential not only to implement nationwide policies but also to engage in policymaking at a regional level. In particular, attention should be paid to minimizing the gaps between urban and rural areas. In regions with a high CI, strategies to enhance coverage should prioritize low-income population groups. We recommend that policymakers utilize the findings of this study as evidence for allocating limited resources to high-priority regions and groups.

Author Contributions

Conceptualization, J.M., K.H.K. and J.W.C.; methodology, J.M. and K.H.K.; data curation, J.M.; writing—original draft preparation, J.M.; writing—review and editing, J.M. and K.H.K.; visualization, J.M.; supervision, K.H.K. and J.W.C. All authors have read and agreed to the published version of the manuscript.

Funding

This research received no external funding.

Institutional Review Board Statement

Ethical review and approval were waived for this study by the Korea University Institutional Review Board (No. KUIRB-2023-0298-01), as the study involved secondary analyses of open data.

Informed Consent Statement

Not applicable. Data analyses were conducted using open data from the UNICEF MICS webpage. UNICEF obtained verbal informed consent from all participants before the interview began.

Data Availability Statement

Data can be downloaded after registration as an MICS data user on the MICS webpage at https://mics.unicef.org/surveys (accessed on 19 January 2023).

Conflicts of Interest

The authors declare no conflicts of interest.

References

  1. United Nations Children’s Fund (UNICEF). UNICEF WASH Programme Contribution to COVID-19 Prevention and Response. 2020. Available online: https://www.unicef.org/documents/wash-programme-contribution-coronavirus-disease-covid-19-prevention-and-response (accessed on 26 August 2023).
  2. Brauer, M.; Zhao, J.T.; Bennitt, F.B.; Stanaway, J.D. Global access to handwashing: Implications for COVID-19 control in low-income countries. Environ. Health Perspect. 2020, 128, 57005. [Google Scholar] [CrossRef] [PubMed]
  3. Hillier, M.D. Using effective hand hygiene practice to prevent and control infection. Nurs. Stand. 2020, 35, 45–50. [Google Scholar] [CrossRef] [PubMed]
  4. World Health Organization. Environmental Health Uzbekistan 2022 Country Profile. 2022. Available online: https://www.who.int/publications/m/item/environmental-health-uzb-2022-country-profile (accessed on 26 August 2023).
  5. World Bank Group. Uzbekistan—District Heating Energy Efficiency Project. 2018. Available online: https://documents.worldbank.org/en/publication/documents-reports/documentdetail/591171517108418870/uzbekistan-district-heating-energy-efficiency-project (accessed on 25 August 2023).
  6. United Nations Economic Commission for Europe. 3rd Environmental Performance Review of Uzbekistan. 2020. Available online: https://unece.org/environment-policy/publications/3rd-environmental-performance-review-uzbekistan (accessed on 22 August 2023).
  7. Wolf, M.J.; Emerson, J.W.; Esty, D.C.; de Sherbinin, A.; Wendling, Z.A.; Mangalmurti, D.; Benedetti, C.; Keene, A.; Cong, R.; Lee, C.; et al. The 2022 Environmental Performance Index. 2022. Available online: https://epi.yale.edu/downloads (accessed on 22 August 2023).
  8. World Bank Group. People Using Safely Managed Drinking Water Services (% of Population)—Uzbekistan, Sub-Saharan Africa, Europe & Central Asia (Excluding High Income). 2020. Available online: https://data.worldbank.org/indicator/SH.H2O.SMDW.ZS?locations=UZ-ZG-7E (accessed on 12 September 2023).
  9. European Observatory on Health Systems and Policies; World Health Organization. Health Systems in Action: Uzbekistan: 2022 edition. 2022. Available online: https://apps.who.int/iris/handle/10665/362328 (accessed on 10 September 2023).
  10. World Bank. World Bank Supports Water Supply and Sanitation Sector Reforms and Infrastructure Development in Three Regions of Uzbekistan. 2020. Available online: https://www.worldbank.org/en/news/press-release/2020/03/12/uzbekistan-water-services-and-institutional-support-project (accessed on 7 July 2023).
  11. IQAir. Air Quality in Uzbekistan. 2023. Available online: https://www.iqair.com/uzbekistan (accessed on 13 August 2023).
  12. United Nations Development Programme. Energy Efficiency in Buildings: Untapped Reserves for Uzbekistan Sustainable Development. 2013. Available online: https://www.undp.org/uzbekistan/publications/energy-efficiency-buildings-untapped-reserves-uzbekistan-sustainable-development (accessed on 29 August 2023).
  13. Crighton, E.J.; Elliott, S.J.; Meer, J.; Small, I.; Upshur, R. Impacts of an environmental disaster on psychosocial health and well-being in Karakalpakstan. Soc. Sci. Med. 2003, 56, 551–567. [Google Scholar] [CrossRef] [PubMed]
  14. Veluswami Subramanian, S.; Cho, M.J.; Mukhitdinova, F. Health Risk in Urbanizing Regions: Examining the Nexus of Infrastructure, Hygiene and Health in Tashkent Province, Uzbekistan. Int. J. Environ. Res. Public Health 2018, 15, 2578. [Google Scholar] [CrossRef] [PubMed]
  15. Aripov, T.; Blettner, M.; Gorbunova, I. The impact of neighborhood to industrial areas on health in Uzbekistan: An ecological analysis of congenital diseases, infant mortality, and lung cancer. Environ. Sci. Pollut. Res. Int. 2020, 27, 17243–17249. [Google Scholar] [CrossRef] [PubMed]
  16. O’Donnell, O.; van Doorslaer, E.; Wagstaff, A.; Lindelow, M. Analyzing Health Equity Using Household Survey Data: A Guide to Techniques and Their Implementation. 2008. Available online: https://openknowledge.worldbank.org/entities/publication/8c581d2b-ea86-56f4-8e9d-fbde5419bc2a (accessed on 27 July 2023).
  17. World Inequality Database. Wealth Inequality, Uzbekistan, 1995–2021. 2021. Available online: https://wid.world/country/uzbekistan/ (accessed on 25 August 2023).
  18. Hohmann, S.; Garenne, M. Health and wealth in Uzbekistan and sub-Saharan Africa in comparative perspective. Econ. Hum. Biol. 2010, 8, 346–360. [Google Scholar] [CrossRef] [PubMed]
  19. Bomela, N.J. Social, economic, health and environmental determinants of child nutritional status in three Central Asian Republics. Public Health Nutr. 2009, 12, 1871–1877. [Google Scholar] [CrossRef] [PubMed]
  20. State Committee of the Republic of Uzbekistan on Statistics UNCsFU. 2021–2022 Uzbekistan Multiple Indicator Cluster Survey, Survey Findings Report. 2022. Available online: https://mics.unicef.org/surveys (accessed on 5 September 2023).
  21. United Nations Children’s Fund (UNICEF); World Health Organization. Core Questions on Drinking Water, Sanitation and Hygiene for Household Surveys: 2018 Update. 2018. Available online: https://washdata.org/reports/jmp-2018-core-questions-household-surveys (accessed on 13 July 2023).
  22. World Health Organization. Handbook on Health Inequality Monitoring with a Special Focus on Low- and Middle-Income Countries. 2013. Available online: https://apps.who.int/iris/handle/10665/85345 (accessed on 27 July 2023).
  23. Phillips, A.E.; Ower, A.K.; Mekete, K.; Liyew, E.F.; Maddren, R.; Belay, H.; Chernet, M.; Anjulo, U.; Mengistu, B.; Salasibew, M.; et al. Association between water, sanitation, and hygiene access and the prevalence of soil-transmitted helminth and schistosome infections in Wolayita, Ethiopia. Parasit Vectors 2022, 15, 410. [Google Scholar] [CrossRef] [PubMed]
  24. Sesay, B.P.; Hakizimana, J.L.; Elduma, A.H.; Gebru, G.N. Assessment of water, sanitation and hygiene practices among households, 2019—Sierra Leone: A community-based cluster survey. Environ. Health Insights 2022, 16, 11786302221125042. [Google Scholar] [CrossRef] [PubMed]
  25. World Bank Group. Uzbekistan—Water Supply, Sanitation and Health Project; and Bukhara and Samarkand Water Supply Project. 2015. Available online: https://documents.worldbank.org/en/publication/documents-reports/documentdetail/222081468189534492/uzbekistan-water-supply-sanitation-and-health-project-and-bukhara-and-samarkand-water-supply-project (accessed on 6 September 2023).
  26. United Nations Economic Commission for Europe. Uzbekistan’s Accession to the Protocol on Water and Health Opens New Opportunities for Stronger Action on Water, Sanitation, Hygiene and Health. 2024. Available online: https://unece.org/climate-change/press/uzbekistans-accession-protocol-water-and-health-opens-new-opportunities (accessed on 20 December 2023).
  27. Iraqi Civil Society Solidarity Initiative. World Heritage Watch Resolution on Water Infrastructure Threatening World Heritage. 2018. Available online: https://www.iraqicivilsociety.org/archives/8827 (accessed on 6 September 2023).
  28. Asian Infrastructure Investment Bank. Environmental and Social Management Planning Framework (ESMPF) for Bukhara Region Water Supply and Sewerage Project (BRWWSP). 2021. Available online: https://www.aiib.org/en/projects/details/2020/approved/Uzbekistan-Bukhara-Region-Water-Supply-and-Sewerage-Project.html (accessed on 11 September 2023).
  29. Independent Evaluation Group. Uzbekistan—Bukhara & Samarkand Water Supply Project. 2012. Available online: https://ieg.worldbankgroup.org/ieg-search-icrr?search_api_fulltext=P049621 (accessed on 6 September 2023).
  30. Sitorus, R.J.; Wathan, I.; Ridwan, H.; Wibisono, H.; Nuraini, L.; Yusri; Kosim, G.; Nurdin, N.; Mamat, H.; Andrayani, I.; et al. Transmission dynamics of novel Coronavirus-SARS-CoV-2 in south Sumatera, Indonesia. Clin. Epidemiol.Glob. Health 2021, 11, 100777. [Google Scholar] [CrossRef] [PubMed]
  31. Baker, R.E.; Mahmud, A.S.; Miller, I.F.; Rajeev, M.; Rasambainarivo, F.; Rice, B.L.; Takahashi, S.; Tatem, A.J.; Wagner, C.E.; Wang, L.F.; et al. Infectious disease in an era of global change. Nat. Rev. Microbiol. 2022, 20, 193–205. [Google Scholar] [CrossRef] [PubMed]
  32. World Bank. Uzbekistan to Invest in Improving Energy Efficiency of Public Buildings, with World Bank Support. 2022. Available online: https://www.worldbank.org/en/news/press-release/2022/06/24/uzbekistan-to-invest-in-improving-energy-efficiency-of-public-buildings-with-world-bank-support (accessed on 20 December 2023).
  33. UZ DAILY. Uzbekistan Is Moving towards the Introduction of Best Practices in the Construction of Energy Efficient and Low-Carbon Buildings. 2022. Available online: https://uzdaily.com/en/post/73966 (accessed on 20 December 2023).
  34. Law of the Republic of Uzbekistan. On Introducing Amendments and Additions to the Law of the Republic of Uzbekistan “on the Protection of Atmospheric Air”. 2019. Available online: https://lex.uz/uz/docs/4238834#4239926 (accessed on 21 December 2023).
  35. Roche, R.; Bain, R.; Cumming, O. A long way to go—Estimates of combined water, sanitation and hygiene coverage for 25 sub-Saharan African countries. PLoS ONE 2017, 12, e0171783. [Google Scholar] [CrossRef]
  36. McKee, M.; Balabanova, D.; Akingbade, K.; Pomerleau, J.; Stickley, A.; Rose, R.; Haerpfer, C. Access to water in the countries of the former Soviet Union. Public Health 2006, 120, 364–372. [Google Scholar] [CrossRef] [PubMed]
  37. Tussupova, K.; Hjorth, P.; Berndtsson, R. Access to drinking water and sanitation in rural Kazakhstan. Int. J. Environ. Res. Public Health 2016, 13, 1115. [Google Scholar] [CrossRef] [PubMed]
  38. Statistics Agency under the President of the Republic of Uzbekistan. Which Region has the Highest Gross Domestic (Regional) Product per Capita? 2022. Available online: https://stat.uz/en/30879-qaysi-hududda-aholi-jon-boshiga-hisoblangan-yalpi-ichki-hududiy-mahsulot-eng-yuqori-4 (accessed on 5 September 2023).
  39. European Bank for Reconstruction and Development. Tashkent Water and Wastewater Modernization Project Feasibility Study. 2018. Available online: https://www.ebrd.com/documents/comms-and-bis/psd-49277-sep.pdf (accessed on 30 August 2023).
  40. Asian Development Bank. Uzbekistan: Second Tashkent Province Water Supply Development Project. 2023. Available online: https://www.adb.org/projects/51240-001/main (accessed on 30 August 2023).
  41. Veolia Group. Veolia Entrusted with the Operation, Maintenance and Management of the District Heating System of the City of Tashkent for a Duration of 30 Years. 2021. Available online: https://www.veolia.com/en/our-media/newsroom/press-releases/veolia-entrusted-management-district-heating-system-city-Tashkent (accessed on 12 September 2023).
  42. World Bank Group. Uzbekistan to Invest in Modernizing Its Energy Sector to Meet Growing Demand with Private Sector Participation and World Bank Support. 2023. Available online: https://www.worldbank.org/en/news/press-release/2023/05/09/uzbekistan-to-invest-in-modernizing-its-energy-sector-to-meet-growing-demand-with-private-sector-participation-and-world (accessed on 29 August 2023).
  43. World Bank Group. New Solar Power Plants to Be Launched in Uzbekistan with World Bank Support, Helping Expand Access to Clean Energy. 2023. Available online: https://www.worldbank.org/en/news/press-release/2023/03/07/new-solar-power-plants-to-be-launched-in-uzbekistan-with-world-bank-support-helping-expand-access-to-clean-energy (accessed on 29 August 2023).
  44. Tabiri, K.G.; Adusah-Poku, F.; Novignon, J. Economic inequalities and rural-urban disparities in clean cooking fuel use in Ghana. Energy Sustain. Dev. 2022, 68, 480–489. [Google Scholar] [CrossRef]
  45. Mensah, J.T.; Adu, G. An empirical analysis of household energy choice in Ghana. Renew. Sustain. Energy Rev. 2015, 51, 1402–1411. [Google Scholar] [CrossRef]
Figure 1. Regional coverage of WASH services and clean fuels in Uzbekistan.
Sustainability 16 01580 g001aSustainability 16 01580 g001b
Figure 2. Area-based inequality in basic handwashing services and clean fuels for space heating by region in Uzbekistan. (a) Area-based inequality in basic handwashing services, and (b) area-based inequality in clean fuels for space heating. If the mark is located on a diagonal (the 45-degree line), it means that there is no difference in rural and urban coverage. If positioned below the diagonal, it indicates higher coverage in urban areas compared to rural areas.
Sustainability 16 01580 g002
Figure 3. Regional inequality in basic handwashing and clean fuels for space heating in Uzbekistan. (a) CI of basic handwashing, and (b) CI of clean fuels for space heating. CI—concentration index.
Sustainability 16 01580 g003
Table 1. Wealth-based inequality in basic handwashing and clean fuels for space heating by region (MICS 2021–2022).
RegionBasic HandwashingClean Fuels for Space Heating
AverageLowestHighestRatio (Highest/Lowest)CI **AverageLowestHighestRatio (Highest/
Lowest)
CI
National 82.0%67.4%99.4%1.50.080459.9%12.7% 99.4%7.80.1697
Andijan 89.2%79.8%100%1.3 0.046533.1%12.5%100%8.00.3180
Bukhara 48.7%35.0%100%2.9 0.206147.8%18.0%100%5.50.1945
Jizzakh 71.5%37.8%100%2.6 0.130457.6%13.0%100%7.70.1624
Kashkadarya 91.0%87.1%100%1.1 0.030837.6%7.8%100%12.80.2197
Navoi 75.2%37.5%100%2.7 0.130392.2%50.0%100%2.00.0424
Namangan 86.5%85.7%93.9%1.1 0.007048.9%11.1%100%9.00.2179
Samarkand 54.6%5.2%100%19.2 0.164459.9%19.1%98.9%5.20.1802
Surkhandarya 92.3%98.3%92.9% 0.9 −0.038035.9%8.4%100%11.90.2542
Syrdarya 99.0%100%100%1.0 0.000981.3%40.0%100%2.50.0955
Tashkent city *100.0%100%100%1.0 0.0010100.0%100%100%1.00.0000
Tashkent 93.1%93.8%98.7%1.1 0.029492.8%31.3%98.7%3.20.0319
Fergana 68.7%42.2%100%2.4 0.144447.0%6.7%97.8%14.70.2433
Khorezm 97.6%100%100%1.0 0.008482.7%20.0%100%5.00.0735
Republic of Karakalpakstan95.8%92.6%100%1.1 0.014163.4%3.7%100%27.00.1376
* The incomes of households belonging to the Tashkent city were in the 4th or 5th quintiles. Thus, the Tashkent city’s ratio was calculated using the 4th quintile as the lowest value. ** CI—concentration index.
Disclaimer/Publisher’s Note: The statements, opinions and data contained in all publications are solely those of the individual author(s) and contributor(s) and not of MDPI and/or the editor(s). MDPI and/or the editor(s) disclaim responsibility for any injury to people or property resulting from any ideas, methods, instructions or products referred to in the content.

