Article

Navigating Crisis: Insights into the Depletion and Recovery of Central Java’s Freshwater Eel (Anguilla spp.) Stocks

by
Supradianto Nugroho
1,* and
Takuro Uehara
2
1
Institute of Marine and Coastal Resource Management, Serang 42264, Banten, Indonesia
2
College of Policy Science, Ritsumeikan University, Ibaraki 567-8570, Japan
*
Author to whom correspondence should be addressed.
Sustainability 2024, 16(4), 1578; https://doi.org/10.3390/su16041578
Submission received: 8 January 2024 / Revised: 4 February 2024 / Accepted: 9 February 2024 / Published: 13 February 2024
(This article belongs to the Special Issue Fish Biology, Ecology and Sustainable Management)

Abstract

:
The southern coast of Central Java Province is one of Indonesia’s largest eels (Anguilla spp.) fishing grounds. The annual eel catches in this region showed an increasing trend in 2011–2014 but then plummeted in 2019–2021. However, studies on stock status are lacking to provide an effective management plan to prevent the collapse of eel fisheries. Therefore, this study assessed the state of freshwater eels in Southern Central Java using a data-limited method, catch-based maximum sustainable yield (CMSY). The analysis revealed a swift stock depletion, shifting from a healthy state in 2011 to a concerning red zone in 2015–2018. Subsequently, the stock began a recovery phase in 2019, but the recent trajectory raised concerns as it approached the red zone again, signaling the urgency of implementing a rebuilding plan. The simulation of several rebuilding scenarios suggests that reducing fishing mortality to 80% of the FMSY (maximum sustainable fishing mortality) can balance production and conservation objectives, achieving the quickest stock rebuilding with minimal catch loss. This study showed that eel stock could be rebuilt by reducing fishing pressure to preserve a surplus of individuals who can complete their migration and spawning cycles.

1. Introduction

The worldwide population of freshwater eels (Anguilla spp.) faces a serious threat due to extensive harvesting at different life stages. While adult eels, such as yellow- and silver-stage eels, have been consumed as foods, glass eels and elvers hold high aquacultural values [1]. In the last three to four decades, there has been a notable decline in the populations of European (A. anguilla), American (A. rostrata), and Japanese (A. japonica) eels, followed by other eel species, including Australian (A. australis) and New Zealand (A. dieffenbachia) [2]. To compensate for diminishing European and Japanese eel populations, countries such as China, Japan, Taiwan, and South Korea have turned to artificial cultivation to meet consumer demand [3]. Since artificially induced breeding techniques for eels have not been established, young wild juveniles (i.e., glass eels and elvers) captured in estuaries are used for cultivation [4]. Juvenile eels have become highly valuable commodities in aquaculture, exerting significant pressure on the natural environment owing to extensive fishing. Approximately 90% of the world’s eel supply is sourced from aquaculture, and the entire industry relies on wild juveniles [5]. This heavy dependence on wild catch for eel resources intensifies the threat to wild eel stocks, pushing their status from threatened toward further decline.
Southeast Asian tropical eels, specifically A. bicolor and A. marmorata, are targeted as alternatives to compensate for the diminishing European and Japanese eel resources in East Asia [3]. Anguillid eel capture fisheries are operational in Indonesia, the Philippines, and Vietnam, while these species are considered bycatch in Thailand [6]. In Indonesia, the focus is on capturing glass eels, elvers, and yellow eels of A. bicolor or A. marmorata during the rainy season spanning from September to December [7]. Meanwhile, the Luzon and Mindanao Islands in the Philippines primarily target A. marmorata for glass eels, elvers, and yellow eels, experiencing a notable decline in the combined annual catch from 12 tons in 2007 to approximately 0.3 tons in 2017 [8]. In Vietnam, the Ky Lo River in Phu Yen Province is a prominent site for capturing glass eels, predominantly A. marmorata (95%), and A. bicolor pacifica (5%). The peak of the fishing season occurs from November to May, recording an annual catch ranging between 0.60 and 0.75 tonnes (equivalent to 4,000,000–5,000,000 individuals) [9]. On the other hand, eel farming has also been expanding in this region. Indonesian, Filipino, and Burmese eel farmers rely on regionally sourced young eel stock for their eel farms within their respective countries, whereas Cambodian farmers import young eels from the Philippines and Indonesia [8]. Notably, large-scale farms cultivating tropical anguillid eels have been in operation, particularly on Java Island, Indonesia, since the late 2000s [10].
Cilacap, on the southern coast of Central Java Province, serves as one of the largest fishing grounds for yellow eels in Indonesia, supplying a significant portion of elvers and yellow eels to cultivation farms [9]. In this regency, elvers and yellow eels are primarily captured using scoop nets or PVC traps during the period from October to November, whereas eels intended for consumption are harvested through lift nets from April to September [7]. The annual catch of eel in this region was provided by the Marine and Fishery Department of Central Java Province (Figure 1), which was mainly recorded from three regencies: Cilacap, Kebumen, and Purworejo [11,12]. The eel fishery in this region is predominantly characterized as artisanal, with eel fishermen engaging in the sale of their catches to intermediary eel collectors. Subsequently, these collectors facilitate the distribution of the eels to various eel farms [9,13].
Despite the increase in tropical eel catches, there is a notable absence of studies on tropical eels compared to their European, American, Japanese, Australian, and New Zealand counterparts. Studies on tropical eels have been conducted on species composition, early life history, recruitment behavior of the glass eel, and the relationship between eel biology and habitat [14,15,16,17,18]. Studies on the stock’s condition, particularly regarding its exploitation level and spawning biomass status, are lacking in formulating a comprehensive management strategy. This strategy should include diverse management methods such as regulating effort, establishing a minimum mesh size for nets, and setting maximum catch limits [19,20]. The 2017 International Eel Symposium highlighted a great concern regarding the stock status of eel fisheries, particularly for tropical species that remain poorly understood [21].
Unfortunately, the available fishery data, in which only time series of landing data and some biological information exist, may not facilitate utilizing conventional methods to assess the stock status. Therefore, there is a critical need to shift from traditional stock assessment methods to more adaptable approaches that can function effectively, even with limited data [21]. Various data-limited methods have been developed for species using fish catch data [22,23,24,25,26,27], fish length data [28,29,30], and fish abundance data [31].
This study assesses the state of freshwater eels in southern Central Java, where glass and adult eels are exploited. Due to the scarcity of data, the assessment of freshwater eel stock status and exploitation rate relied on a data-limited model constructed from commercial landing data of adult eels. The evaluation of this stock serves as fundamental information for prospective strategies aiming to avert the decline of eel fisheries. Additionally, based on the knowledge of the biology and fisheries of this eel, potential strategies to manage the utilization of these resources were explored to improve the eels’ sustainability.

2. Materials and Methods

2.1. Study Area

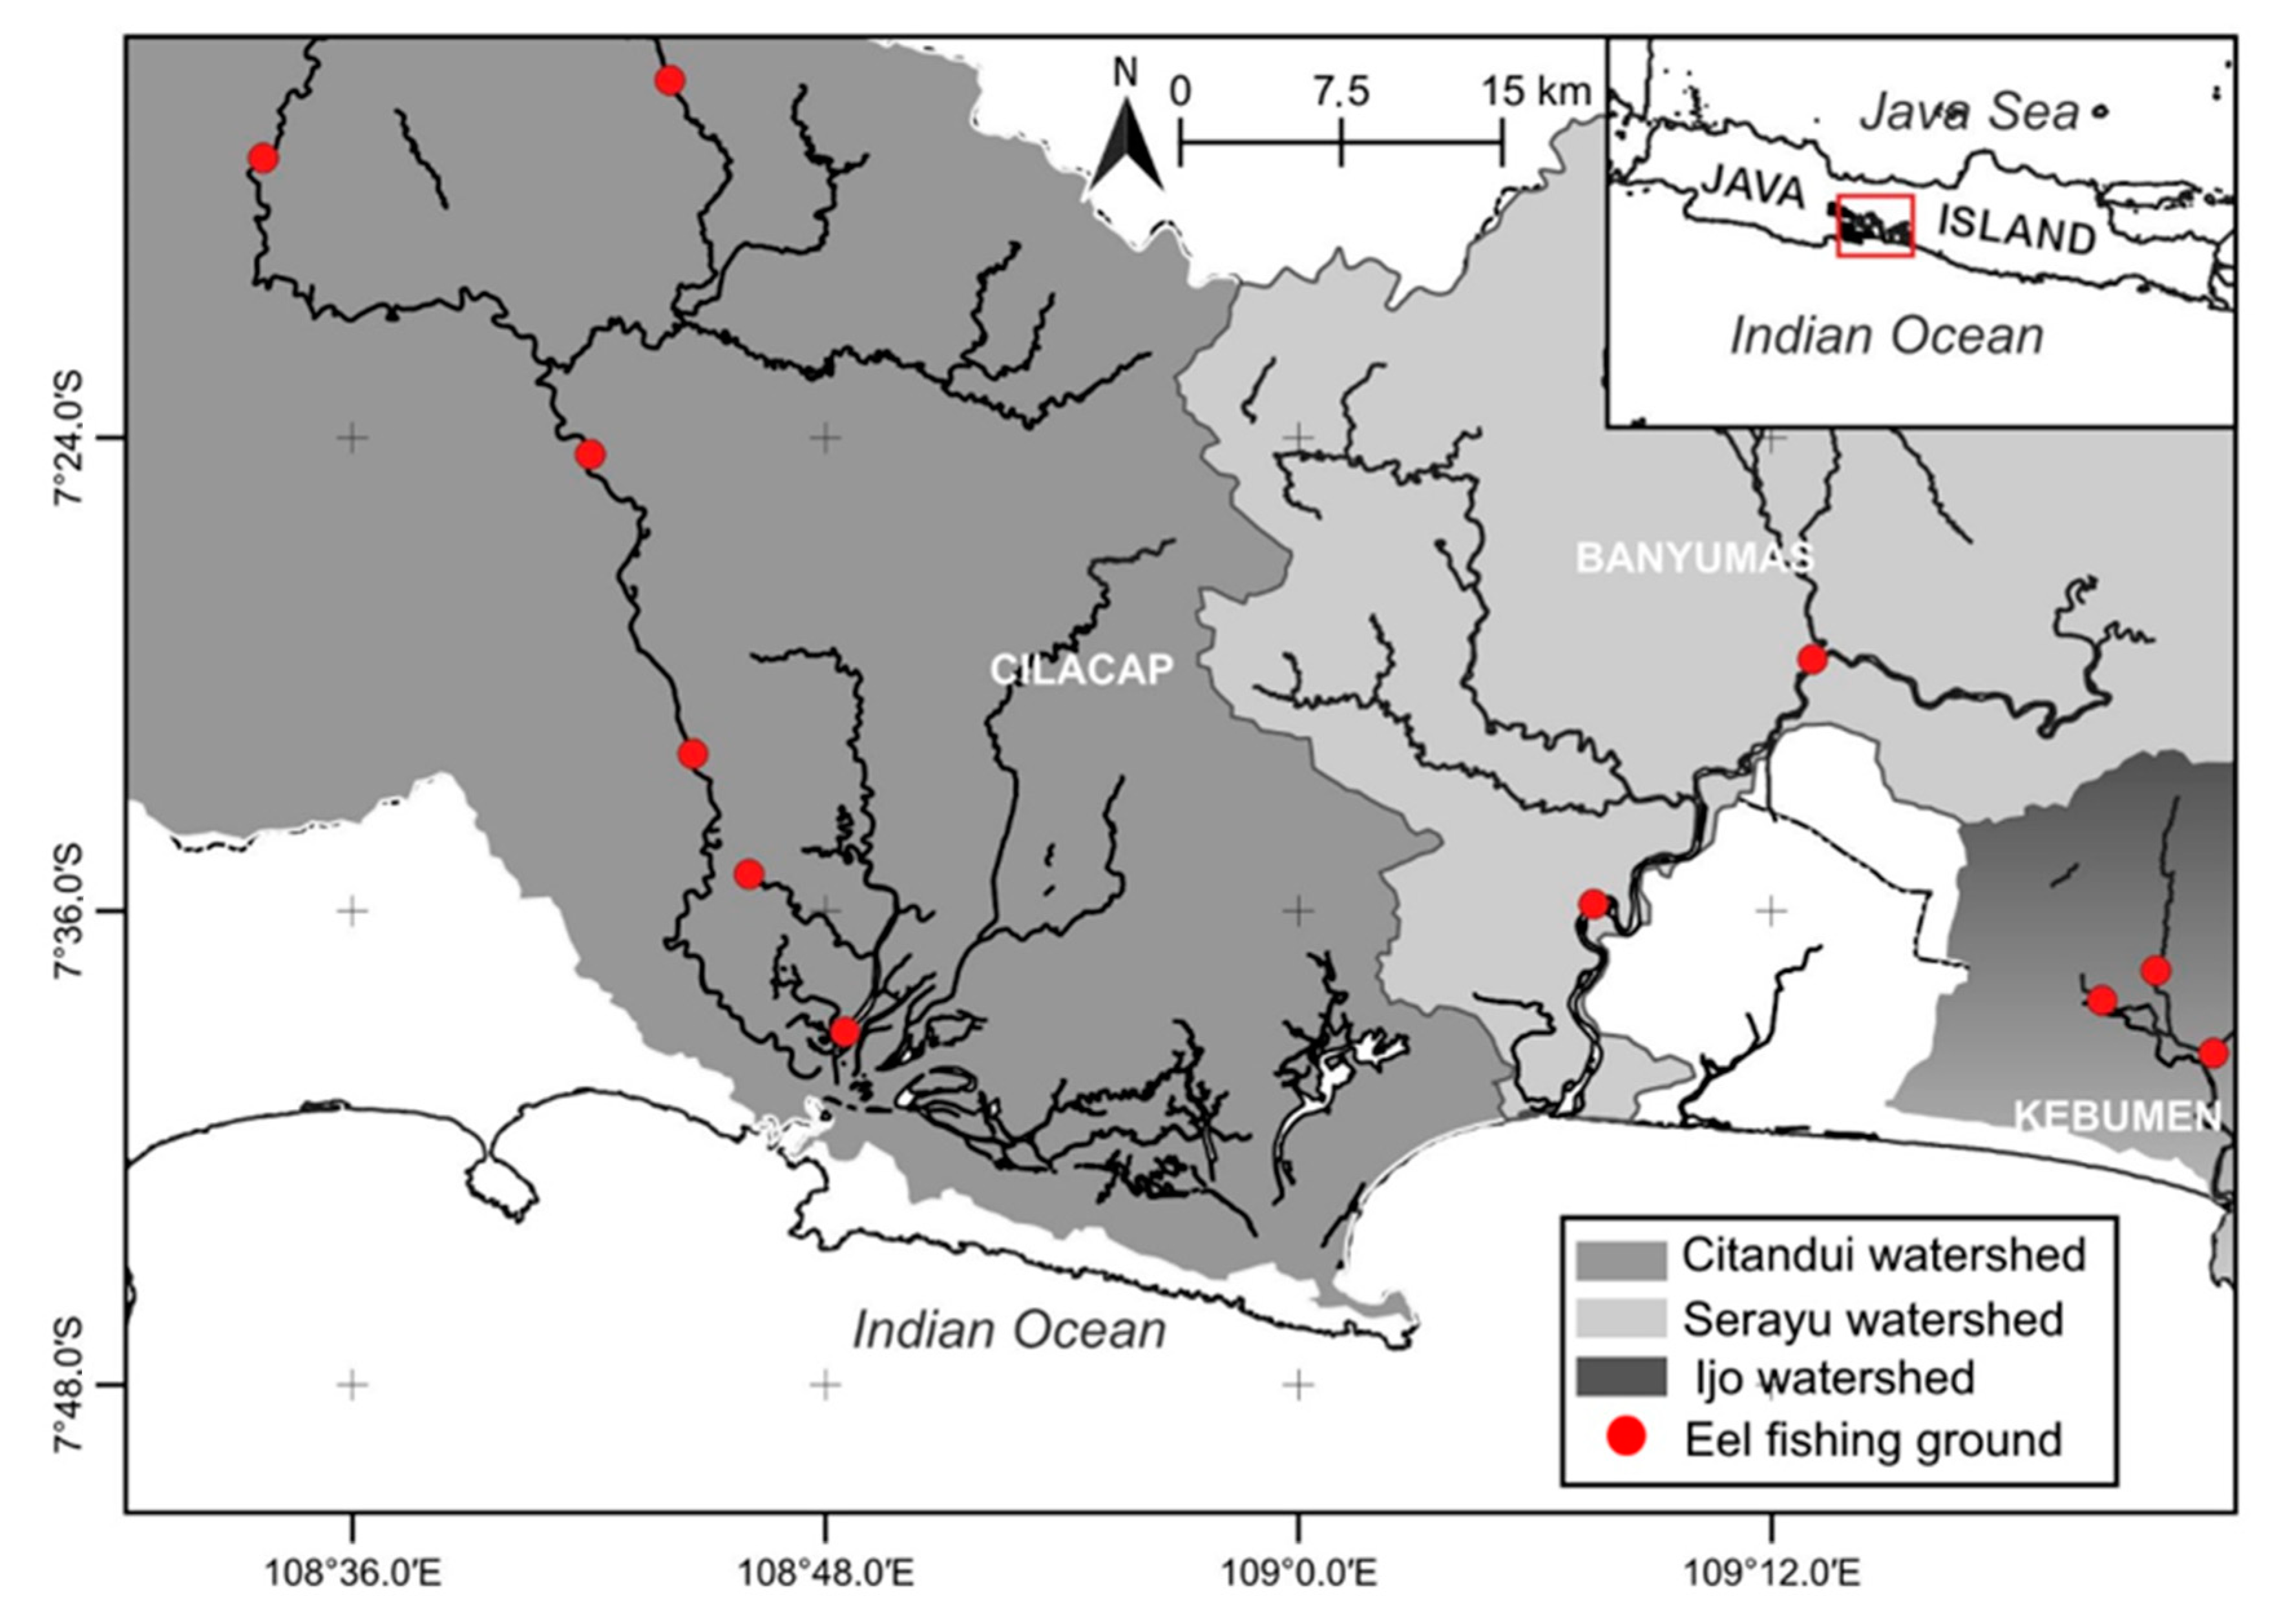
Central Java Province was selected as the unit of analysis in this research, where eel fishing is practiced on the southern coast of Central Java, with only one species identified, A. bicolor bicolor [32]. The south coast of Central Java has many sloping estuaries where glass eels prefer to enter rivers. The Indian Ocean on southern Java Island also has many deep trenches preferred by these eels for mating and spawning [33]. Therefore, a massive exploitation of glass and adult eels has occurred in this region. Moreover, several eel aquacultures managed by fishermen have expanded rapidly to meet export demands. The eel fishing grounds in this region are spread across three watersheds: Citandui, Serayu, and Ijo [34] (Figure 2). In this region, the average annual rainfall reaches 3.444 mm/year, with monthly rainfall ranging from 734 mm during the dry season to 852 mm during the wet season, accompanied by an average monthly temperature of 26.7 °C [13]. Meanwhile, the pH conditions in this area are neutral (pH = 7), with salinity ranging between 0 and 4 ppt and dissolved oxygen (DO) levels approximately between 4 and 5.6 ppm. These water conditions are deemed ideal for the habitat of eels and fall within the normal range for glass eel migration [33].

2.2. CMSY Analysis

Stock assessment in a data-limited condition requires an approach to stock assessment and fishery management different from classical age-based models, which incorporate novel techniques for calculating fishery reference points when biological data are limited and catch/biomass time series lack [23]. Catch-only methods (COMs) are data-limited stock assessment methods that mainly use the time series data for catch or landing to estimate stock biomass status (e.g., B/BMSY or depletion) and other common fishery reference points and quantities [35]. One of the COMs that has been widely applied to assess stock status is the catch-based maximum sustainable yield (CMSY) method, which has been used in the assessment of global [36], regional [37,38,39,40,41,42], single species [43,44,45,46,47], and multispecies fisheries [42,48,49]. CMSY uses the Monte Carlo technique to predict fishery reference points (MSY, FMSY, and BMSY), relative stock size (B/BMSY), and exploitation (F/FMSY). This estimation relies on catch data and general assumptions regarding resilience or productivity (r) and stock status (B/k) at the start and conclusion of a temporal data set [23]. The CMSY has utility for short-term estimates, except for relatively flat harvest dynamic scenarios, probably because it uses more informative prior distributions and thus has more information for a short time series [25]. Hence, the CMSY may be more appropriate for fisheries in developing countries, where data collection programs have recently been initiated so that a short-term series of catches is only available.
A sequence of yields produced from the available biomass at a given productivity level can be used as time-series catch data. When two of the three variables—yield, biomass, or productivity—are available, the third variable can be estimated. Typical production models [50] use a catch-and-abundance time series to estimate productivity. In contrast, the CMSY method uses catch and productivity to estimate biomass, exploitation rate, MSY, and related fishery reference points. A Monte Carlo approach can search for probable ranges for the maximum intrinsic rate of population increase (r) and unexploited population size or carrying capacity (k) for identifying ‘feasible’ r–k pairs.
(i)
Initial r–k range determination
The resilience of A. bicolor bicolor in the FishBase is ‘low’ and converted as ranges for initial values of r at 0.05–0.5 (Table 1). Alternatively, the preliminary estimates of r can be calculated using the empirical relationships below [23]:
r 2 M 2 F M S Y 3 K 3.3 t g e n 9 t m a x
where r is the intrinsic growth of population; M is the natural mortality; FMSY is the fishing mortality that produces MSY; K is the rate of somatic growth derived from the von Bertalanffy growth equation; tgen is the generation time; and tmax is the maximum age.
Next, the initial range for ‘k’ can be estimated using the following Equations (2) and (3) [23]:
k l o w = max ( C ) r h i g h ;   k h i g h = 4 max ( C ) r l o w
k l o w = 2 max ( C ) r h i g h ;   k h i g h = 12 max ( C ) r l o w
where klow and khigh are the minimum and maximum limits of the preceding k-range; max(C) is the maximum recorded catch within the temporal data sequence; and rlow and rhigh are the minimum and maximum limits of the r values, respectively, determined by CMSY. Equation (2) is utilized when the initial biomass of the stock is depleted at the end of the temporal data sequence, whereas Equation (3) is used when the biomass is elevated.
(ii)
Estimating the initial ranges of relative biomass
The initial range of the relative biomass at the start and end of the temporal data sequence was estimated based on the fishery status classification (Table 2). Based on the annual catch data (Figure 2), it was assumed that the initial biomass range relative to the unexploited biomass (B/k) at the start of the catch temporal data sequence was lightly fished, whereas it was overfished at the end.
(iii)
Estimating likely reference points using feasible r–k pairs
CMSY randomly chooses an r–k pair from within the initial ranges of r and k to identify a feasible r–k pair. Following this, the initial biomass was selected from the preceding biomass range for the first year, and then the biomass of subsequent years was projected using Equations (4) and (5).
B t + 1 = B t + r B t ( 1 B t k ) + C t
where Bt+1 is the harvested biomass in year t + 1; k is the carrying capacity; r is the resilience; and Bt and Ct are the biomass and catches in year t, respectively. In cases of extensive depletion, when the biomass dropped below 1/4k, the prediction formula also included a linear reduction in surplus production, outlined as follows:
B t + 1 = B t + 4 B t k r 1 B t k B t C t     when   B t / k   <   0.25
where 4Bt/k emulates a gradual reduction in recruitment that falls under half the biomass that could produce MSY.
The r–k combinations and projected biomass paths were deemed feasible if the estimated biomass is not less than 0.01 k and remains within the prior biomass range for the middle and concluding years [23]. CMSY derived the most likely values for ‘r’ and ‘k’ from the ranges of the feasible r–k pairs, employing the default rules of the method. The fishery reference points were calculated as MSY = rk/4, fishing mortality aligned with MSY (FMSY) = 0.5r, and biomass-producing MSY (BMSY) = 0.5k [51]. The R code for the CMSY analysis was obtained from http://oceanrep.geomar.de/33076/ (accessed on 3 February 2022).

2.3. Stock Status and Recovery Scenarios

The CMSY analysis provides reference points that can be used to evaluate the stock status (Table 3). The output of the CMSY analysis can also be used to assess future stock status under several exploitation scenarios implemented in a modified Schaefer model, as follows:
B t + 1 B M S Y = B t B M S Y + 2   F M S Y B t B M S Y 1 B t 2 B M S Y B t B M S Y F t   w h e n   B t B M S Y   0.5
B t + 1 B M S Y = B t B M S Y + 4   F M S Y B t B M S Y 2 1 B t 2 B M S Y B t B M S Y F t   w h e n   B t B M S Y < 0.5
Four exploitation scenarios were implemented as follows: (1) at 0.5 FMSY, implying no fishing activity when the biomass falls below 0.5 BMSY (B < 0.5); otherwise, maintaining a fishing mortality rate (F) equal to 0.5 FMSY (F = 0.5 FMSY). (2) Under 0.6 FMSY, with F set at 0.6 FMSY when B ≥ 0.5 BMSY; however, F diminishes linearly to zero as the biomass declines below 0.5 BMSY. The reduced fishing mortality (Freduced) was computed using Equation (8) [38]. (3) The 0.8 FMSY exploitation scenario, where F equals 0.8 FMSY for B ≥ 0.5 BMSY; otherwise, F similarly diminishes linearly. (4) The 0.95 FMSY exploitation scenario, where F remains fixed at 0.95 FMSY.
F r e d u c e d = 2 F t   B t B M S Y
Changes in stock biomass and fishing catches were forecasted and compared across four fishing pressure scenarios. The catch in 2022 marked the initial point for the forecasted path, and the fishing pressure in 2022 determined the biomass and catch estimation for 2023–2024. Resource recovery was estimated within these four exploitation scenarios. All analyses were performed in R version 4.2.2 using the CMSY forecasting methodology [38], modified for a single-species fishery. The code was downloaded from https://github.com/SISTA16/cmsy_multispecies_forecast/ (accessed on 30 October 2023).

3. Results

3.1. CMSY Analysis

The outputs of the CMSY analysis on the eel fishery in Central Java are listed in Table 4.
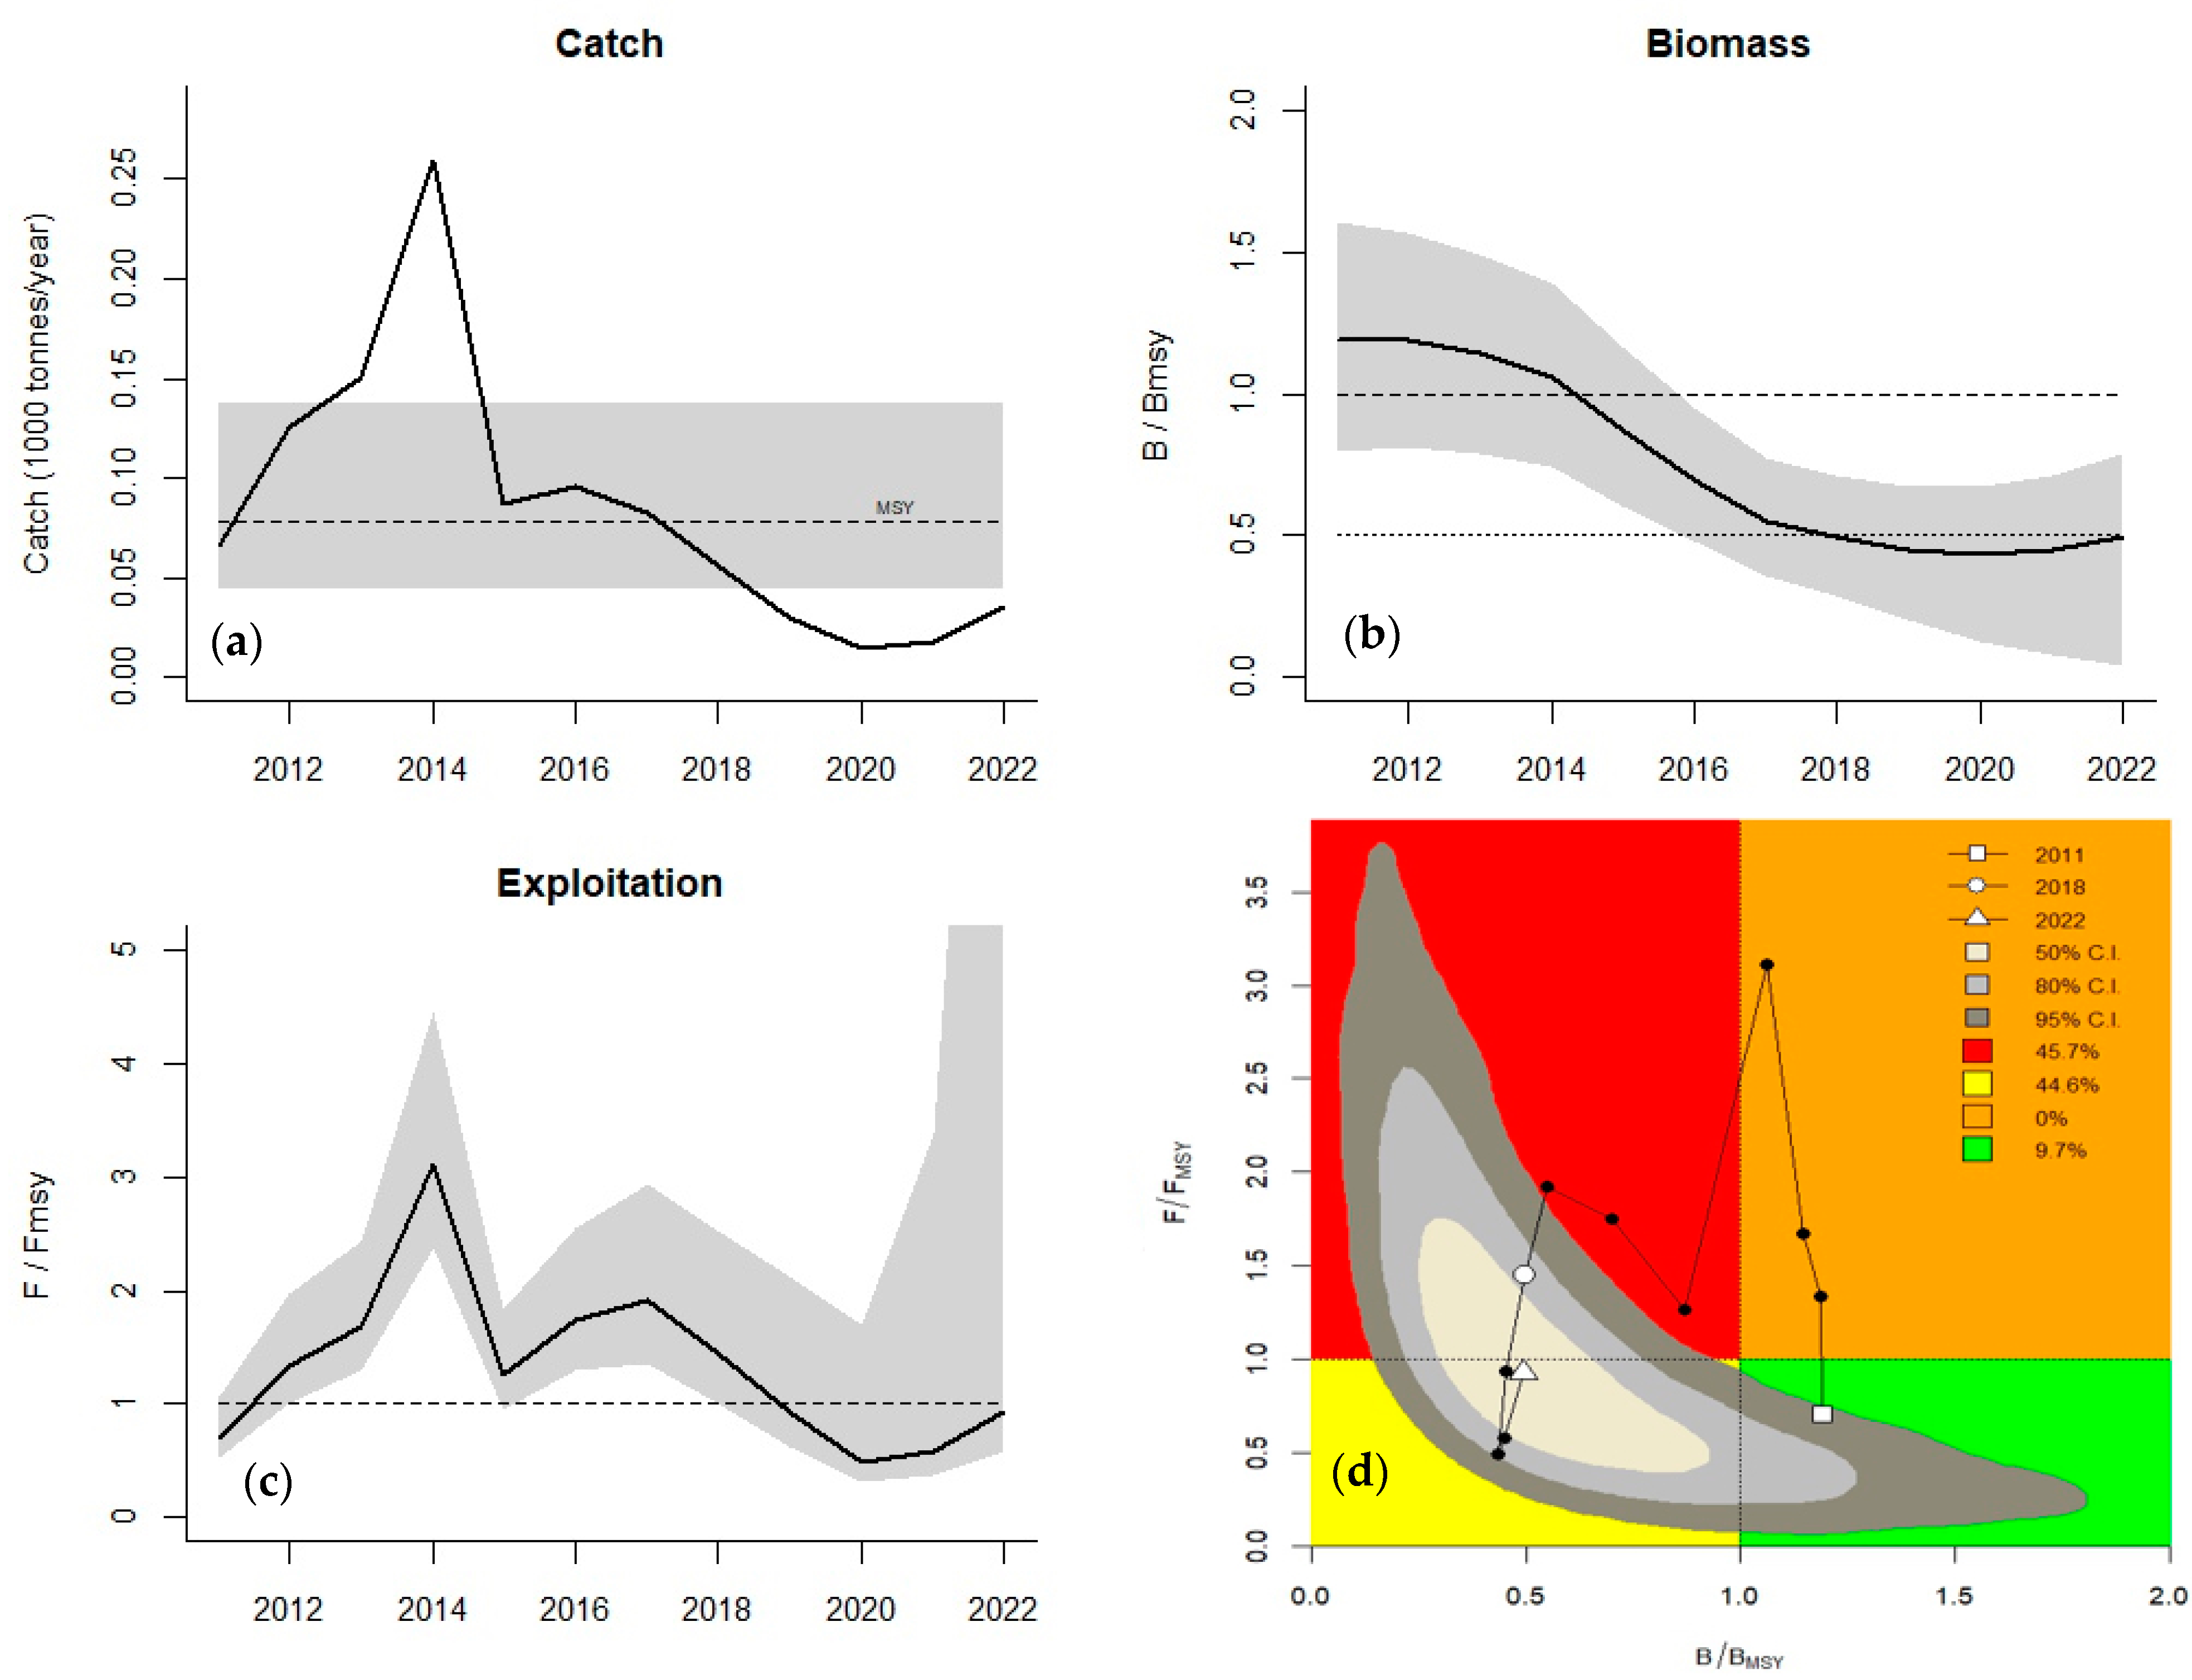
Based on the above estimates, the CMSY offered management insights for eel fisheries, as outlined in Table 5. Predicted MSY trends for eels suggested that sustainable harvesting rates were surpassed by 2012 and reached their highest point in 2014, which was more than 100% higher than expected (Figure 3a).
The results showed that fishing mortality in 2022 (0.13) was close to the figure that produced the MSY (FMSY = 0.141). For F/FMSY, a rapid upward movement was noted, crossing the sustainable threshold in 2012 and peaking in 2014 (Figure 3c). However, the exploitation (F/FMSY) dropped to 0.93 in the final year of the dataset, which was deduced to be the effect of the global pandemic in 2020–2021.
The biomass pattern affected by fishing mortality and recruitment peaked in 2011, steadily declined until 2014, and dropped below the BMSY threshold in 2019. This signifies a transitional phase for the stock, potentially leading to depletion if the present fishing mortality does not return to the FMSY. The B/BMSY path in Figure 3b indicates a steep decrease from 2014 that reaches a minimum in 2020, which is under the target reference point (B/BMSY = 0.495).
The Kobe plot depicts the concurrent growth of B/BMSY and F/FMSY (Figure 3d). The plot illustrates a swift decline in stock from the green zone in 2011 to the dangerous red zone from 2015 to 2018. The stock entered the recovery phase from 2019 until the end of the dataset because of reduced fishing pressure during the global pandemic. However, the stock trajectory was worrisome, returning to the red zone, which indicates a collapsing fishery.

3.2. Stock Status and Recovery Scenarios

From the fishery reference points produced by the CMSY analysis, the eel fishery stock status was in the recovery phase (B/BMSY = 0.5 and F/FMSY < 1). Under the four future predictive exploitation scenarios, the eel fishery showed biomass recovery by 2031, with catches remaining below the MSY until the end of the simulation year (Figure 4). The scenario with 0.5 FMSY exhibited the most rapid biomass recovery rate, whereas under the 0.95 FMSY scenario, the biomass would never recover to a sustainable level. Both the 0.6 FMSY and 0.8 FMSY scenarios produced a moderate biomass recovery rate, and these scenarios could recover the biomass in 2032 and 2036, respectively. However, both the forecasted biomass and catches exhibited significant uncertainty.

4. Discussion

Indonesia has led Southeast Asia in capturing anguillid eel fisheries and farming activities [8]. Notably, Japanese companies import these eels from Indonesia because of the decline in temperate eel production, elevating the significance of tropical anguillid eels in the global market [7]. The annual export value of these eels to Japan averages approximately USD 2.3 million [52]. Cilacap, located in Central Java Province, is a pivotal hub for yellow eel fishing in Indonesia and supplies the majority of elvers and yellow eels to the country’s eel farms [9]. To ensure the sustainable management and utilization of freshwater eel resources, comprehensive information regarding the status and trends of eel resources is of paramount importance.
In this study, a data-limited assessment model (CMSY) was employed to evaluate the stock status of A. bicolor along the southern coast of Central Java. The findings indicate a recovery phase for this stock after years of overexploitation until 2019, notably influenced by a significant decrease in fishing efforts during the COVID-19 pandemic (2020–2021). Nevertheless, the trajectory of the stock is cause for concern, as it has reverted to the red zone. Thus, a recovery plan should be implemented to prevent eel fisheries from collapsing. Simulation outcomes suggest that reducing fishing efforts by 50–80% of the FMSY could facilitate the rebuilding of eel stock to a sustainable level. However, scenarios 0.5 and 0.6 exhibit rapid stock rebuilding, surpassing biomass that produces the maximum sustainable yield (BMSY) but yields lower catch levels. Despite modeling uncertainties, the scenario of lowering fishing mortality to 80% of the FMSY strikes a balance between production and conservation objectives, achieving the quickest stock rebuilding with minimal catch loss over 13 years. However, managing fishing efforts remains one of the most challenging aspects of fishery management [53], understandably causing hesitation regarding this policy. Therefore, a potential shift for managers could be from effort control to establishing a total allowable catch (TAC) guided by a catch projection graph (Figure 4b).
Applying TAC (fishing quota) should be combined with size limitations specifically to protect spawning adults because the current study underscores that an overfished stock might experience a slow recovery, particularly evident in A. bicolor bicolor, which is unable to reach a sustainable level under the 0.95 FMSY scenario. Contrary to the common belief that F = FMSY offers optimal fishing pressure to rebuild fisheries [37], the results of this study challenge this notion, particularly for A. bicolor bicolor, which has a low intrinsic growth rate (r = 0.282). Moreover, freshwater eels display semelparous behavior, indicating that they undergo a single exhaustive spawning event at the end of their life cycle, making their reproductive potential highly sensitive to fishing pressure [4]. Thus, combining fishing quotas and size limitations could preserve a surplus of individuals that can complete their migration and spawning cycles [1]. In addition to fishing pressure, eel populations are also sensitive to climate change, which can significantly impact eel migration patterns, alter their access to suitable habitats, and affect their population dynamics [21]. Therefore, implementing additional management strategies beyond fishing effort reduction and fishing quotas is crucial, such as adaptable seasonal closures to align with the altered timing of eel migration due to changing environmental conditions. Habitat protection can also mitigate the impact of climate change on eel fisheries by providing stable environments for eels to reproduce and grow [54]. Integrating these approaches into fishery management is imperative to ensure the sustained recovery of eel stocks.
However, it is crucial to acknowledge that the approach and models utilized in this study rely heavily on assumptions regarding the life history traits and exploitation status of stocks. Notably, the CMSY model’s limitation in accounting for size and age structure might lead to overestimating sustainable productivity, especially in populations with disrupted structures due to excessive fishing pressure [38]. Therefore, future research could be conducted to accommodate these factors for better estimation results. Moreover, the forecasting algorithm assumes the static nature of evolving fishing strategies. In future research, this issue could be further explored using system modeling, such as agent-based and system dynamics models, to depict the complex and nonlinear dynamics inherent in fishery systems, providing a more nuanced representation of the interplay between various factors influencing stock dynamics, fishing practices, environmental variables, and policy impacts. For instance, an agent-based model can create simulated individual agents representing fishermen with diverse behaviors, decision-making processes, and interactions with the environment to explore in more detail the impact of different fishing strategies on stock dynamics [55,56]. Meanwhile, a system dynamics model can explore feedback loops, delays, and nonlinear relationships between factors such as fishing effort, environmental variables, market demand, and fishing policies to understand their potential impacts on stock and fish population dynamics [57,58].

5. Conclusions

This assessment of the status of eel fisheries along the southern coast of Central Java can serve as a guide for fishery management. The CMSY model revealed a decline in biomass despite low fishing efforts, indicating a recovery phase for this stock. Immediate protective actions are necessary to restore this stock; otherwise, its decline will be exacerbated, making recovery more challenging. Decreasing fishing pressure is likely to facilitate the restoration of stocks to a sustainable level, and greater reductions in fishing pressure would accelerate their recovery. Despite the potential years of reduced catch during the rebuilding phase, the regenerated stock should generate heightened yields and financial advantages.

Supplementary Materials

The following supporting information can be downloaded at: https://www.mdpi.com/article/10.3390/su16041578/s1, Table S1: The number of annual catch of the eel fishery in Central Java.

Author Contributions

Conceptualization, S.N.; investigation, S.N.; resources, S.N.; data curation, S.N.; formal analysis, S.N.; methodology, S.N.; writing—original draft, S.N.; writing—review and editing, T.U. and S.N.; visualization, S.N.; supervision, T.U.; project administration, T.U.; funding acquisition, T.U. All authors have read and agreed to the published version of the manuscript.

Funding

This work was funded by the JSPS KAKENHI (grant number 23H03609).

Institutional Review Board Statement

Not applicable.

Data Availability Statement

The data presented in this study are available in the article and supplementary material.

Acknowledgments

We are grateful for the assistance of the administrative officers of the local government.

Conflicts of Interest

The authors declare no conflicts of interest.

References

  1. Jellyman, D.J. An enigma: How can freshwater eels (Anguilla spp.) be such a successful genus yet be universally threatened? Rev. Fish Biol. Fish. 2021, 32, 701–718. [Google Scholar] [CrossRef]
  2. Gollock, M.; Shiraishi, H.; Carrizo, S.; Crook, V.; Levy, E. Status of Non-CITES Listed Anguillid Eels; ZSL: London, UK, 2018; p. 176. [Google Scholar]
  3. Arai, T. Do we protect freshwater eels or do we drive them to extinction? SpringerPlus 2014, 3, 534. [Google Scholar] [CrossRef] [PubMed]
  4. Arai, T. Sustainable Management of Tropical Anguillid Eels in Southeast Asia. In Natural Resources Conservation and Advances for Sustainability; Elsevier: Amsterdam, The Netherlands, 2022; pp. 461–480. ISBN 978-0-12-822976-7. [Google Scholar]
  5. FAO. FAO Fishery and Aquaculture Statistics—Yearbook 2020; FAO: Rome, Italy, 2023; ISBN 978-92-5-138107-6. [Google Scholar]
  6. SEAFDEC. Enhancing Sustainable Utilization and Management Scheme of Tropical Anguillid Eel Resources in Southeast Asia; Southeast Asian Fisheries Development Center: Bangkok, Thailand, 2019; p. 139. [Google Scholar]
  7. Muthmainnah, D.; Honda, S.; Suryati, N.K.; Prisantoso, B.I. Fish for the People; Southeast Asian Fisheries Development Center: Bangkok, Thailand, 2016; pp. 19–25. [Google Scholar]
  8. Suryati, N.K.; Pamungkas, Y.P.; Muthmainnah, D. Fish for the People; Southeast Asian Fisheries Development Center: Bangkok, Thailand, 2019; pp. 19–24. [Google Scholar]
  9. Muthmainnah, D.; Suryati, N.K.; Pamungkas, Y.P.; Mulyani, Y.S. Fish for the People; Southeast Asian Fisheries Development Center: Bangkok, Thailand, 2020; pp. 37–42. [Google Scholar]
  10. Honda, S.; Muthmainnah, D.; Suryati, N.K.; Oktaviani, D.; Siriraksophon, S.; Amornpiyakrit, T.; Prisantoso, B.I. Current Status and Problems of the Catch Statistics on Anguillid Eel Fishery in Indonesia. Mar. Res. Indones. 2016, 41, 1–14. [Google Scholar] [CrossRef]
  11. DKP. Jawa Tengah Statistik Perikanan Tangkap Jawa Tengah; Dinas Perikanan dan Kelautan: Semarang, Indonesia, 2020. [Google Scholar]
  12. Dinas Perikanan. Cilacap Statistik Perikanan Tangkap Perairan Laut Dan Umum Darat; Dinas Perikanan: Kabupaten Cilacap, Indonesia, 2022. [Google Scholar]
  13. Boesono, H.; Fitri, A.D.P.; Kurohman, F.; Jayanto, B.B. Modifikasi Bubu Paralon untuk Penangkapan Ikan Sidat (Anguila bicolor) di Perairan Segara Anakan, Kabupaten Cilacap; UNDIP Press: Semarang, Indonesia, 2020; ISBN 978-979-097-695-5. [Google Scholar]
  14. Hakim, A.A.; Kamal, M.M.; A Butet, N.; Affandi, R. Species composition of Freshwater Eels (Anguilla spp.) in Eight Rivers Flowing to Palabuhanratu Bay, Sukabumi, Indonesia. J. Ilmu dan Teknol. Kelaut. Trop. 2016, 7, 573–586. [Google Scholar] [CrossRef]
  15. Kuroki, M.; Miller, M.J.; Tsukamoto, K. Diversity of early life-history traits in freshwater eels and the evolution of their oceanic migrations. Can. J. Zool. 2014, 92, 749–770. [Google Scholar] [CrossRef]
  16. Hewavitharane, C.A.; Pickering, T.D.; Rico, C.; Mochioka, N. Early life history of tropical freshwater eels (Anguilla spp.) recruiting to Viti Levu, Fiji Islands, in the western South Pacific. Mar. Freshw. Res. 2020, 71, 452–460. [Google Scholar] [CrossRef]
  17. Harrison, A.J.; Walker, A.M.; Pinder, A.C.; Briand, C.; Aprahamian, M.W. A review of glass eel migratory behaviour, sampling techniques and abundance estimates in estuaries: Implications for assessing recruitment, local production and exploitation. Rev. Fish Biol. Fish. 2014, 24, 967–983. [Google Scholar] [CrossRef]
  18. Rahmadya, A.; Ridwansyah, I.; Daruati, D.; Rahmat, A.; Triyanto; Dewi, A.P.; Wildan, D.M. A Systematic Literature Review of the Methodology Preference for Analyzing Eel (Anguilla spp.) Habitat. Chiang Mai Univ. J. Nat. Sci. 2022, 21, e2022023. [Google Scholar] [CrossRef]
  19. Ye, Y.; Cochrane, K.; Bianchi, G.; Willmann, R.; Majkowski, J.; Tandstad, M.; Carocci, F. Rebuilding global fisheries: The World Summit Goal, costs and benefits. Fish Fish. 2012, 14, 174–185. [Google Scholar] [CrossRef]
  20. Bell, J.D.; Watson, R.A.; Ye, Y. Global fishing capacity and fishing effort from 1950 to 2012. Fish Fish. 2017, 18, 489–505. [Google Scholar] [CrossRef]
  21. Righton, D.; Piper, A.; Aarestrup, K.; Amilhat, E.; Belpaire, C.; Casselman, J.; Castonguay, M.; Díaz, E.; Dörner, H.; Faliex, E.; et al. Important questions to progress science and sustainable management of anguillid eels. Fish Fish. 2021, 22, 762–788. [Google Scholar] [CrossRef]
  22. Free, C.M.; Jensen, O.P.; Wiedenmann, J.; Deroba, J.J. The refined ORCS approach: A catch-based method for estimating stock status and catch limits for data-poor fish stocks. Fish. Res. 2017, 193, 60–70. [Google Scholar] [CrossRef]
  23. Froese, R.; Demirel, N.; Coro, G.; Kleisner, K.M.; Winker, H. Estimating fisheries reference points from catch and resilience. Fish Fish. 2016, 18, 506–526. [Google Scholar] [CrossRef]
  24. Punt, A.E.; Smith, D.C.; Smith, A.D.M. Among-stock comparisons for improving stock assessments of data-poor stocks: The “Robin Hood” approach. ICES J. Mar. Sci. 2011, 68, 972–981. [Google Scholar] [CrossRef]
  25. Rossenberg, A.A.; Fogarty, M.J.; Cooper, A.B.; Dickey-Collas, M.; Fulton, E.A.; Hyde, K.J.W.; Ye, Y. Developing New Approaches to Global Stock Status Assessment and Fishery Production Potential of the Seas; FAO Fisheries and Aquaculture Circular; FAO: Rome, Italy, 2014; ISBN 978-92-5-107992-8. [Google Scholar]
  26. Thorson, J.T.; Minto, C.; Minte-Vera, C.V.; Kleisner, K.M.; Longo, C. A new role for effort dynamics in the theory of harvested populations and data-poor stock assessment. Can. J. Fish. Aquat. Sci. 2013, 70, 1829–1844. [Google Scholar] [CrossRef]
  27. Zhou, S.; Punt, A.E.; Smith, A.D.M.; Ye, Y.; Haddon, M.; Dichmont, C.M.; Smith, D.C. An optimized catch-only assessment method for data poor fisheries. ICES J. Mar. Sci. 2017, 75, 964–976. [Google Scholar] [CrossRef]
  28. Hordyk, A.R.; Ono, K.; Prince, J.D.; Walters, C.J. A simple length-structured model based on life history ratios and incorporating size-dependent selectivity: Application to spawning potential ratios for data-poor stocks. Can. J. Fish. Aquat. Sci. 2016, 73, 1787–1799. [Google Scholar] [CrossRef]
  29. Rudd, M.B.; Thorson, J.T. Accounting for variable recruitment and fishing mortality in length-based stock assessments for data-limited fisheries. Can. J. Fish. Aquat. Sci. 2018, 75, 1019–1035. [Google Scholar] [CrossRef]
  30. Froese, R.; Winker, H.; Coro, G.; Demirel, N.; Tsikliras, A.C.; Dimarchopoulou, D.; Scarcella, G.; Probst, W.N.; Dureuil, M.; Pauly, D. A new approach for estimating stock status from length frequency data. ICES J. Mar. Sci. 2018, 75, 2004–2015. [Google Scholar] [CrossRef]
  31. Froese, R.; Winker, H.; Coro, G.; Demirel, N.; Tsikliras, A.C.; Dimarchopoulou, D.; Scarcella, G.; Palomares, M.L.D.; Dureuil, M.; Pauly, D. Estimating stock status from relative abundance and resilience. ICES J. Mar. Sci. 2019, 77, 527–538. [Google Scholar] [CrossRef]
  32. Affandi, R. Pengembangan Sumberdaya Ikan Sidat (Anguilla spp.) Di Indonesia. In Teknologi Pengembangan Perikanan dan Kelautan untuk Memperkuat Ketahanan Pangan serta Memacu Perekonomian Nasional Secara Berkelanjutan; IPB Press: Bogor, Indonesia, 2016; pp. 153–198. ISBN 978-979-493-918-5. [Google Scholar]
  33. Indrawati, A.; Anggoro, S.; Suradi, W.S. Pemetaan Potensi Ikan Sidat (Anguilla bicolor bicolor) Pada Perairan Sungai Di Kabupaten Purworejo. In Proceedings of the Hasil-Hasil Penelitian Perikanan dan Kelautan, June 2016; pp. 669–679. Available online: http://eprints.undip.ac.id/51329/1/89._(F)_Ayuningtyas_Indrawati_-_Pemetaan_Potensi_Ikan_Sidat_(Anguilla_bicolor_bicolor)_pada.pdf (accessed on 13 September 2022).
  34. Taufiq-Spj, N.; Santos, G.W.; Suryono, S.; Ambariyanto, A. New Perspective of Java Eel Conservation: Case Study in Cilacap Riverine and Coastal Area, Central Java, Indonesia. Egypt. J. Aquat. Biol. Fish. 2023, 27, 671–685. [Google Scholar] [CrossRef]
  35. Free, C.M.; Jensen, O.P.; Anderson, S.C.; Gutierrez, N.L.; Kleisner, K.M.; Longo, C.; Minto, C.; Osio, G.C.; Walsh, J.C. Blood from a stone: Performance of catch-only methods in estimating stock biomass status. Fish. Res. 2019, 223, 105452. [Google Scholar] [CrossRef]
  36. Costello, C.; Ovando, D.; Clavelle, T.; Strauss, C.K.; Hilborn, R.; Melnychuk, M.; Branch, T.A.; Gaines, S.D.; Szuwalski, C.S.; Cabral, R.; et al. Global fishery prospects under contrasting management regimes. Proc. Natl. Acad. Sci. USA 2016, 113, 5125–5129. [Google Scholar] [CrossRef]
  37. Demirel, N.; Zengin, M.; Ulman, A. First Large-Scale Eastern Mediterranean and Black Sea Stock Assessment Reveals a Dramatic Decline. Front. Mar. Sci. 2020, 7, 103. [Google Scholar] [CrossRef]
  38. Froese, R.; Winker, H.; Coro, G.; Demirel, N.; Tsikliras, A.C.; Dimarchopoulou, D.; Scarcella, G.; Quaas, M.; Matz-Lück, N. Status and rebuilding of European fisheries. Mar. Policy 2018, 93, 159–170. [Google Scholar] [CrossRef]
  39. Liu, Y.; Fu, H.; Wang, L.; Lin, L.; He, G.; Fu, P.; Wang, C.; Zhang, Y.; Kang, B. Fishery Status and Rebuilding of Major Economic Fishes in the Largest Freshwater Lake in China Based on Limited Data. Fishes 2022, 7, 47. [Google Scholar] [CrossRef]
  40. Musinguzi, L.; Bassa, S.; Natugonza, V.; Van Steenberge, M.; Okello, W.; Snoeks, J.; Froese, R. Assessment of exploited fish species in the Lake Edward System, East Africa. J. Appl. Ichthyol. 2021, 37, 216–226. [Google Scholar] [CrossRef]
  41. Wang, L.; Lin, L.; Liu, Y.; Zhai, L.; Ye, S. Fishery Dynamics, Status, and Rebuilding Based on Catch-Only Data in Coastal Waters of China. Front. Mar. Sci. 2022, 8, 757503. [Google Scholar] [CrossRef]
  42. Zhang, K.; Zhang, J.; Xu, Y.; Sun, M.; Chen, Z.; Yuan, M. Application of a catch-based method for stock assessment of three important fisheries in the East China Sea. Acta Oceanol. Sin. 2018, 37, 102–109. [Google Scholar] [CrossRef]
  43. Alam, M.S.; Liu, Q.; Nabi, R.-U.; Al-Mamun, A. Fish Stock Assessment for Data-Poor Fisheries, with a Case Study of Tropical Hilsa Shad (Tenualosa ilisha) in the Water of Bangladesh. Sustainability 2021, 13, 3604. [Google Scholar] [CrossRef]
  44. Falsone, F.; Scannella, D.; Geraci, M.L.; Gancitano, V.; Vitale, S.; Fiorentino, F. How Fishery Collapses: The Case of Lepidopus caudatus (Pisces: Trichiuridae) in the Strait of Sicily (Central Mediterranean). Front. Mar. Sci. 2021, 7, 584601. [Google Scholar] [CrossRef]
  45. Ferragut-Perello, F.; Ramírez-Amaro, S.; Tsikliras, A.C.; Petit-Marty, N.; Dimarchopoulou, D.; Massutí, E.; Serrat, A.; Ordines, F. Exploitation and Conservation Status of the Thornback Ray (Raja clavata) in the Balearic Islands (Western Mediterranean). Fishes 2023, 8, 117. [Google Scholar] [CrossRef]
  46. Sultana, R.; Liu, Q.; Al-Mamun, A.; Barman, P.P.; Shamsuzzaman, M.; Barua, S. Estimating Stock Status and Biological Reference Points of the Sardine Fishery Using the Surplus Production Model from the Bay of Bengal, Bangladesh. J. Mar. Sci. Eng. 2023, 11, 944. [Google Scholar] [CrossRef]
  47. Winker, H.; Carvalho, F.; Sharma, R.; Parker, D.; Kerwath, S. Initial Results for North and South Atlantic Shortfin Mako (Isurus oxyrinchus) Stock Assessments Using the Bayesian Surplus Production Model Jabba and The Catch-Resilience Method CMSY. Collect. Vol. Sci. Pap. 2017, 74, 1836–1866. [Google Scholar]
  48. Liang, C.; Xian, W.; Pauly, D. Assessments of 15 Exploited Fish Stocks in Chinese, South Korean and Japanese Waters Using the CMSY and BSM Methods. Front. Mar. Sci. 2020, 7, 623. [Google Scholar] [CrossRef]
  49. Zhai, L.; Liang, C.; Pauly, D. Assessments of 16 Exploited Fish Stocks in Chinese Waters Using the CMSY and BSM Methods. Front. Mar. Sci. 2020, 7, 483993. [Google Scholar] [CrossRef]
  50. Schaefer, M. Some aspects of the dynamics of populations important to the management of the commercial marine fisheries. Bull. Math. Biol. 1991, 53, 253–279. [Google Scholar] [CrossRef]
  51. Ricker, W.E. Computation and Interpretation of Biological Statistics of Fish Populations; Department of the Environment, Fisheries and Marine Service: Ottawa, ON, Canada, 1975; ISBN 978-0-662-01440-9. [Google Scholar]
  52. Muthmainnah, D.; Suryati, N.K.; Fahmi, Z.; Ruchimat, T.; Ame, E.C.; Soe, T.M.; Thruong, G.P. Fish for the People; Southeast Asian Fisheries Development Center: Bangkok, Thailand, 2022; pp. 30–34. [Google Scholar]
  53. Hilborn, R.; Walters, C.J. Quantitative Fisheries Stock Assessment; Springer: Boston, MA, USA, 1992; ISBN 978-1-4020-1845-9. [Google Scholar]
  54. A Hakim, A.; Kamal, M.M.; A Butet, N.; Affandi, R. Determination of fisheries refugia area for freshwater eels (Anguilla spp.) in Palabuhanratu bay, West Java, Indonesia. IOP Conf. Series Earth Environ. Sci. 2020, 404, 012014. [Google Scholar] [CrossRef]
  55. Wijermans, N.; Schlüter, M. Agent-Based Case Studies for Understanding of Social-Ecological Systems: Cooperation on Irrigation in Bali. In Proceedings of the 9th Conference of the European Social Simulation Association, Warsaw, Poland, 16–20 September 2013; pp. 295–305. [Google Scholar]
  56. Williams, B.C.; Criddle, K.R.; Kruse, G.H. An agent-based model to optimize transboundary management for the walleye pollock (Gadus chalcogrammus) fishery in the Gulf of Alaska. Nat. Resour. Model. 2021, 34, e12305. [Google Scholar] [CrossRef]
  57. Duer-Balkind, M. Resilience, Social-Ecological Rules, and Environmental Variability in a Two-Species Artisanal Fishery. Ecol. Soc. 2013, 18, 50. [Google Scholar] [CrossRef]
  58. Pouso, S.; Borja, Á.; Martín, J.; Uyarra, M.C. The capacity of estuary restoration to enhance ecosystem services: System dynamics modelling to simulate recreational fishing benefits. Estuarine Coast. Shelf Sci. 2018, 217, 226–236. [Google Scholar] [CrossRef]
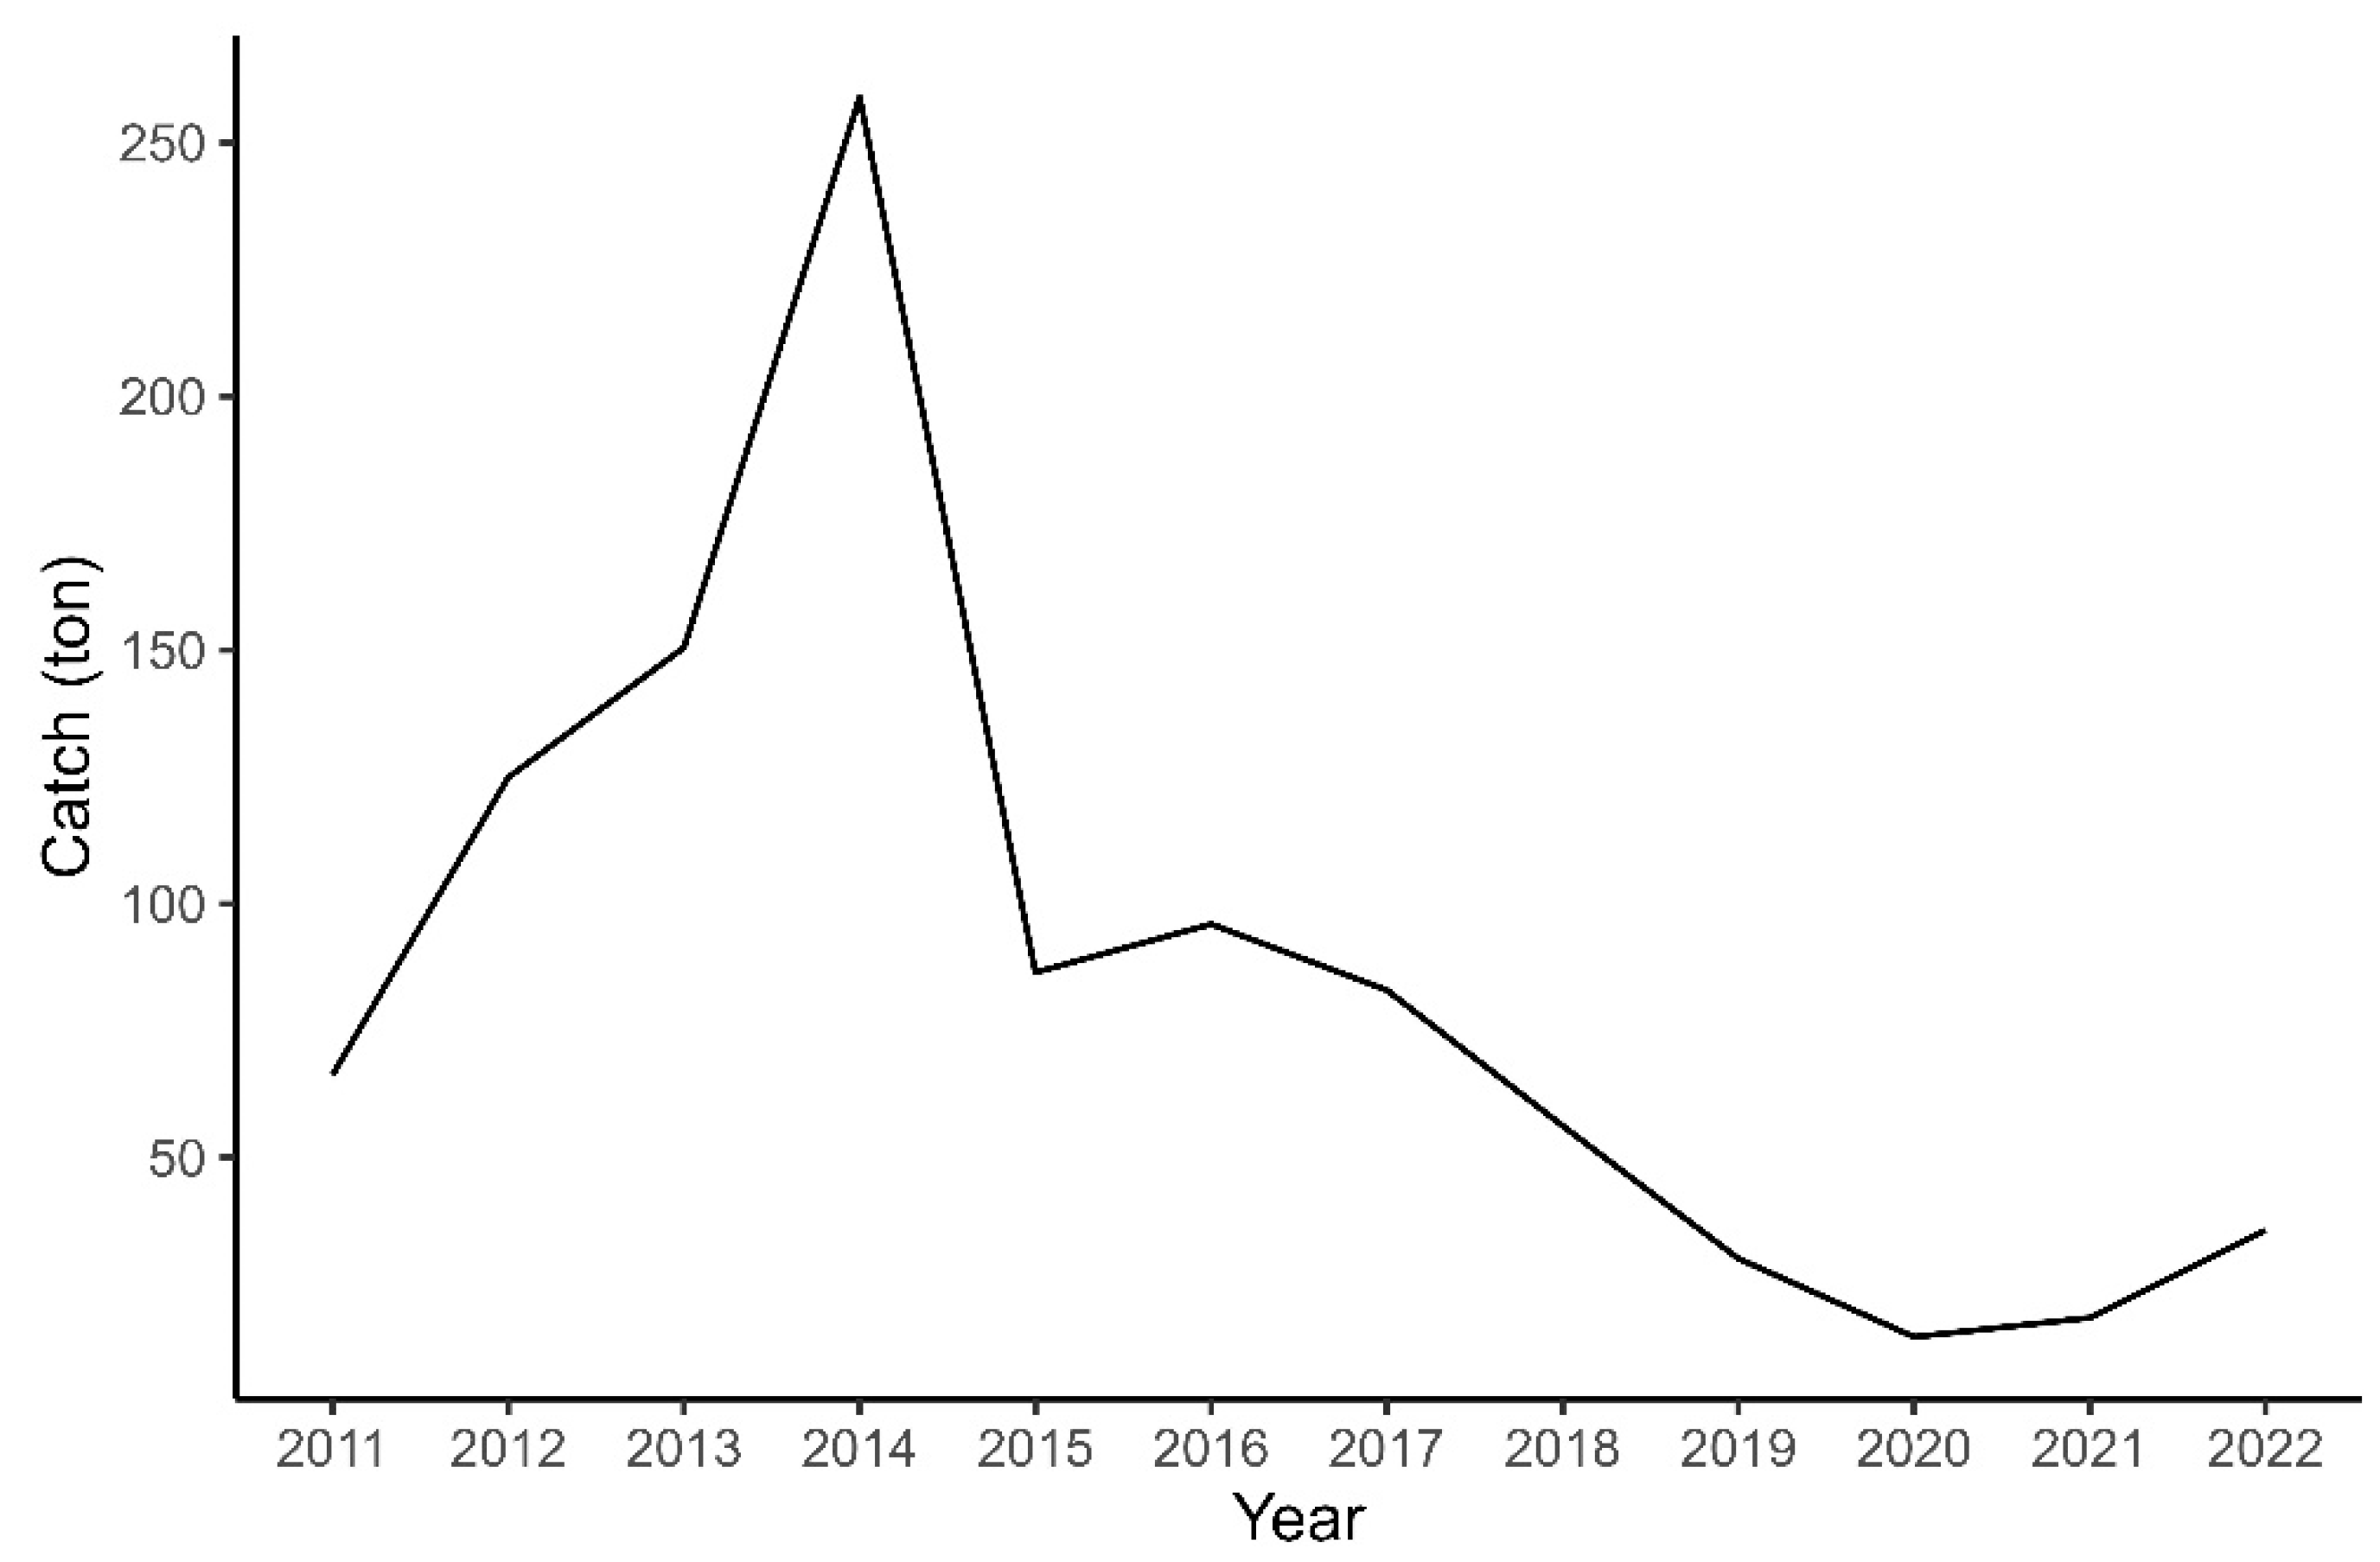
Figure 1. Annual catch of the eel fishery in Central Java.
Sustainability 16 01578 g001
Figure 2. Map of the eel fishing grounds on the southern coast of Central Java.
Sustainability 16 01578 g002
Figure 3. Schematic output of CMSY analysis on the eel fishery in Central Java. (a) catches depicted over time compared to the estimated MSY in CMSY, accompanied by a 95% confidence interval (shaded in gray); (b) the trend of relative biomass (B/BMSY); (c) the trend of exploitation (F/FMSY); (d) Kobe plot depicting the concurrent growth of exploitation (F/FMSY) and the relative biomass (B/BMSY) with 50% (yellow), 80% (grey), and 95% (brown) confidence intervals. The green area delineates the fishery’s secure zone, where MSY is achieved through sustainable fishing pressure and a robust biomass; the orange zone signals impending overfishing risk as a result of heightened fishing pressure on the stock’s biomass; the red area represents the exhausted stock biomass incapable of generating MSY due to persistent overexploitation; and the yellow zone denotes the recovery stage characterized by decreased fishing pressure.
Sustainability 16 01578 g003
Figure 4. Simulation results of four scenarios to recover the eel fishery. Projection of (a) biomass to reach BMSY at different scenarios and (b) catch during the simulation of four scenarios.
Sustainability 16 01578 g004
Table 1. Initial ranges for parameter r.
ResilienceInitial r Range
High0.6–1.5
Medium0.2–0.8
Low0.05–0.5
Very low0.015–0.1
Table 2. Initial ranges of relative biomass as inputs [23].
Strongly OverfishedOverfishedOptimum FishedLightly Fished
0.01–0.20.01–0.40.2–0.60.4–0.8
Table 3. Stock status based on fishery reference points [46].
B/BMSYF/FMSYStock Status
≥1<1Healthy stock
0.5–1.0<1Recovering stock
<0.5<1Stock beyond safe biological limits
0.5–1.0>1Overfished stock
0.2–0.5>1Stock beyond safe biological limits
<0.2>1Severely depleted stock
Table 4. Fishery parameters with their 95% confidence intervals.
ParametersValue95% CI
r (1/year)0.2820.163–0.487
k (103 MT)1.1120.483–2.554
MSY (103 MT)0.0780.045–0.137
FMSY (1/year)0.1410.082–0.244
BMSY (103 MT)0.5560.242–1.277
Table 5. Management information for the eel fishery.
ParametersValue95% CI
Biomass in the last year0.2750.021–0.438
B/BMSY in the last year0.5 0.038–0.787
Fishing mortality in the last year0.13 0.082–1.683
Exploitation F/FMSY0.930.584–12.056
Disclaimer/Publisher’s Note: The statements, opinions and data contained in all publications are solely those of the individual author(s) and contributor(s) and not of MDPI and/or the editor(s). MDPI and/or the editor(s) disclaim responsibility for any injury to people or property resulting from any ideas, methods, instructions or products referred to in the content.