Review

Global Patterns in Construction and Demolition Waste (C&DW) Research: A Bibliometric Analysis Using VOSviewer

by
Emina Kristina Petrović
* and
Caroline Ann Thomas
Wellington School of Architecture, Te Herenga Waka—Victoria University of Wellington, Te Aro Campus, Wellington 6011, New Zealand
*
Author to whom correspondence should be addressed.
Sustainability 2024, 16(4), 1561; https://doi.org/10.3390/su16041561
Submission received: 13 December 2023 / Revised: 30 January 2024 / Accepted: 8 February 2024 / Published: 12 February 2024

Abstract

:
C&DW is contributing to exceeding all planetary boundaries and presents a range of other issues. In order to better understand the existing research on C&DW, a global bibliographic analysis was undertaken through seven groups of keyword searches of Scopus and the results visualised using VOSviewer. The study identifies phases in discussion of C&DW in terms of volume and themes and examines how search terms influence what is found. The results show that C&DW receives only a modest research attention compared to other areas of waste, and this is despite an exponential increase in C&DW research since 2016. The analyses also show that concrete is the most researched material in terms of C&DW, and that reuse, recycling, and circular economy are so far attracting only proportionally modest research attention. This signals a need for further acceleration of the C&DW research, and specifically for more research on reuse, recycling, and circular economy for materials other than concrete. One important finding are differences observed when using different search terms related to C&DW, which suggests that single search studies might provide limited insights.

1. Introduction

In recent years, the generation of construction and demolition waste (C&DW) has been rapidly increasing due to population growth and the global acceleration of construction activities [1]. Construction and demolition waste (C&DW) has been defined by the US EPA as ‘the waste generated by all activities carried out during the construction, maintenance, demolition, and deconstruction of any type of building and civil work, or during natural disasters’ [2]. In the 1990s, the UK Construction Industry Research and Information Association (CIRIA) reported that the construction and demolition sites generated around 70 million metric tons of waste in UK, annually [3]. Around the same time, the US Environmental Protection Agency (EPA) estimated that the US generated around 120 million tons of C&DW, also annually [4]. But these figures rose two- to five-fold, and by 2018, in the UK, the Department for Environment, Food and Rural Affairs (DEFRA) estimated that C&DW had reached 138 million metric tons and, in the US, the US EPA estimated this had reached 600 million tons [2,5]. China is estimated to produce the most C&DW globally, with 1.13 billion metric tons of waste produced in 2014 [6,7]. Globally, it is estimated that C&DW totalled about 1.68 kg per person per day in 2018 [8]. It is also estimated that global waste generation will double by 2025 compared to the year 2000, and that by 2050 it will double compared to 2016 [1]. Another area of concern is the lack of waste data from developing regions [9,10,11].
Despite variations in waste generation data, and criticism of the data’s accuracy, it is generally agreed that the construction industry accounts for around 30–40% of global solid waste production, indicating that industry is one of largest sole generators of waste [1,12,13,14,15,16]. However, C&DW presents a range of other adverse impacts, also. Among those, C&DW is usually landfilled, rather than being separated or recycled [14,17]. Illegal dumping also occurs [9,14]. Landfilling and illegal dumping not only consume a large amount of land resources, but also can pose a large risk of environmental pollution [17]. Human health is also of concern, as the pollutants and gas emissions from the waste risk adverse health effects [14,18]. It is also estimated that, due to the current levels of solid waste, 2.5 billion people worldwide do not have adequate sanitation [19]. Combined with these issues of waste disposal is the limited level of recycling and conservation of resources as a substitute for further raw material extraction [20]. The material extraction and the material processing create various types of emissions and pollutants which cause serious strain on the environment [21]. Although effort is already invested into these areas, more needs to be achieved.
This context indicates that C&DW is a rapidly growing and unsustainable problem, and therefore it is important to understand better the issue and gaps in research in order to support development of more effective solutions. This article presents the results of a global bibliometric review of research on C&DW, and evaluates if it is possible to identify key high-level patterns in global C&DW research. The primary aims are to establish if it is possible to identify phases in discussion of C&DW, evaluate how the discussed themes are changing over time, but also evaluate how the used search terms influence what is found.
The article provides context on the existing C&DW research in Section 2, context on the existing bibliometric research in Section 3, methodology in Section 4, reports results and findings in Section 5, followed by the discussion in Section 6, and a conclusion.

2. Context for C&DW Research

There is a range of issues associated with C&DW. Broadly those could be divided into issues associated with the unsustainable impacts C&DW present on the planet, and issues with managing and reducing these adverse impacts. This section provides a background for a range of core issues facing C&DW considerations.

2.1. Planetary Boundaries and C&DW

C&DW can be seen to adversely affect all the planetary boundaries, harming a range of fragile balances. Humans have been identified as the main driver for global environmental change, and our current activities are estimated to disrupt planetary systems, creating an unstable environment with irregular temperatures, freshwater availability, and biochemical flows [22]. These are described through the planetary boundary framework [22,23]. Rockström et al., introduced the idea in 2009 and refined the thresholds in 2023. The nine boundaries are: (1) atmospheric CO2 concentration; (2) rate of biodiversity loss; (3) levels of novel anthropogenic introductions to the planetary systems; (4) levels of ocean acidification; (5) biochemical flows (which currently considers the levels of nitrogen and phosphorus); (6) percentage of land system change; (7) levels of available fresh water; (8) atmospheric aerosol loading; and (9) levels of ozone depletion [22,23]. These thresholds can be valuable to sustainable reviews, as they allow a quantifiable analysis of the areas of sustainability.
The most noticeable impacts from the C&DW is through the novel anthropogenic introductions of synthetic chemicals and substances, radioactive materials, or genetically modified organisms to the environment [23]. The boundary for this novel anthropogenic introduction, without adequate safety testing, is zero [23]. Construction and demolition materials include heavy metals, organic matter and synthetic chemicals (plastics, paints, and glues) which all contaminate soil and groundwater [17,18]. The anaerobic degradation of C&DW produces CO2 and methane which also leads to soil, water and air pollution and can cause adverse effects to human health [14,18,24]. It is also currently estimated that C&DW has over 200 different dioxin compounds which alone causes a range of major impacts to the environment and human health [25].
Another large impact of C&DW to the planetary boundaries can be seen in CO2 concentrations. The planetary boundary for CO2 concentration is 350 ppm, which has been set to maintain an internationally agreed atmospheric temperature of 1.5 °C [23]. However, as of 2022, the concentration is at 417 ppm [23]. It is estimated that construction and demolition activities contribute up to 50% of greenhouse gas emissions (largely CO2) [21,25,26]. A further creator of CO2 are the landfills from the anaerobic degradation of materials [24]. A follow-on consequence of these concentrations of CO2 is an increased level of ocean acidification [23,25]. Landfill waste can also cause eutrophication, which creates an increase of levels of nitrogen and phosphorus, damaging the natural balance of biochemical flows [25].
The boundary for biodiversity loss is 10 species per million species per year, but as of 2009 this has exceeded a loss of 100 species per million species per year [19]. It is estimated that 90% of biodiversity loss is associated with the extraction of raw materials and water stress, and a large proportion of these is estimated used in construction [21,26,27]. The extraction of raw materials, as well as occupancy of land and dumping, landfilling sites, also affects the boundary of land system change [17,24,25]. This boundary focuses on the percentage of forest biome cover, which is 15% below the threshold and is continuing to decrease [23]. The extraction of forest biomes for building materials or for human use are contributing factors [23,25]. The boundary around freshwater use defines the level of available clean water for the ecosystem and has been exceeded over a century ago [23]. Buildings are estimated to consume a global average of 30% of fresh water over their entire lifecycle for use in material extraction, manufacturing, construction, and occupation [25]. Demolition waste is also a polluter of freshwater [21,24,26]. The final two planetary boundaries are the levels of ozone depletion and atmospheric aerosol loading [23]. These are mainly affected by construction actives, rather than demolition, through the use of foam blowing (i.e., spray foam insulation), halons (in fire suppressants), and bituminous aerosols and polycylic aromatic hydrocarbons from asphalt and fossil fuel emissions [25].
Construction and demolition activities and the resulting waste are contributing to the degradation and the transgression of the boundaries, and this should be seen as part of their high environmental cost. This signals a high level of urgency for more sustainable construction and demolition practices and provide a quantifiable level of ‘sustainability’ that needs to be reached for the safety of the environment and human life on Earth.

2.2. Material Flows: Extraction, Construction, Waste

There is a range of reasons why raw material extraction has been increasing, but primarily this is because of global population growth and the rise of consumption and industrialization levels throughout the world [21,28,29]. The global population has doubled since the 1970s, and the global gross value of produced goods and services (GDP) has quadrupled [21]. In part, this quadrupling of the global GDP is explained by the middle-income countries (like China and India) catching up with the higher-income countries in terms of material consumption [30]. The growth trends in raw material extraction can also be closely related to GDP, as a growing GDP leads to an increase in infrastructure and construction requirements [29]. Therefore, the levels of global material extraction have followed a similar trend to fuel these growing levels of consumption [28,29]. From 1970 to 2017, the annual global extraction of raw materials has tripled to reach 97 gigatons [21]. It is estimated that the construction industry consumes between 40% and more than 50% of global raw materials [28,31].
A material flow analysis can be used to form an understanding of the expected levels of end-of-life waste associated with construction and demolition activities. Material flows, analysed through a material flow analysis (MFA) is a method that has been growing in interest to predict growth or decline in waste and to estimate waste beyond what is statistically reported [32]. This method analyses the materials that are entering the economy as a way to estimate the amounts that will later come out of use. Generally, the reported input materials are larger than the reported output [33], due to materials which stay in use. This difference is called Net Additions to Stock (NAS) and is used to estimate the potential future waste [32]. Because buildings last for a long time and used to be built to last for centuries [34], construction materials are considered to dominate NAS [32].
Following this principle of MFA, and considering the eventual additions to waste from NAS, exponential levels of waste can be expected due to the exponential increases in the global consumption of materials.
This range of complex issues provides compelling reasons for the need of further research and active reductions of C&DW. In order to understand the context better, this article reports on the results of a global review of research on C&DW.

3. Context of Bibliometric Research on C&DW

Bibliometric reviews have been used in numerous academic studies to map the evolution of the literature, and is gaining polarity with the growing comprehensiveness of modern network visualising software [35]. This section summarises that field.

3.1. Global Increases in Research

Alongside the other global increases is an increase in the production of research [36]. Fire and Guestrin published an analysis of academic publishing metrics from the combination of the Microsoft Academic Graph, AMiner and SCImago Journal Ranking datasets [36]. The study analysed >120 million papers and >20,000 journals and observed that over the last few decades, the numbers of publications have considerably increased. The analysis observed that in 1990, around 200,000 papers were published, in 2000 around 450,000 papers, in 2010 around 1.1 million papers, and by 2014 >7 million papers had been published; no data after 2014 was provided [36]. From 1990 to 2014, a 3400% increase in publications can be seen. Broken down, this is a 125% increase from 1990 to 2000, a 144% increase from 2000 to 2010, and a steep 530% increase from 2010 to 2014 [36]. Fire and Guestrin’s analysis reported a steady increase from 2000 to 2010, and a steep increase from 2010 to 2014 [36].
These increases are comparable to the increases seen in the numbers of C&DW publications. Table 1 summarises the level of increase in publications on C&DW as reported by existing reviews. Each of these reviews reports that they have observed a significant increase in the volume of publications on C&DW, which on average ranges between 20% and 115% per year.
Table 1 also shows that across most of the reviews, two general periods can be observed, a slower minor to moderate level of development and a period of rapid development. Although the dates identified by these researches somewhat vary, overall this summary suggests that the minor to moderate development took place from around 2000 to around 2013–2015, while rapid development can be observed from around 2013–2015.

3.2. Existing Previous C&DW Bibliometric Reviews

In order to establish the extent of existing availability of bibliometric reviews on C&DW, a scientific literature review was undertaken by searching Scopus using the following terms: ‘construction AND demolition AND waste AND bibliometri*’, ‘construction AND demolition AND waste AND bibliometri*’, and ‘construction AND demolition AND waste AND bibliometri*’, and resulted in a total of 75 items after doubles were removed. Two of those were rebuttals and replies to one of the articles, and one was more than ten years old, and those were therefore removed. Of the remaining 72 items, 41 were reviews, 24 were articles, and 8 were conference papers published between 2011 and 2024. The publication of these bibliometric works started to increase in 2021 from one to two publications per year to several, and in 2023 reached 46 publications.
Upon review of the titles and abstracts, 59 were removed because 25 focused on specific materials and locations or were more general discussions about materials; 21 had too narrow focus, such as prefabrication, deconstruction, circular economy, LCA or digital tools; and 13 had a focus not strongly related to C&DW. The remaining 14 publications were reviewed, and their key characteristic are summarised in Table 2.
Majority of these reviews examined in detail citation patterns, and patterns associated around which authors, organisations and countries produced the research. By comparison, keyword analyses were given less attention. This review did not identify any studies which examined differences in findings due to different search terms; rather, reviews either used just one search term, or brought into one group results from a set of searches using one or more database. Web of Science appears to have been used more often that Scopus and other databases. Another relevant characteristic is that half of the reviews were based on fewer than 500 publications, and only 3 studies worked with more than 1000 publications. This is because most of the studies included a set of steps to remove less directly related articles from the review.
As part of setting the scene for the article presented here, it is useful to briefly summarise a sample of discussions found in these review articles. The review from Li et al. [17] was completed in response to previous reviews having subjective evaluations, with small sample sizes and lacked visual representations. The review concluded that a large research focus has been placed on the recycling of materials, and noted a gap in technical solutions for the reduction and re-use [17]. It was also noted that analyses should be extended to include the whole life-cycle process and that more emphasis should be placed on the different kinds of C&DW. The review by Wang and Zhong [37] focused on the phase of exponential publications that they observed from 2013 onwards, as they noted that previous reviews had rather investigated the research before this period. The most relevant guidance provided by this review was that a larger emphasis should be placed on the disparities between the industrial practices and academic research, as well as more wholistic views of the lifecycle of C&DW that includes human behaviour and culture [37]. The Wu et al. [18] review was completed in response to past reviews providing an unclear evolution of C&DW research and aimed to analyse weather the C&DW discipline was reshaped in response to past research. The most significant guidance provided from this review was that a deeper understanding of the interdisciplinary lifecycle flow of C&DW is needed to address the management of this waste [18]. Jin et al. [14] completed a bibliometric review with similar reasoning to the Wu et al. [18] review. It concluded that more emphasis should be placed on C&DW during the planning and design phase, and that a more comprehensive understanding of C&DW is needed from a lifecycle point of view [14]. An emphasis was placed on the need for a comparison of C&DW management practices between developed and developing countries for a wholistic global understanding [14]. Elshaboury et al. [35] completed a bibliometric review with the aim to provide a robust framework for future research paths. The review concluded that a greater understanding of the material life-cycle flow is needed, combined with a greater understanding of the management programs or incentives within this flow [35]. The effectiveness of these strategies should be compared, as well as a deeper understanding of the global social, economic and environmental effects of these strategies [35].
What is noticeable from this review is a relatively limited overlaps between the objectives and conclusions of the existing reviews. The majority of these reviews exhibit some narrowing of focus, and often work with relatively modest numbers of articles for bibliographic studies of a couple of hundreds. It is also possible to observe that more could be done through the analysis of keywords and an absence of a comparisons of the outcomes from different but similar searches. Jointly, these characteristics signal a need for a high-level review of research activities which use a comparison of results obtained from a range of different search term items, gives keywords higher prominence, and aims to describe the key patterns in the global C&DW. It is especially important to examine potential slippages generated when comparing results from similar but different search terms, which should create more robust results overall. Therefore, this article reports on the findings of one such review.

4. Methodology

VOSviewer version 1.6.19 was used for the analysis due to the comprehensiveness of the software. It provides immediate digital 2D bibliometric graphs with the distance-based approach. It has been widely used to assist in the review of topics such as system dynamic applications, building information modelling (BIM) and construction safety management and technologies, but also for some reviews of C&DW. More generally, VOSviewer is one of the software systems that help navigate emerging area of bibliometric research as a way of navigating the significant increase in publication and availability of information [10,46,47,48,49]. VOSviewer is optimised for larger quantities of articles, which makes it suitable for review of the large number of publications on C&DW.
VOSviewer has been designed for three general scientific databases: Scopus, Web of science, and the PubMed biomedical database [49]. PubMed was ruled out because it is a biomedical database, and therefore it is less likely to contain articles about C&DW. The Scopus database was chosen over Web of Science because Scopus has a wider global range of articles than Web of Science [50] and Scopus is the largest citation database for multidisciplinary scientific literature [51,52].
VOSviewer was used to analyse seven searches from the Scopus database. The results of these searches were imported into the software to create a bibliographic visualisation of nodes, links and clusters. This allowed for the analysis of a large quantity of biometric networks from each search. VOSviewer displays the nodes, links, and clusters as 2D graphs with a distance-based approach; this is a tradition that has been used for visualising bibliographic networks since 1974 by Griffith et al. [53,54,55]. Nodes appear as different sized circles with labels; links appear and lines between these nodes; and clusters are the colours of the node groups [49]. The nodes are highly occurring elements extracted from the publications in the search, such as the keywords, publication country, author details. The size of the nodes depict the frequency with which these elements occur, larger nodes are more frequent occurrences. The distance between the nodes indicates their relatedness, with a smaller distance between nodes indicating the elements are more closely related, and more commonly found in the same articles, than nodes at larger distances between these. As well as distance, the nodes are clustered by colour, indicating sets of closely related nodes. The links indicate the relationships between these nodes, with a thicker line indicating a stronger relationship than a thinner line.

4.1. Search Strategies

Multiple searches were used in order to avoid the main limitation of a singular search of overly narrow focus, and also to enable an analysis of the differences in results obtained through variations in search terms. When preparing search terms the aim was to approach C&DW from a reasonably broad range of perspectives in order to potentially identify if the area of C&DW appears different depending on the search approach taken.
The undertaken review focused on seven searches defined through groups of keywords. Table 3 summarises the core characteristic of each search, which Boolean terms were used, when was the search completed, which range of publication dates were found and how many publications were found.
All searches were completed during the first half of 2023, and no set date limits were used, which means that the publication date range shows when publications in this area started (assuming digitalisation of paper-based publications is fully completed). Each set of search terms was developed to target a particular possible area of publications, and their specific rationales are introduced at the start of sections reporting on the results of that particular search. Each search was capturing a reasonably large body of the literature, ranging from 1003 to 19,693 publications (Table 3).

4.2. Visualisations

For each search, a set of four visualisations (A–D) was prepared showing: (A) the quantity of publications per year; (B) overlay visualisation of the publication countries over time; (C) co-occurrence of keywords; and (D) overlay visualisation of the co-occurrence of keywords over time. The overlay visualisations show chronological patterns in publications [56]. This is where the colour of the nodes represents the year when these elements occurred the most. The patterns visualised through the 2D network maps produced by VOSviewer are reported, discussed, and linked to other research in the area. Only the top 30–60 occurring nodes, either keywords or countries, are displayed in each visualisation. This number of was chosen after experimenting with the software to produce the most legible diagrams. As a consequence, there was a range of different thresholds of occurrence used. A full report on the process and intermediate data is provided in the Supplementary Material.
To eliminate doubles and similar terms appearing separately, e.g., ‘LCA’ vs. ‘Life Cycle assessment’, avoiding multiple nodes of the same keyword, a thesaurus file was used for consistent all searches. This informed the software of any keywords that had the same meaning and provided accuracy around the keyword occurrence (see Supplementary Material for this thesaurus).

4.3. Opportunities and Limitations

By tapping into the noted characteristics, this analysis achieves a higher-level perspective of the current state of research within the field of C&DW than what has been previously provided. This produces a more comprehensive high-level map of the current research to measure progress within the field, identify emerging trends, and identify research gaps. This allows future researchers to gain insight into the conceptual, social, and intellectual structure of the research to inform their steps forward. However, it is also relevant to acknowledge that a global approach could lead to averaging of smaller and more localised trends, and the results from this analysis should not be taken as directly applicable to local contexts.
Any analysis using bibliometric software such as VOSviewer can be seen as vulnerable to quantitative biases, especially language and size bias. It is designed to use databases which are dominated by scholarship in English (92.64% for Scopus, and 95.37% for Web of Science), and it is estimated that these exclude 19–38% of non-English articles [55]. Further to that, larger countries or countries with better research support could quantitatively stand out. Therefore, in the results which follow it is reasonable to expect that research from English speaking countries, more populous countries, and those with better research funding will stand quantitatively out. Finally, because the searches were not limited in terms of time, it is possible that some of the more established, but older, areas of research will come through more compared to more emerging areas.
Because the search was undertaken early in 2023, all (A) figures present data up to 2022, in order to avoid creating a false appearance of a drop in publications.

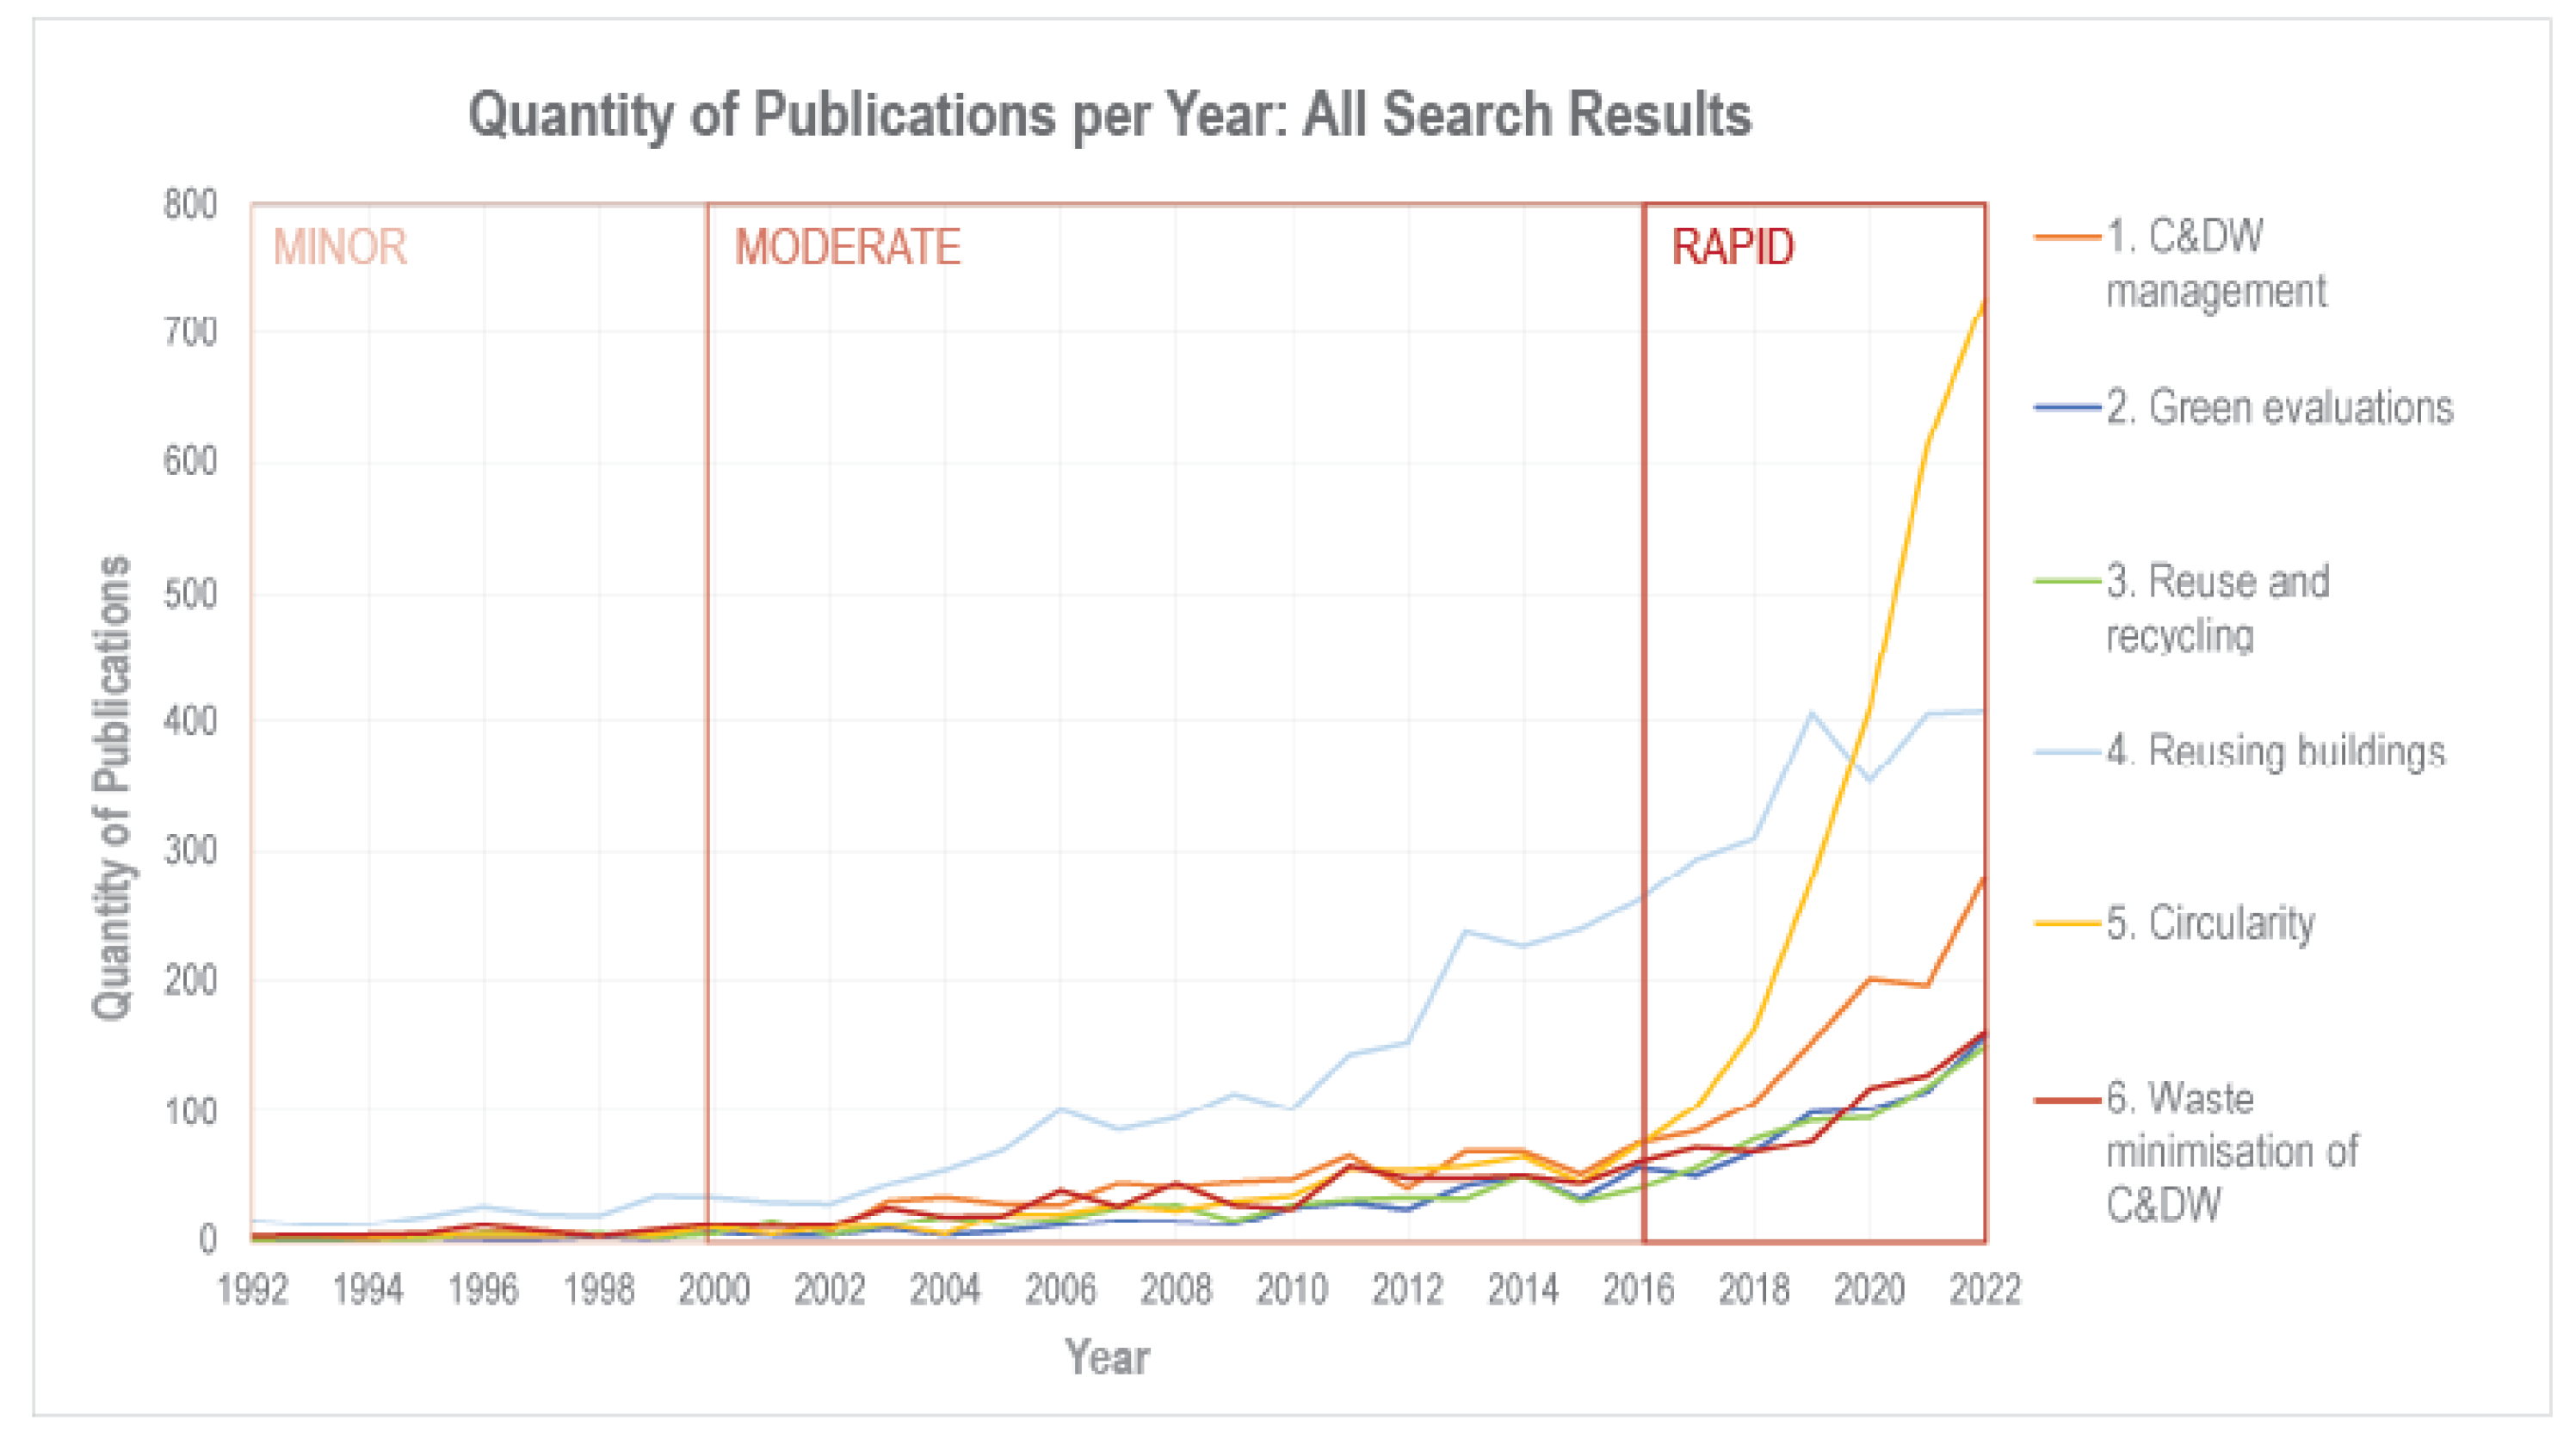
5. Results and Findings

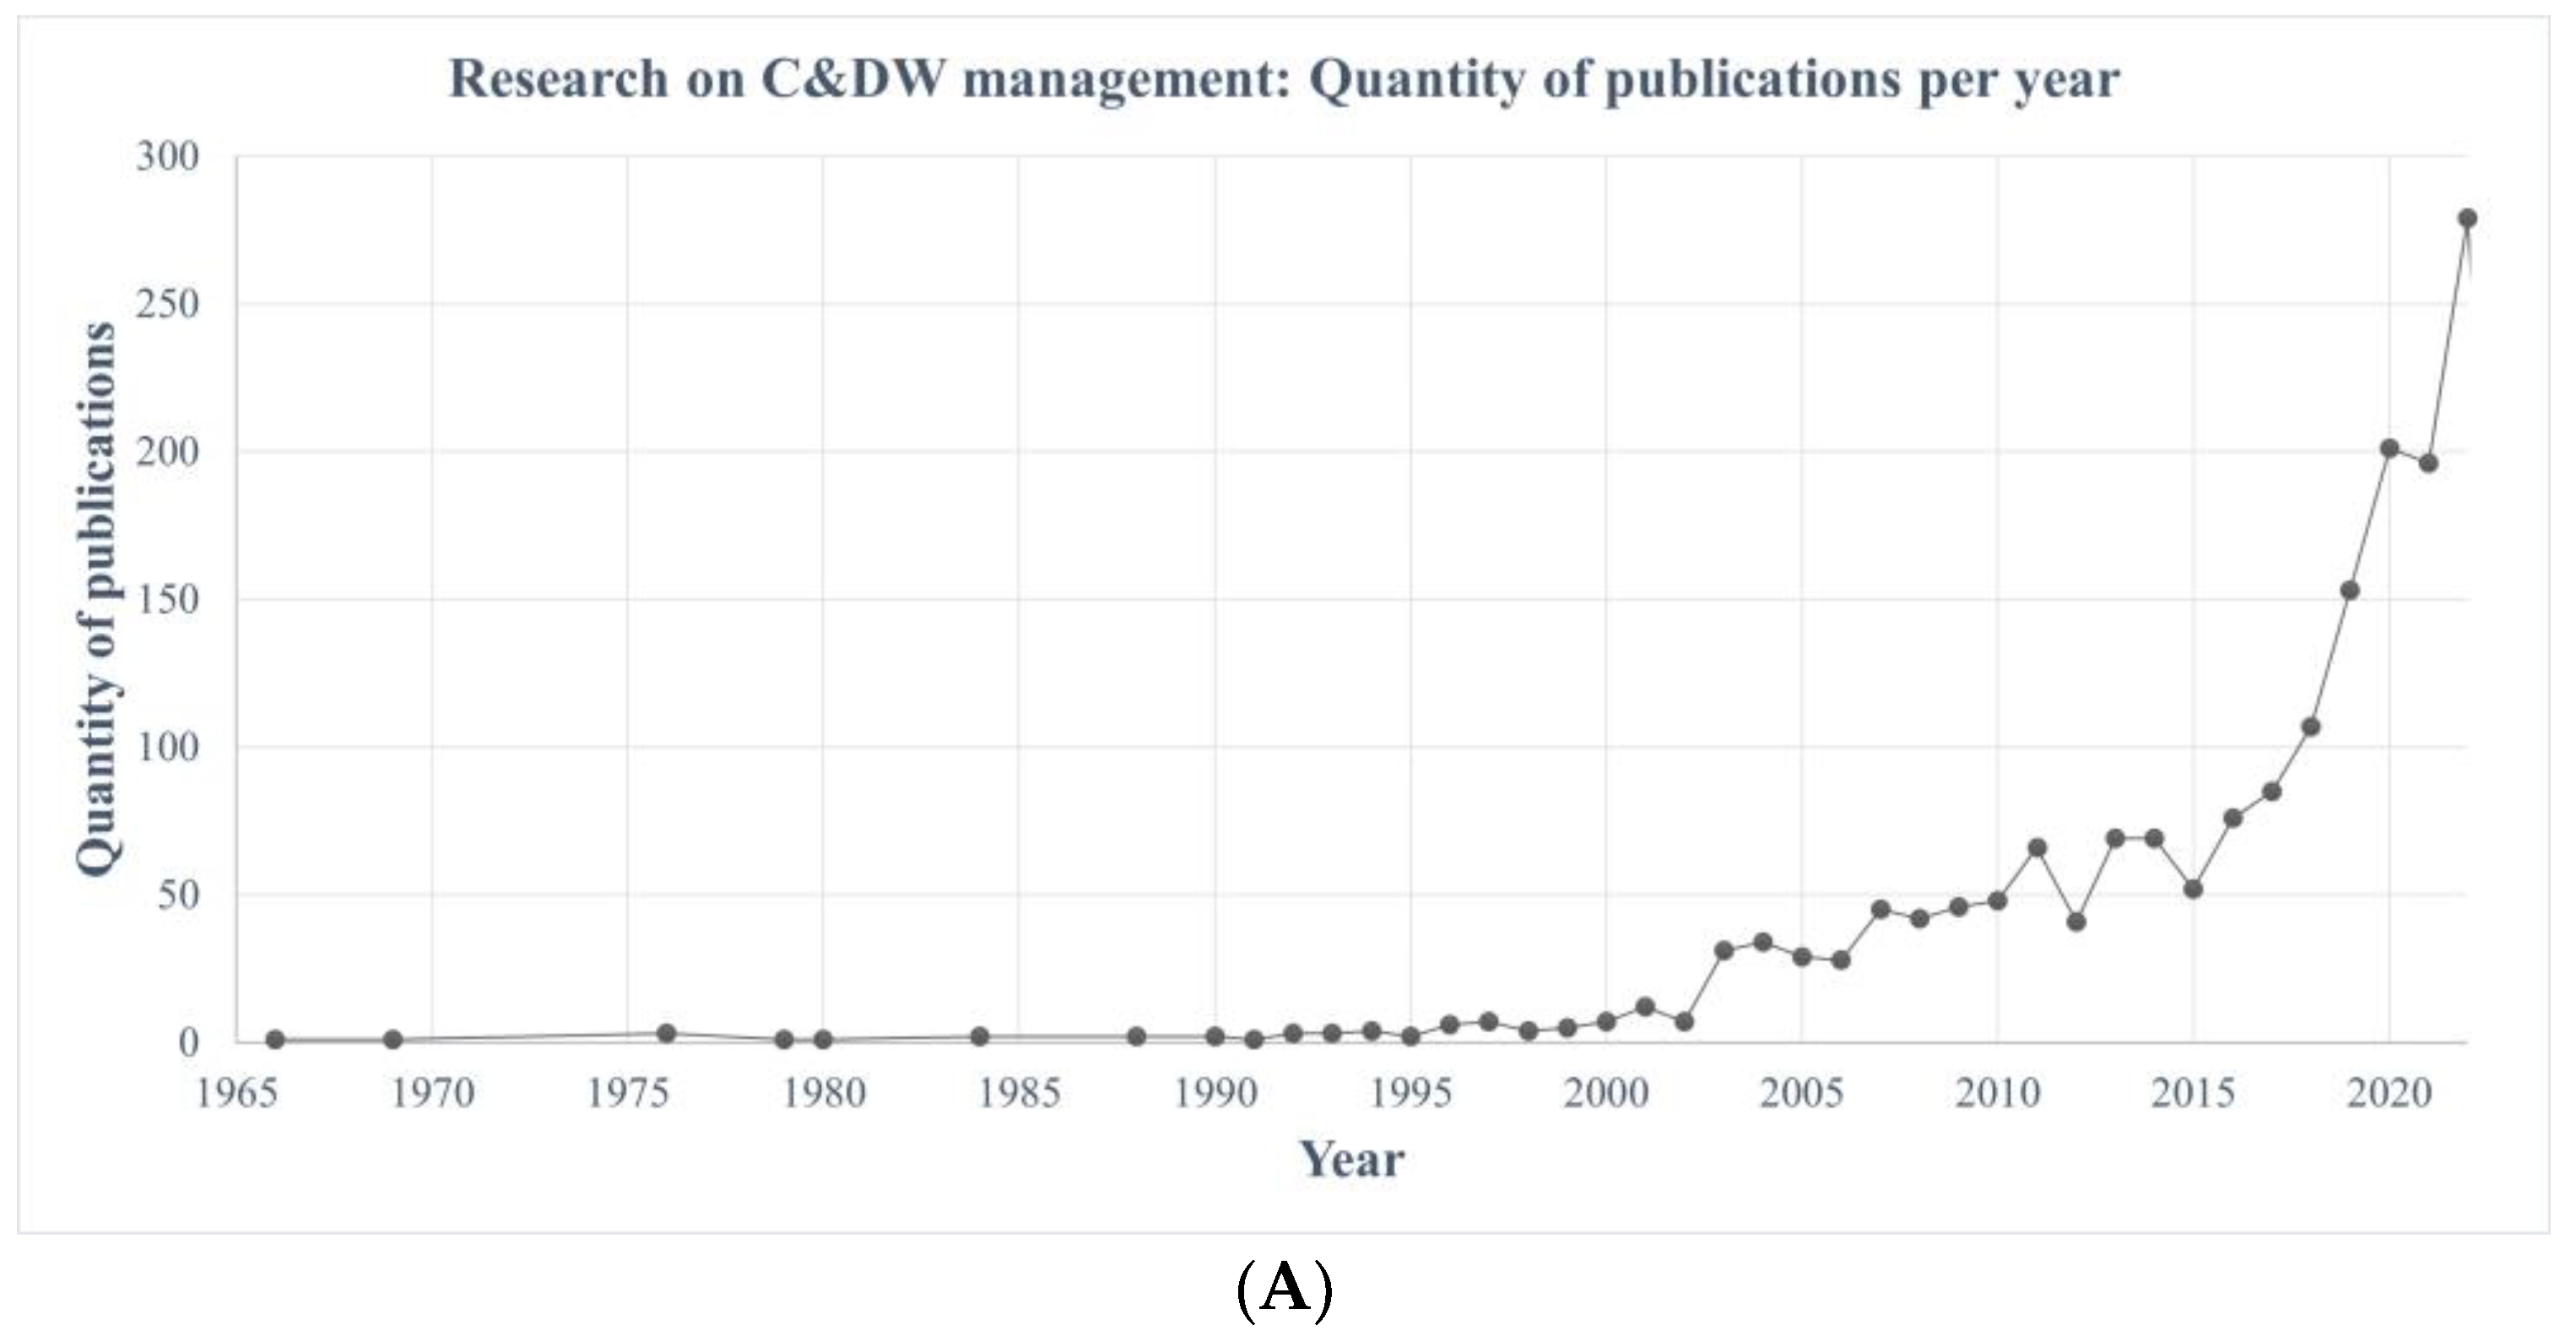
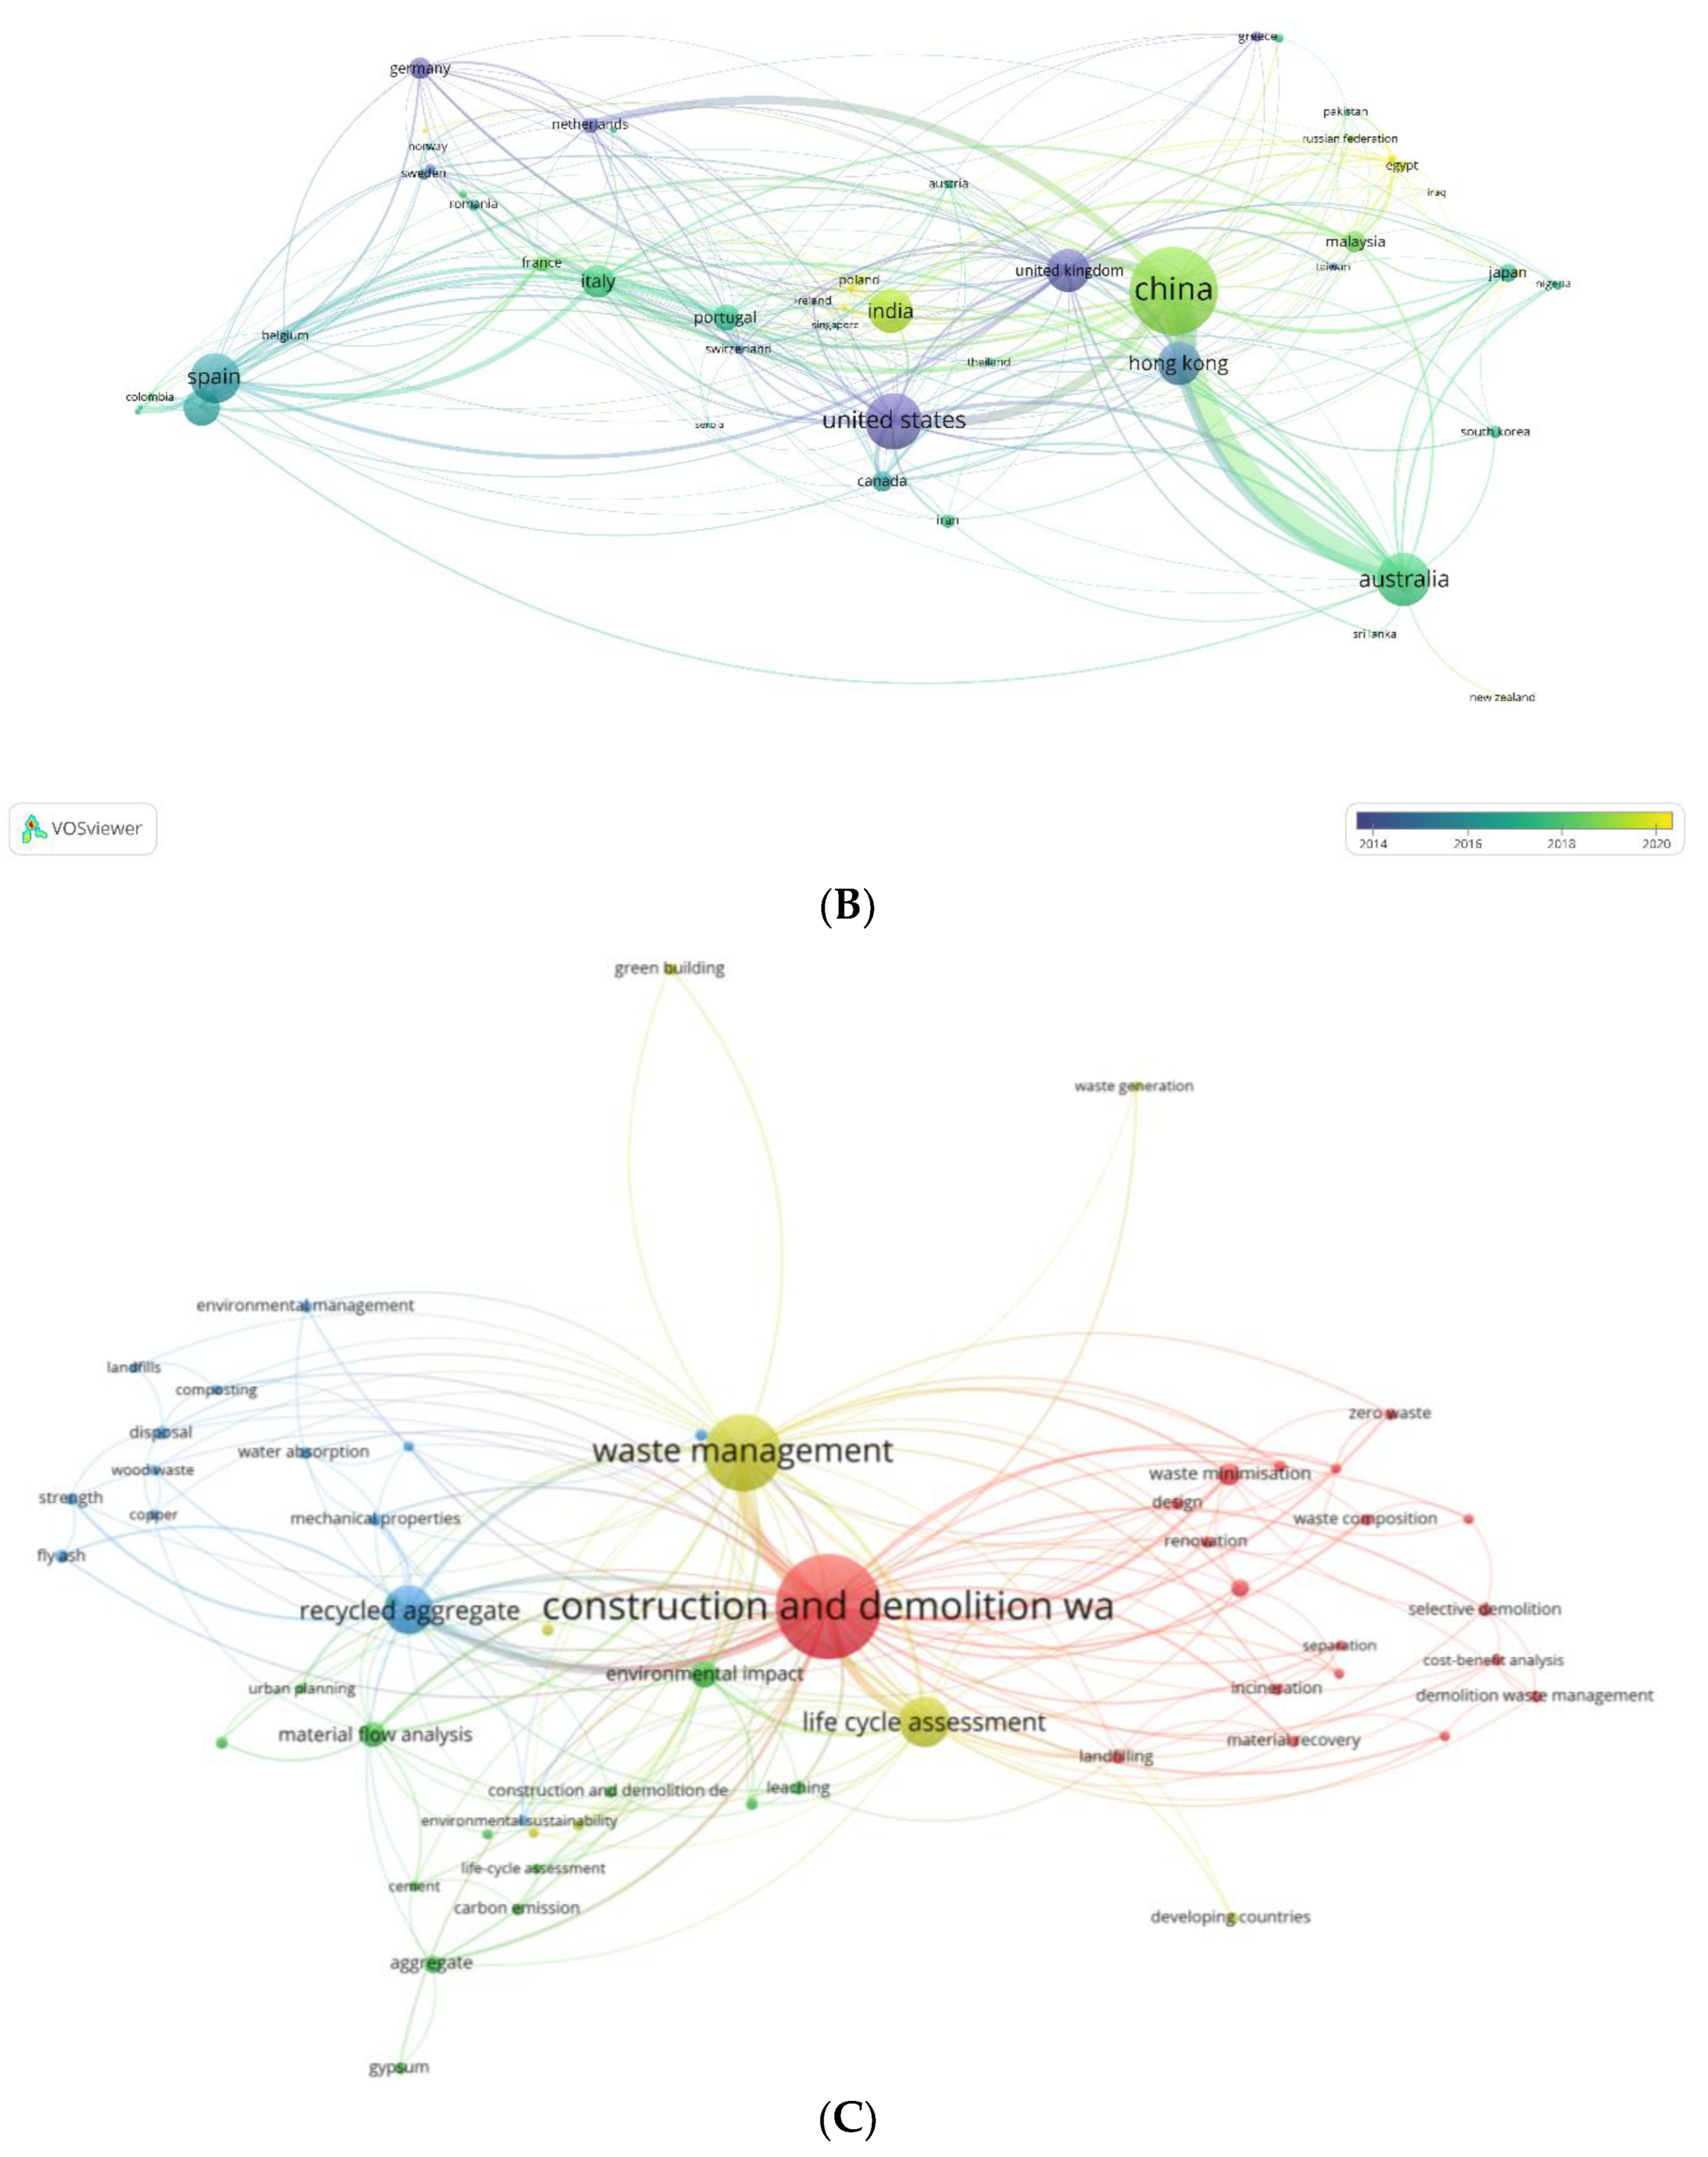
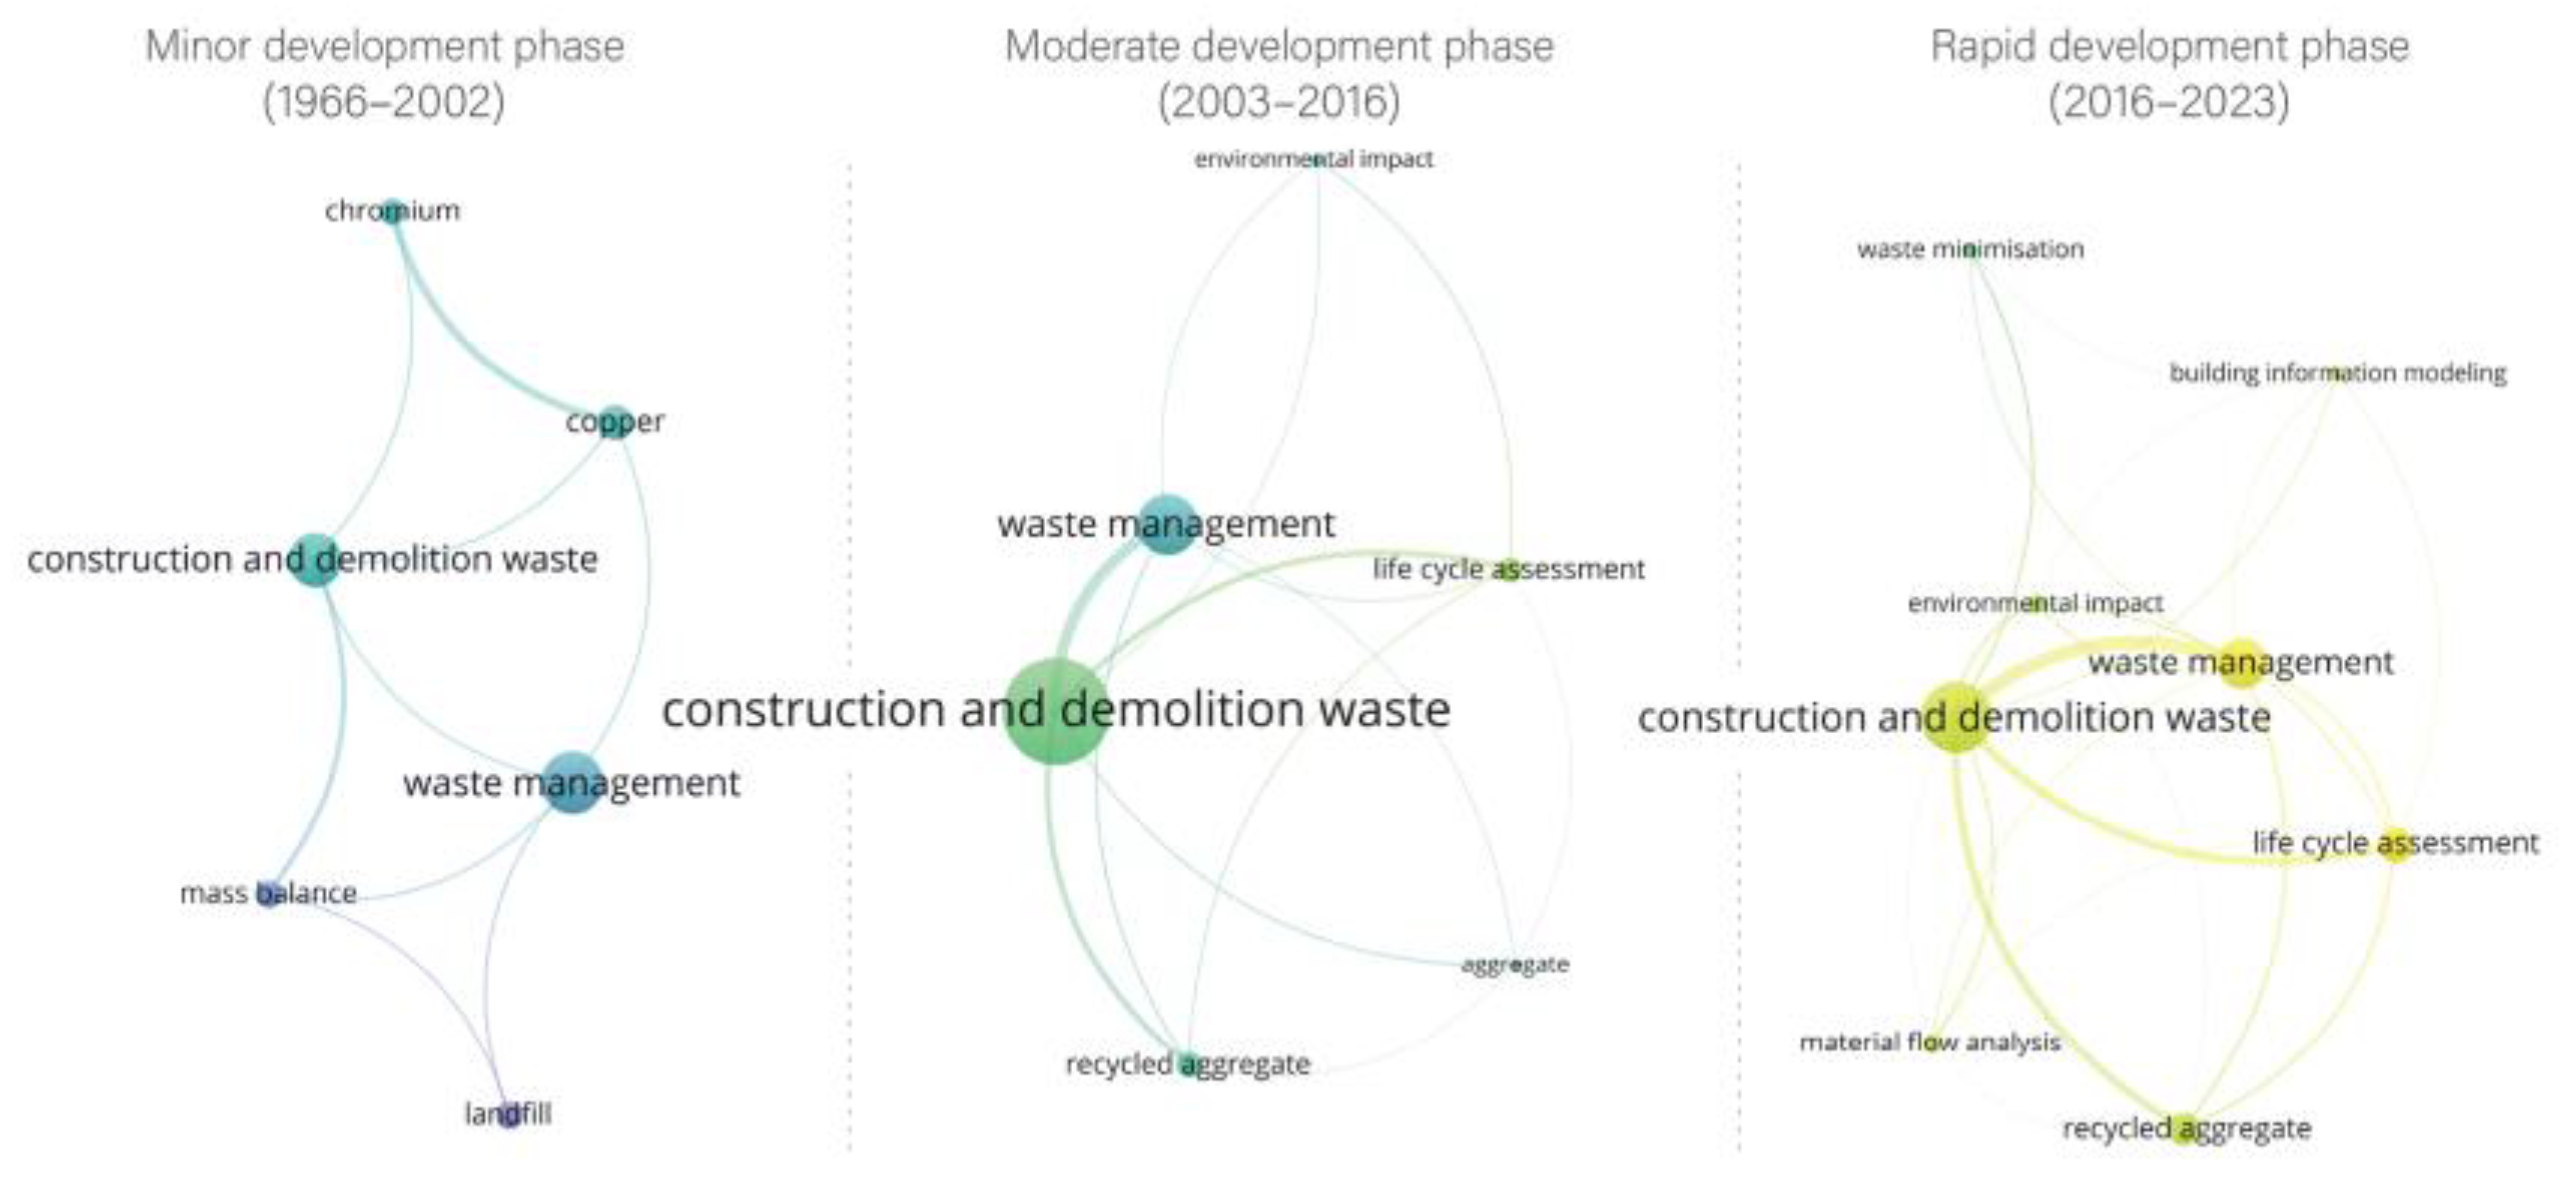
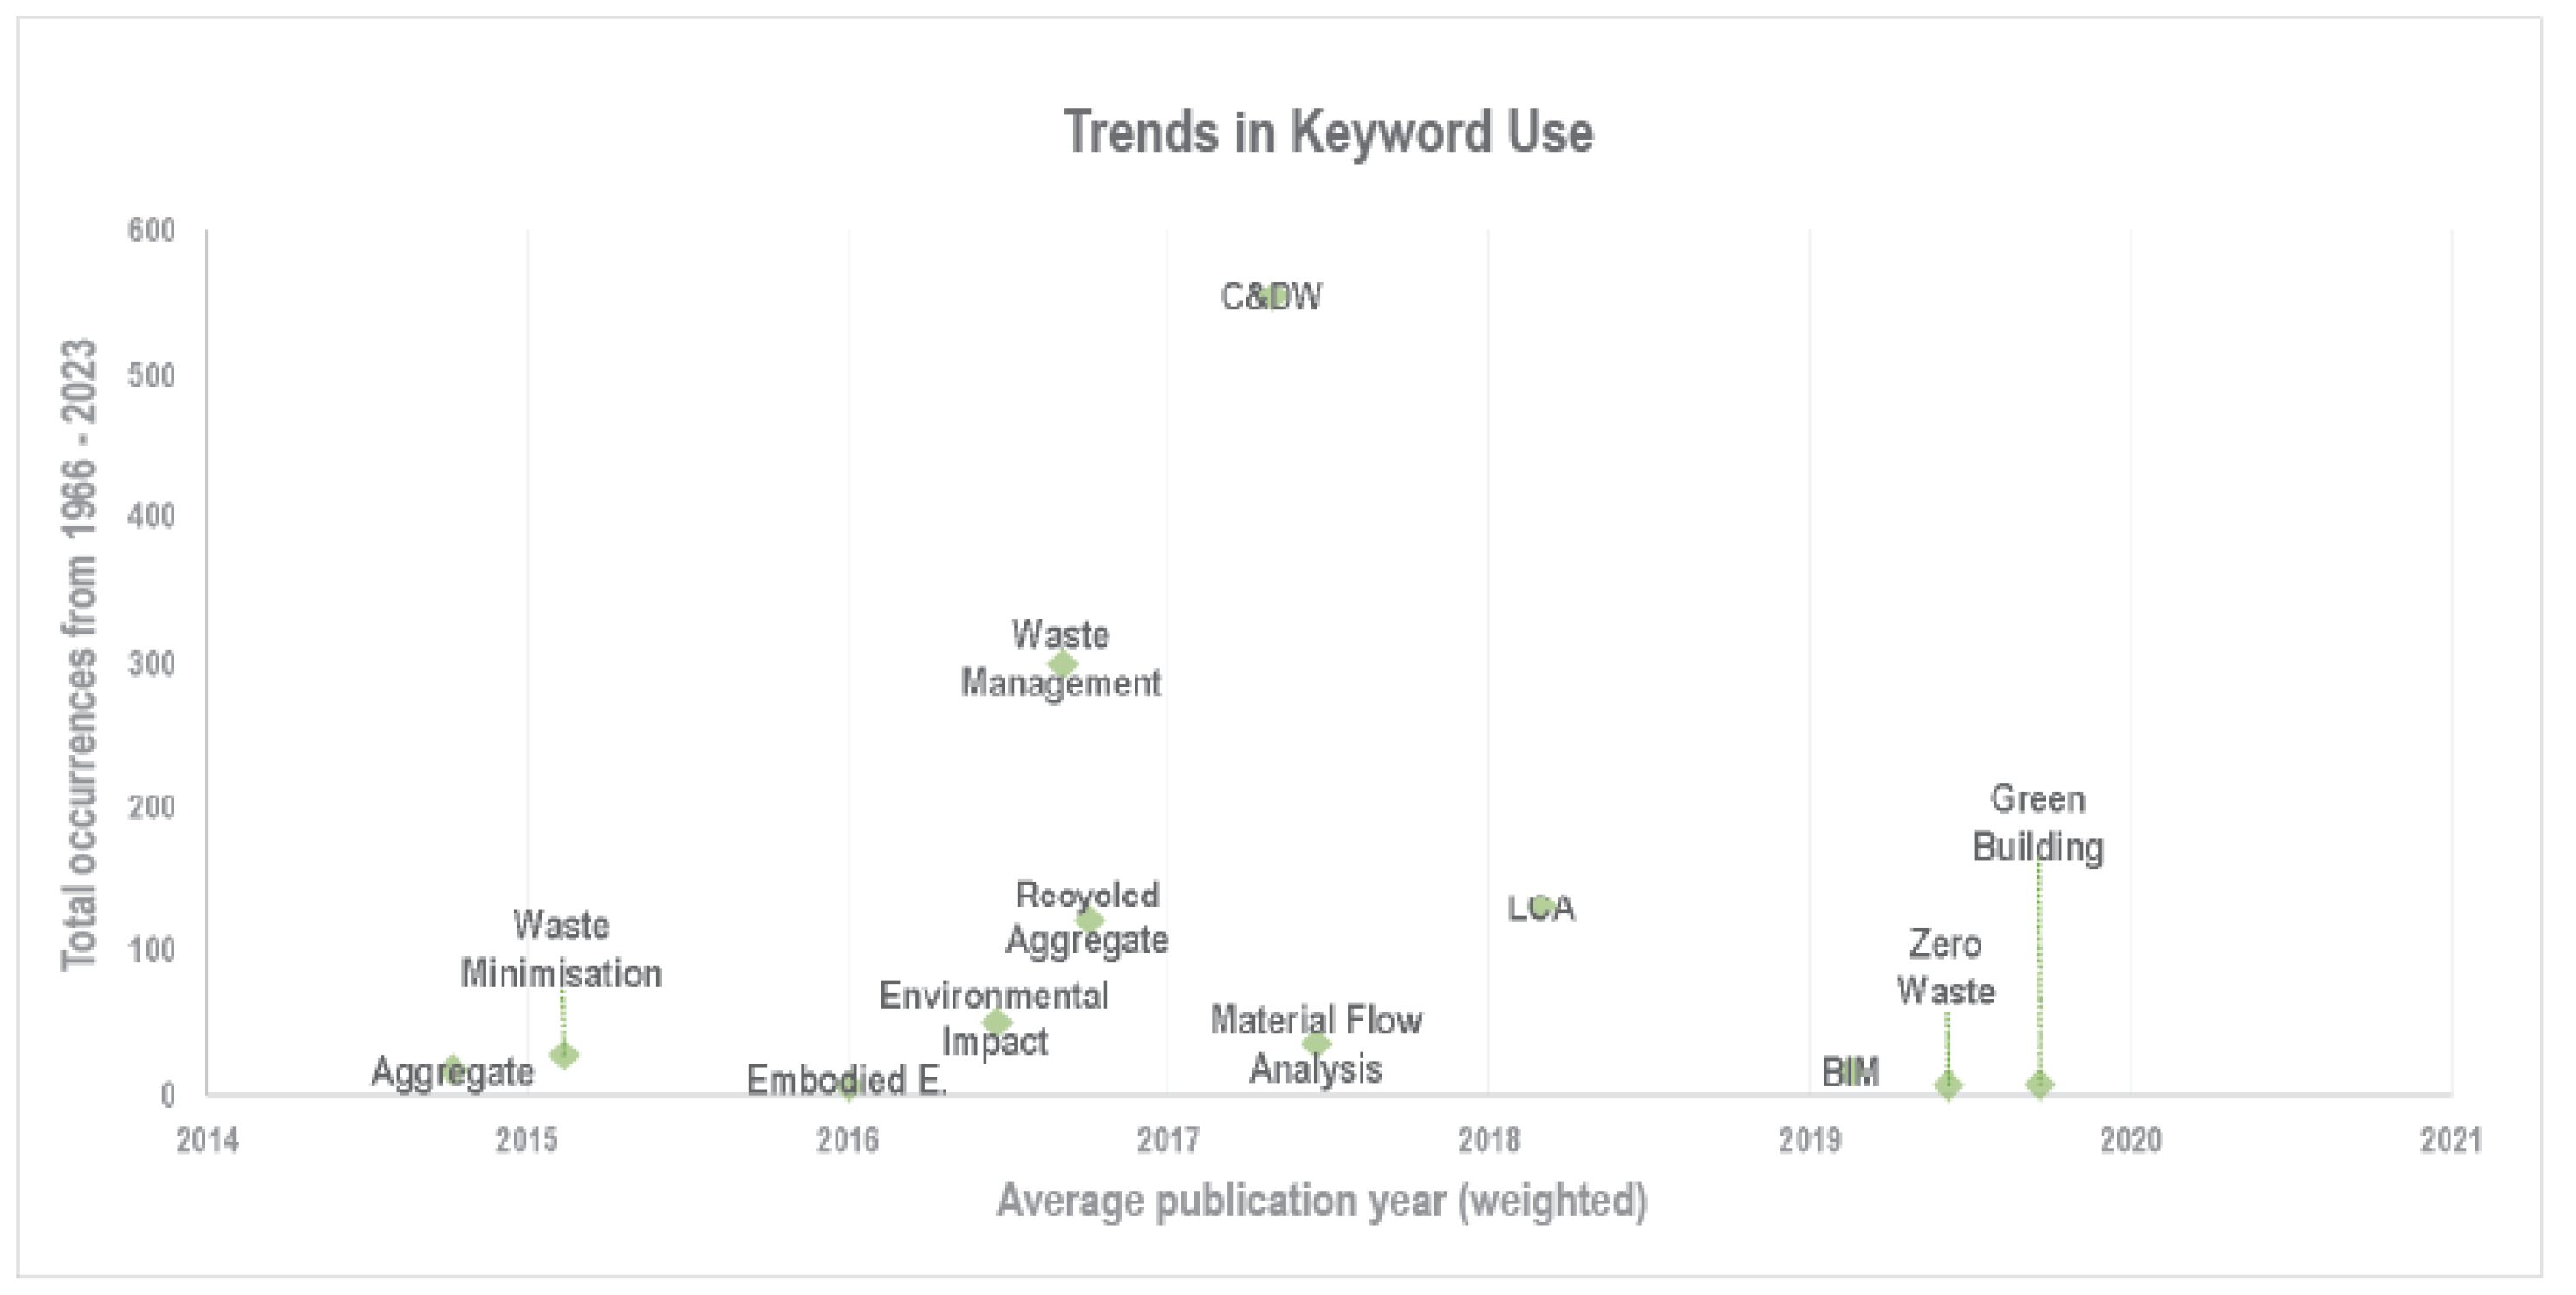
5.1. Search 1: C&DW Management

C&DW management is one commonly used term which is why the first search focused on it. This search should enable a good general overview of the themes and patterns in publications about C&DW. The search was completed on the Scopus database using the keywords: ‘construction AND demolition AND waste AND management’. This resulted in 1821 results, with publication dates ranging from 1966 to 2023 (Figure 1A).
Figure 1A shows an exponential growth in research activity in this area from around 2015. Figure 1B suggests that the US, the UK, Germany, and the Netherlands have led, and dominated, the research output around the start of this period. However, from 2020, China, India, and Australia dominate research outputs, with more accelerated research only starting to emerge in countries like Russian Federation, Egypt, and Poland (Figure 1B).
When comparing the node sizes, Figure 1C shows the most researched areas are C&DW, waste management, recycled aggregate, lifecycle assessments (LCA) and environmental impact. ‘LCA’ and ‘waste management’ are the most-discussed keywords in C&DW research, and have the strongest links to C&DW. The node of ‘recycled aggregate’ has the third strongest link to C&DW, a strong link with the waste management, and lies in the blue cluster. Some of the other nodes in this cluster include fly ash, aggregate, mechanical properties, and strength. Although concrete is not explicitly mentioned, it is the primary use of recycled aggregate, and a range of other nodes appear to relate to practices associated with recycling concrete or other waste into concrete. This suggests that concrete recycling is one of the topics which dominate C&DW research. These concrete recycling nodes lie close to the green cluster, which focuses on environmental impact, and they have many links between them. The green cluster also has an ‘aggregate’ node. This suggests that a range of recycled concrete topics have been explored, but the research generally lies around the physical properties or the environmental sustainability around recycled aggregate. Nevertheless, some of the other green nodes discuss a range of considerations which might not be fully about concrete, such as disposal, material flow analysis, urban planning, environmental impact, carbon emissions, and some specific materials like gypsum and copper (Figure 1C).
The red cluster has a focus on methodical planning within C&DW, such as building information modelling (BIM), waste minimisation, zero waste, selective demolition, and cost-benefit analysis (Figure 1C). It also includes important nodes about separation and material recovery.
The yellow cluster, which transverses across Figure 1C, includes waste management, LCA, green building, waste generation, developing countries, and some smaller nodes. This could be seen as capturing a range of efforts to consider C&DW more broadly and generally do better. This is where ‘recycled materials’ node appears as a small unnamed node (see Supplementary Data).
Figure 1D shows that all of the key topics in the C&DW management literature became pronounced research terms since 2016, and that LCA emerged as a strong focus of discussion after C&DW and waste minimisation. It also shows that the terms such as renovation, separation, waste generation, strength, and copper waste were among some of the topics which peaked in interest early in 2000s, while zero waste, green building and, building information modelling, are more recently discussed topics.
This reasonably general first search shows is that concrete is the most examined building material when considering C&DW, with all of the other building materials being significantly less researched, mainly absent as nodes. It also shows that much of the research effort is about how to manage C&DW either through design or at the end of life. However, recycled materials and material recovery appear to be the only two nodes that relates to recycling, reuse, and circular economy, and both are too small to appear as named in Figure 1C (see Supplementary Data). This suggests that, compared with the total volume of research about C&DW, such aspects still need more research.

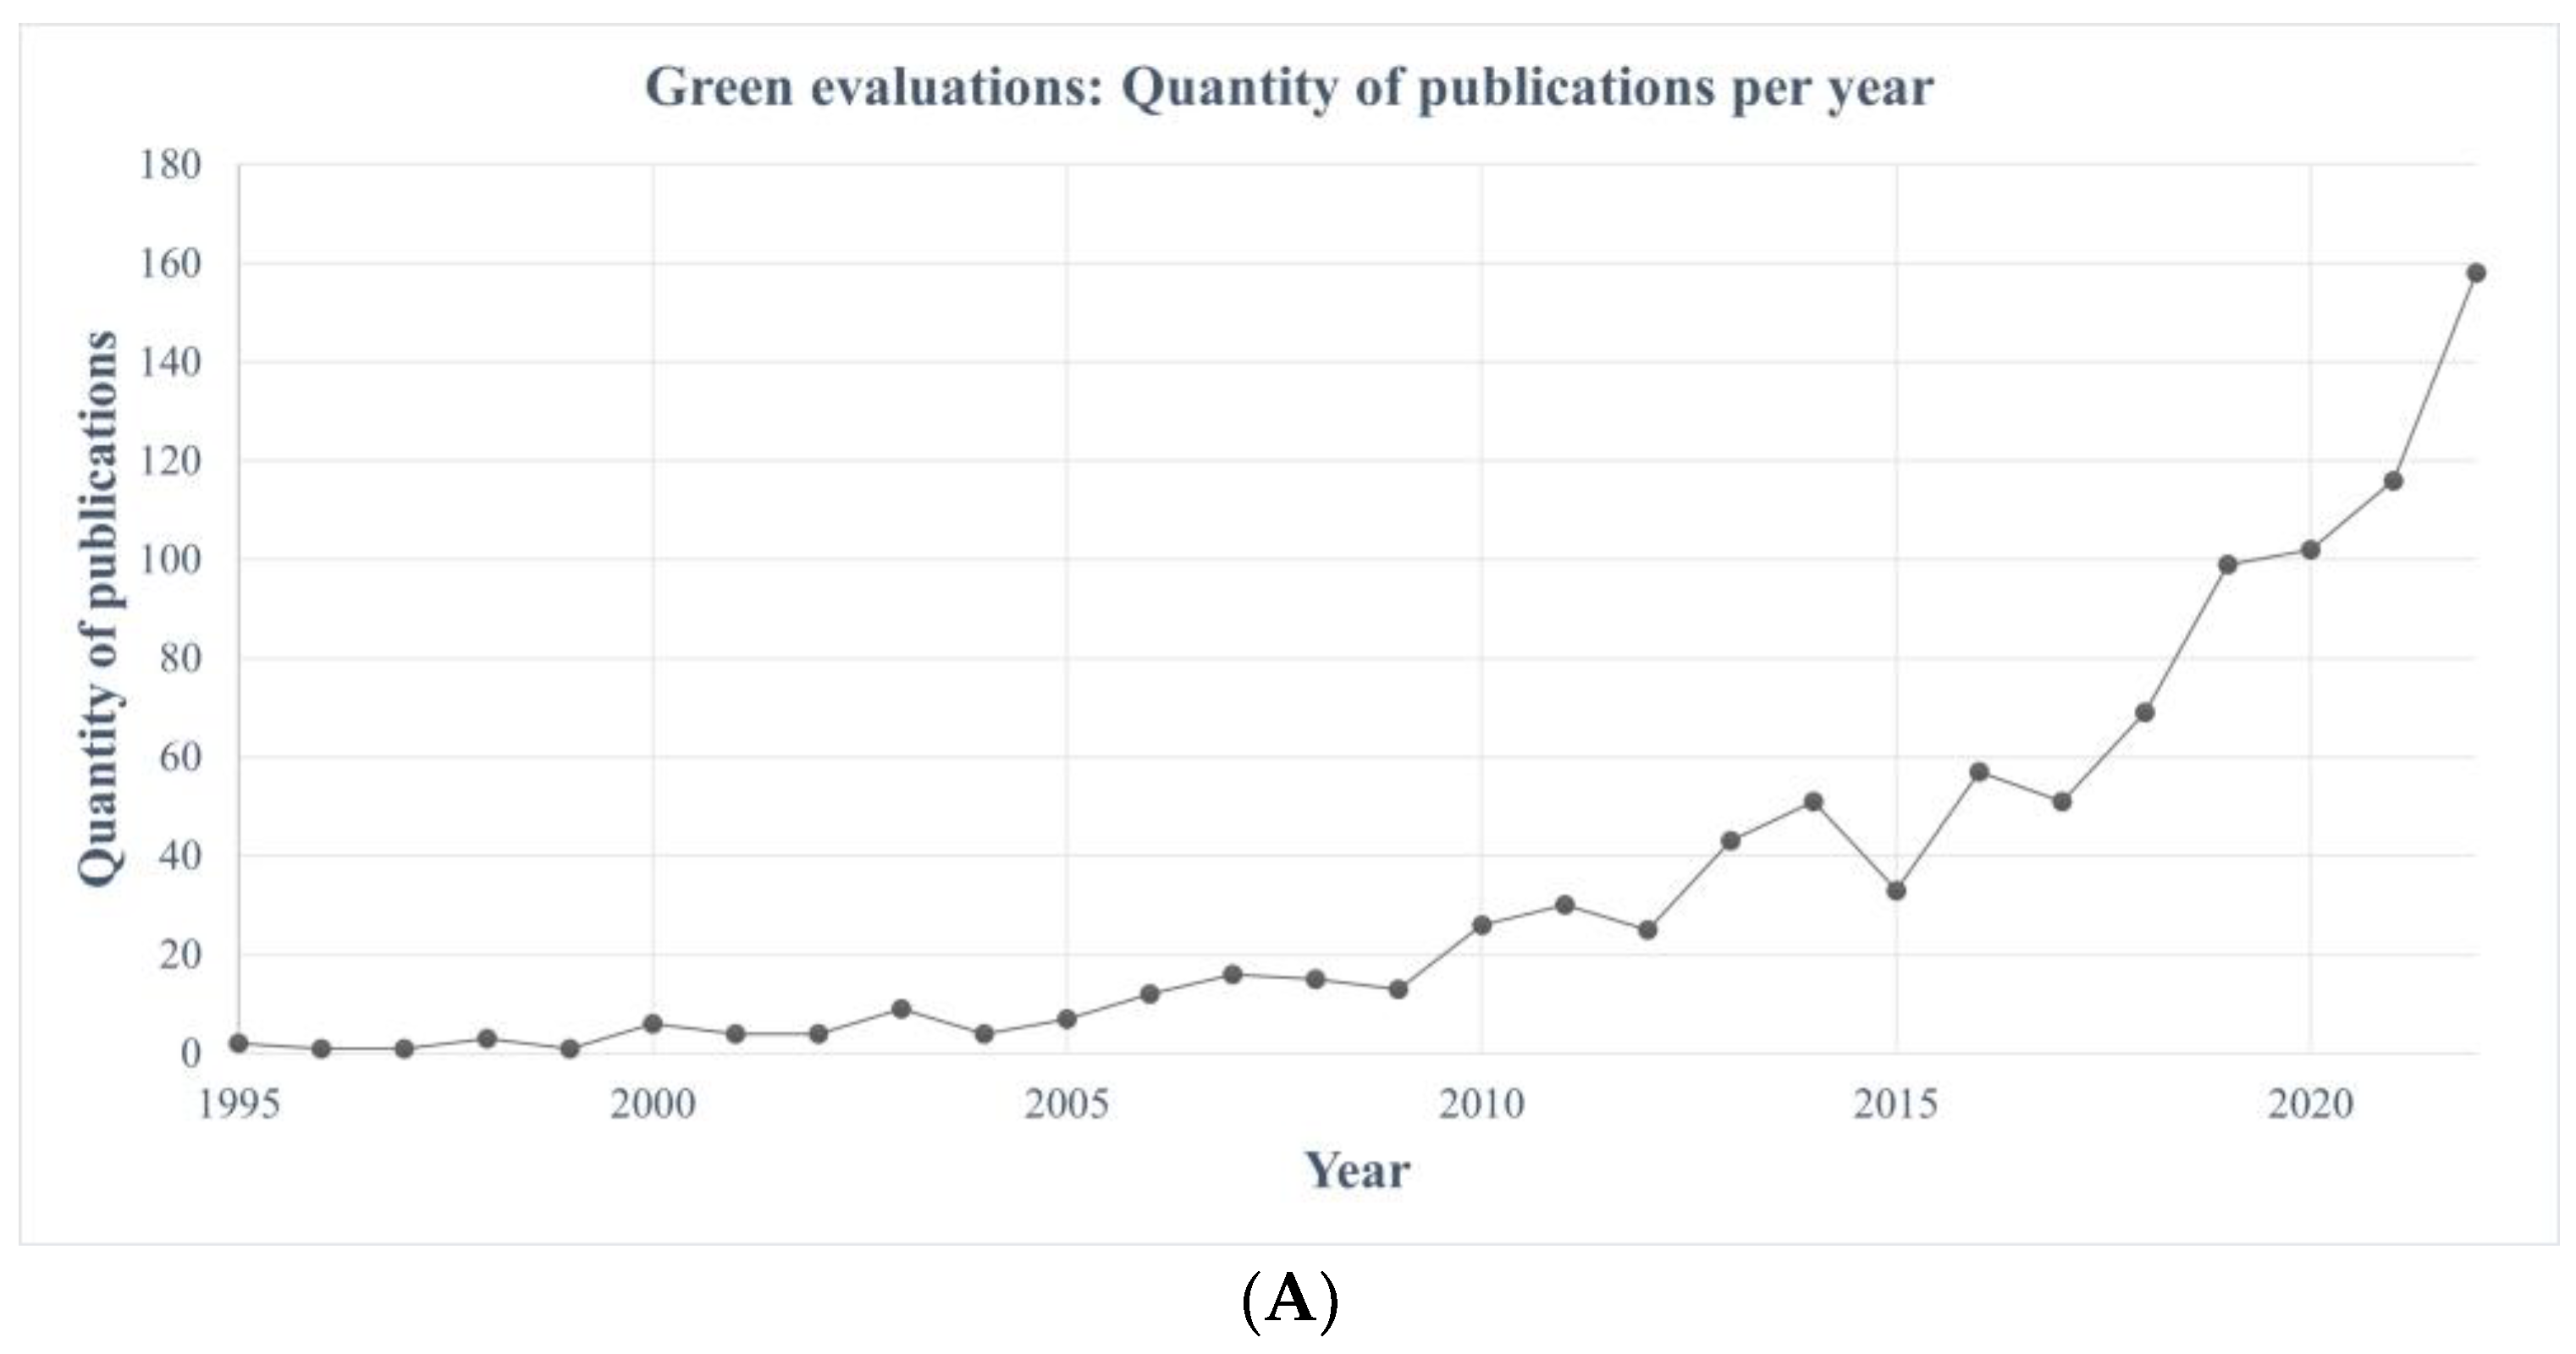
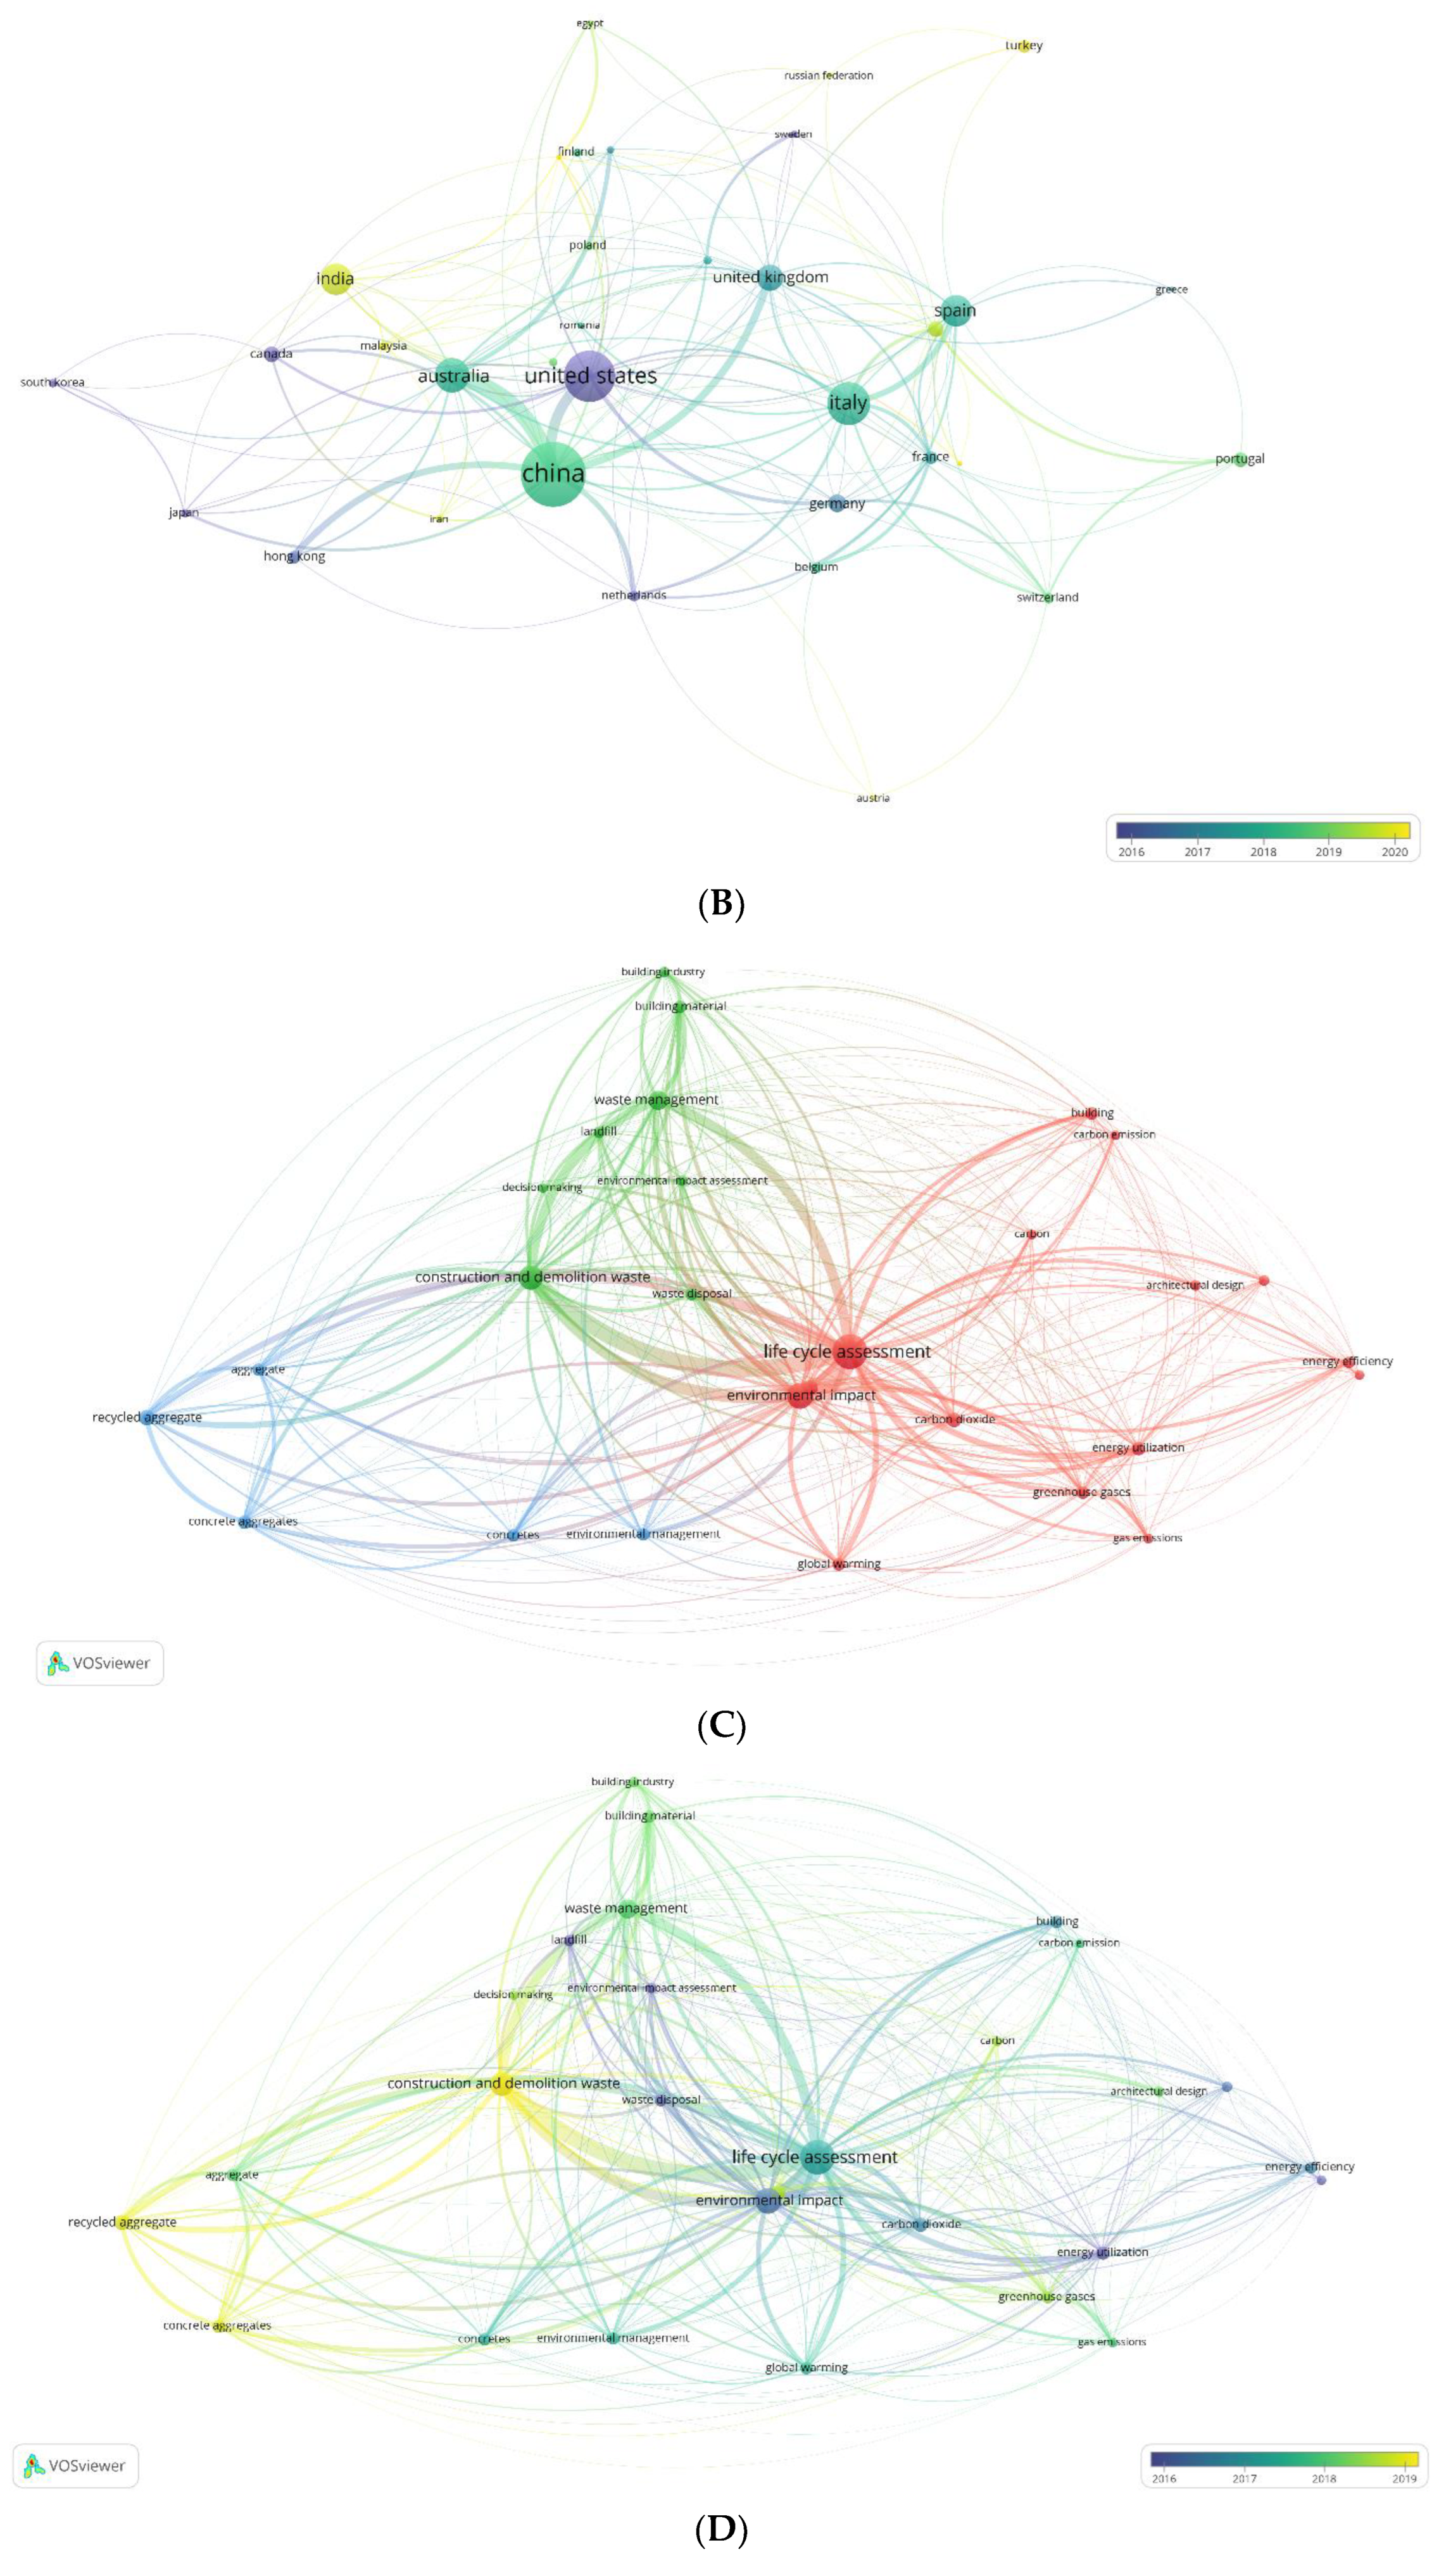
5.2. Search 2: Green Evaluations

The second search was completed to overview of a reasonably broad range of terminology used when evaluating if a particular approach can be seen as green or sustainable in built environment, within construction and demolition practices. This search should capture the research about the way the range of existing evaluation tools are approaching C&DW. The search used the keywords of: ‘Life Cycle assessment OR embodied energy OR carbon footprint OR green building OR living building challenge AND construction AND demolition’. This resulted in 1003 results, with publication dates ranging from 1995 to 2023 (Figure 2A).
Figure 2A shows there has been an exponential increase in research since 2016, with a take-off phase around the early 2000s. Comparing this with Figure 2B, this exponential increase seems to be led by publications produced in the US in 2016, with small numbers of publications coming from Sweden, Japan, Canada, South Korea, and Hong Kong. The UK, Australia, Italy, and Spain are prominent countries that followed the research trend from 2017 to 2019, with China following very soon after. India is the largest contributor of the most recent publications since around 2020, with a range of other Asian countries making a weaker presence also most recently.
When evaluating for keyword co-occurrences, three clusters can be seen in Figure 2C. The red cluster is the largest, takes up about half of the visualisation, and focuses on the environmental impact of buildings. The cluster’s largest nodes are ‘LCA’ and ‘environmental impact’, which both have strong links to global warming. The nodes in the cluster are related energy use and emissions, with the prominent nodes of ‘energy utilization ‘greenhouse gasses’ and ‘carbon dioxide’. Because the word ‘waste’ was not included in this search, this cluster is probably reflective of the considerations related to green assessments which do not explicitly deal with it. The green cluster focuses on C&DW, waste management, waste disposal, landfill, and similar considerations which can all be seen as the most common themes in the C&DW research. The blue cluster appears to capture the same focus on concrete, concrete aggregate, and recycling strategies possible with those as discussed with the first search.
Figure 2D shows that research in the red cluster has occurred first, around 2017, which is to be expected. The other half of the visualisation, centred around C&DW, occurred later, with recycling of concrete being the most recent addition, and possibly taking place in two waves. However, the whole timeline captured in Figure 2D is only four years, making it impossible to draw many conclusions from this timeline. This concentration of groupings of all themes is probably influenced by the extent of the exponential increase in publications in more recent years in this area.
The second search examined how the existing green evaluation tools are approaching C&DW, and it shows that because of the absence of nodes for reuse, recycling, and circular economy more is still to be desired in the area also. Similarly to the first search, concrete is the only specific material which appears as a set of nodes, so recycling paths for other materials is an area of need for further research and do not appear even in the Supplementary Data.

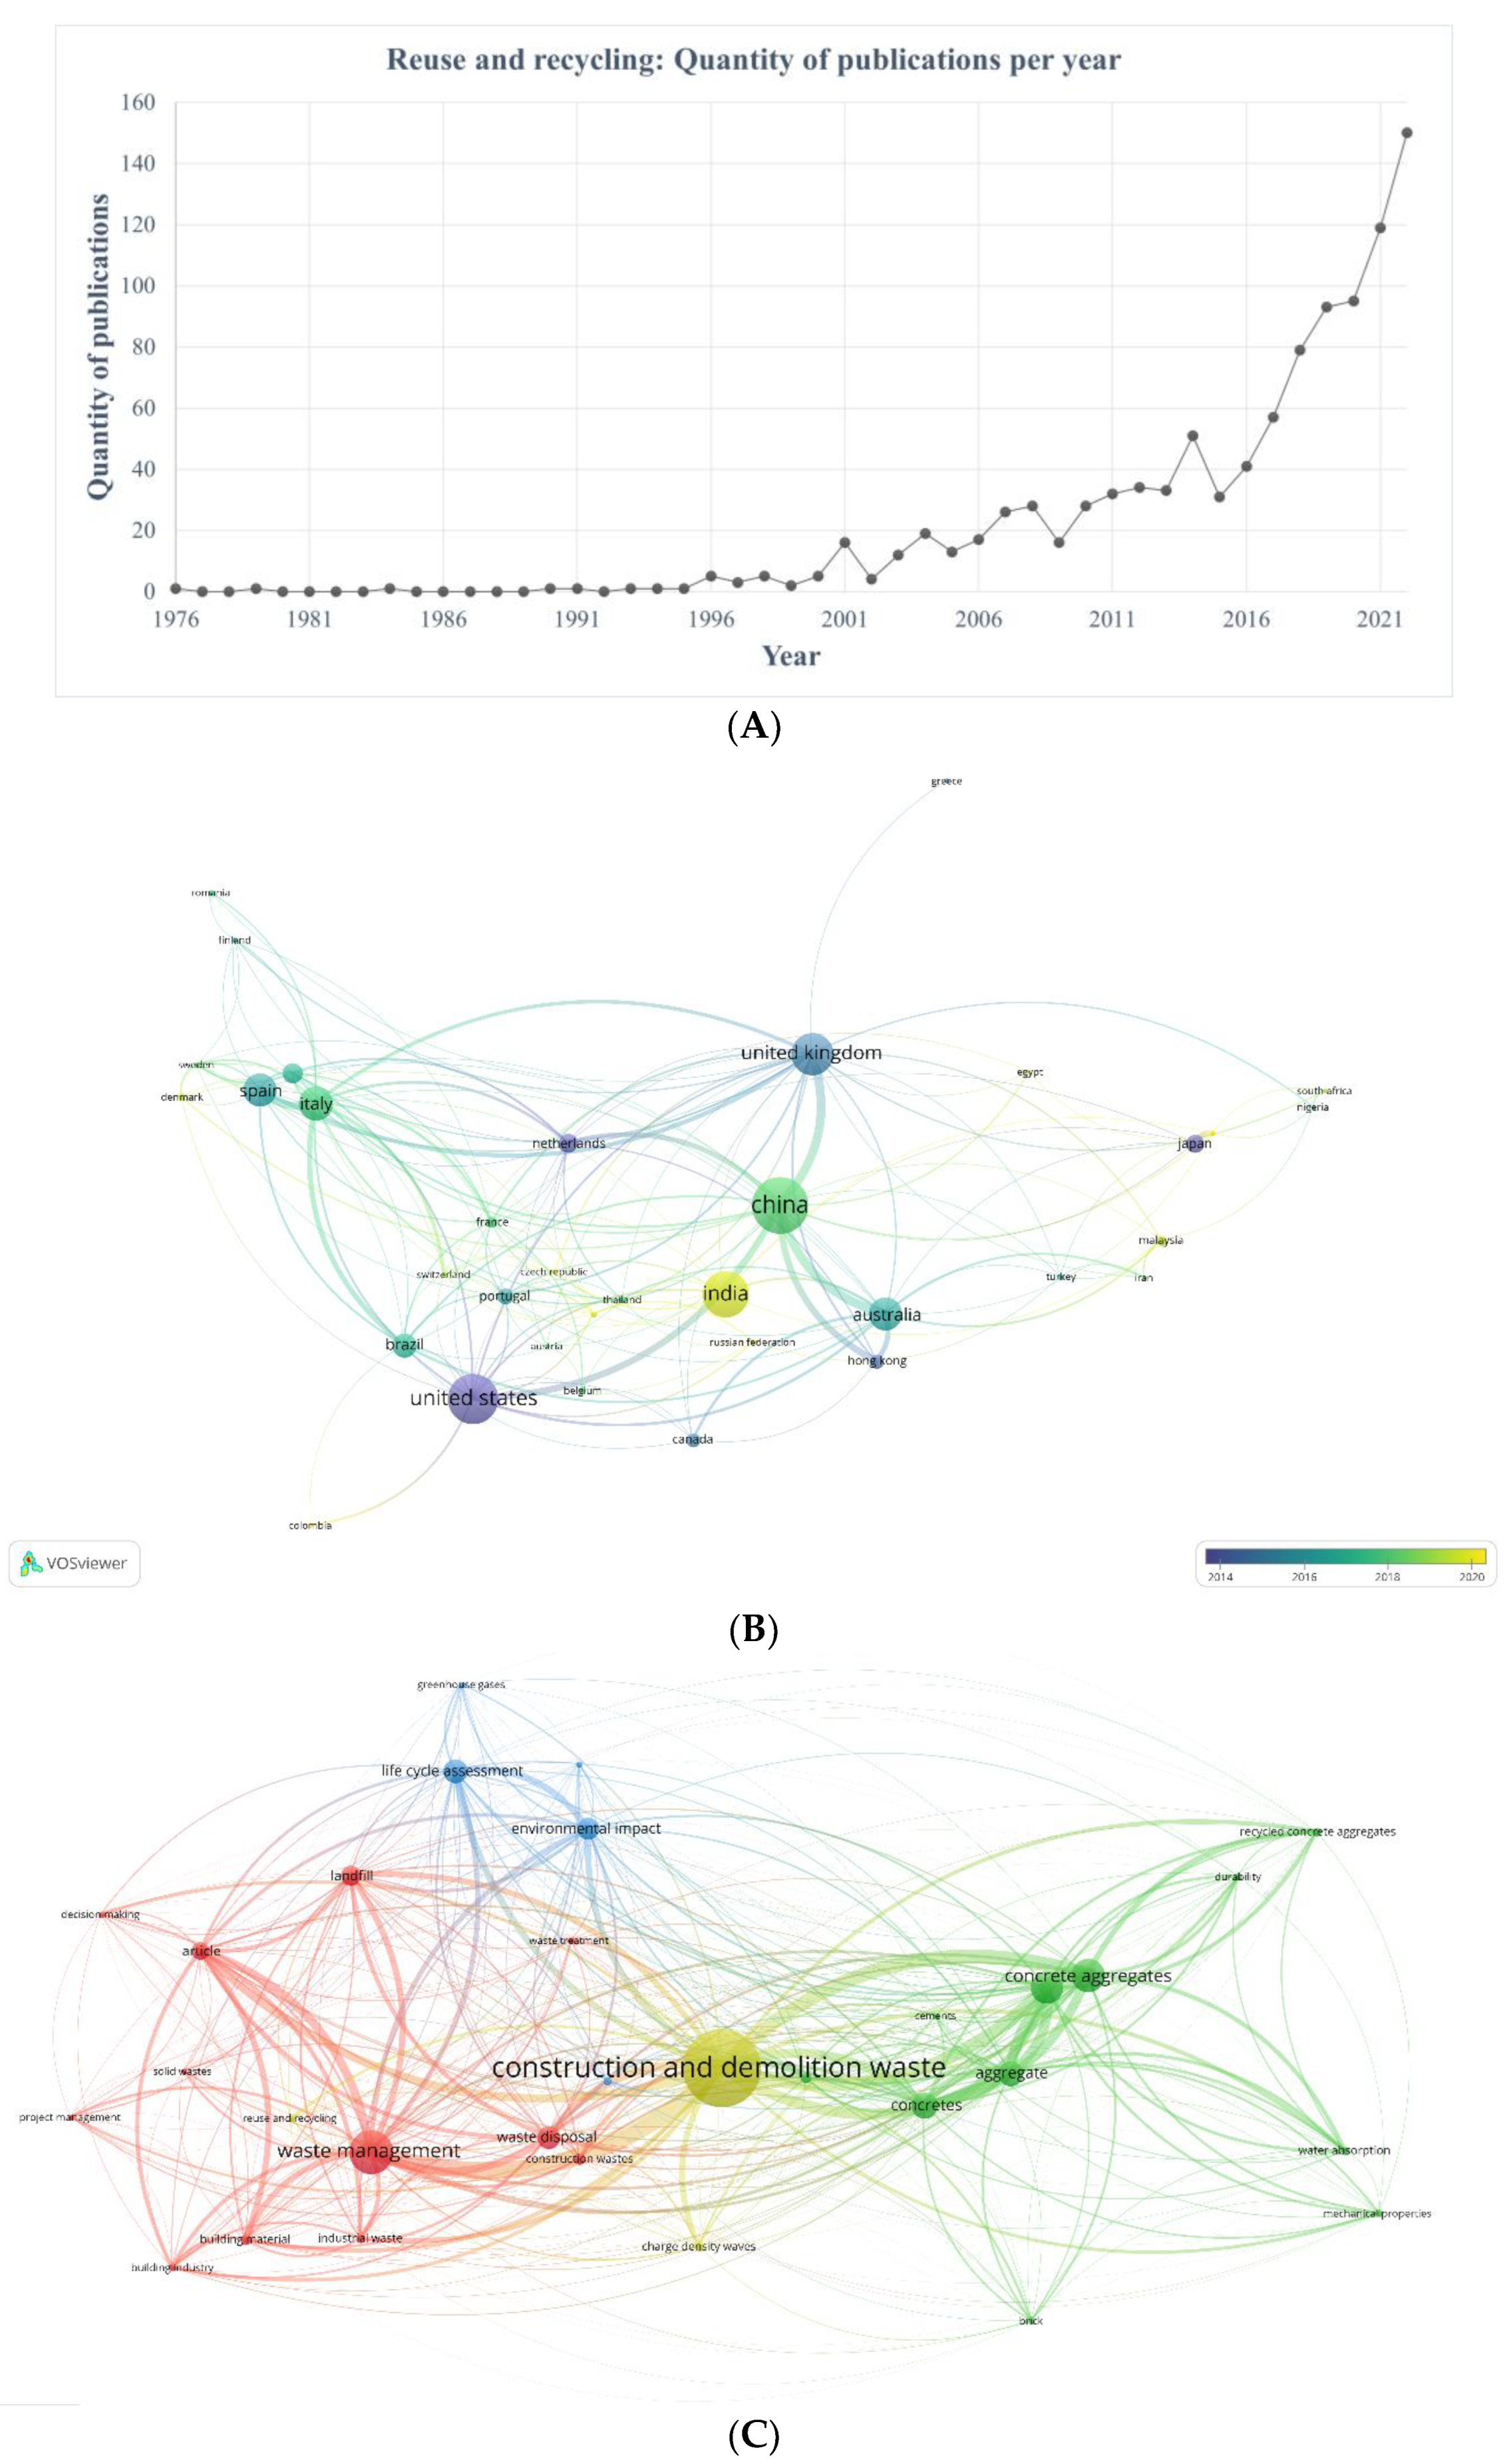
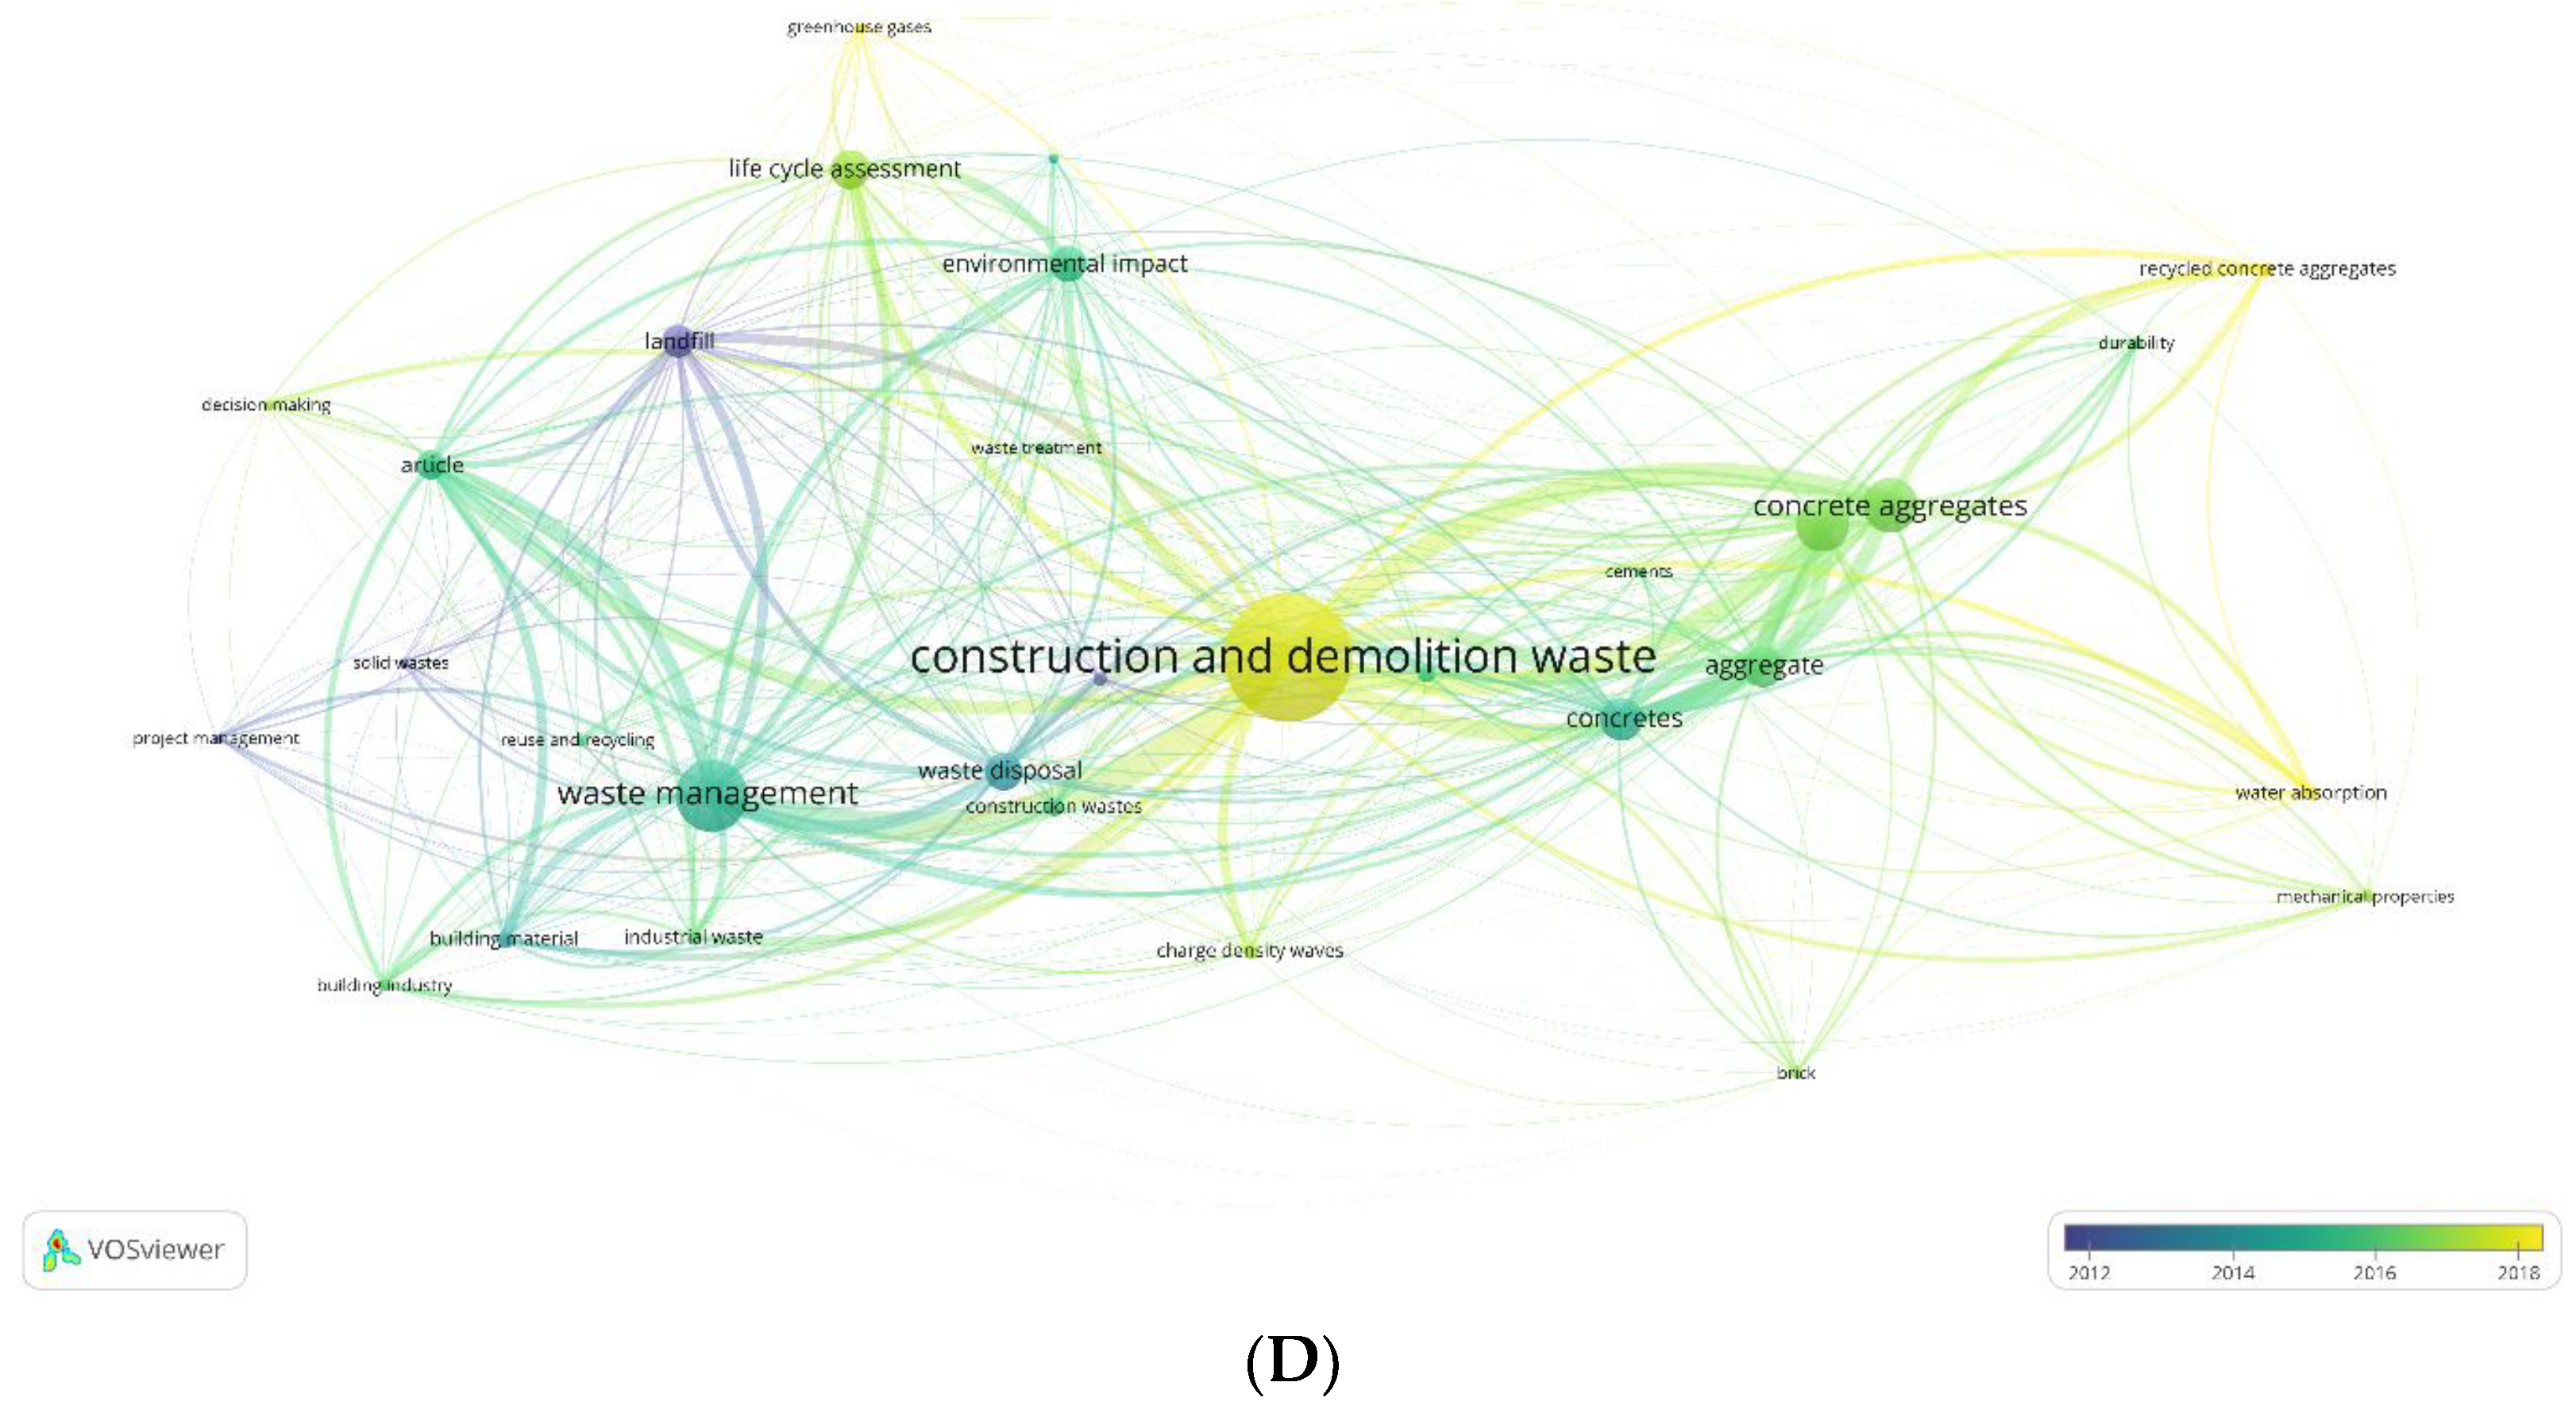
5.3. Search 3: Reuse and Recycling

Given the gaps noted in the first two searches, the third search was completed to examine the patterns with discussions of reuse and recycling of materials within construction and demolition process. The keywords used in the search were: ‘Reuse OR recycle OR reclaim OR (salvaged AND material) OR upcycle AND construction AND demolition’. This resulted in 1081 results, with publication dates ranging from 1976 to 2023 (Figure 3A).
Research around the reuse and recycling of materials within construction and demolition processes saw moderate development from 2000 onwards, and a rapid development from 2016 (Figure 3A). Figure 3B shows that the research in this area first matured in the US, the Netherlands, Japan, UK, and Hong Kong around 2014–1016. China, Italy, and India are the more recently emerging significant contributors.
Visualisation of keyword co-occurrence in Figure 3C shows that concrete related research is also here a dominating cluster, shown as the green cluster. The largest node in this green cluster is ‘concrete aggregate’. Concrete is the only material mentioned, suggesting that the recycling and salvaging of concrete aggregate is the most researched recycled building material, although bricks are also included as an unnamed nod in this cluster (see Supplementary Data). This takes up just over a third of the research produced in the field of reuse and recycling.
Nevertheless, the largest cluster in Figure 3C visualisation is red (1), which focuses on waste management, disposal, and landfills, taking up around half of the research. The node of ‘waste management’ is the largest in the red cluster. Two very small clusters are also evident: blue and yellow. The blue cluster is about research around environmental impacts, lifecycle assessments and greenhouse gasses, while yellow cluster is associated with specific discussions of the C&DW, and that is where reuse and recycling appears as one of the unnamed nods (see Supplementary Data).
Comparing this to Figure 3D, the nodes of ‘landfill’, ‘solid waste’, and ‘project management’ are the leading keywords used in salvaging/reuse research, with average publishing dates around 2012. The nodes of ‘waste disposal’ occur around 2013–2014, and the node of ‘waste management’ occurs in 2015. Research related to concrete in this group seems to have been generally published around 2015–2018, and possibly in waves (from consideration primarily of concrete and cement, via consideration of mechanical properties, to considerations of recycled concrete aggregate and water absorption) (see Supplementary Data). The most recent clustering of keywords seems to be about C&DW, greenhouse gasses, aspects of concrete recycling, and decision making.
The third search specifically examined the reuse and recycling of construction and demolition materials and this is the first time a small node about reuse and recycling appeared around 2015 (Figure 3D). However, circular economy was still not found as a large enough node to show. Also, just as with the earlier searches, no material stood out apart from concrete.

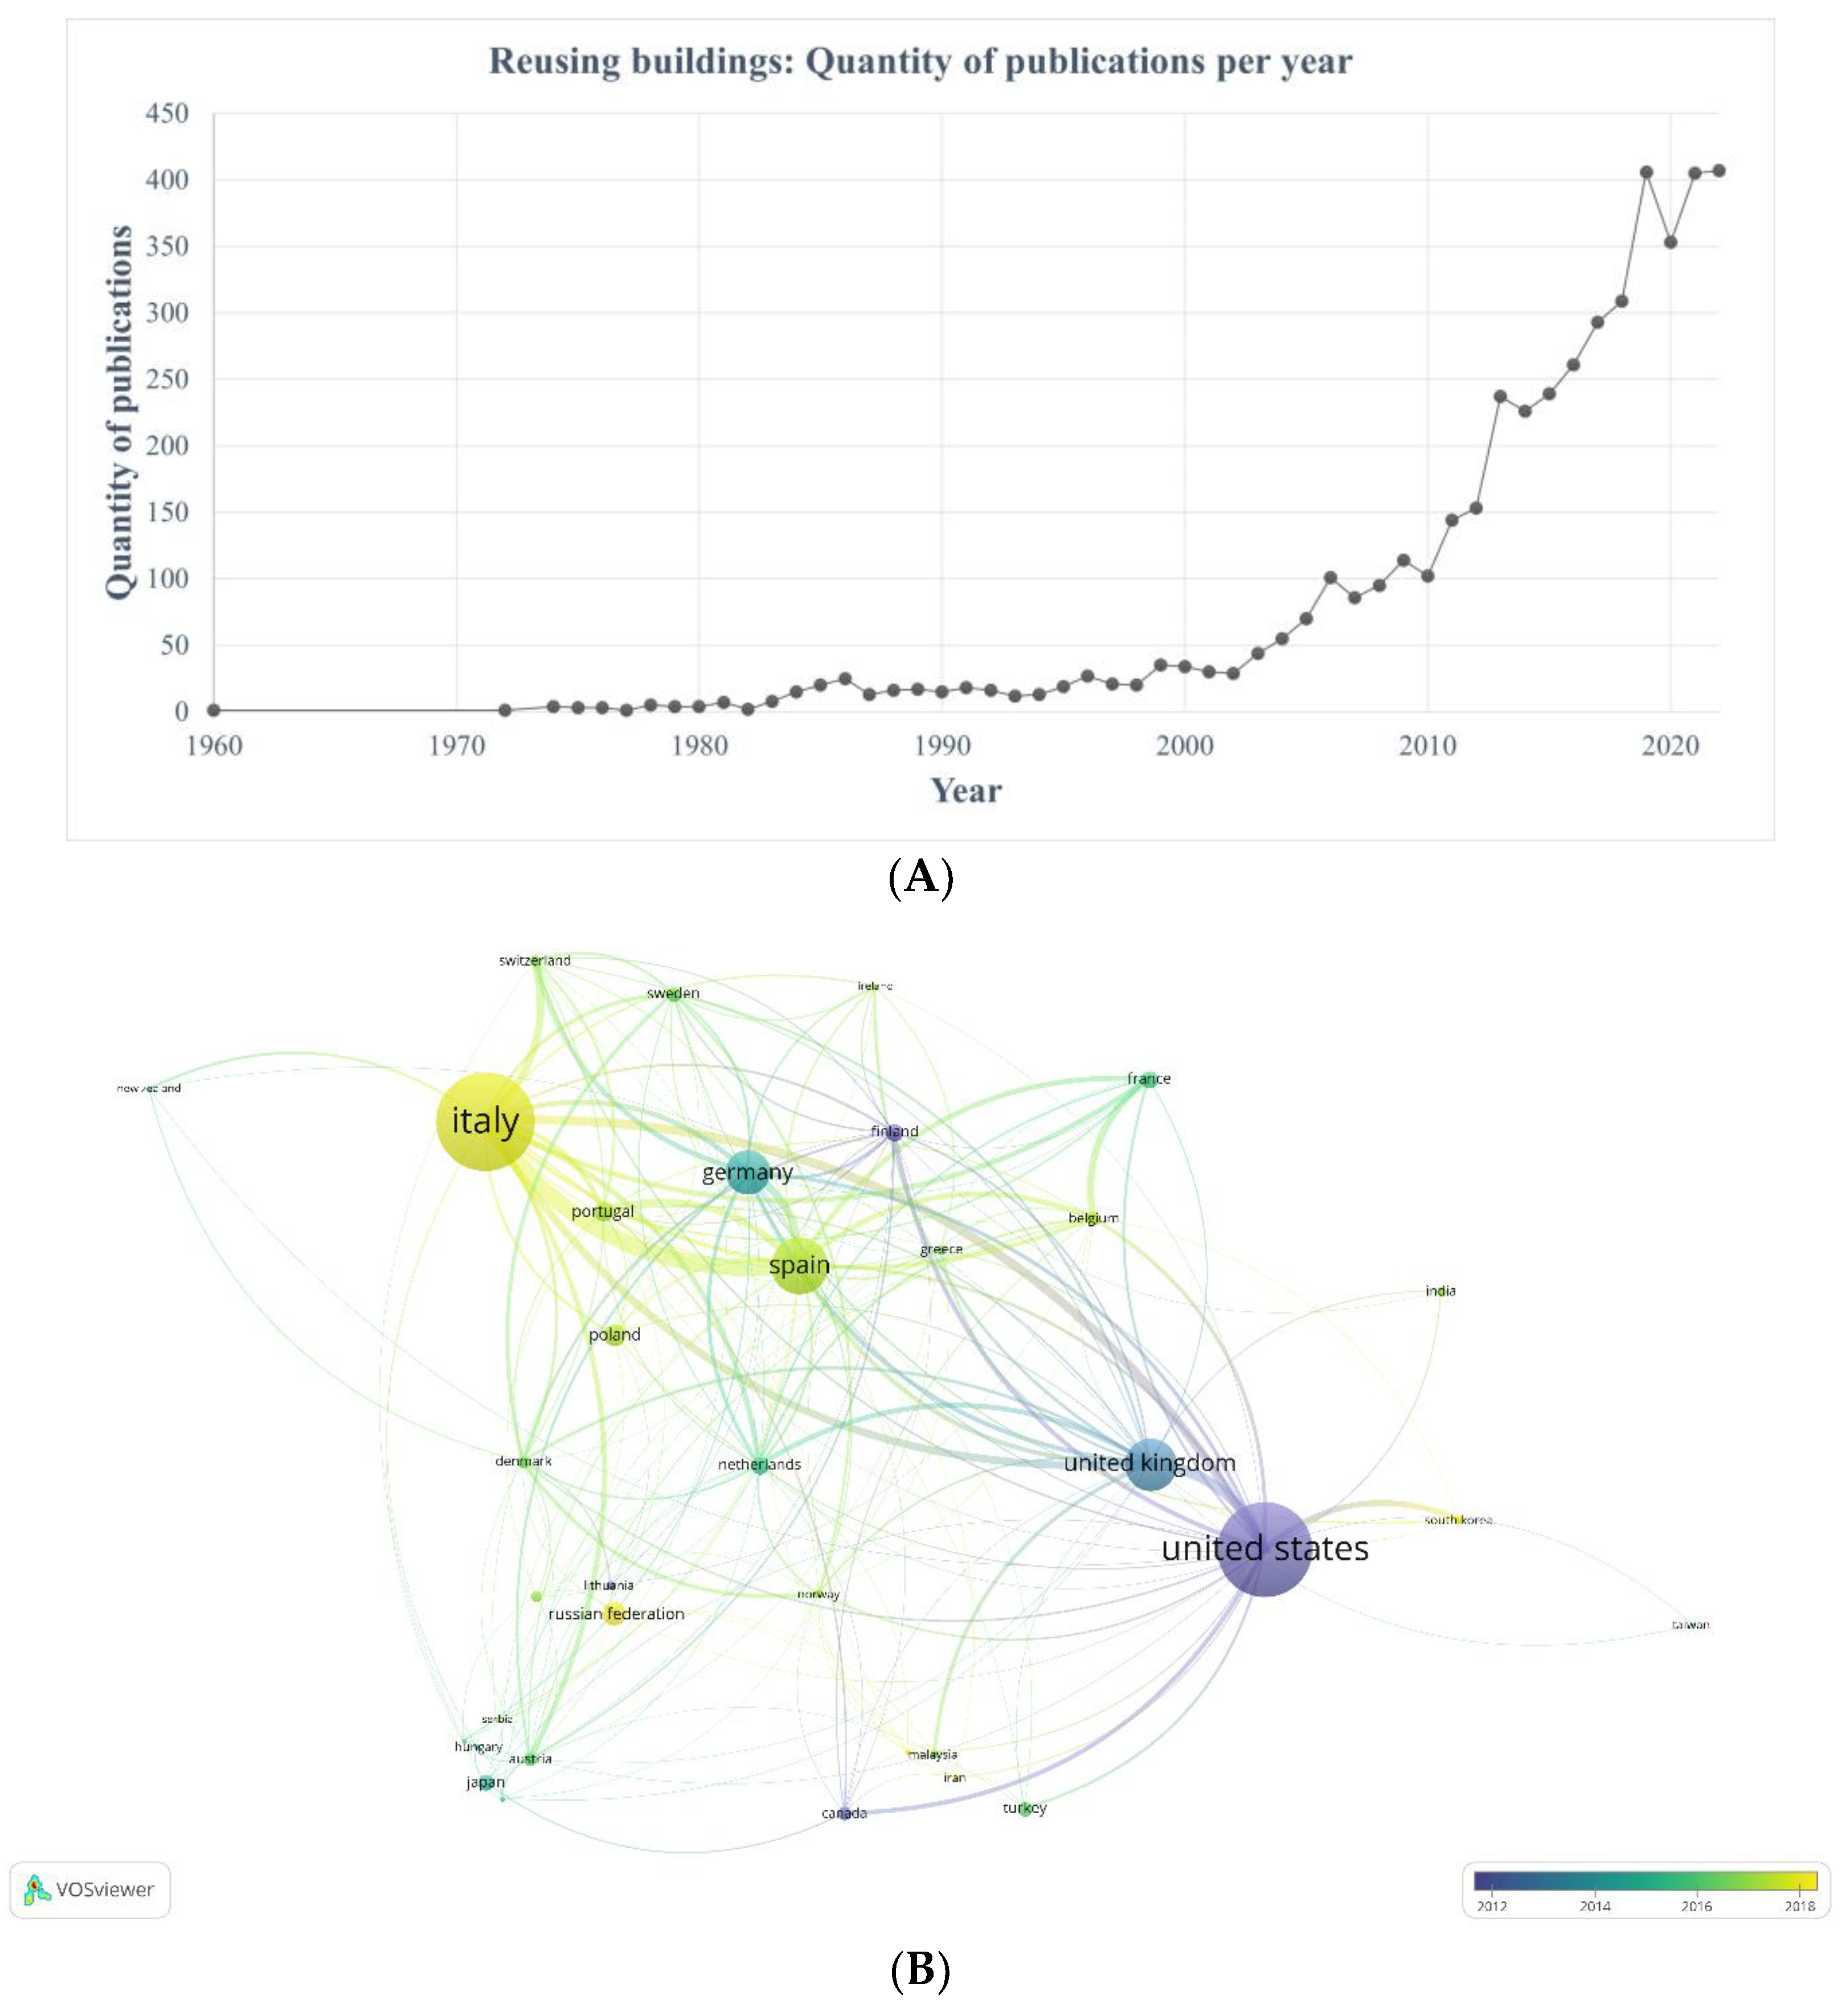
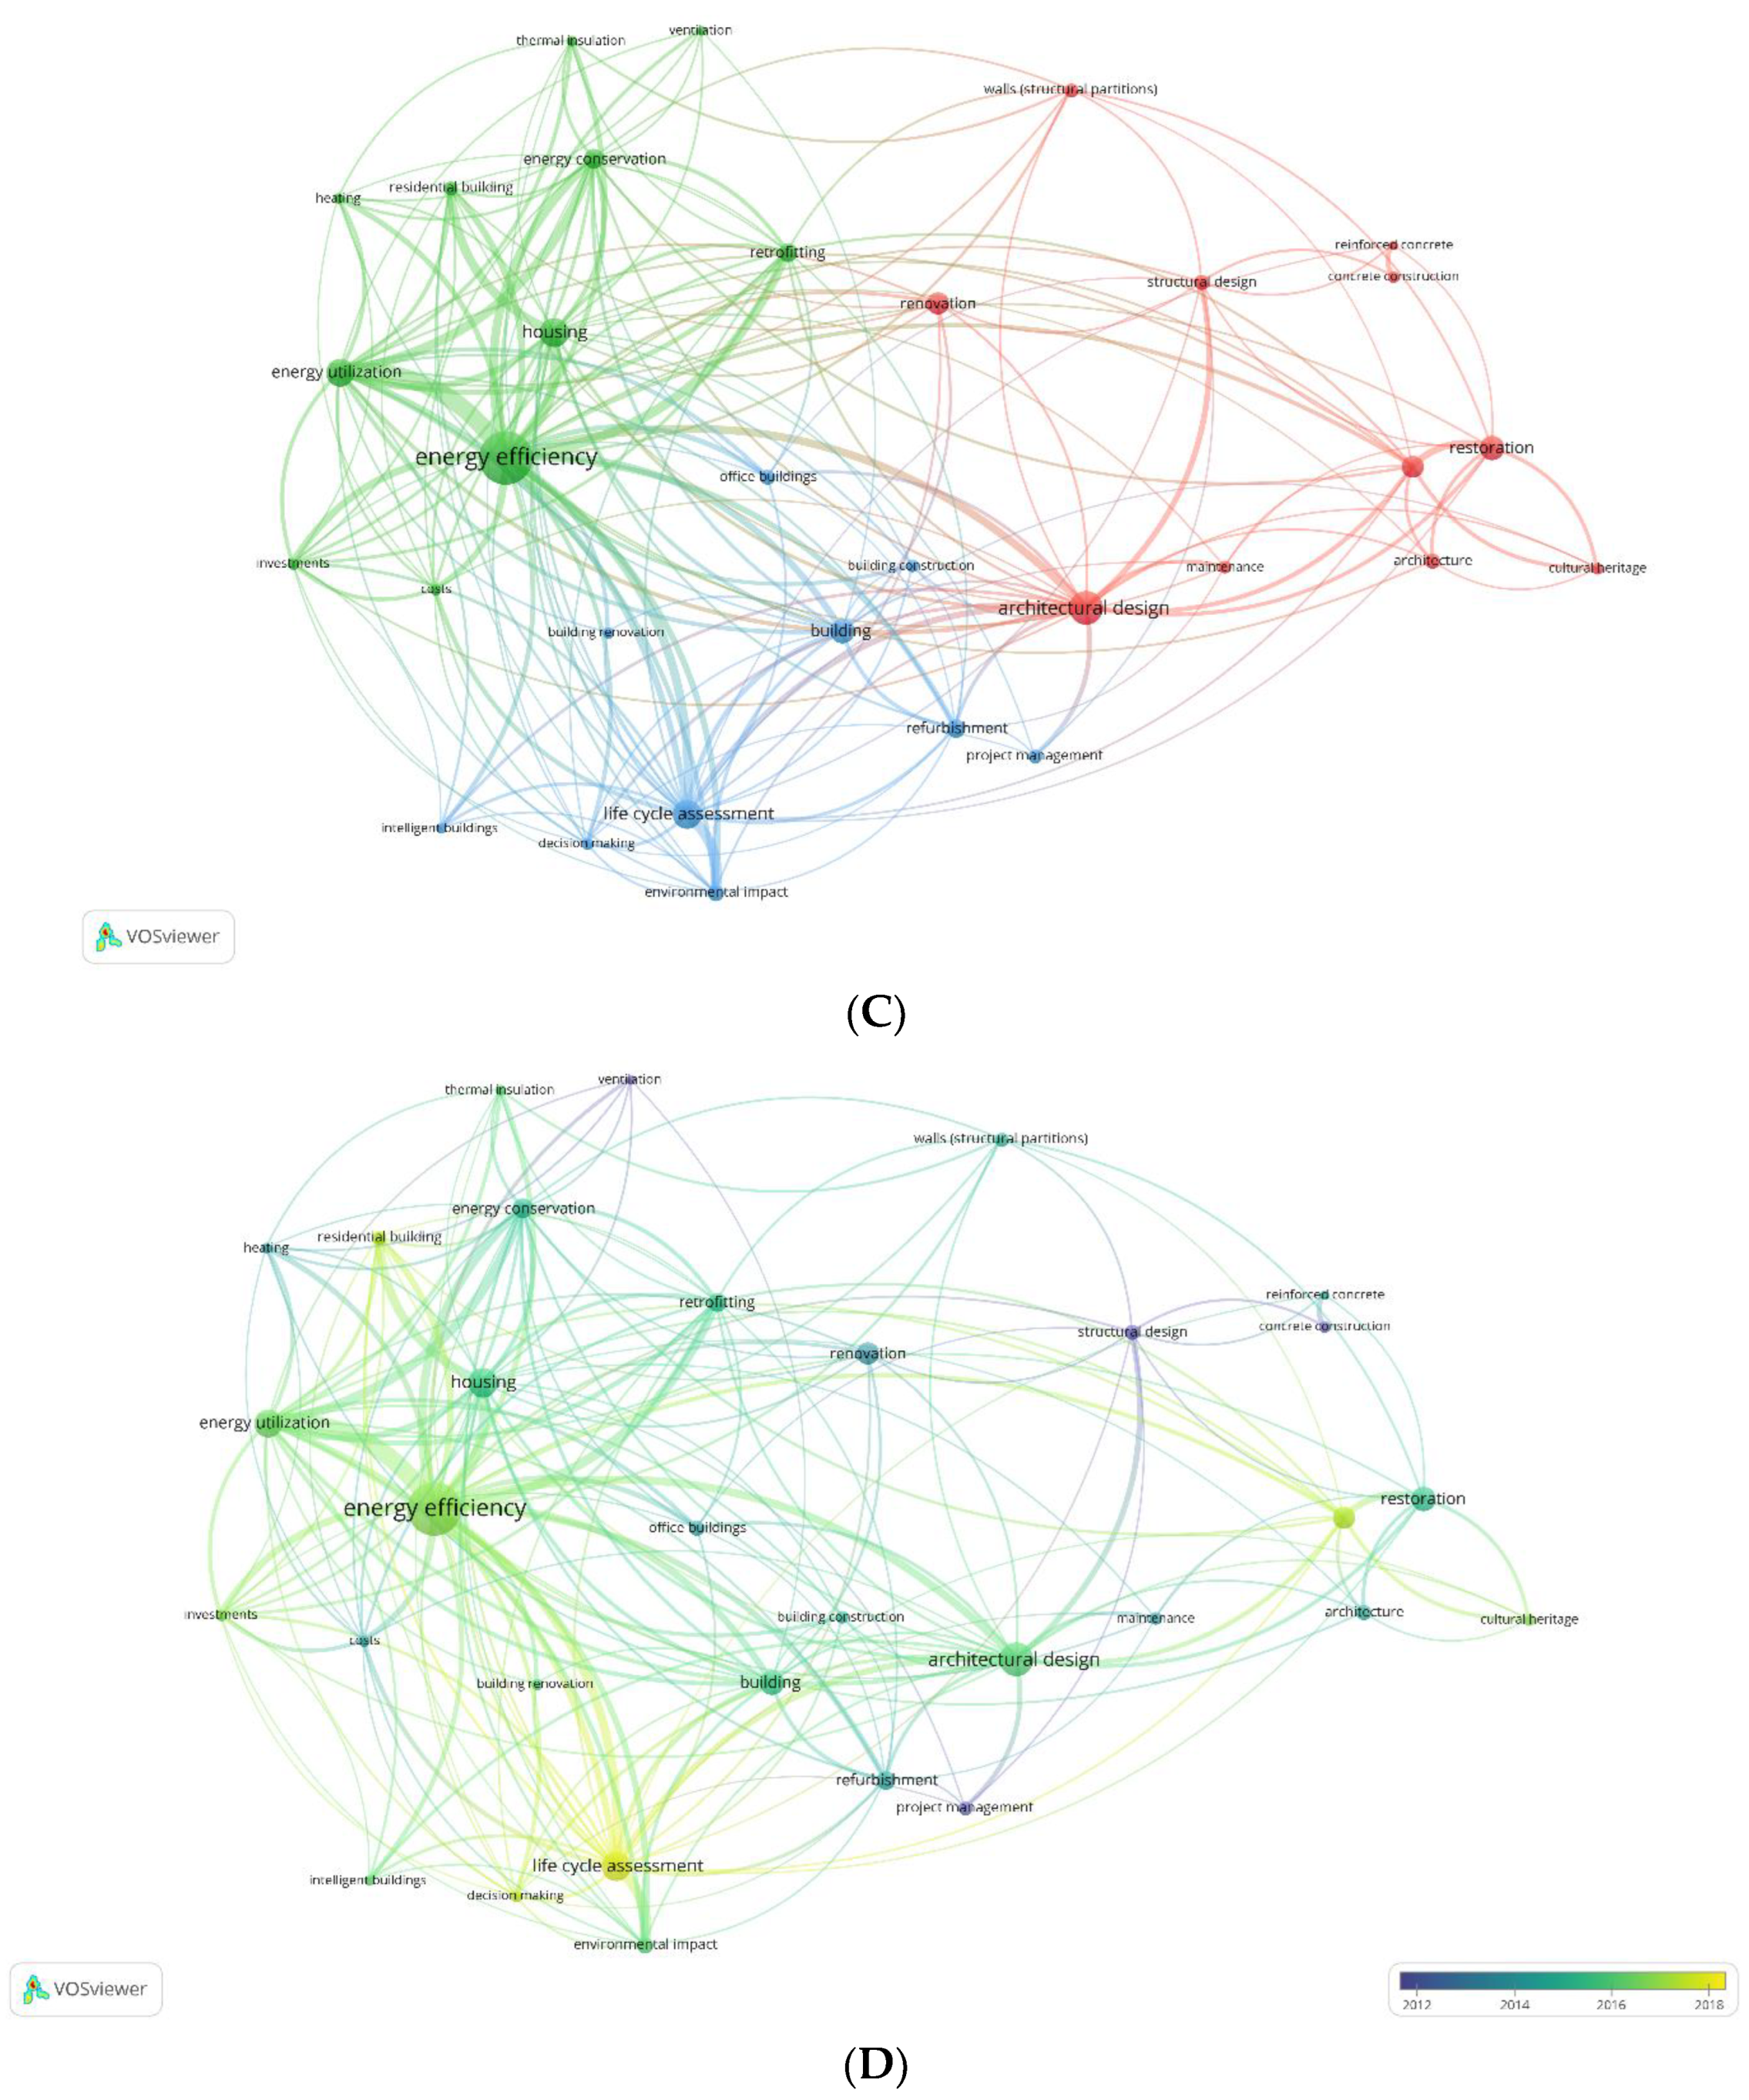
5.4. Search 4: Reusing Buildings

The fourth search considered the body of literature discussing reusing buildings as a whole because retaining the buildings in use for a long time could have a beneficial impact on the C&DW levels. The keywords used in the search were: ‘Refurbishment OR renovation OR (heritage AND restoration) AND building AND construction’. This resulted in 4665 results, with publication dates ranging from 1960 to 2023 (Figure 4A).
Refurbishment, renovation, and restoration research has seen rapid development much earlier than the other searches, starting in the 2000s (Figure 4A). Figure 4B shows that the US and larger European countries as leaders in this area, with Italy standing out as one of the key leaders in research in this area.
The visualisation of keyword co-occurrences in Figure 4C shows three main clusters, green, red, and blue, each taking up around a third of the research. None of these clusters are centred around concrete, despite its dominance in the previous searches, and both reinforced concrete and concrete construction appearing as part of the red cluster. Green is the most prominent cluster, with a focus on heating and energy. The nodes of ‘energy efficiency’ and ‘energy utilization’ are largest and the nodes of ‘housing’ and retrofitting’ are also prominent. The research from this cluster appears to have a focus on renovation or restoration of buildings to improve their warmth and energy use, and possibly more so to achieve this for housing. Within this cluster, there is a node of ‘Investment’, and there is no mention of the environment or sustainability, suggesting that this cluster of research is mainly around improvements of buildings towards cost savings.
The red cluster has a focus on the architectural and structural design side of renovations, including heritage restoration, structure, and maintenance. This research appears to focus on restoration or renovations to save the architecture of the building. No nodes in this cluster mention of sustainably either.
The third blue cluster has a focus on environmental impacts and LCA but also mentions intelligent buildings. The nodes of ‘environmental impacts’ and ‘life cycle assessment’ have strong links to the ‘energy efficiency’ node in the green cluster.
Comparing this analysis against the timeline overlay in Figure 4D, it seems that the red cluster might be the earliest research comparatively to the other clusters, which makes sense given maintenance a heritage significance has been discussed for a very long time. Consequently, this search has a much longer timeline analysed in Figure 4D. In addition, some aspects of the energy efficiency cluster, such as ventilation, seem to appear as early as in 2012. Heating and energy conservation became prominent around 2015 and energy efficiency became prominent in 2017. Within this context, environmental impacts and especially LCA appear only more recently, around 2018.
The fourth search examined the research on reusing buildings as a whole, which could significantly reduce the overall need for new material extraction and C&DW levels. Unfortunately, this search did not record common terminology associated with C&DW. This signals that reuse of buildings as a whole is currently not seen as a way of reducing C&DW. As before, reuse, recycling, and circular economy also did not appear as recorded nodes.

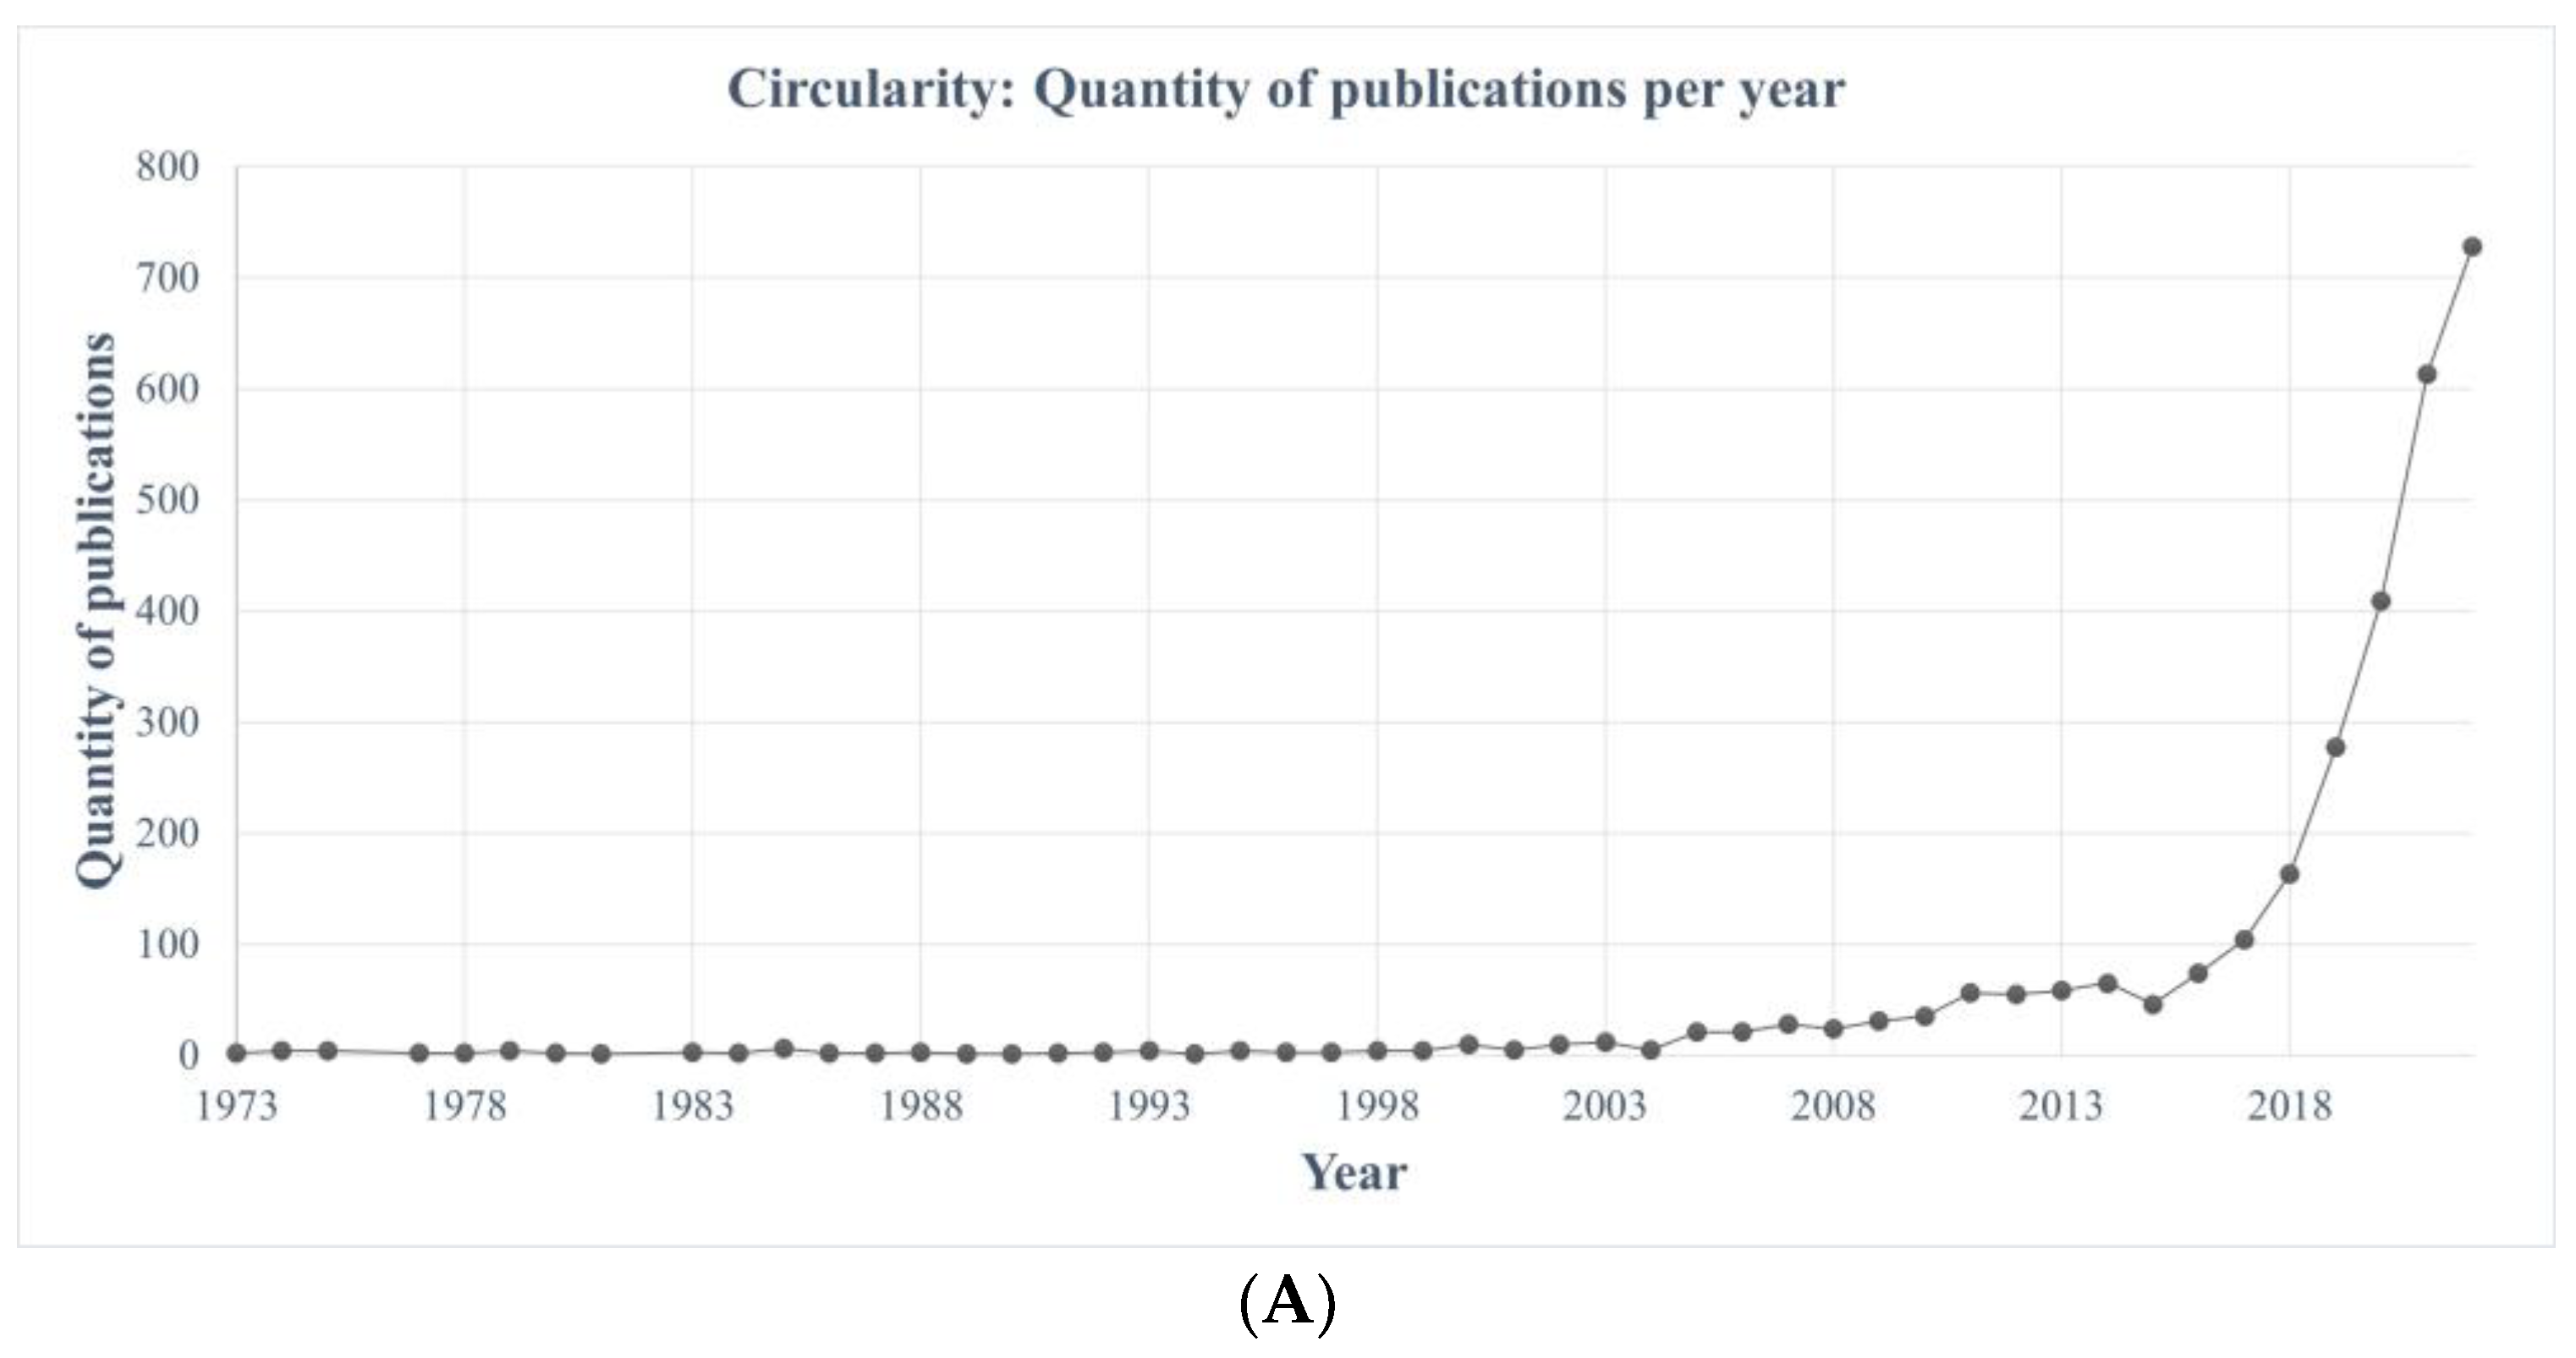
5.5. Search 5: Circularity

The fifth search was completed to explore the trends in discussion of a range of terms associated with circularity in relation to C&DW. This search used some of the popular terminology when discussing efforts to decrease the total material flow by keeping materials in use for longer. The keywords used in the search were: ‘Circular economy OR closing the loop OR zero waste OR narrowing the loop AND construction OR demolition’. This resulted in 3235 results, with publication dates ranging from 1973 to 2023 (Figure 5A).
Although the early publications in this field appeared in the early 1970s, overall the exponential development occurred since 2016, and especially since 2018 (Figure 5A), making this one of the more recent areas of research focus. Figure 5B shows that the US was an early prominent leader for research published in this field, with a cluster of larger European countries. Virtual absence of China, a modest node for India, and low levels of representation of non-European countries are also noteworthy.
This search resulted in three clusters (Figure 5C). The largest cluster is red, with the focus on the environmental impact and necessity to close the loop, such as climate change and environmental management. This cluster also has a prominent node of ‘economics’. Overall, the largest nodes are ‘LCA’, ‘environmental impact’, ‘waste management’, ‘C&DW’, and ‘environmental impacts’. The green cluster on waste management contained nodes already seen in earlier searches, but also ‘environmental protection’, ‘environmental economics’, and ‘industrial waste’, signalling that this search included a different body of the literature. However, the blue cluster reiterated the already seen concerns related to C&DW of concrete (Figure 5C).
Figure 5D shows that in this search topics of landfill, waste disposal, concrete, and economics are among the early discussions from 2018, while the environmental impact comes later, and the most recently discussed topics are LCA, greenhouses gasses and climate change.
The fifth search evaluated if discussions about circularity and retaining materials in use for longer offer new approaches to C&DW, but showed that even when the search terms included ‘circular economy’, ‘closing the loop’, and ‘zero waste’, none of those were among the nodes based on the identified literature, which possibly signals that these areas of study are still in their infancy. This is supported by Figure 5D which covers only the range between 2018 and 2021.

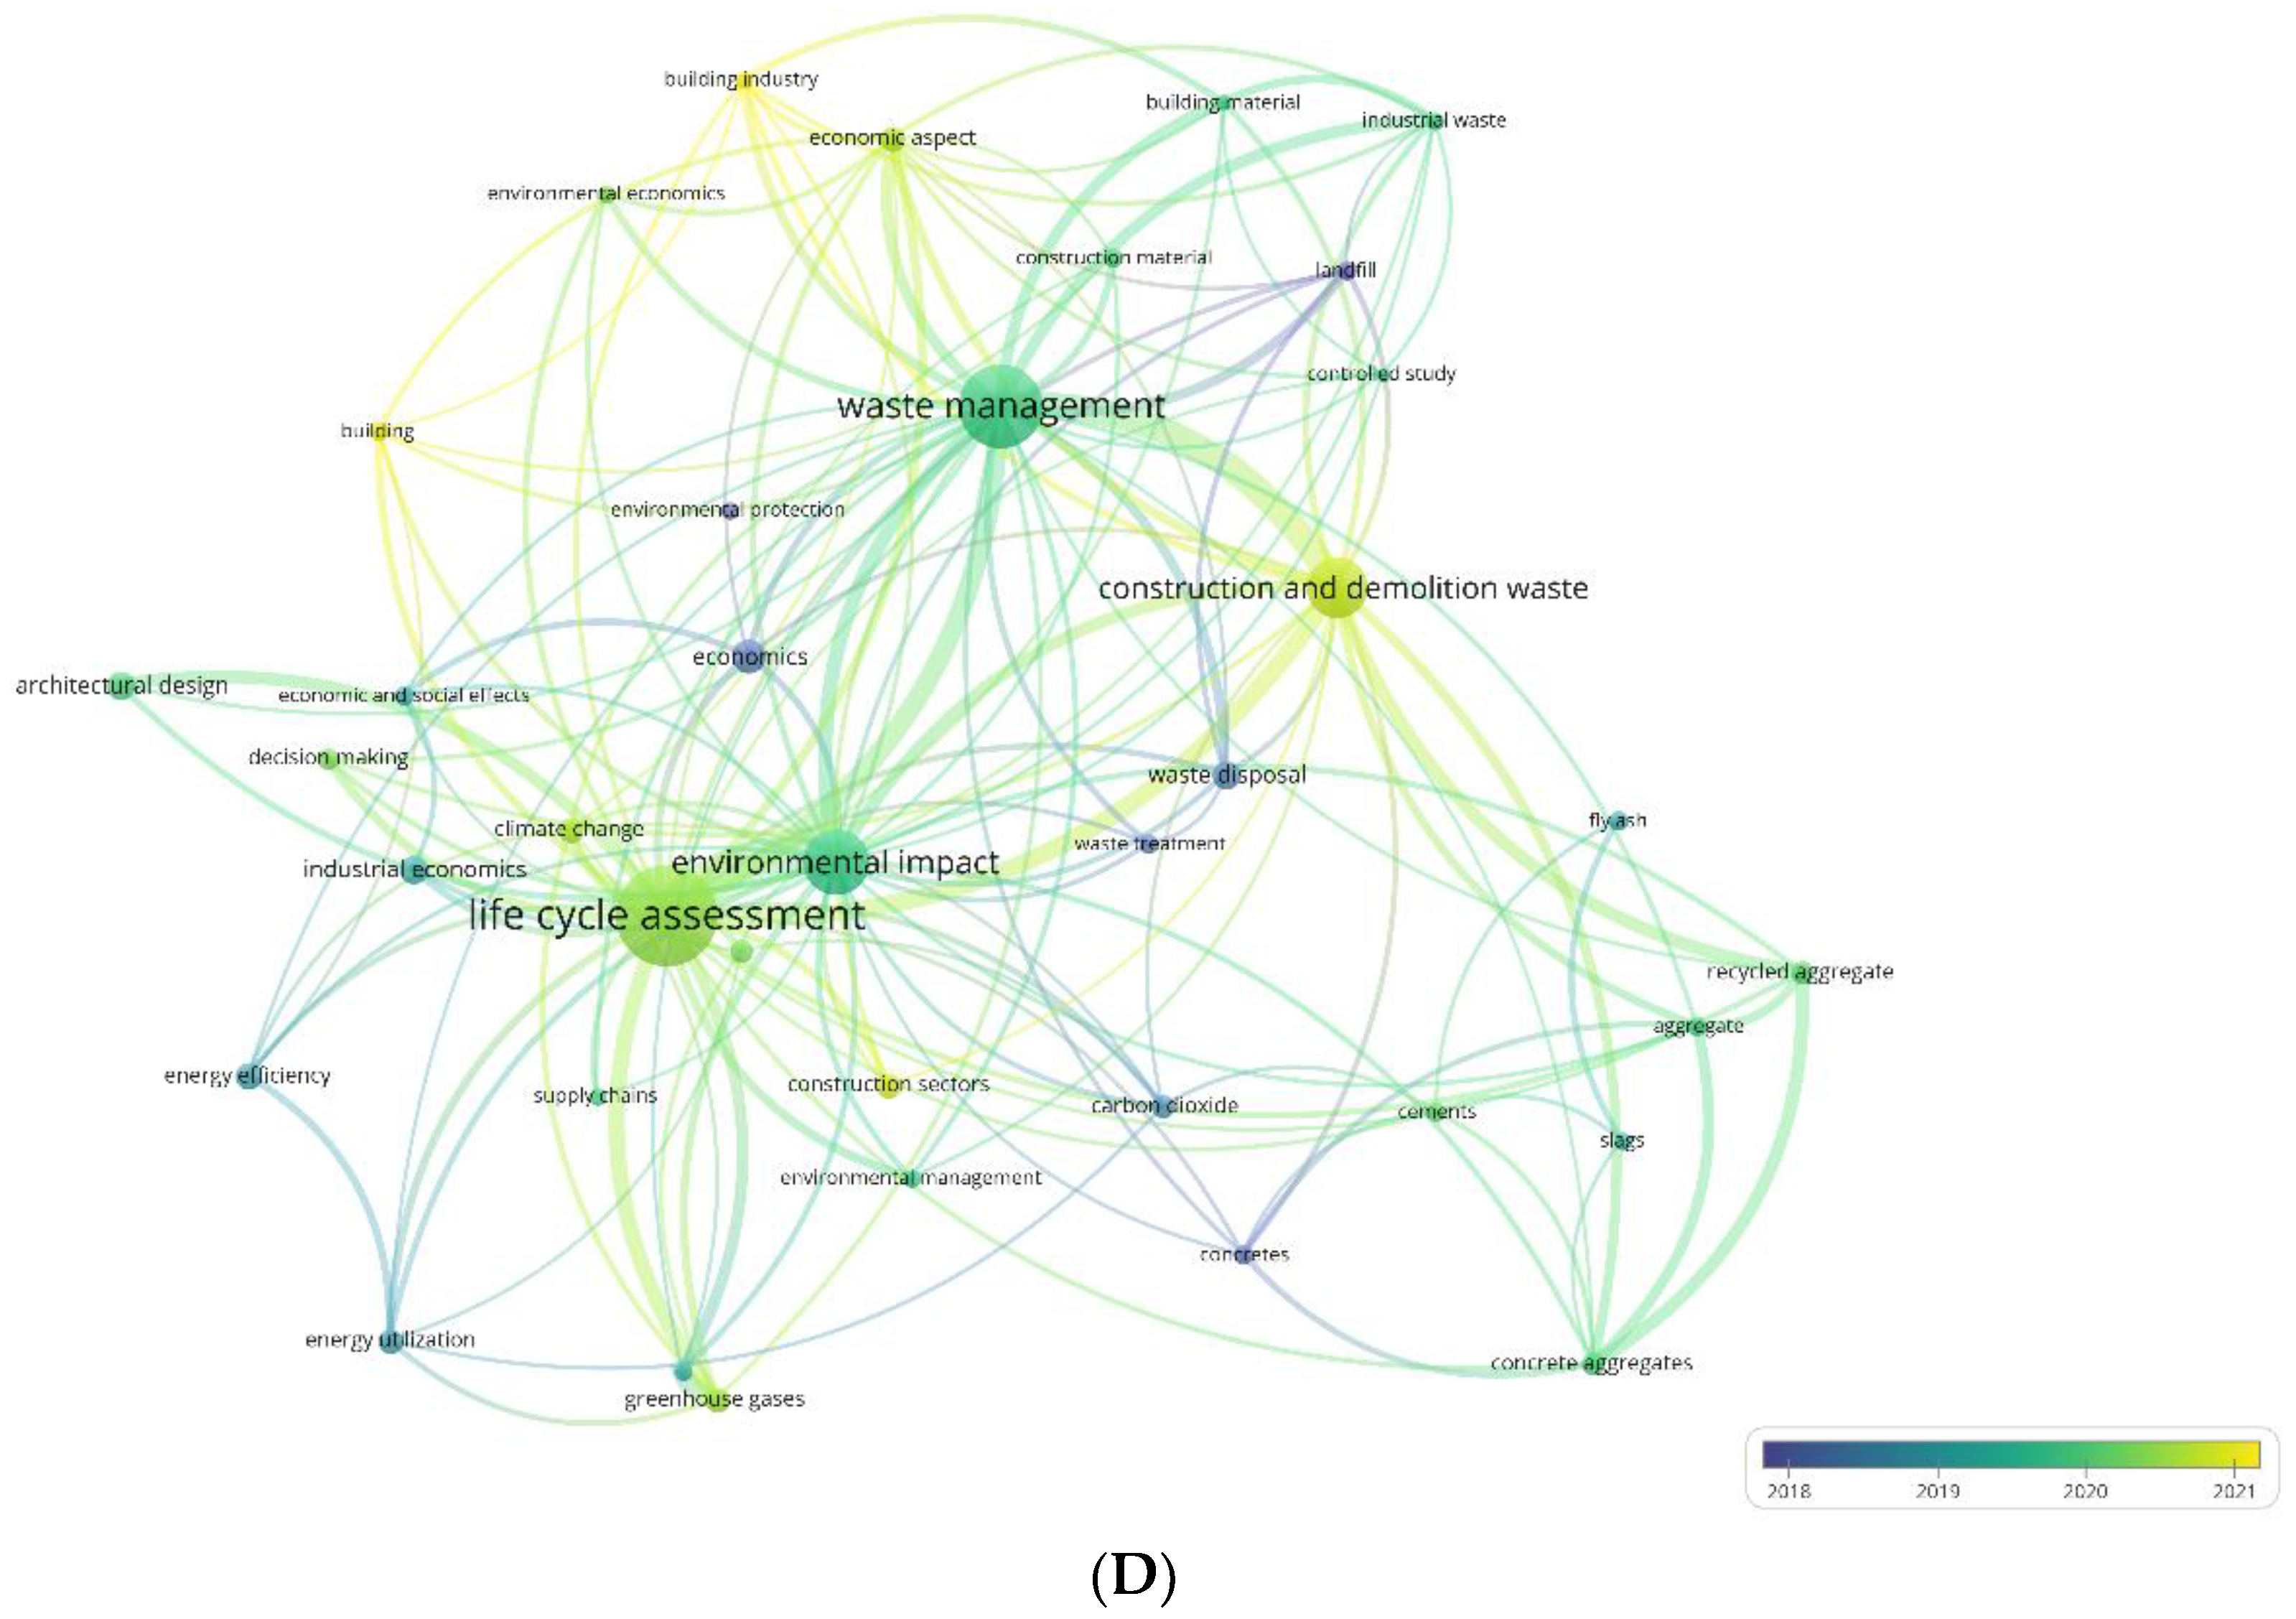
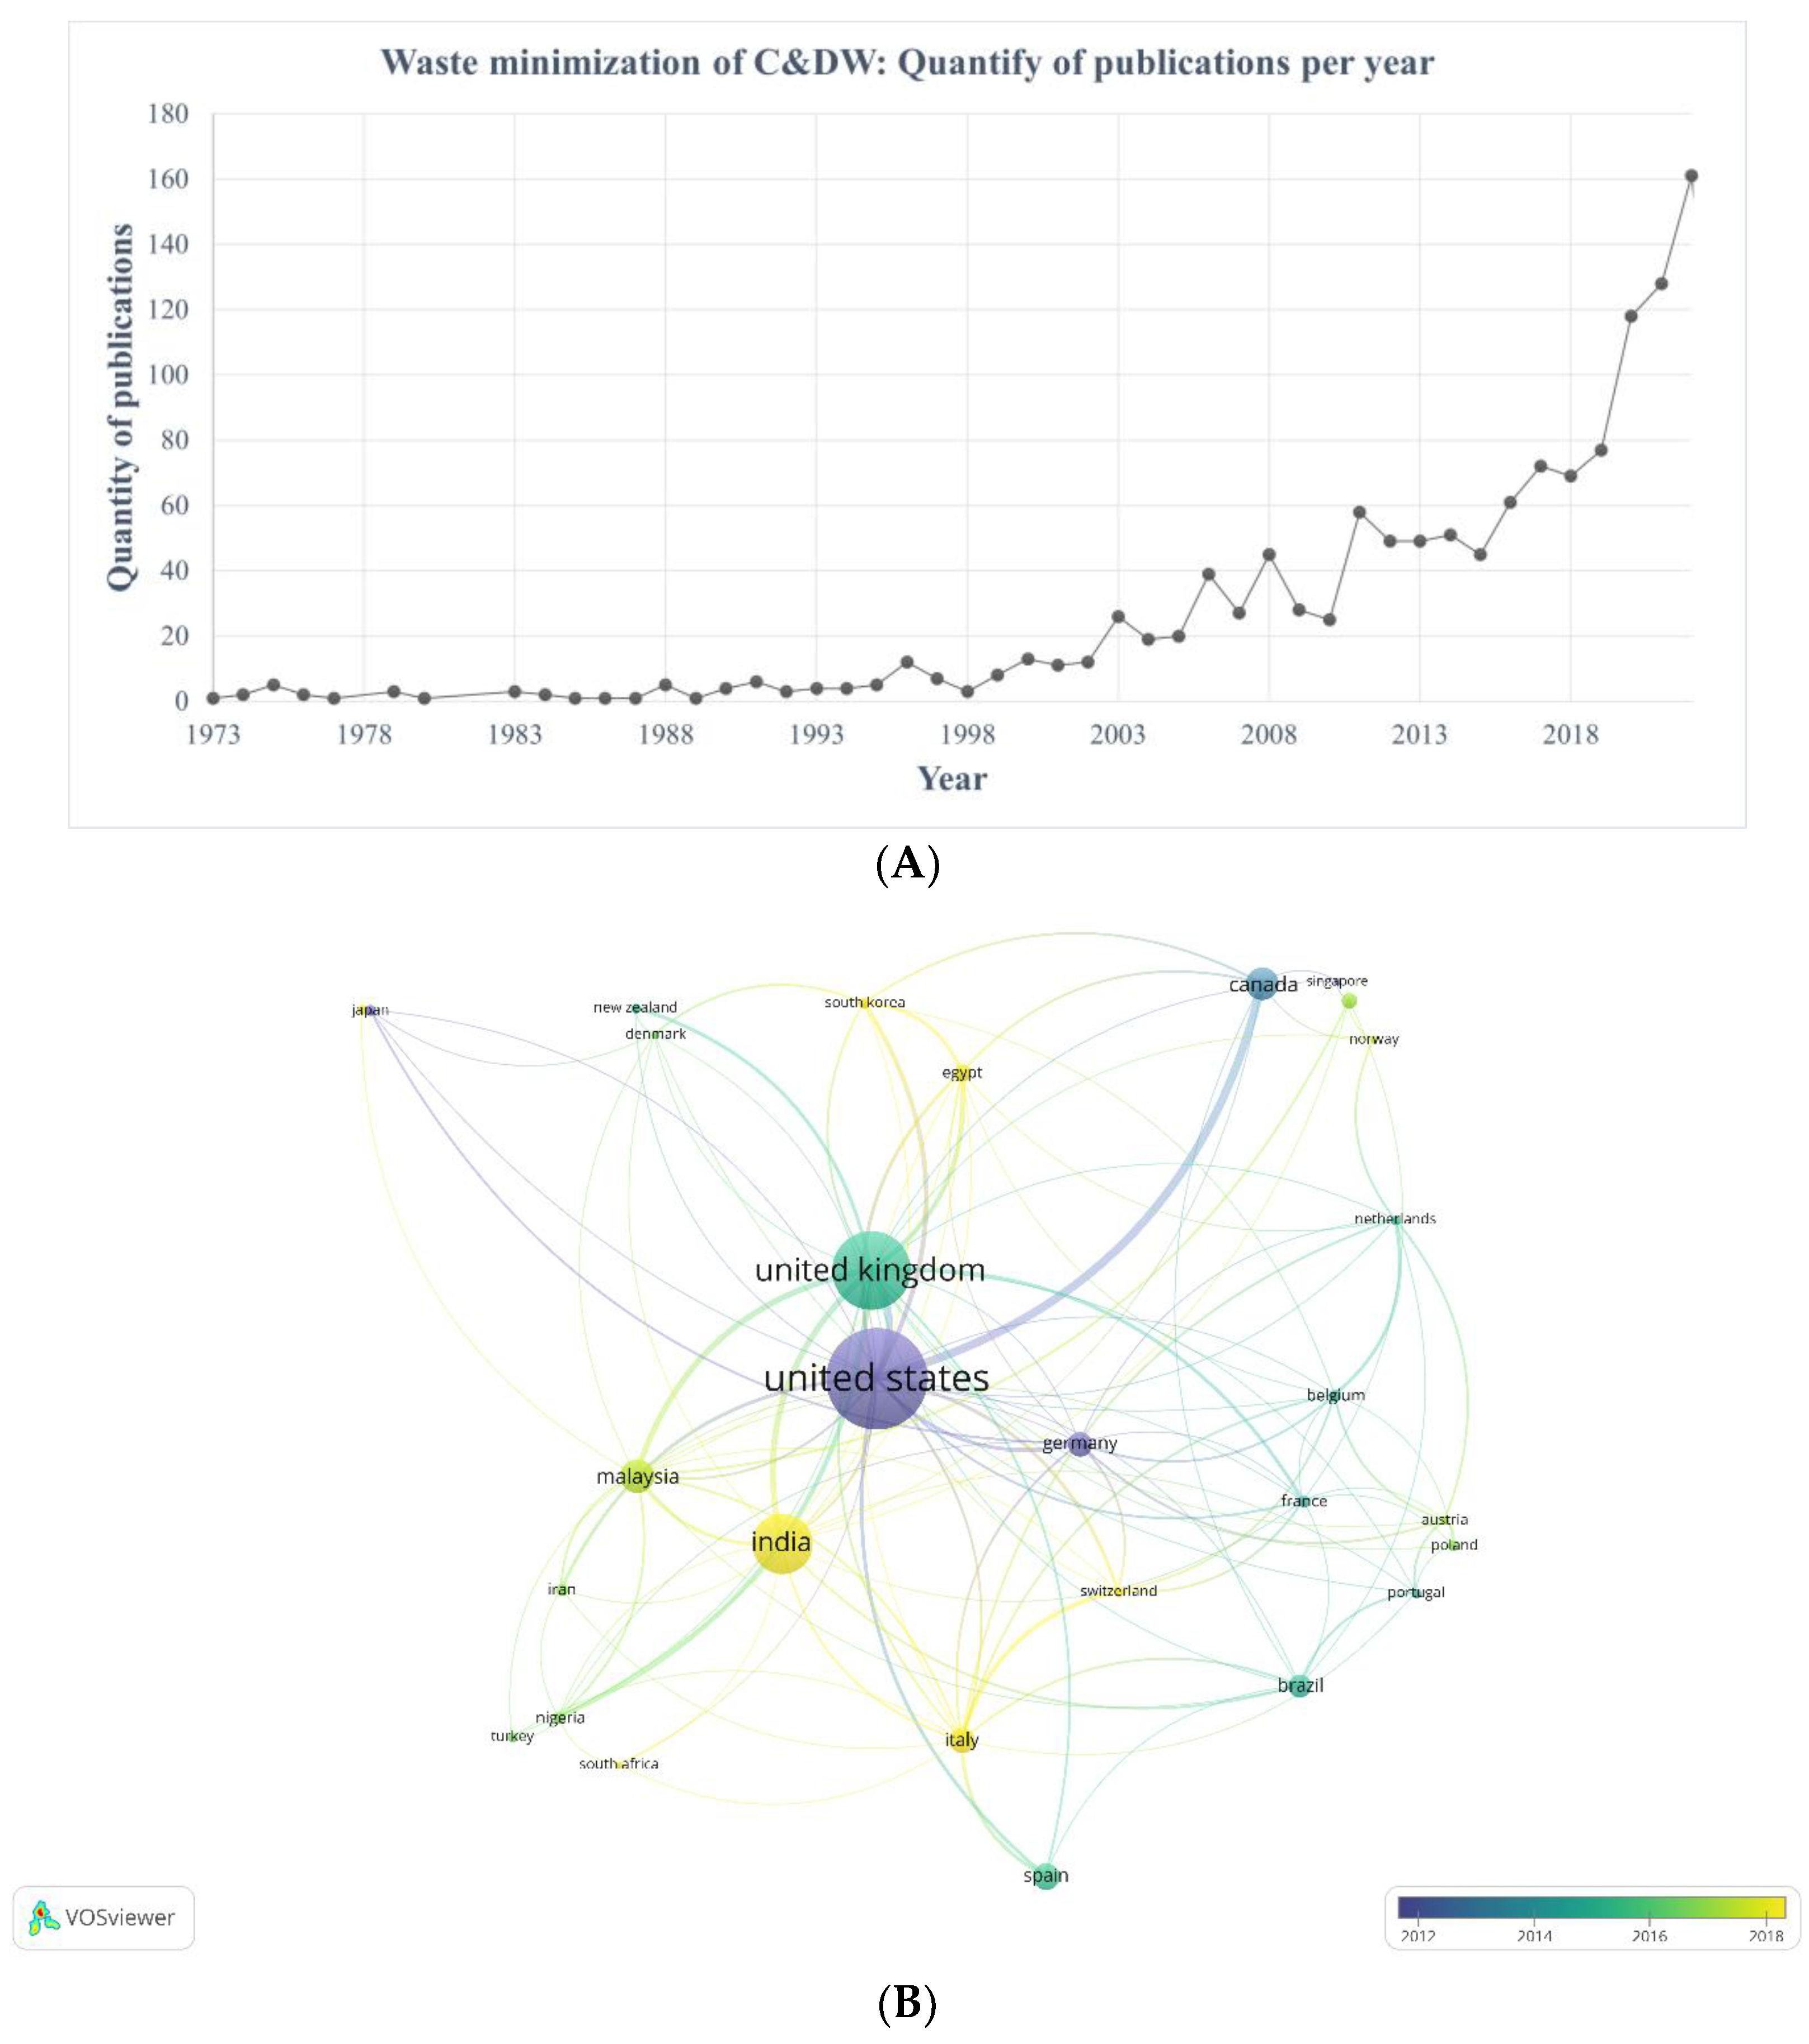
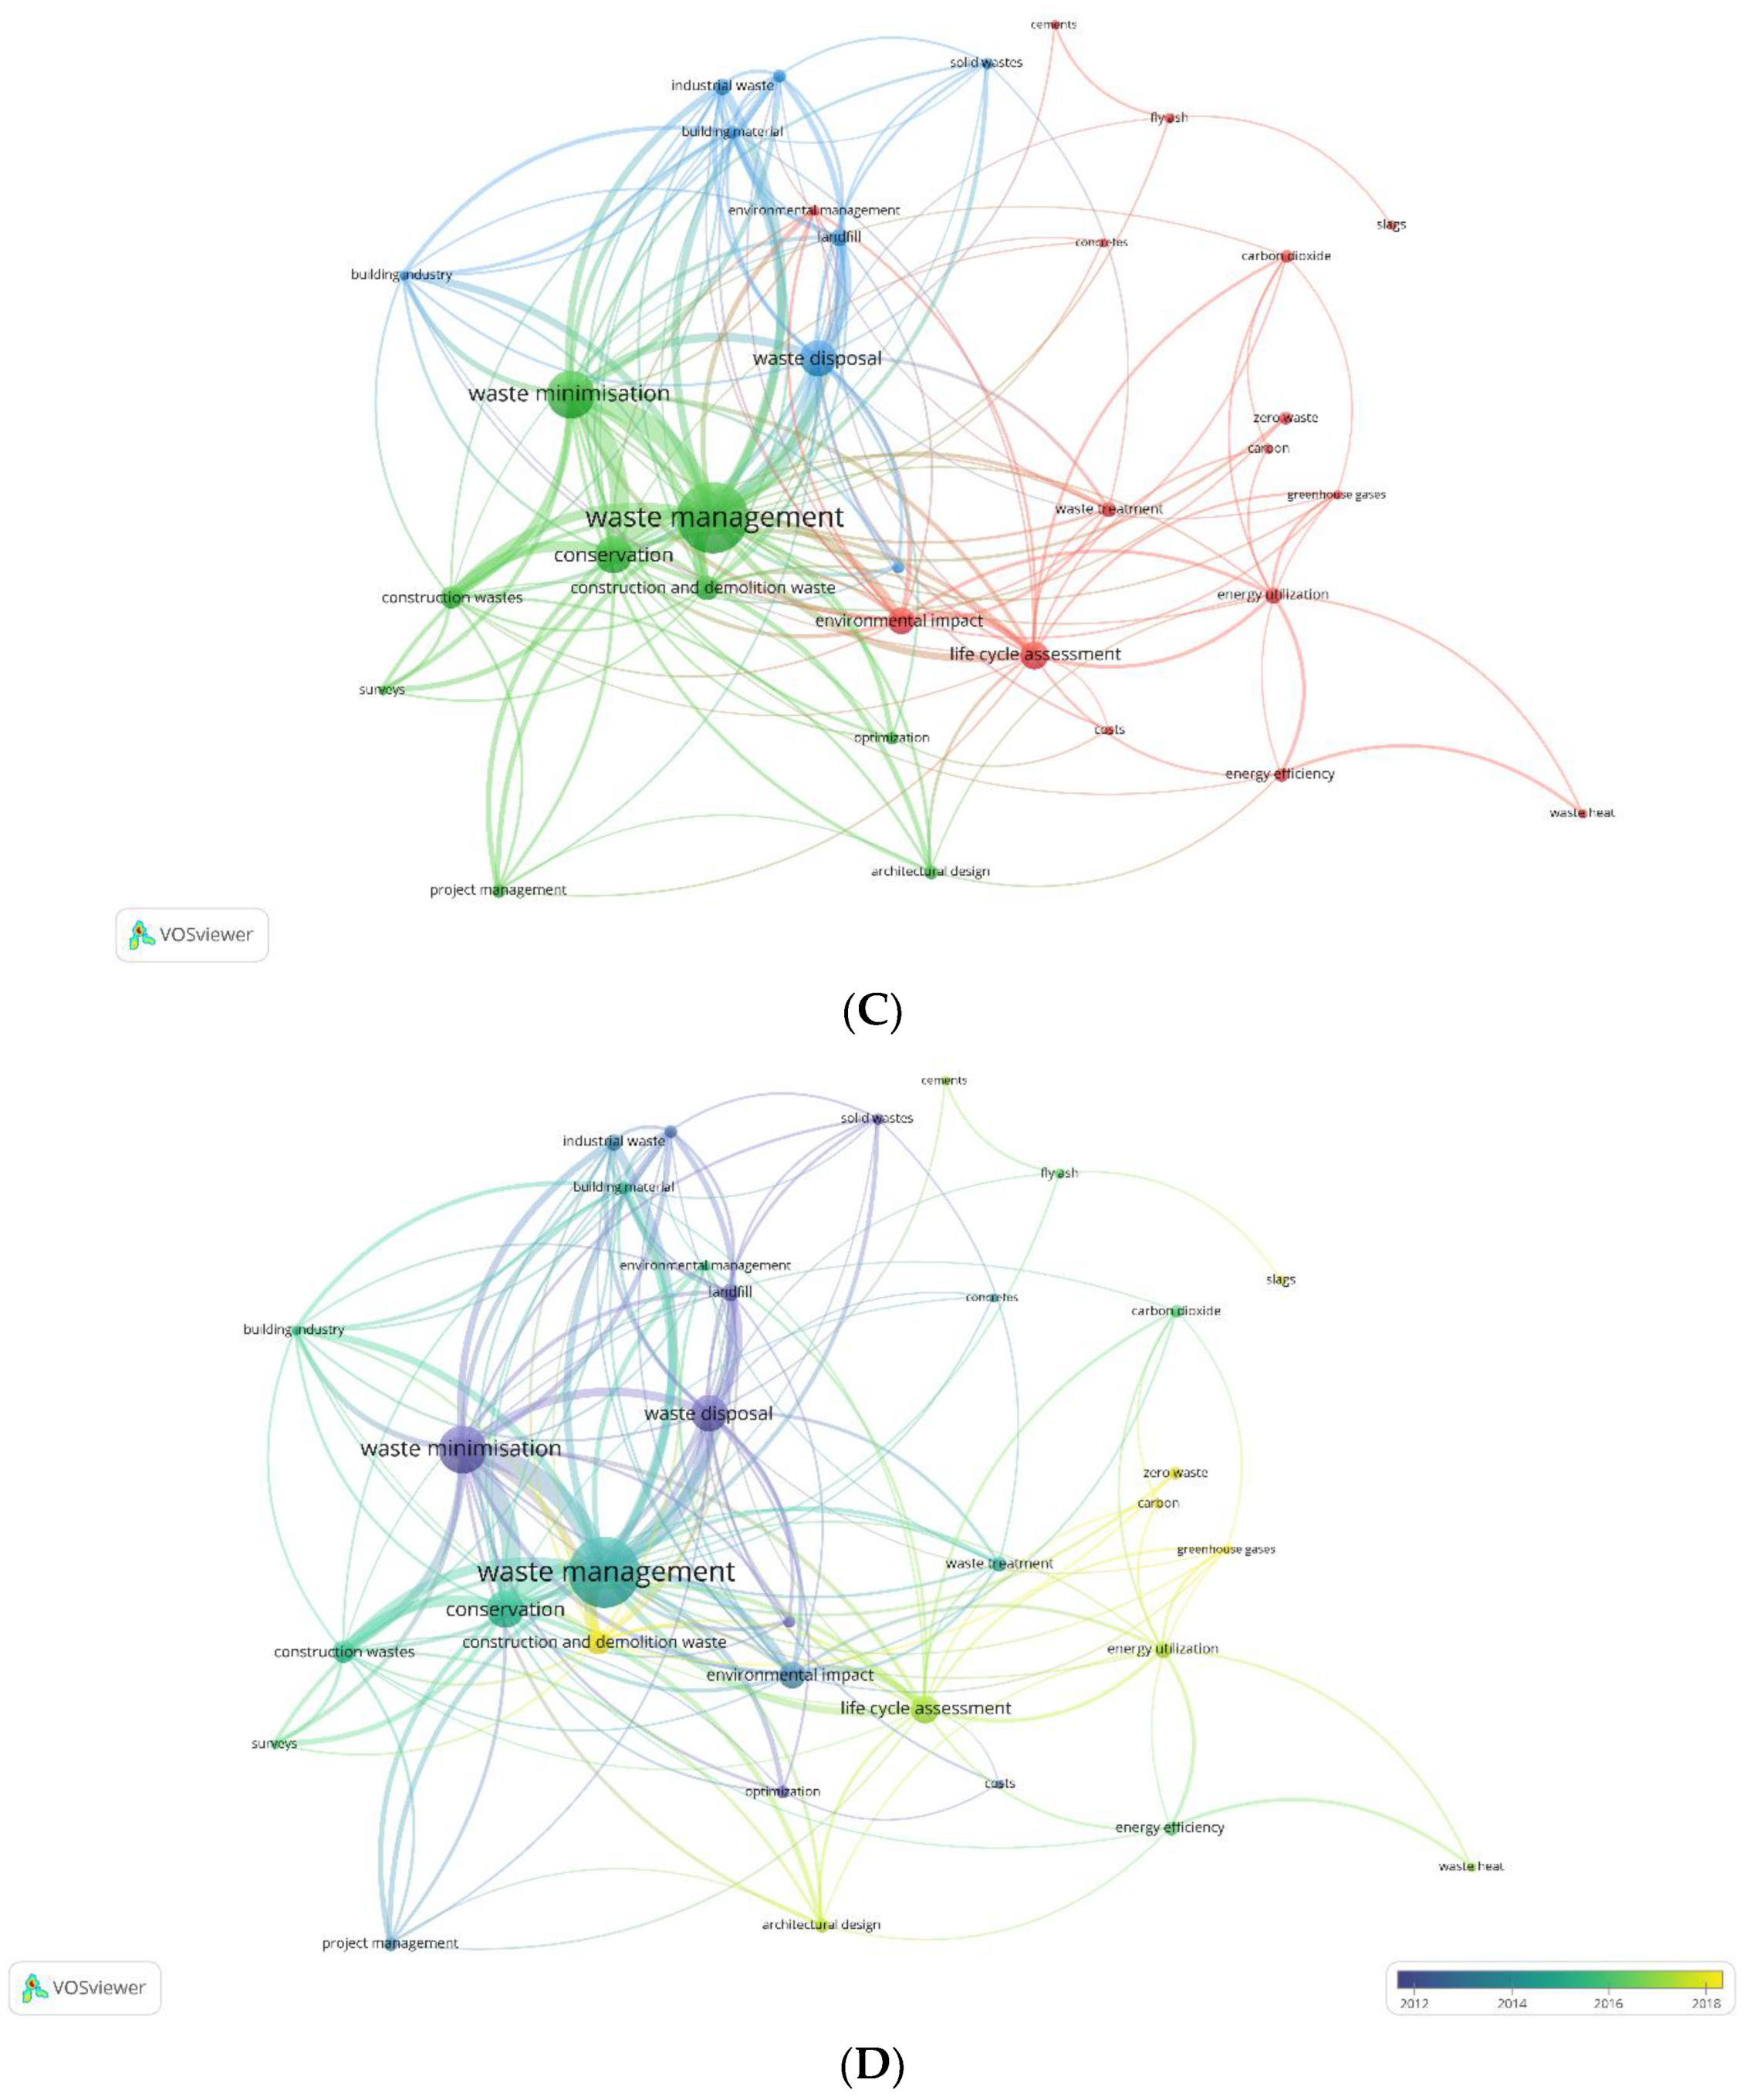
5.6. Search 6: Waste Minimisation of C&DW

The sixth search was completed to look for patterns in the ways waste minimisation was discussed in relation to construction and demolition, because waste minimisation can be a useful planned activity to reduce C&DW. The keywords used in the search were: ‘Waste minimization OR waste minimisation OR zero waste AND construction’. This resulted in 1356 results, with publication dates ranging from 1973 to 2023 (Figure 6A).
Figure 6A shows that discussions on waste minimisation in relation to construction and demolition started in the early 1970s and sustained a decent level of interest since. The rapid increase in research in this area started from 2018, but based on an already established pattern of steady and somewhat linear increase, some of those characteristics have been since retained. The US has been a leader in the field of waste minimisation since before 2012, and dominates the research produced in this area (Figure 6B). Japan, Germany, and Canada formed smaller research nodes around the same time. This has then been followed by the UK around 2014, which is the other significant contributor to research in this area. Post-2018 research has seen prominent contributions from India, with a range of smaller nodes emerging.
Figure 6C does not show concrete as a cluster. This is the second search where concrete did not emerge as a cluster, suggesting that concrete recycling research is more commonly associated with waste disposal strategies and the end of the material flow, rather than a pre-planned waste minimisation strategy. Nevertheless, small nodes of ‘fly ash’, ‘slags’, ‘cement’, and concrete itself as an unnamed node (see Supplementary Data) are present within the red cluster, which is where concrete absorbs waste from other industrial processes helping their waste minimisation (Figure 6C). The research on waste minimisation appears to be grouped in three clusters. The green cluster is the largest and includes the nodes of ‘conservation’, ‘architectural design’, ‘project management’, and ‘surveys’. The cluster seems to have a focus on design, planning, and conservation strategies to minimise C&DW before it is created. The blue cluster is second largest and has focused on C&DW disposal and landfill, with a focus on waste once it is created. These two clusters have many links between them, with the strongest links between the nodes of ‘waste disposal’, ‘landfill’, and ‘waste management’. Finally, the third, red cluster is much smaller and more dispersed and focused on environmental impacts, LCA, energy, and carbon, and it also includes concrete-related research. The green and blue clusters both focus on solid C&DW, while the red can be seen as focused on energy waste, carbon, and emissions.
Figure 6D shows a reasonably clear progression in development of research topics overtime, with waste minimisation, waste disposal and landfills are the first topics discussed around 2012. Then, environmental impact, waste minimisation, conservation and project management are discussed around 2014–2015. This means that generally, the topics captured within the green and blue clusters in Figure 6C were discussed between 2012 and 2015, while the red cluster shows more recently researched topics, with publication dates from around 2015 (pale green to yellow in Figure 6D). The keywords of ‘environmental impact’ were discussed around 2015, and the keywords of ‘lifecycle assessment’, ‘energy utilisation’, and ‘waste heat’ were discussed around 2017 (Figure 6D). The most recently discussed topics within waste minimisation are ‘zero waste’, ‘carbon’, and ‘greenhouse gasses’ (Figure 6D).
Although the sixth search on C&DW minimisation and showed similar trends, as already noted in previous searches, it is evident that architectural design and project management stood out more within this context.

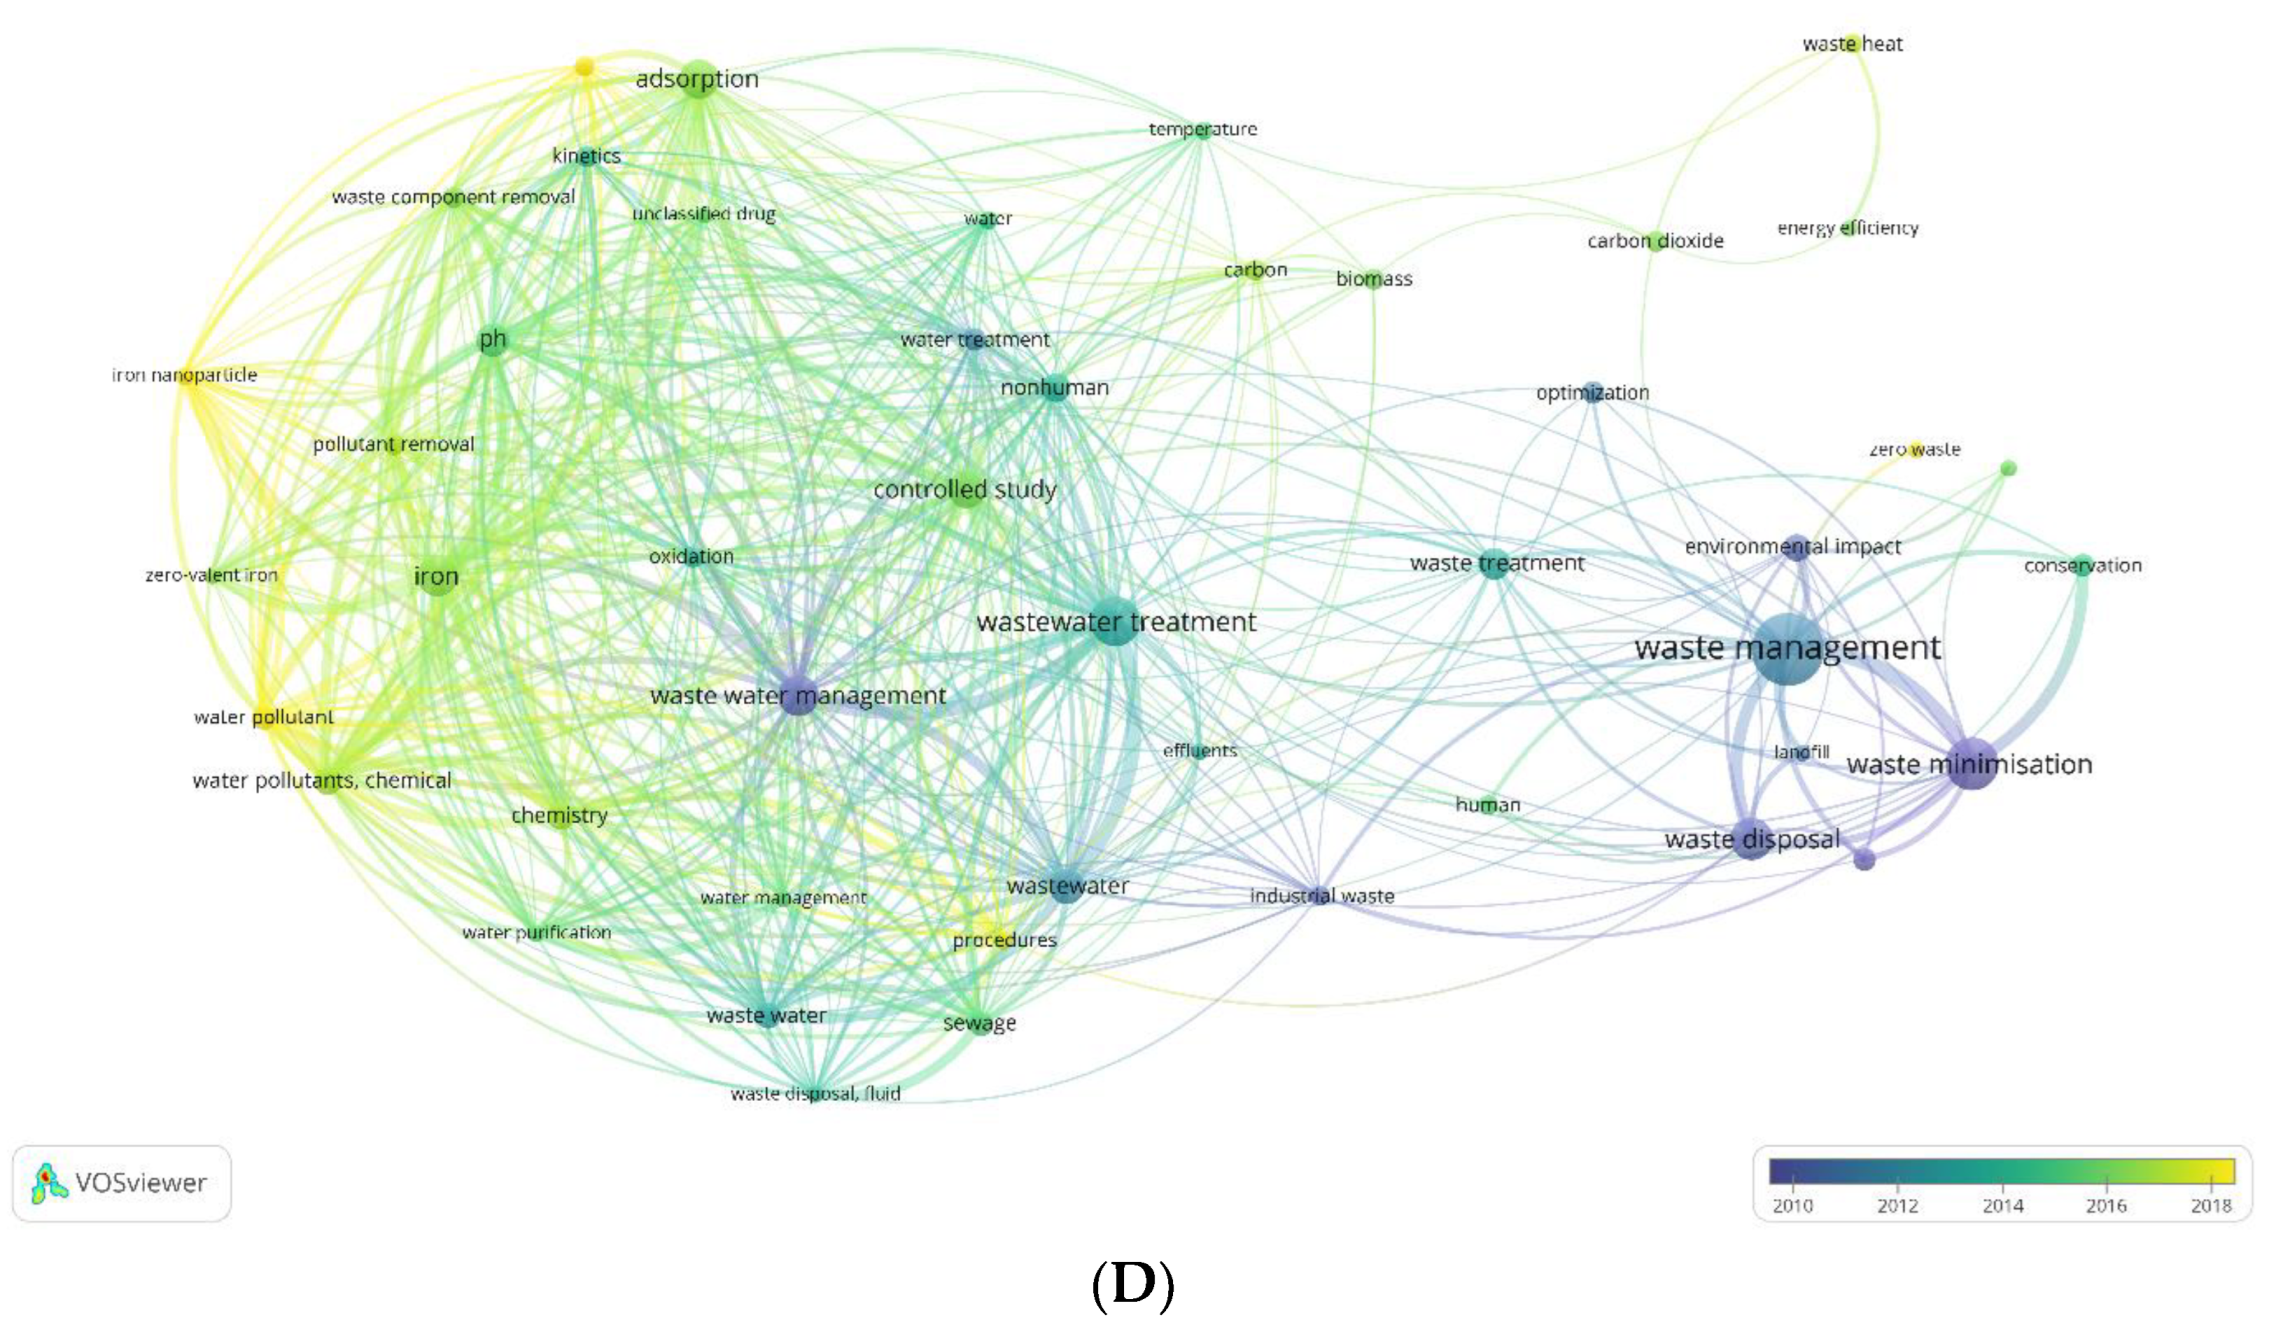
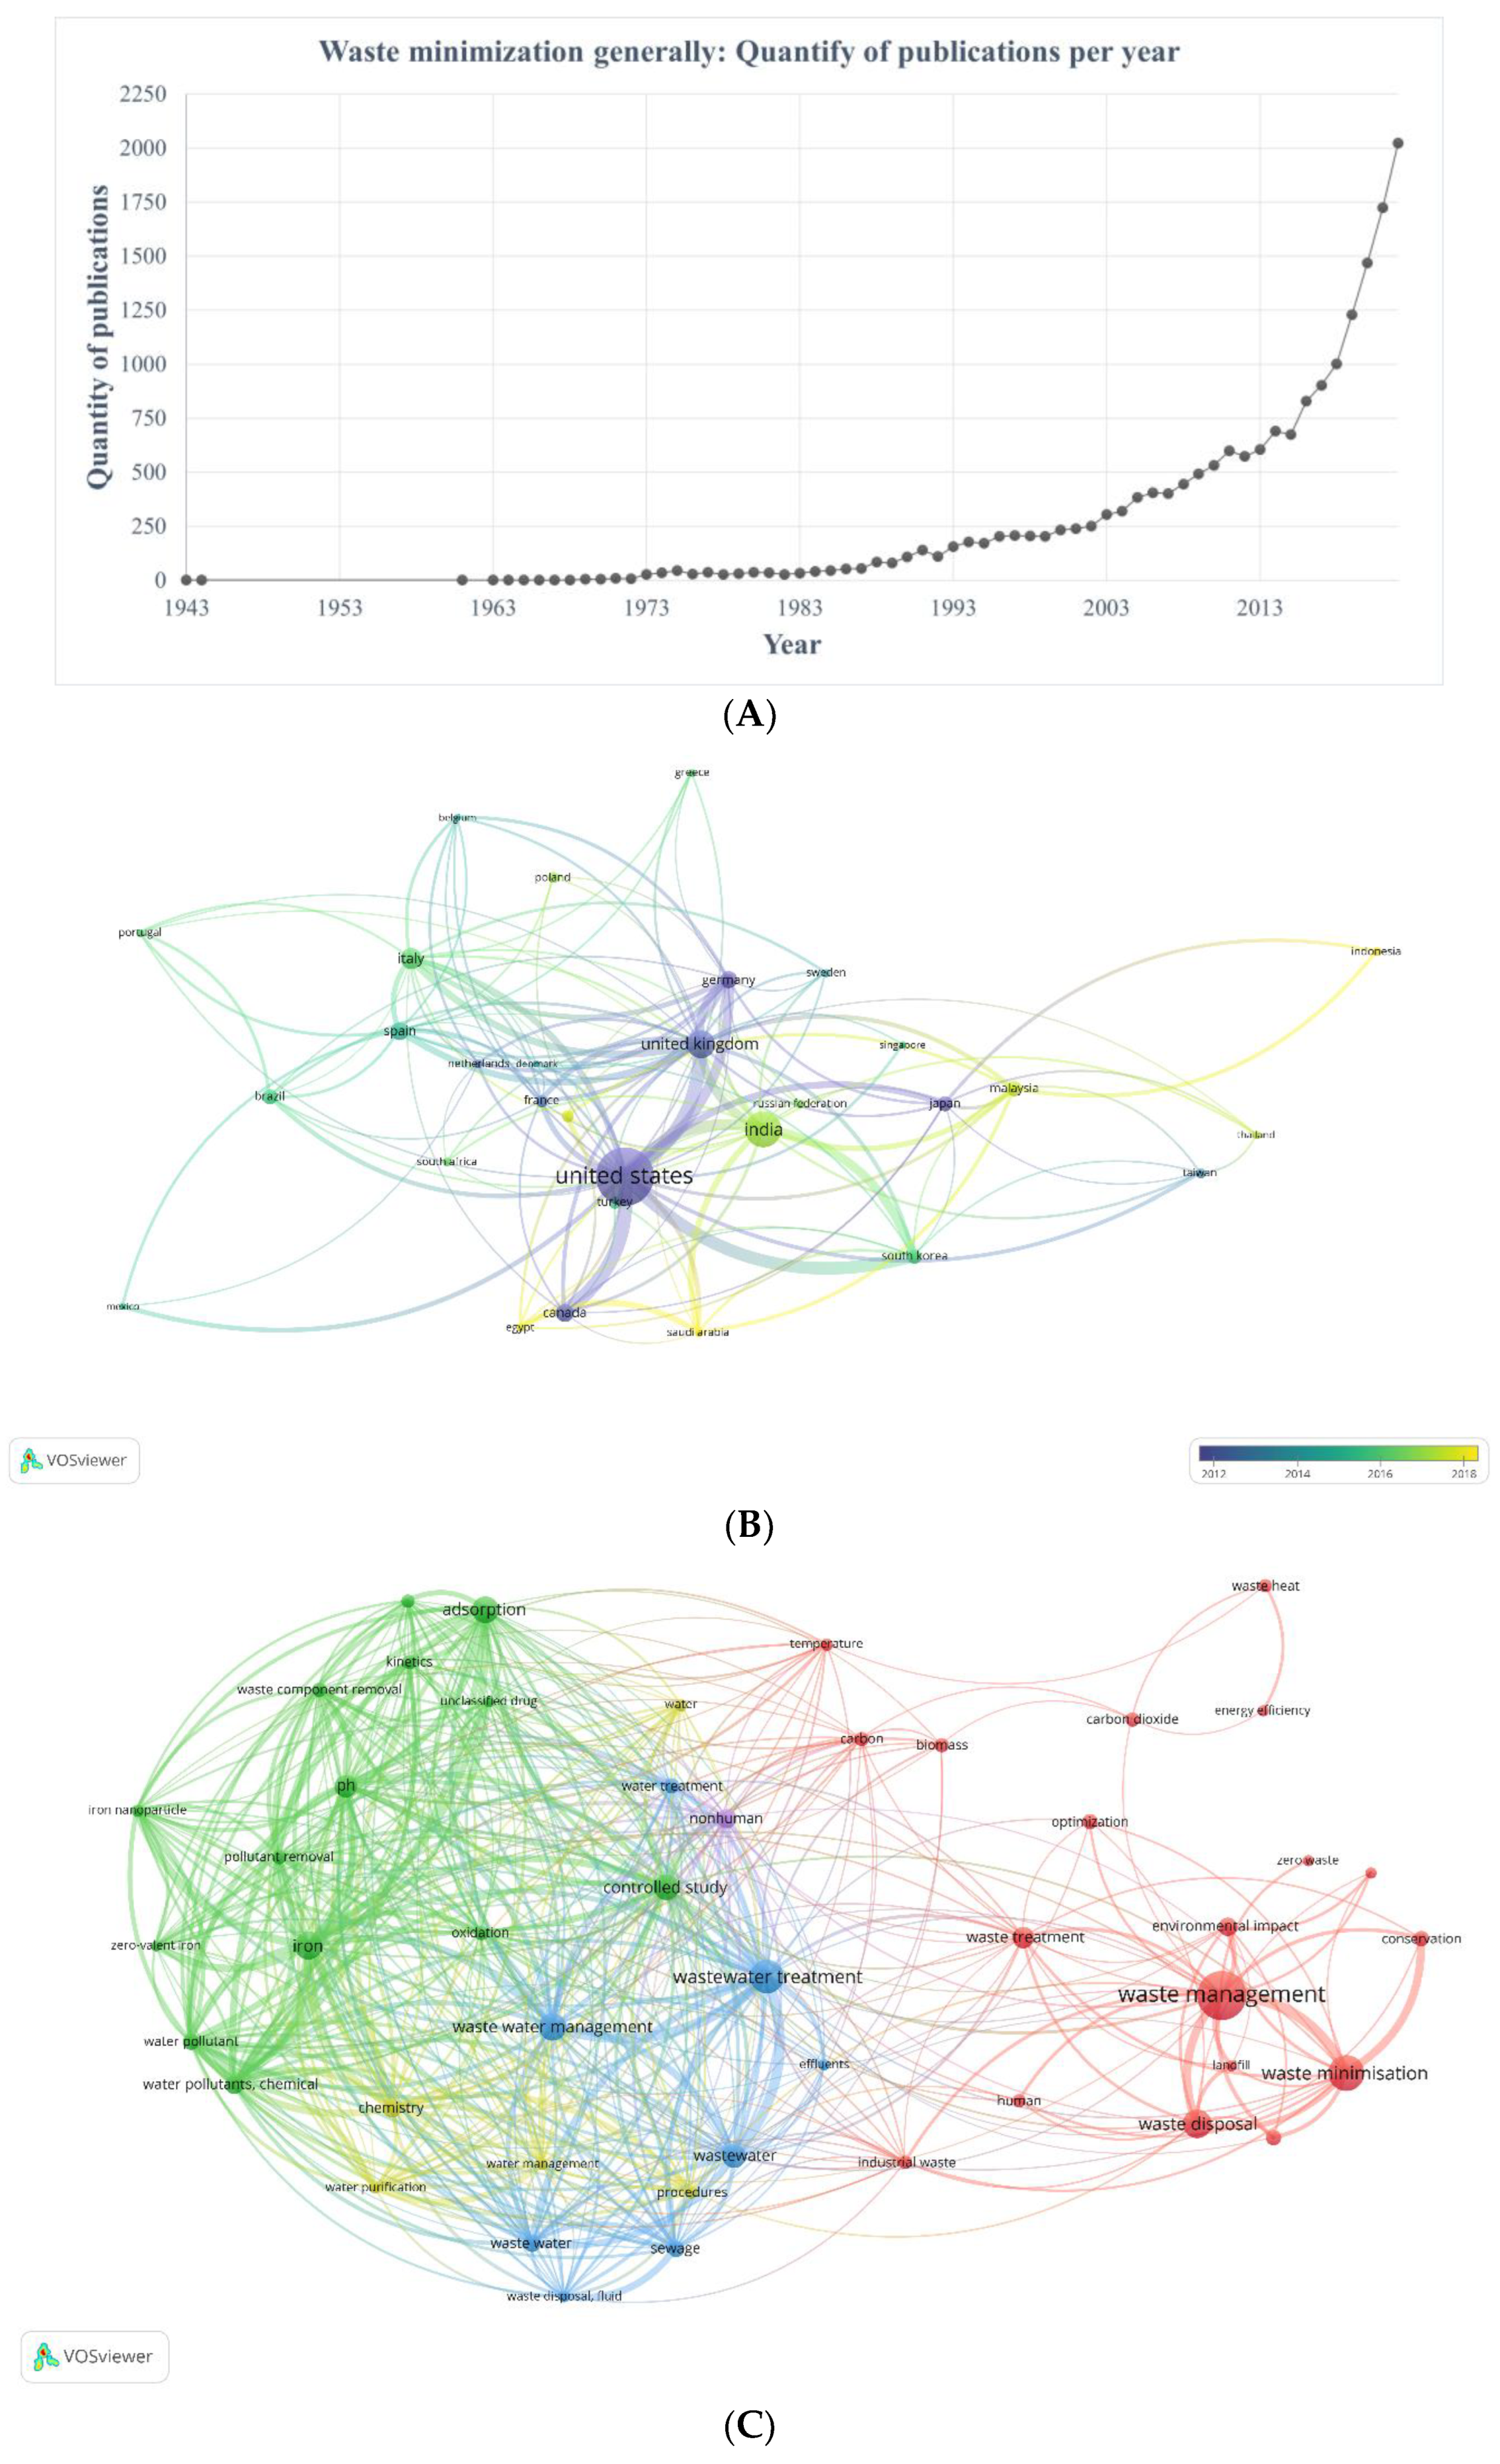
5.7. Search 7: Waste Minimization Generally

The seventh search was completed to overview trends of waste minimisation efforts more generally, and without a specific focus on construction and demolition. However, this search also would have included all research analysed in the sixth search, and therefore this search can examine how the research on C&DW compares against other waste minimisation efforts. This is the most voluminous search undertaken in this series. The keywords used in the search were: ‘Waste minimization OR waste minimisation OR zero waste’. This resulted in 19,693 results, with publication dates ranging from 1943 to 2024 (Figure 7A).
Figure 7A shows that the levels of waste minimisation research have followed an exponential trend, which started in the 1970s and 1980s and saw rapid development from the 2000s onwards. Figure 7B shows that the US, UK, Germany, Japan, France, and Canada have all been leading and early producers of research in this broad area. Later, in 2014–16, many other European countries accelerated their research, with countries like India, Egypt, and, Saudi Arabia joining the efforts more recently.
Due to the much larger number of publications found in this search, Figure 7C shows more complex web of keyword co-occurrences. Two main groups of research efforts stand out. In the visualisation these coloured as minor red cluster and a major green/blue/yellow cluster. The minor red cluster focuses mainly on solid waste, with a small focus on energy efficiency. Overall, the red cluster is significantly smaller than the major green/blue/yellow cluster. Waste management, disposal, and landfills are the dominating focus of this cluster. The major cluster has been broken into three colour clusters, which focus on pollution (green), wastewater treatment (blue), and water purification (yellow). These three subclusters are all strongly linked together suggesting that these areas tend to have strong crossovers in research. The larger nodes of ‘water pollutants, chemical’, ‘iron’, ‘wastewater treatment’, and ‘water purification’ summarise the green, blue, and yellow clusters. The size of this major cluster group, and numbers of nodes and links within it, show that majority of waste research has been this in this interrelated area.
However, Figure 7D shows that research on solid waste was generally produced earlier than the research in the group of interrelated clusters, with some strong nodes of activity from 2010 to 2012. Within the interrelated group of clusters, there is also a clear progression through time of moving from water treatment to purification, and, more recently, more articulated consideration of pollution (Figure 7D). Another trend worth observing is that energy and waste heat can be seen in this analysis as emerging fields of research, with majority produced after 2017, and, even more recently, since 2018, research on zero waste and nanoparticles appear as nodes (Figure 7D).
From the perspective of the analyses undertaken here, it is important to observe that C&DW did not emerge as a node in this analysis, despite all research on C&DW being included in this general search. This is showing the relatively small size of the C&DW area of research compared to other considerations of waste. Further to that, C&DW would be primarily part of the smaller red cluster, rather than the group of densely interrelated clusters, which again reinforces the relatively small size of the research on C&DW compared to other areas of waste consideration.

6. Discussion

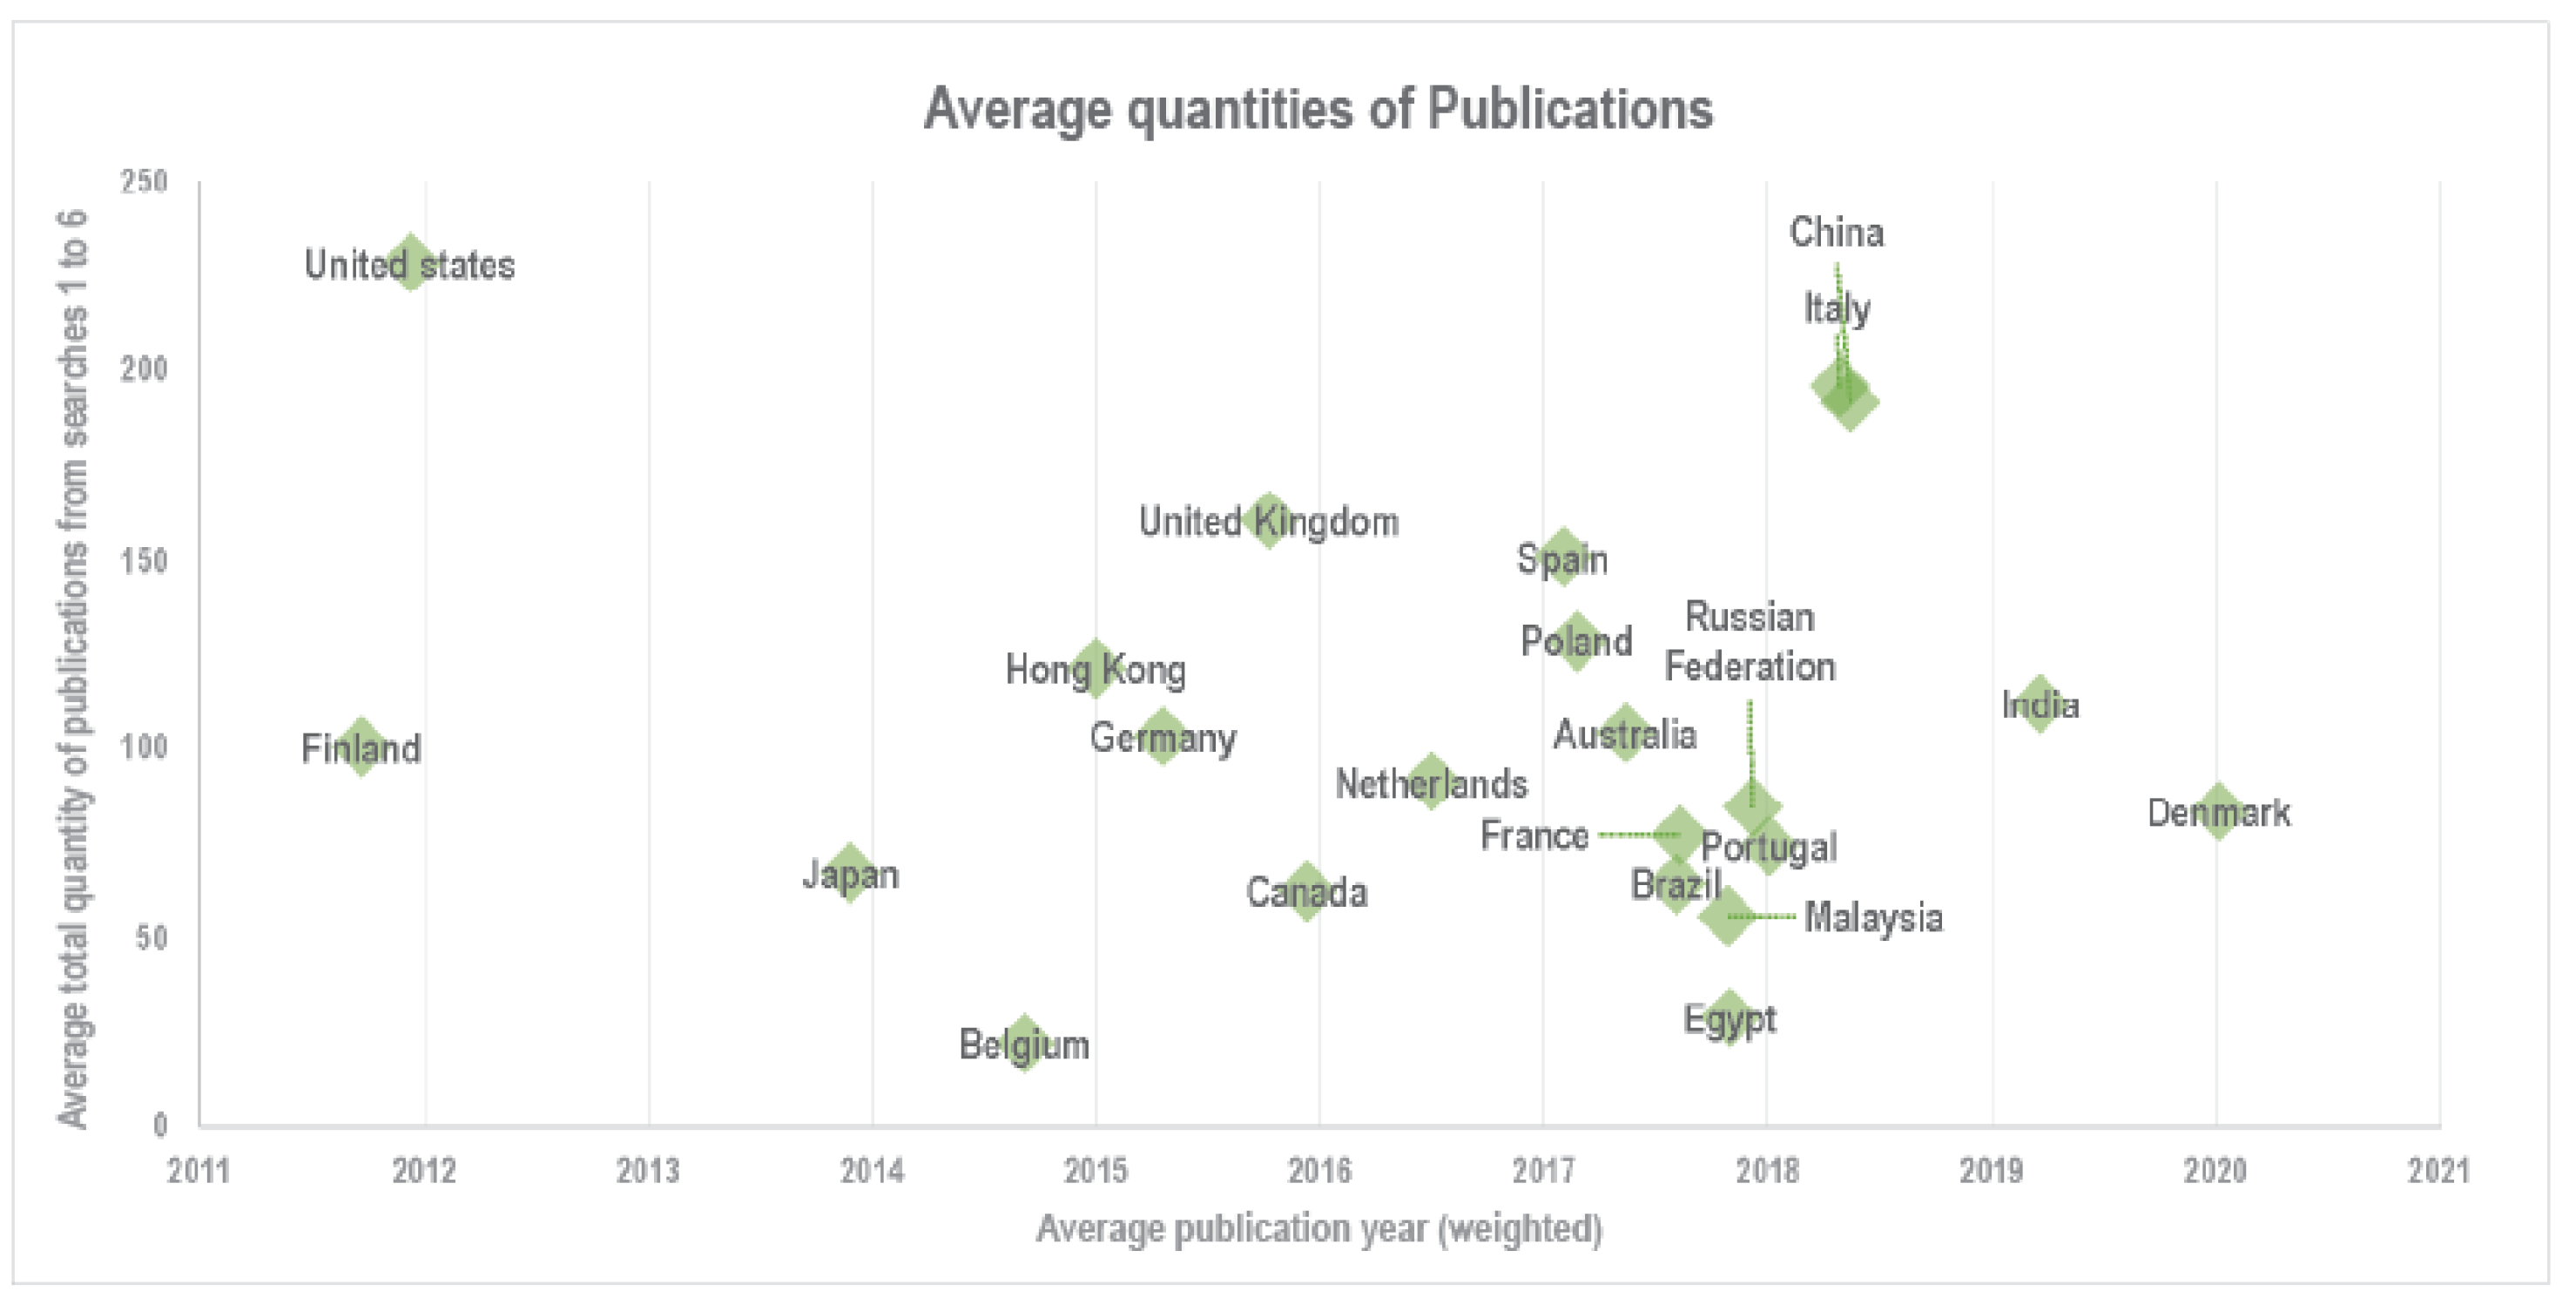
6.1. Overall Patterns in Findings

In order to evaluate the overall patterns, results of searches 1–6 were integrated, and this aggregated data was analysed. These analyses help show high level patterns, and show how the undertaken research addressed the primary aims of the study.
Through all of the C&DW undertaken searches, the quantity of publications follows a similar three-phase trend to what was found by the previous bibliometric reviews [14,17,18,35,37]. Figure 8 shows that despite some variations between examined searches, a general trend in this area can be observed of a minor level of research development observed before 2002, a moderate level from 2002 to 2016, and a rapid development from 2016 to 2022. However, this general exponential increase in research publications about C&DW also correlates with the exponential increases in publications generally and on C&DW discussed (see Section 3.1 and Section 5). This makes it challenging to be certain to what extent these factors are influencing the patterns observed here.
However, this general exponential increase in research publications about C&DW also correlates with the exponential increases in publications generally and on C&DW discussed (see Section 3.1 and Section 5). This makes it challenging to be certain to what extent these factors are influencing the patterns observed here.
Taking note of the limitations noted in Section 4.3, it is unsurprising that the US and China appear as the main producers of research. The US is a leader for across all the searches, with research evident well before 2015, while the research from China generally appears from around 2016–2018 (Figure 9). However, China does not appear in all searches, signalling some specialisation of the research interests. The UK is one of the other countries which appear in all the searches, especially from around 2016, and could be said to stand out in the volume of research compared to its size, and it covers the full range of topics examined here. Other countries that stand out in terms of volume of produced research are Italy, the UK, Spain, and India. India can also be seen to be an emerging producer of research across all searches, with the majority of articles published after 2018. The minor emerging producers of research in this area are Denmark, Malaysia, Egypt, Switzerland, South Africa, and South Korea.
Figure 10 shows the main themes which were researched during the three core phases of research development. During the initial minor phase of development before 2002, research on waste management and C&DW generally dominate, but are complemented by the considerations of metals which can create issues when released into the environment and landfill. This can be seen as focusing on an increase of awareness of the need of safe disposal of C&DW. However, Figure 8 also shows that this is when research about reusing buildings experiences some acceleration before other areas.
The most research produced during the ‘moderate’ phase appears to be centred around the topics of C&DW and waste management, and this is the period when interest in concrete and recycled aggregate appears to peak (Figure 11) and considerations for environmental impacts and LCA are evident (Figure 10). Research about reuse of buildings experienced considerable acceleration during this phase (Figure 8).
Although after 2016 the topics around circularity become increasingly popular, seen through a considerable development in levels of research in this particular area (Figure 8), within the totality of reviewed information, proportionally this is not standing out as clearly (Figure 10), although the MFA node is related. This is possibly because the more conventional research about C&DW might be overall dominating the total production of research. Circularity, reuse, and recycling are significant research themes, and in future might emerge as new dominant features in similar reviews. One limitation of this overall analysis is that aggregating searches 1–6 could have led to repeats of some of the results, proportionally increasing their impact in these overall findings. However, that does not explain the relatively limited presence of reuse and recycling throughout all of searches, which still signals that, proportionally, this area appears to not be as developed as some of the more established themes.

6.2. Patterns in Themes

Considering all reviewed searches, it is possible to observe three general themes or groups of themes which dominate C&DW research: (i) C&DW management, (ii) concrete C&DW, and (iii) life cycle assessment (LCA). This algins with the data from Figure 11, that shows these were the most occurring keywords when searching the entire field. The waste management group of themes mainly focuses on landfilling and waste disposal, with a minor focus on waste minimisation and economics. The overlay visualisations, and Figure 10 and Figure 11, show that this group has led the C&DW research. The concrete recycling theme has a general focus on the physical or mechanical properties of the recycled concrete or recycling into concrete. This research is another a leader in the field (Figure 10 and Figure 11), and the overlay visualisations show that it has had a sustained focus with new findings. The LCA has a focus towards economics, cost effectiveness, and sustainable topics such as environmental impacts and energy efficiency. This theme varies in its publication dates, but it can be seen as generally emerging after the C&DW management research (Figure 10 and Figure 11).
These three areas of focus appear the most. The LCA appears in every search, which makes it clear that this method is commonly used within C&DW research either for environmental or economic purposes. The concrete appears in all searches, whether as a full cluster or a handful of nodes. Similarly, the waste minimisation appears in all searches apart from the search on reusing buildings research.
The undertaken searches clearly signal that the management of concrete C&DW has been significantly more researched in comparison to other building materials. The node of ‘recycled aggregate’ was one of the larger occurring nodes in most searches, and most of the other keywords were around the physical and mechanical properties of the concrete. This is likely to support the regulation of recycled material in concrete, which can already be seen as practice in some countries. For example, success can be seen in Japan, where 96% of concrete waste was reported to be recycled already in 2000, and 98% by 2006, after the enactment of the construction material recycling law [56]. The recycled concrete has been used for road-base materials, backfill materials, and, in some cases, even for structural applications [56,57]. Concrete recycling is also recommended in Australia, but their recycling rate stands around 40% for use in low grade applications, as their recycling procedures are still developing [56]. Other materials generally did not appear as nodes which can be expected, as concrete is estimated to be the most used material in the construction [58]. However, timber and steel are also significant construction materials, and it has been reported that in 2010, 77% of metal, 20% of biomass materials, and 37% of non-metallic minerals were recycled globally [59]. Yet, the visualisations make it apparent that these have not received the same level of research. Across many of the searches, the earliest keywords are centred around the topics of waste disposal, waste management, and waste minimisation, which generally peak around 2010. Disposal by landfilling appears to be the first discussed topic across most of the searches. Waste management and minimisation comes later around 2015, and the topics around recycling, reuse, and selective demolition peak around 2014–2016. This dominate cluster of research can be seen in practice as C&DW management plans in many countries [60]; however, the policies are often found to be insufficient to combat the management of the levels of waste due to a range of factors. For example, in Spain, there is a legal obligation for sorting and separating C&DW over a certain weight (e.g., 80 metric tons of concrete) [60]. However, the cost of the recycled materials over new materials, and regulations around the application of the recycled materials, have negatively impacted the levels of recycling that does occur [61]. A similar plan was compulsory for sites over 300,000 GBP, but this was abolished in 2013 [60,62]. While this was enforced, there was a reported lack of engagement, and it was eventually abolished to ‘remove unnecessary legislation to free-up business’ [62]. Hong Kong has legal policies around of on-site sorting of inert (e.g., sand, bricks, and concrete) and non-inert materials (e.g., paper, plastic, wood) before it is sent to the categorised landfills [24,63]. However, much research has shown that the practical implementation has seen challenges [24,63,64]. Poon et al., completed a survey on Hong Kong contractors and found that, due to the difficult nature and labour-intensive process of sorting the materials, contractors were often reluctant to carry this out, even when a high tipping fee was imposed [63]. The expected growth of C&DW, discussed in Section 2.2, and issues with the implication of these C&DW management plans, give an urgency for a deeper understanding within C&DW management research to inform appropriate and effective control measures and regulations. For example, these policies all deal with construction waste as an end-of-life issue, while many researchers have concluded that, due to the complexity of construction and waste management, it should not be restrained to the end-of-life management (e.g., onsite waste sorting and landfilling) [65]. Rather, just as much effort should be placed towards the reduction of waste at its source, i.e., at the design stage, project planning stage, and avoiding activities that cause waste in construction [65], but also in reuse and recycling of the materials which are no longer needed in buildings. Additionally, a reported tendency of the construction industry is to give importance to the economy and productivity over environmental impact [10], which can be clearly seen to affect the management plans discussed above. This suggested the need for a more wholistic approach to C&DW management research with improvements of communications and attitudes within stakeholder groups, and addressing more complex issues such as poverty and leadership that may affect motivations for environmental change [35].
Groupings focused around LCA show a response to some of the discussed issues. A conversation shift can be seen from around 2016 towards more holistic research approaches, such as ‘circular economy’ and ‘life cycle assessments’ (LCA). Zero waste, energy efficiency, green building, and the discussions around greenhouse gasses are the most recently occurring keywords, occurring from 2018 onwards (Figure 11). However, it is evaluated that the construction and demolition industry is still in its early phases of reducing its environmental impact [6], which is backed up by the recency of this conversation shift. This suggests the research is still in its early stages of development [10], displaying opportunities for further research and progress.
This analysis also revealed some important absences. The reuse and recycling node, that was not associated with concrete, did not appear much throughout the searches, even when the search specifically focused on this area. Further to that, despite demonstrated recent steep increase in publications on circularity, circular economy does not appear in any of the searches. Jointly, these absences suggest that more research is needed about reusing, recycling, and keeping materials in use for longer. This is especially the case for materials other that concrete because of the current relative underrepresentation of all other materials in the C&DW research. It is also important to acknowledge that this could be an outcome of the used methodology, with a focus on analysing publications from any period of time, which could have made the results show greater dominance of the themes which are older and have been discussed for longer, resulting in a larger volume of publications.

7. Conclusions

The undertaken analyses show that it is possible to identify phases in discussion of C&DW, and to evaluate how these themes evolved over time, which responds to two of the primary aims of this research. The changes in the focus of keywords for different searches also shows that even reasonably similar and related searches produce different outcomes in the bibliographic analyses, which addresses the third research aim. This finding also signals that many of the existing review articles on C&DW which used a single search or smaller samples of publications could be failing to observe clearly enough the limitations of their findings. Nevertheless, there is a real value to exploring different methodological approaches in the emerging field of bibliometric research in order to contribute to a more robust understanding how best to undertake research of this nature.

Supplementary Materials

The following supporting information can be downloaded at: https://www.mdpi.com/article/10.3390/su16041561/s1, Table S1: Thesaurus for all searches; Table S2: Table S2: Data for Figure 1A; Table S3: Data for Figure 1B; Table S4: Data for Figure 1C,D; Table S5: Data for Figure 2A; Table S6: Data for Figure 2B; Table S7: Data for Figure 2C,D; Table S8: Data for Figure 3A; Table S9: Data for Figure 3B; Table S10: Data for Figure 3C,D; Table S11: Data for Figure 4A; Table S12: Data for Figure 4B; Table S13: Data for Figure 4C,D; Table S14: Data for Figure 5A; Table S15: Data for Figure 5B; Table S16: Data for Figure 5C,D; Table S17: Data for Figure 6A; Table S18: Data for Figure 6B; Table S19: Data for Figure 6C,D; Table S20: Data for Figure 7A; Table S21: Data for Figure 7B; Table S22: Data for Figure 7C,D; Table S23: Data for Figure 9; Table S24: Data for Figure 10; Table S25: Data for Figure 11.

Author Contributions

Conceptualization, methodology, supervision, and writing—review and editing, E.K.P.; investigation, visualisation, data curation, writing—original draft preparation, C.A.T.; formal analysis, C.A.T. and E.K.P. All authors have read and agreed to the published version of the manuscript.

Funding

This research was internally funded by the SHEADI Faculty Strategic Research Grant no. 410115, and the FoADI Research Support 400025, Te Herenga Waka—Victoria University of Wellington, New Zealand.

Institutional Review Board Statement

Not applicable.

Informed Consent Statement

Not applicable.

Data Availability Statement

All data were sourced from open access sources and can be readily replicated. Supplementary Data are also provided with the details behind most figures in text.

Conflicts of Interest

The authors declare no conflicts of interest.

References

  1. Ferdous, W.; Manalo, A.; Siddique, R.; Mendis, P.; Zhuge, Y.; Wong, H.S.; Lokuge, W.; Aravinthan, T.; Schubel, P. Recycling of landfill wastes (tyres, plastics and glass) in construction–A review on global waste generation, performance, application and future opportunities. Resour. Conserv. Recycl. 2021, 173, 105745. [Google Scholar] [CrossRef]
  2. US EPA. Sustainable Management of Construction and Demolition Materials. Overviews and Factsheets. US EPA. 2018. Available online: https://www.epa.gov/smm/sustainable-management-construction-and-demolition-materials (accessed on 30 January 2024).
  3. Ling, Y.-Y.; Teo, P.W.L. A Survey of Contractors’ Opinions on Methods of Waste Minimisation. Archit. Sci. Rev. 2001, 44, 319–323. [Google Scholar] [CrossRef]
  4. Clark, C.; Jambeck, J.; Townsend, T. A Review of Construction and Demolition Debris Regulations in the United States. Crit. Rev. Environ. Sci. Technol. 2006, 36, 141–186. [Google Scholar] [CrossRef]
  5. Adams, K.; Thornback, J. How Much Waste Is Produced by the Construction Sector? (Construction Waste–How Much Is There?) CPA UK. 2022. Available online: https://www.constructionproducts.org.uk/media/557062/how-much-construction-waste-is-there.pdf (accessed on 30 January 2024).
  6. Kabirifar, K.; Mojtahedi, M.; Wang, C.; Tam, V.W.Y. Construction and demolition waste management contributing factors coupled with reduce, reuse, and recycle strategies for effective waste management: A review. J. Clean. Prod. 2020, 263, 121265. [Google Scholar] [CrossRef]
  7. Menegaki, M.; Damigos, D. A review on current situation and challenges of construction and demolition waste management. Curr. Opin. Green Sustain. Chem. 2018, 13, 8–15. [Google Scholar] [CrossRef]
  8. Kaza, S.; Yao, L.C.; Bhada-Tata, P.; Van Woerden, F. What a Waste 2.0: A Global Snapshot of Solid Waste Management to 2050; World Bank: Washington, DC, USA, 2018. [Google Scholar] [CrossRef]
  9. Kofoworola, O.F.; Gheewala, S.H. Estimation of construction waste generation and management in Thailand. Waste Manag. 2009, 29, 731–738. [Google Scholar] [CrossRef]
  10. Viswalekshmi, B.R.; Bendi, D.; Opoku, A. Exploring the Trends in Construction Waste Reduction Research: A Bibliometric Analysis. Sci. Technol. Libr. 2023, 42, 155–179. [Google Scholar] [CrossRef]
  11. Lu, W.; Lou, J.; Webster, C.; Xue, F.; Bao, Z.; Chi, B. Estimating construction waste generation in the Greater Bay Area, China using machine learning. Waste Manag. 2021, 134, 78–88. [Google Scholar] [CrossRef] [PubMed]
  12. Chinda, T. Investigation of factors affecting a construction waste recycling decision. Civ. Eng. Environ. Syst. 2016, 33, 214–226. [Google Scholar] [CrossRef]
  13. Hoornweg, D.; Bhada-Tata, P. What a waste: A global review of solid waste management. Urban Dev. Ser. Knowl. Pap. 2012, 15, 87–88. [Google Scholar]
  14. Jin, R.; Yuan, H.; Chen, Q. Science mapping approach to assisting the review of construction and demolition waste management research published between 2009 and 2018. Resour. Conserv. Recycl. 2019, 140, 175–188. [Google Scholar] [CrossRef]
  15. Oluleye, B.I.; Chan, D.W.M.; Saka, A.B.; Olawumi, T.O. Circular economy research on building construction and demolition waste: A review of current trends and future research directions. J. Clean. Prod. 2022, 357, 131927. [Google Scholar] [CrossRef]
  16. Purchase, C.K.; Al Zulayq, D.M.; O’Brien, B.T.; Kowalewski, M.J.; Berenjian, A.; Tarighaleslami, A.H.; Seifan, M. Circular Economy of Construction and Demolition Waste: A Literature Review on Lessons, Challenges, and Benefits. Materials 2021, 15, 76. [Google Scholar] [CrossRef] [PubMed]
  17. Li, Y.; Li, M.; Sang, P. A bibliometric review of studies on construction and demolition waste management by using CiteSpace. Energy Build. 2022, 258, 111822. [Google Scholar] [CrossRef]
  18. Wu, H.; Zuo, J.; Zillante, G.; Wang, J.; Yuan, H. Construction and demolition waste research: A bibliometric analysis. Archit. Sci. Rev. 2019, 62, 354–365. [Google Scholar] [CrossRef]
  19. Rahaman, M.S.; Ansari, K.M.N.; Kumar, H.; Shah, K. Mapping and Visualizing Research Output on Global Solid Waste Management: A Bibliometric Review of Literature. Sci. Technol. Libr. 2022, 41, 174–202. [Google Scholar] [CrossRef]
  20. Huang, T.; Shi, F.; Tanikawa, H.; Fei, J.; Han, J. Materials demand and environmental impact of buildings construction and demolition in China based on dynamic material flow analysis. Resour. Conserv. Recycl. 2013, 72, 91–101. [Google Scholar] [CrossRef]
  21. Oberle, B.; Bringezu, S.; Hatfield-Dodds, S.; Hellweg, S.; Schandl, H.; Clement, J. Global Resources Outlook 2019 Natural Resources for the Future We Want; UN Environment Programme and International Resource Panel: Nairobi, Kenya, 2019; Available online: https://www.resourcepanel.org/reports/global-resources-outlook (accessed on 30 January 2024).
  22. Rockström, J.; Steffen, W.; Noone, K.; Persson, Å.; Chapin, F.S.; Lambin, E.F.; Lenton, T.M.; Scheffer, M.; Folke, C.; Schellnhuber, H.J.; et al. A safe operating space for humanity. Nature 2009, 461, 7263. [Google Scholar] [CrossRef] [PubMed]
  23. Richardson, K.; Steffen, W.; Lucht, W.; Bendtsen, J.; Cornell, S.E.; Donges, J.F.; Drüke, M.; Fetzer, I.; Bala, G.; von Bloh, W.; et al. Earth beyond six of nine planetary boundaries. Sci. Adv. 2023, 9, 37. [Google Scholar] [CrossRef] [PubMed]
  24. Yuan, H.; Lu, W.; Jianli Hao, J. The evolution of construction waste sorting on-site. Renew. Sustain. Energy Rev. 2013, 20, 483–490. [Google Scholar] [CrossRef]
  25. Tunji-Olayeni, P.; Omuh, I.; Afolabi, A.; Ojelabi, R.; Eshofonie, E. Effects of construction activities on the planetary boundaries. J. Phys. Conf. Ser. 2019, 1299, 012005. [Google Scholar] [CrossRef]
  26. Kuittinen, M. Building within planetary boundaries: Moving construction to stewardship. Build. Cities 2023, 4, 565–574. [Google Scholar] [CrossRef]
  27. Herczeg, M.; McKinnon, D.; Milios, L.; Bakas, I.; Klaassens, E.; Svatikova, K.; Widerberg, O. Resource Efficiency in the Building Sector (Final Report; Issue Final Report). ECORYS. 2014. Available online: https://www.academia.edu/29998370/Resource_efficiency_in_the_building_sector_Final_report_Client_DG_Environment (accessed on 30 January 2024).
  28. Schandl, H.; Fischer-Kowalski, M.; West, J.; Giljum, S.; Dittrich, M.; Eisenmenger, N.; Geschke, A.; Lieber, M.; Wieland, H.; Schaffartzik, A.; et al. Global Material Flows and Resource Productivity: Forty Years of Evidence: Global Material Flows and Resource Productivity. J. Ind. Ecol. 2018, 22, 827–838. [Google Scholar] [CrossRef]
  29. Schandl, H.; Eisenmenger, N. Regional Patterns in Global Resource Extraction. J. Ind. Ecol. 2008, 10, 133–147. [Google Scholar] [CrossRef]
  30. Plank, B.; Streeck, J.; Virág, D.; Krausmann, F.; Haberl, H.; Wiedenhofer, D. From resource extraction to manufacturing and construction: Flows of stock-building materials in 177 countries from 1900 to 2016. Resour. Conserv. Recycl. 2022, 179, 106122. [Google Scholar] [CrossRef]
  31. Darko, A.; Chan, A.P.C. Critical analysis of green building research trend in construction journals. Habitat Int. 2016, 57, 53–63. [Google Scholar] [CrossRef]
  32. Hashimoto, S.; Tanikawa, H.; Moriguchi, Y. Where will large amounts of materials accumulated within the economy go?–A material flow analysis of construction minerals for Japan. Waste Manag. 2007, 27, 1725–1738. [Google Scholar] [CrossRef] [PubMed]
  33. Bringezu, S.; Schütz, H.; Moll, S. Rationale for and Interpretation of Economy-Wide Materials Flow Analysis and Derived Indicators. J. Ind. Ecol. 2003, 7, 43–64. [Google Scholar] [CrossRef]
  34. Storey, J.; Baird, G. Sustainable Cities Need Sustainable Buildings. 2001. Available online: https://www.researchgate.net/publication/242221407_Sustainable_cities_need_sustainable_buildings/citations (accessed on 30 January 2024).
  35. Elshaboury, N.; Al-Sakkaf, A.; Mohammed Abdelkader, E.; Alfalah, G. Construction and Demolition Waste Management Research: A Science Mapping Analysis. Int. J. Environ. Res. Public Health 2022, 19, 4496. [Google Scholar] [CrossRef] [PubMed]
  36. Fire, M.; Guestrin, C. Over-optimization of academic publishing metrics: Observing Goodhart’s Law in action. GigaScience 2019, 8, giz053. [Google Scholar] [CrossRef]
  37. Wang, L.; Zhong, M. The Evolution of Construction and Demolition Waste Development Research: A Bibliometric Study. Sustainability 2022, 15, 284–290. [Google Scholar] [CrossRef]
  38. Choudhary, H.; Rajput, S.P. Bibliometric Analysis of Global Research Trend on Construction and Demolition Waste in Past Two Decade. In Biennial International Conference on Future Learning Aspects of Mechanical Engineering; Springer Nature: Singapore, 2022; pp. 123–133. [Google Scholar]
  39. Soto-Paz, J.; Arroyo, O.; Torres-Guevara, L.E.; Parra-Orobio, B.A.; Casallas-Ojeda, M. The circular economy in the construction and demolition waste management: A comparative analysis in emerging and developed countries. J. Build. Eng. 2023, 78, 107724. [Google Scholar] [CrossRef]
  40. Ma, W.; Yuan, H.; Hao, J.L. A bibliometric visual analysis of the system dynamics approach for construction and demolition waste management. Clean. Waste Syst. 2022, 1, 100004. [Google Scholar] [CrossRef]
  41. Shao, Z.; Li, M.; Yu, D. Bibliometric analysis of construction and demolition waste recycling: Review and prospects. In Proceedings of the Institution of Civil Engineers-Engineering Sustainability; Thomas Telford Ltd.: London, UK, 2022; Volume 175, pp. 283–292. [Google Scholar]
  42. Wang, L.; Lv, Y.; Huang, S.; Liu, Y.; Li, X. The Evolution of Research on C&D Waste and Sustainable Development of Resources: A Bibliometric Study. Sustainability 2023, 15, 9141. [Google Scholar] [CrossRef]
  43. Chen, K.; Wang, J.; Yu, B.; Wu, H.; Zhang, J. Critical evaluation of construction and demolition waste and associated environmental impacts: A scientometric analysis. J. Clean. Prod. 2021, 287, 125071. [Google Scholar] [CrossRef]
  44. Liu, Y.; Sun, T.; Yang, L. Evaluating the performance and intellectual structure of construction and demolition waste research during 2000–2016. Environ. Sci. Pollut. Res. 2017, 24, 19259–19266. [Google Scholar] [CrossRef] [PubMed]
  45. Ghafourian, K.; Mohamed, Z.; Ismail, S.; Malakute, R.; Abolghasemi, M. Current status of the research on construction and demolition waste management. Indian J. Sci. Technol. 2016, 9, 96231. [Google Scholar] [CrossRef]
  46. McAllister, J.T.; Lennertz, L.; Atencio Mojica, Z. Mapping a discipline: A guide to using VOSviewer for bibliometric and visual analysis. Sci. Technol. Libr. 2022, 41, 319–348. [Google Scholar] [CrossRef]
  47. National Natural Science Foundation of China (NSFC); National Science Library, Chinese Academy of Sciences (NSL); CAS (American Chemical Society). Synthetic Chemistry Research Trends Report. 2022. Available online: https://www.cas.org/resources/cas-insights/synthetic-chemistry/nsfc-report (accessed on 15 April 2023).
  48. VOSviewer. SAGE Research Methods: Data Visualization; SAGE Publications Ltd.: New York, NY, USA, 2021. [Google Scholar] [CrossRef]
  49. van Eck, N.J.; Waltman, L. VOSviewer Manual; (Software Manual Version 1.6.8; VOSviewer, Issue Version 1.6.8); University of Liden: Leiden, The Niederlande, 2018; Available online: https://www.vosviewer.com/documentation/Manual_VOSviewer_1.6.8.pdf (accessed on 30 January 2024).
  50. Mongeon, P.; Paul-Hus, A. The journal coverage of Web of Science and Scopus: A comparative analysis. Scientometrics 2016, 106, 213–228. [Google Scholar] [CrossRef]
  51. Chadegani, A.A.; Salehi, H.; Yunus, M.M.; Farhadi, H.; Fooladi, M.; Farhadi, M.; Ebrahim, N.A. A Comparison between Two Main Academic Literature Collections: Web of Science and Scopus Databases. Asian Soc. Sci. 2013, 9, 18. [Google Scholar] [CrossRef]
  52. Tariq, S.; Hu, Z.; Zayed, T. Micro-electromechanical systems-based technologies for leak detection and localization in water supply networks: A bibliometric and systematic review. J. Clean. Prod. 2021, 289, 125751. [Google Scholar] [CrossRef]
  53. van Eck, N.J.; Waltman, L. Visualizing Bibliometric Networks. In Measuring Scholarly Impact; Ding, Y., Rousseau, R., Wolfram, D., Eds.; Springer International Publishing: Berlin/Heidelberg, Germany, 2014; pp. 285–320. [Google Scholar] [CrossRef]
  54. Griffith, B.C.; Small, H.G.; Stonehill, J.A.; Dey, S. The Structure of Scientific Literatures II: Toward a Macro- and Microstructure for Science. Sci. Stud. 1974, 4, 339–365. [Google Scholar] [CrossRef]
  55. Vera-Baceta, M.A.; Thelwall, M.; Kousha, K. Web of Science and Scopus language coverage. Scientometrics 2019, 121, 1803–1813. [Google Scholar] [CrossRef]
  56. Tam, V.W.Y. Comparing the implementation of concrete recycling in the Australian and Japanese construction industries. J. Clean. Prod. 2009, 17, 688–702. [Google Scholar] [CrossRef]
  57. Tanaka, R.; Miura, S.; Ohaga, Y. Experimental Study on the Possibility of Using Permanently Recycled Concrete for Reinforced Concrete Structures. J. Soc. Mater. Sci. Jpn. 2002, 51, 948–954. [Google Scholar] [CrossRef]
  58. Marinova, S.; Deetman, S.; van der Voet, E.; Daioglou, V. Global construction materials database and stock analysis of residential buildings between 1970–2050. J. Clean. Prod. 2020, 247, 119146. [Google Scholar] [CrossRef]
  59. Krausmann, F.; Wiedenhofer, D.; Lauk, C.; Haas, W.; Tanikawa, H.; Fishman, T.; Miatto, A.; Schandl, H.; Haberl, H. Global socioeconomic material stocks rise 23-fold over the 20th century and require half of annual resource use. Proc. Natl. Acad. Sci. USA 2017, 114, 1880–1885. [Google Scholar] [CrossRef]
  60. Gálvez-Martos, J.-L.; Istrate, I.-R. Construction and demolition waste management. In Advances in Construction and Demolition Waste Recycling; Elsevier: Amsterdam, The Netherlands, 2020; pp. 51–68. [Google Scholar] [CrossRef]
  61. Rodríguez-Robles, D.; García-González, J.; Juan-Valdés, A.; Morán-del Pozo, J.M.; Guerra-Romero, M.I. Overview regarding construction and demolition waste in Spain. Environ. Technol. 2015, 36, 3060–3070. [Google Scholar] [CrossRef]
  62. U.K. Department for Environment Food and Rural Affairs. Proposed Repeal of Construction Site Waste Management Plan Regulations (2008); (Defra Public Consultations) [Summary of responses and Government response]; UK Department for Environment, Food and Rural Affairs: London, UK, 2013. Available online: https://assets.publishing.service.gov.uk/government/uploads/system/uploads/attachment_data/file/237398/site-waste-manage-consult-sum-resp-20130830.pdf (accessed on 19 January 2024).
  63. Poon, C.S.; Yu, A.T.W.; Ng, L.H. On-site sorting of construction and demolition waste in Hong Kong. Resour. Conserv. Recycl. 2001, 32, 157–172. [Google Scholar] [CrossRef]
  64. Lu, W.; Tam, V.W.Y. Construction waste management policies and their effectiveness in Hong Kong: A longitudinal review. Renew. Sustain. Energy Rev. 2013, 23, 214–223. [Google Scholar] [CrossRef]
  65. Fikri Hasmori, M.; Faizul Md Zin, A.; Nagapan, S.; Deraman, R.; Abas, N.; Yunus, R.; Klufallah, M. The on-site waste minimization practices for construction waste. IOP Conf. Ser. Mater. Sci. Eng. 2020, 713, 012038. [Google Scholar] [CrossRef]
Figure 1. (A) Quantity of publications per year from the search of ‘construction AND demolition AND waste AND management’ on the Scopus database. Search and graph completed on 13 March 2023. (B) Overlay visualisation for the publication countries over time for the search of ‘construction AND demolition AND waste AND management’. Search and visualisation created on 13 March 2023. (C) Bibliographic visualisation of the co-occurrence of keywords within the 1821 publications from the search of ‘construction AND demolition AND waste AND management’. Search and visualisation completed on 13 March 2023. (D) Overlay visualisation for the co-occurrence of keywords over time within the 1821 publications from the search of ‘construction AND demolition AND waste AND management’. Search and visualisation completed on 13 March 2023.
Sustainability 16 01561 g001aSustainability 16 01561 g001bSustainability 16 01561 g001c
Figure 2. (A) Quantity of publications per year from the search of ‘Life Cycle assessment OR embodied energy OR carbon footprint OR green building OR living building challenge AND construction AND demolition’ on the Scopus database. Search and graph completed on 6 April 2023. (B) Overlay visualisation for the publication countries over time from the 1003 publications from the search of ‘Life Cycle assessment OR embodied energy OR carbon footprint OR green building OR living building challenge AND construction AND demolition’. Search and visualisation completed on 6 April 2023. (C) Bibliographic visualisation of the co-occurrence of keywords within the 1003 publications from the search of ‘Life Cycle assessment OR embodied energy OR carbon footprint OR green building OR living building challenge AND construction AND demolition’. Search and visualisation completed on the 6 April 2023. (D) Overlay visualisation for the co-occurrence of keywords over time within the 1003 publications from the search of ‘Life Cycle assessment OR embodied energy OR carbon footprint OR green building OR living building challenge AND construction AND demolition’. Search and visualisation completed on the 6 April 2023.
Sustainability 16 01561 g002aSustainability 16 01561 g002b
Figure 3. (A) Quantity of publications per year from the search of ‘Reuse OR recycle OR reclaim OR (salvaged AND material) OR upcycle AND construction AND demolition’ on the Scopus database. Search and graph completed on 29 May 2023. (B) Overlay visualisation for the publication countries over time from the 1081 publications from the search of ‘Reuse OR recycle OR reclaim OR (salvaged AND material) OR upcycle AND construction AND demolition’. Search and visualisation completed on 29 May 2023. (C) Bibliographic visualisation of the co-occurrence of keywords within the 1081 publications from the search of ‘Reuse OR recycle OR reclaim OR (salvaged AND material) OR upcycle AND construction AND demolition’. Search and visualisation completed on 29 May 2023. (D) Overlay visualisation for the co-occurrence of keywords over time from the 1081 publications from the search of ‘Reuse OR recycle OR reclaim OR (salvaged AND material) OR upcycle AND construction AND demolition’. Search and visualisation completed on 29 May 2023.
Sustainability 16 01561 g003aSustainability 16 01561 g003b
Figure 4. (A) Quantity of publications per year from the search of ‘Refurbishment OR renovation OR (heritage AND restoration) AND building AND construction’ on the Scopus database. Search and graph completed on 29 May 2023. (B) Overlay visualisation for the publication countries over time from the 4665 publications from the search of ‘Refurbishment OR renovation OR (heritage AND restoration) AND building AND construction’. Search and visualisation completed on 29 May 2023. (C) Bibliographic visualisation of the co-occurrence of keywords from the 4665 publications from the search of ‘Refurbishment OR renovation OR (heritage AND restoration) AND building AND construction’. Search and visualisation completed on 29 May 2023. (D) Overlay visualisation for the co-occurrence of keywords over time from the 4665 publications from the search of ‘Refurbishment OR renovation OR (heritage AND restoration) AND building AND construction’. Search and visualisation completed on 29 May 2023.
Sustainability 16 01561 g004aSustainability 16 01561 g004b
Figure 5. (A) Quantity of publications per year from the search of ‘Circular economy OR closing the loop OR zero waste OR narrowing the loop AND construction OR demolition’ on the Scopus database. Search and graph completed on 29 May 2023. (B) Overlay visualisation for the publication countries over time from the 3235 publications from the search of ‘Circular economy OR closing the loop OR zero waste OR narrowing the loop AND construction OR demolition’. Search and visualisation completed on 29 May 2023. (C) Bibliographic visualisation of the co-occurrence of keywords from the 3235 publications from the search of ‘Circular economy OR closing the loop OR zero waste OR narrowing the loop AND construction OR demolition’. Search and visualisation completed on 29 May 2023. (D) Overlay visualisation for the co-occurrence of keywords over time from the 3235 publications from the search of ‘Circular economy OR closing the loop OR zero waste OR narrowing the loop AND construction OR demolition’. Search and visualisation completed on 29 May 2023.
Sustainability 16 01561 g005aSustainability 16 01561 g005bSustainability 16 01561 g005c
Figure 6. (A) Quantity of publications per year from the search of ‘Waste minimization OR waste minimisation OR zero waste AND construction’ on the Scopus database. Search and graph completed on 29 May 2023. (B) Overlay visualisation for the publication countries over time from the 1356 publications from the search of ‘Waste minimization OR waste minimisation OR zero waste AND construction’. Search and visualisation completed on 29 May 2023. (C) Bibliographic visualisation of the co-occurrence of keywords within the 1356 publications from the search of ‘Waste minimization OR waste minimisation OR zero waste AND construction’. Search and visualisation completed on 29 May 2023. (D) Overlay visualisation for the co-occurrence of keywords over time from the 1356 publications from the search of ‘Waste minimization OR waste minimisation OR zero waste AND construction’. Search and visualisation completed on 29 May 2023.
Sustainability 16 01561 g006aSustainability 16 01561 g006b
Figure 7. (A) Quantity of publications per year from the search of ‘Waste minimization OR waste minimisation OR zero waste’ on the Scopus database. Search and graph completed on 29 May 2023. (B) Overlay visualisation for the publication countries over time from the 19,693 publications from the search of ‘Waste minimization OR waste minimisation OR zero waste’. Search and visualisation completed on 29 May 2023. (C) Bibliographic visualisation of the co-occurrence of keywords from the 19,693 publications from the search of ‘Waste minimization OR waste minimisation OR zero waste’. Search and visualisation completed on 29 May 2023. (D) Overlay visualisation for the co-occurrence of keywords over time from the 19,693 publications from the search of ‘Waste minimization OR waste minimisation OR zero waste’. Search and visualisation completed on 29 May 2023.
Sustainability 16 01561 g007aSustainability 16 01561 g007b
Figure 8. Quantity of publications per year from searches 1–6, showing the shared three-phase trend.
Sustainability 16 01561 g008
Figure 9. Average total publications per year (1960–2023) vs. the weighted average year of publications, calculated from an average of total publication quantities from the VOSviewer data of searches 1–6. The average year of publication was weighted by the number of publications in the year. The top 21 countries are displayed.
Sustainability 16 01561 g009
Figure 10. The highest occurring keywords per development phase. The publications from search 1 were organised into 3 files according to their publication date, and were re-imported into VosViewer to create three smaller diagrams analysing the top 5–10 occurring keywords for each development phase.
Sustainability 16 01561 g010
Figure 11. Total occurrences of the keywords (1966–2023) vs. the weighted average year of publication, calculated from the VosViewer data from search 1. The top 9 occurring keywords have been displayed. In addition, three other keywords of interest are shown: ‘Zero Waste’, ‘Green Building’, and ‘Embodied Energy (embodied energy)’.
Sustainability 16 01561 g011
Table 1. Summary of the existing reviews of increase in publications on C&DW.
AuthorDate of
Publication
Reported Increase
in C&DW
Publications
Reported Period of Minor to Moderate DevelopmentReported Period of Rapid Development
Wu et al.
[18]
20192400% increase
from 1994 to 2017
1994–20132013–2017
Jin et al.
[14]
2019160% increase
from 2009 to 2017
2009–20152015–2017
Wang & Zhong
[37]
20222200% increase
from 1998 to 2021
1998–20132013–2021
Elshaboury et al.
[35]
20222300% increase
from 2001 to 2021
2001–20152015–2021
Li et al.
[17]
2022800% increase
from 2007 to 2020
2007–20152015–2020
Viswalekshmi et al.
[10]
20231000% increase
from 1990 to 2020
Linear development
throughout the period
Table 2. Overview of key characteristics of the existing relevant bibliometric reviews on C&DW.
AuthorDate of
Publication
Number of Publications in ReviewSearched DatabaseReviewed Period
Choudhary & Rajput [38]20232584Web of
Science
2002–2021
Soto-Paz et al.
[39]
20232014Web of
Science, Scopus and Dimensions
2010–2022
Viswalekshmi et al.
[10]
2023133Scopus1991–2020
Ma et al.
[40]
2022110Web of
Science
Shao et al.
[41]
20221090Web of
Science
2000–2021
Elshaboury et al.
[35]
2022895Scopus2001–2021
Li et al.
[17]
2022494Web of
Science
2007–2020
Wang et al.
[42]
20233550Web of
Science
2002–2022
Chen et al.
[43]
2021112Web of
Science
2010–2019
Wu et al.
[18]
20191027Web of
Science
1994–2017
Jin et al.
[14]
2019410Scopus2009–2018
Liu et al.
[44]
2017857SCI
Expanded database
2000–2016
Ghafourian et al.
[45]
2016109Web of
Science
1996–2010
Table 3. Overview of searches with keywords and Boolean terms.
SearchBoolean Search TermsSearch DatePublication Date RangePublication
Number
Total Number of Items Found *Number of Items that Met ThresholdThreshold Occurrence
1.‘Construction AND demolition AND waste AND management’.13 March 231966–20231821107 countries55 countries5
3562 keywords56 keywords7
2.‘Life Cycle assessment OR embodied energy OR carbon footprint OR green building OR living building challenge AND construction AND demolition’.6 April 231995–2023100377 countries35 countries8
2192 keywords28 keywords10
3.‘Reuse OR recycle OR reclaim OR (salvaged AND material) OR upcycle AND construction AND demolition’.29 May 231976–20231081103 countries35 countries7
2416 keywords31 keywords6
4.‘Refurbishment OR renovation OR (heritage AND restoration) AND building AND construction’.29 May 231960–20234665223 countries36 countries28
9775 keywords32 keywords25
5.‘Circular economy OR closing the loop OR zero waste OR narrowing the loop AND construction OR demolition’.29 May 231973–20233235150 countries36 countries22
7548 keywords38 keywords14
6.‘Waste minimization OR waste minimisation OR zero waste AND construction’.29 May 231973–20231356120 countries29 countries13
3265 keywords33 keywords7
7.‘Waste minimization OR waste
minimisation OR zero waste’.
29 May 231943–202419,693461 countries30 countries150
34,953
keywords
47 keywords60
* Some countries displayed as repeats due to variations of the name.
Disclaimer/Publisher’s Note: The statements, opinions and data contained in all publications are solely those of the individual author(s) and contributor(s) and not of MDPI and/or the editor(s). MDPI and/or the editor(s) disclaim responsibility for any injury to people or property resulting from any ideas, methods, instructions or products referred to in the content.

