Abstract
With the significant pace of industrialization, the emission of carbon dioxide (CO2) through cement manufacture, as well as from developed environments, will undoubtedly rise yearly. Biochar as a byproduct of biomass pyrolysis can be utilized in concrete to partially replace cement. Because of its ecological and economic benefits, such as carbon sinks or carbon capture, low thermal conductivity, chemical resistance, and low thermal properties, biochar has risen in popularity in recent years. On the other hand, the possibility of using sludge ash as a cement substitute in the process of making mortar has recently attracted increasing interest. The effectiveness and acceptability of using pine cones as a byproduct of biochar and sludge ash, a byproduct of wastewater treatment, to produce mortar in place of cement are being intensively explored. The integration of biochar and sludge ash into cementitious materials is a possible approach for pollution reduction by replacing Portland cement and reducing collection and disposal in landfills. In order to create high-performance mortar, this study experimentally explores the impacts of combining biochar at an optimal of 6% and sludge ash at optimal of 10%. It analyzes the rheological, mechanical, and durability attributes across curing times of 7 and 28 days in both wet and dry environments, while keeping a constant temperature of 20 °C. As a result, at 28 days, every blend was higher compared to baseline mixture at 7 days. Increases of 19.52% and 13.78%, as well as 24.76% and 21.68%, were seen in the mixtures with 5% and 10% sludge ash (SA) at 28 days compressive strength. With percentage increments for both 7 days and 28 days of 6.6% and 30.9% and 2.2% and 14.1%, the binary blend utilizing BC3SA10 and BC3SA5 significantly outperformed the reference mix. In mortar, the use of biochar could reduce capillary absorption. In addition, its inclusion fastens the rate of hydration of the cement and prevents shrinkage cracks in the mix. The current study concentrates on the significant features of biochar and sludge ash that have an impact on cementitious materials performance. The fresh as well as hardened properties of various concrete and mortar mixes after the replacement of cement with biochar and sludge ash components have been extensively reviewed based on the research results. In a nutshell, biochar and sludge ash materials are an excellent alternative for cement in construction.
1. Introduction
The construction sector is responsible for generating millions of tons of cement each year due to its usage as a critical binder material in the concrete matrix. According to the International Energy Agency (IEA), cement production is responsible for 7% of global carbon dioxide (CO2) emissions, making it the second-largest industrial emitter of CO2 after the iron and steel industry [1]. The production of cement involves high temperatures and chemical reactions that release CO2 into the atmosphere, and the widespread use of concrete in construction further exacerbates the carbon footprint of the sector [2]. Huge efforts are being made towards finding proper replacement materials that could replace cement, at least partially, and that are more environmentally friendly options that would not decrease the properties and the performance of concrete mixes overall. The production of greenhouse gas (GHG) emissions stemming from a variety of industrial sources, and their subsequent effects on climatic fluctuations, warrant significant consideration and scrutiny. This is due to the potentially far-reaching consequences of GHG emissions on the environment, as they can contribute to global warming and climate change, leading to various adverse impacts such as rising sea levels, extreme weather events, and ecosystem disturbances. Therefore, it is critical to address this issue through comprehensive efforts aimed at reducing GHG emissions across different sectors and promoting sustainable practices to mitigate their impact on the environment [3]. According to the IPCC, which is short for the Intergovernmental Panel on Climate Change, the proportion that carbon dioxide emissions contribute to the total greenhouse gases effect is around 65%, which is quite high [4]. The construction industry, notably the production and transporting of cement, is accountable for 6–7 percent of the atmospheric carbon (CO2) emissions that cause global warming [5], while cement serves as the primary binder component in concrete in the construction industry. The global concrete industry plays a crucial role in infrastructure development but also has a significant impact on a country’s economy and growth. Concrete is the most widely used man-made material after water. However, the production of Portland cement, which is the primary bonding agent, and the transportation of materials involved in making concrete are the main sources of carbon dioxide emissions associated with concrete manufacturing [6].
Biochar (BC) is made by pyrolyzing a porous, rich-in-carbon material or a solid biomass (such as animal dungs, food waste, and manure) in addition to various types of agricultural waste at low temperatures. The temperature is maintained 700 °C [7,8] without oxygen or with a low oxygen concentration. A large amount of organic waste is generated every day from various sources such as municipality, industry, and agriculture. Recycling options for this type of waste are limited and, therefore, alternative methods to reuse organic waste are being researched to reduce its volume without harming the environment and at a reasonable cost. One such method is the conversion of organic waste into biochar, which is produced through pyrolysis and can be a clean way to dispose of organic waste [9,10]. The technique known as pyrolysis, which is the most popular way to make biochar, involves heating biomass with little or no oxygen. Due to the heating rate and residence duration, pyrolysis may be divided into two classifications: slow and rapid. Slow pyrolysis, which is often carried out over many hours, is typically linked with a larger production of biochar and lower flammability of the generated char as compared to quick and rapid pyrolysis among the pyrolysis types. In comparison to slow pyrolysis, fast pyrolysis produces a larger surface area. The carbon footprint of cementitious materials can be decreased by using biochar in place of cement [2,11]. Biochar usually consists of carbon in percentages of up to 60–70%, and the rest is basically ash containing different percentages of silicon, iron calcium, and some alkalis [12]. In addition, biochar can boost the construction industry’s recycling rate while capturing the carbon in structures in a stable form. Biochar has been proven in studies to increase the mechanical qualities of mortar, such as compressive strength and durability, while also lowering water absorption and porosity. This is due to biochar’s large surface area and porosity, which can improve the bonding between mortar and aggregates, resulting in a stronger and more lasting substance [13]. Qin et al. [14] have investigated the use of biochar in pervious concrete at 0%, 0.65%, 3.2%, 6.5%, 9.5%, and 13.5% for experiments on the mechanical properties (compression and tensile splitting strength), absorption of water along with density, permeability, the microstructure of the particles, and solar reflectance. The researchers found that biochar had almost no significant effect on the permeability and porosity of the concrete, but the strength of the concrete was elevated above the control mix by up to 6.5%.
Sewage sludge is an unavoidable byproduct generated during the sewage treatment process in sewage treatment plants. It is a diverse and intricate mixture that varies in composition and characteristics depending on the origin of the sewage and the chemicals utilized in the process of sewage treatment and storage. Sewage sludge ash (SSA), a byproduct of wastewater treatment, has lately been examined as a potential replacement for cement in the manufacture of mortar [15]. Historically, sewage sludge was widely dumped in landfills and seas. Nevertheless, due to the limited capacity in present landfills and increased environmental problems, such as groundwater pollution from landfill leachate, odor emission, and soil contamination, there is a greater emphasis on discovering alternate means of sewage sludge disposal [16]. The method of utilizing sludge ash can reduce trash production and the environmental effect of sludge ash. When the organic material in wastewater sludge is burned, a thin, powdery residue known as sludge ash is created. Some of the qualities of mortar can be improved by using sludge ash as a partial replacement for cement. Pozzolanic elements in sludge ash can react with calcium hydroxide Ca (OH)2 to generate calcium silicate hydrate (C-S-H) gel [17]. The strength of mortar can be increased by reacting calcium hydroxide with the amorphous SiO2 and Al2O3 in SSA to create calcium silicate hydrate (C-S-H) and calcium aluminate hydrate (C-A-H), respectively. The number of C-S-H nucleation sites in mortar increases when SSA is added [18]. Another investigation was conducted by Thongkhong et al. [19], who studied the use of sludge ash as a cement alternative in high-strength mortar. Their study examined the mechanical and durability qualities of mortar with varied concentrations of sludge ash (from 10% to 40%). The results showed that using up to 30% sludge ash did not significantly alter the compressive strength of the mortar. Nevertheless, adding more than 30% sludge ash reduced compressive strength. This shows that sludge ash may have a favorable influence. The study presented by Krejcirikova et al. [20] on sludge waste was based on its characterization and reaction with cement mortar. The sludges applied showed lower strength than the reference mix and higher porosity as the sludge increased. Dyer et al. [21] have highlighted the need for comprehensive research on the heat of hydration of mixtures of sewage sludge ash and Portland cement. This is because SSA is commonly high in phosphates, which sets it apart from other mineral additives typically used in concrete technology. Therefore, detailed investigations are necessary to understand the heat of hydration of sewage sludge ash (SSA) and Portland cement blends.
The research discoveries gathered from this study would serve as a guide for optimizing the biochar and sludge parameters in accordance with practical needs. This work is anticipated to open up fresh ideas on the biochar and sludge used in construction materials.
2. Materials and Methods
2.1. Materials
Several materials were utilized in this research work: potable water, superplasticizer, fine aggregate, cement; two different supplementary cementitious materials biochar and sewage sludge ash were processed and proportioned at different percentage of cement replacement.
2.1.1. Processing of Biochar
Studies have revealed that the characteristics of the biochar utilized largely depend on the primary feedstock [22]. The biochar samples used for this research work were processed from the pyrolysis of dried pine cones (collected from the Cyprus International University nature park), North Cyprus. Figure 1 shows the pine cone utilized for the research. The pine cones were air-dried to remove moisture, and then placed in a muffled furnace for pyrolysis at 500 °C for 2 h at a slow heating rate of 10 °C/min. According to ASTM D3174-12 [23]. This slow heating rate reduces the char flammability and ensures a larger char yield. After pyrolysis, the char was cooled down slowly by keeping it in the furnace until a considerable drop in temperature occurred. Grinding of the char produced was performed mechanically to obtain the majority of the particle sizes passing 75 µm using an electrically controlled Los Angeles machine before incorporating the biochar. Figure 2 shows the particle size distribution of the biochar, which depends on the feedstock and intensity of grinding. This was determined by using the Malvern Scirocco Mastersizer, and the range was between 5 µm and 75 µm (d50: 20.25 µm).
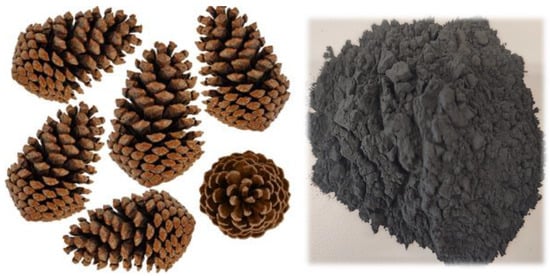
Figure 1.
Biochar source (pine cone).
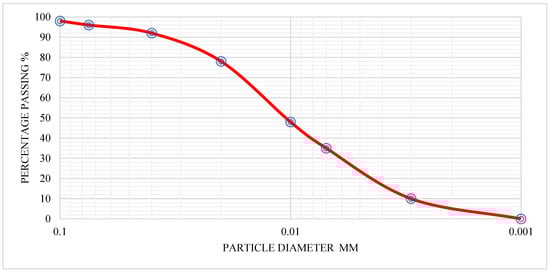
Figure 2.
Particle size distribution for biochar.
Morphology
The microstructure of the resulting biochar was investigated under a scanning electron microscope (JSM-6610LV; JEOL, Tokyo, Japan) at a 30 kV accelerating voltage. The scanning electron microscope (SEM) image of biochar is depicted in Figure 3a. To improve the biochar sample’s conductivity, it was coated with platinum–gold dust using the SC7620 Mini sputter coater. The structure of the grinded biochar samples showed irregular, elongated-shaped particles with the presence of surface macropores with a considerable fraction below 20 µm, as shown in Figure 3b. These pores facilitate the water absorption capacity of the biochar in the mortar.
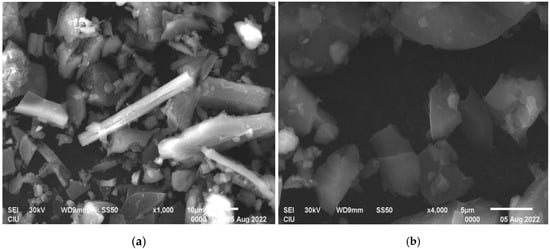
Figure 3.
(a). SEM micrograph of biochar. (b): Micropores of biochar sample.
XRD, Elemental Composition, Specific Gravity, and Water Absorption of Biochar
The phases present in the crystalline structure of the biochar samples were investigated using X-ray diffraction (XRD). The analysis was carried out using a Rigaku powder diffractometer, equipped with two horizontal powder diffractometers providing K Cu wavelength radiation (1.54056 Å), operated by a high-power 18 kW rotating anode source, and the outcome presented in Figure 4. The biochar samples were dried and grinded to particles passing 75 µm sieves; additionally, XRD scanning was carried out at a position (2θ, Cu-Kα) between 2° and 90°.
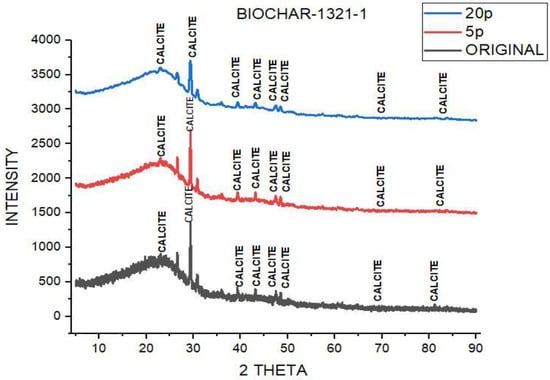
Figure 4.
XRD analysis of biochar.
Electron dispersive spectroscopy (EDS) attached as an appurtenance to the scanning electron microscope was used to investigate the semi-quantitative elemental composition of the biochar samples.
The bulk density of the biochar sample determined by using an ASTM standard [24] helium pycnometer was 1.534 g/cm3. The filtration method was used to measure the water retention capacity of the biochar samples. Firstly, the test samples were oven-dried and placed in a water-filled container with a lid in a ratio 1:10 (10 g of biochar to 100 g of water) for 48 h. A magnetic stirrer was used to agitate the mix solution for thorough dispersion of the sample on the water surface. Using multiple layers of wet filter paper, the solution was allowed to drain freely. The weight of the residual biochar retained on the filter paper was measured and recorded; this was subtracted from the initial dry biochar weight to obtain the total mass of the water absorbed. The water absorption obtained for pine cone biochar was 1.835 ± 0.20 g/g of dry biochar.
2.1.2. Sewage Sludge Ash
Sludge was obtained from the disposal area of the new waste water treatment plant in Haspolat, Nicosia, North Cyprus. It was first air-dried for 1 week, after which the sample was then oven-dried at a temperature of 110 °C for 24 h Figure 5. Sewage sludge ash was processed by pyrolysis at a temperature of 850 °C for 2 h using a muffled furnace, as reported by Alayish and Celik [25]. Afterwards, the sewage sludge ash was slowly allowed to cool down and was grinded using the Los Angeles machine to particle sizes passing 75 µm sieves with a specific gravity and water absorption of 2.72 and 0.86, respectively, Figure 6.
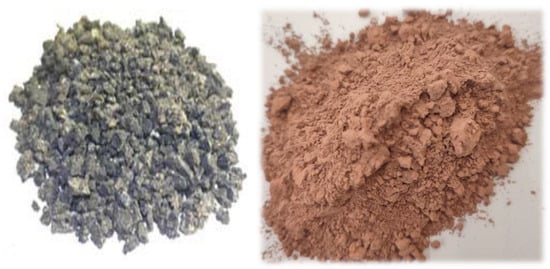
Figure 5.
Dried sludge.
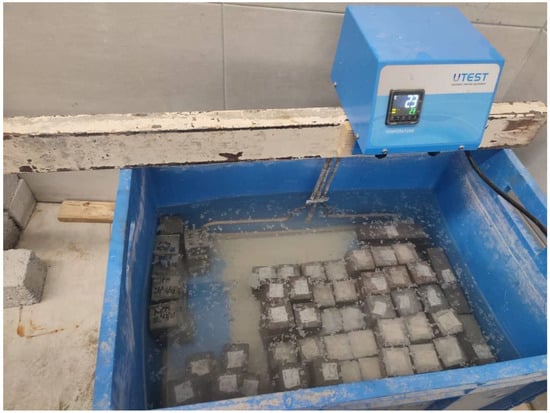
Figure 6.
The sample curing process.
2.1.3. Cement, Sand, Mixing Water, and Admixture
A single batch of ordinary Portland Cement Type 1 of class 42.5R produced by BEM Portland Cement Company (BOGAZ ENDUSTRI ve MADENCILIK LTD, Iskele, Turkish Republic of Cyprus) conforming to the ASTM C150 [26] specifications was used throughout this research. The chemical and physical characteristics of the cement are given in Table 1. The fine aggregate (crushed sand) used was locally sourced with 4.75 mm maximum particle size, and a specific gravity and fineness modulus of 2.63 and 2.79, respectively. Clean potable water was utilized throughout this research work, as detailed in ASTM C1602 (2018) [27]; the water was obtained from a tap at the research laboratory. A modified polycarboxylate-based high-range water-reducing superplasticizer admixture (CHRYSO Fluid Premia 196) with a specific gravity (20 °C) 1.055 ± 0.01, pH 7.50 ± 2.00, solid content (halogens) 25.00 ± 1.20%, Na2O equivalent ≤ 1.50%, and Cl− equivalent ≤ 0.10% supplied from CHRYSO S.A.S was used.

Table 1.
Chemical and physical characteristics of OPC cement used.
2.2. Methods
2.2.1. Mortar Specimen Preparation
High-performance mortar specimens were prepared with a constant mix ratio of (cement + biochar + sludge ash), sand, and mixing water, respectively, in 1:2.25:0.35 for the binder, 1 part admixture to 2.25 sand, and 0.3. The water–binder ratio was kept at a constant value of 0.35, and the high-range water-reducer dosages (super plasticizer) for all the mixes were maintained at 1.05% of the weight of the binder. The biochar was added in proportions of 3% and 6% by weight of cement; Maljaee et al. [28] have in their study proposed biochar percentages of 4–5% by weight of cement as optimum. The sludge ash was added in proportions of 5% and 10% by weight of cement.
As required by ASTM C305-20 [29], mixing was conducted using an automatic programmable mortar mixer (UTCM-0885E) at room temperature. For each mix proportion, dry mixing of the solid components (sand, cement, biochar, and sludge ash) was carried out for 1 min, followed by the addition of part of the mixing water. Mixing continued for another 2 min at moderate speed until a consistent homogeneity was achieved, and the remainder of the water was added (part of which is mixed with the super plasticizer) and mixed for additional 2 min; then, the mixture was allowed to rest for 1 min. After this, the edges of the mixing pan were scraped and the mixing continued at high speed for 30 s and, finally, ended at moderate speed for 1 min.
The impact of the combination of biochar and sewage sludge ash on mortar workability was evaluated for the different ratios of mixes using the flow table test, which is described in ASTM C1437-15 [30]. As the percentage of cement substituted increased, both materials showed a discernible impact on the flow characteristics. The homogenous mortar mix was then vibrated for 1 min using a vibrating table to remove excessive air bubbles (entrapped air) and cast into 50 × 50 × 50 mm cubic molds (mechanical and durability properties), 40 × 40 × 160 mm beam molds (flexural strength), and 25 × 25 × 285 mm prisms (drying shrinkage). Stretch films were used to cover the molds of the cast samples for 24 h, and they were then placed in an ambient temperature environment. After demolding, all the samples were placed in a water-curing tank at a 23 °C. All of the test samples were cured for 7 and 28 days before testing. The samples were prepared for characterization of their mechanical (compressive and flexural strength) and durability properties (water absorption, acid resistance and fire resistance).
2.2.2. Mix Design
For this research work, a total of nine (9) mixture proportions were designed for the various supplementary cementitious materials (SCM) used (biochar and sewage sludge ash), as shown in Table 2, and their performance was investigated for the high-performance mortar. The mixes were labeled based on the SCM used and the corresponding percentage replacement. These comprised the control (ordinary mortar) CM, mixes with only sewage sludge ash at 5% and 10% cement replacements (SA5 and SA10), mixes with only biochar at 3% and 6% cement replacements (BC3 and BC6), and mixes with a combination of sewage sludge ash and biochar at various proportions (BC3SA5, BC3SA10, BC6SA5, BC6SA10).
Table 2.
Mix proportion of mortar specimens.
2.2.3. Curing
To achieve the desired mechanical and durability properties, the specimens were removed from the mold after 24 h and subjected to appropriate curing conditions for 7 and 28 days. The conditions for drying and ambient curing were maintained at a temperature of 20 °C with a variation of ±2 °C. The sample’s curing process is shown in Figure 6. These conditions included water bath and oven-drying, as well as ambient curing for a specified period ranging from 7 to 28 days.
2.2.4. Workability
To determine the workability of the fresh mortar mixes, a flow table test was carried out according to the ASTM C1437-15 [30] standard. Figure 7 shows the flow table test. All tests were conducted using the following method.
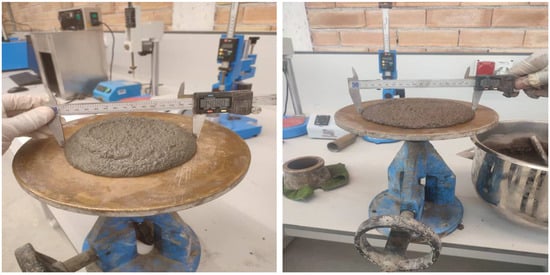
Figure 7.
Flow table test.
2.2.5. Water Absorption
Another essential non-destructive assessment for cement-based composite materials is water absorption testing, which measures a structure’s capacity for absorbing water as well as counts the number of permeable holes it contains, according to ASTM C642-21 [31].
2.2.6. Compressive Strength
The performance of cement mortar, which incorporates biochar and sludge ash as replacements, was evaluated by applying a compressive force using a compression testing machine. The compressive strength of the samples met the ASTM C109M-20a standard [32]. Figure 8 displays the specimens that underwent the compressive strength testing. In the test, the following procedures were used to achieve the desired compressive strength:
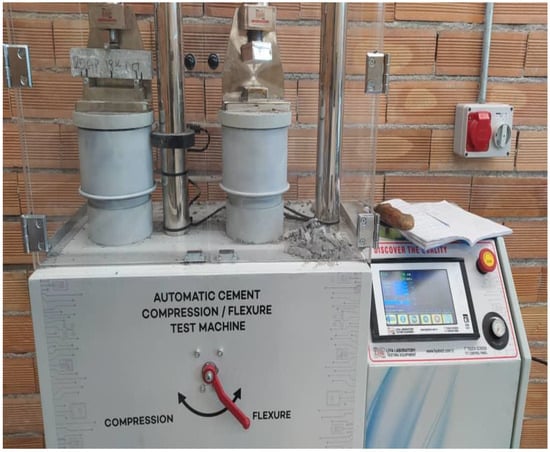
Figure 8.
Compressive and flexural strength test machine.
- i.
- The mortar sample was accurately positioned near the center of the lower platen of the machine, with the sides of the specimens in contact with the upper and lower platens aligned with the smooth surfaces of the mold.
- ii.
- The machine’s loading rate was consistently maintained at 1 kN/s.
- iii.
- The device automatically determined the samples’ compressive strengths as they were compressed.
2.2.7. Flexural Strength
A material’s ability to withstand bending forces applied in a direction perpendicular to its longitudinal axis is known as flexural strength. In compliance with ASTM C348-21 standards [33], the flexural strength of the mortar prism was assessed after 28 days of curing. This was performed by subjecting the prism to a point load using a flexural strength testing machine, as depicted in Figure 9. The prism was positioned atop a roller support with a measured height of 120 mm, and the loading rate was set at 2 kN/s. The flexural strength was determined when the prism reached its failure point.
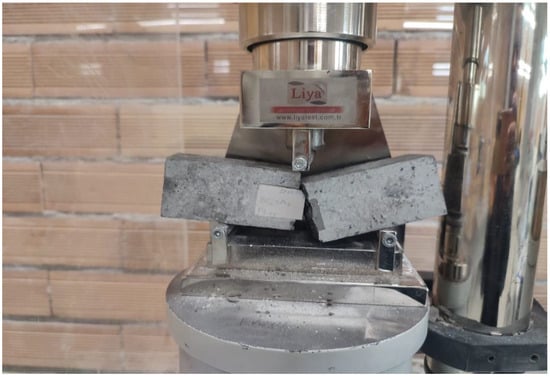
Figure 9.
Flexural strength testing.
2.2.8. Density
Density is a non-destructive test for cement composites that establishes an object’s weight and is capable of helping assess whether or not it is appropriate for use in various infrastructure projects. The density experimental technique explored buoyancy manner after 28 days in accordance with ASTM C567-14 [34] and the computation is as per ASTM C642-13 [31].
2.2.9. Drying Shrinkage
A volume alteration caused by the depletion of relative humidity in cement-based blends is classified as drying shrinkage. Figure 10 shows the drying shrinkage of all the mixtures. The tightness amongst particles caused by a high internal dehydration leads to a rise in interior tensile properties, which in turn causes cracks to develop. Many variables, including the environmental conditions, the pace and heat generated by hydration, the cement type, and the cementitious material used, all impact the pace of moisture loss [35]. An ASTM 596-18 [36] compliant dial gauge length comparator was used for the test.
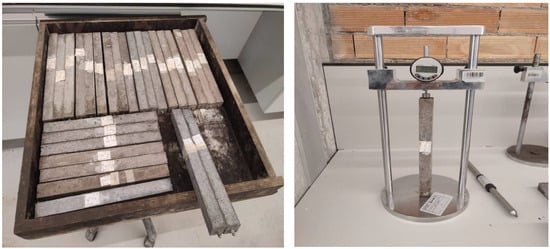
Figure 10.
Dry shrinkage of the mixtures.
2.2.10. Fire Resistance
Using an electrical muffle furnace, a fire-resistance test was conducted to assess how well the mixes behaved when exposed to a high-temperature environment in accordance with ASTM E119-20 [37] requirements. The objective temperature range for which the materials were examined was divided into three ranges (400 °C, 600 °C, and 800 °C). Figure 11 shows the electric furnace. The following procedure was used to conduct the test:
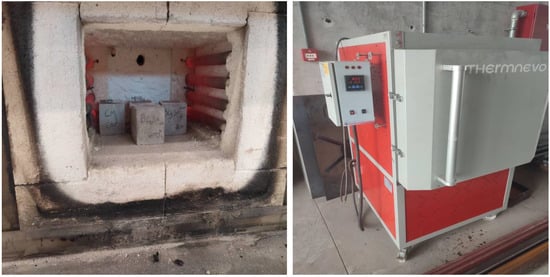
Figure 11.
An electric chamber furnace.
- I.
- To lower the capillary water vapor pressure, the samples were oven-dried for 24 h at 70 °C when they were 28 days old.
- II.
- After that, samples were added to the heating chamber. To achieve even heat transfer, a space was maintained between the composite samples and the heating coils.
- III.
- The furnace’s heating was elevated from ambiance (25 °C) to the goal temperature at a pace of 9 °C/min, and the samples are maintained in the heating chamber for two hours at the specified temperature.
- IV.
- Once the heating system was switched off, the samples were left inside to cool gradually for 24 h. The remaining compressive strength of the cooled mixture was then assessed.
3. Results and Discussions
3.1. Workability/Flowability
The ability of cement-based mixtures to flow and be worked is a crucial factor as it determines the simplicity of placing and compacting the fresh cement mortar while ensuring uniformity. According to Ramachandran [38] and Daniel [39], there are manifold elements that have an impact on the flowability of a mixture, including the water-to-cement ratio (w/c), properties of the aggregate, and use of superplasticizer. The flowability of a mixture can be greatly affected by the inclusion of mineral admixtures and materials with pozzolanic element, as their magnitude of absorption, particle size distribution, and surface area can have a significant influence (Madani et al., [40]).
Figure 12 clearly demonstrates that as the percentage of sludge was increased, less water was absorbed compared to biochar. It also highlights that incorporating a combination of sludge and biochar tends to improve workability when compared to using biochar alone. However, it is worth noting that all of the materials exhibited reduced flowability in comparison to the control mix, with reductions ranging from 21.76% to 37.82% across the range from SA5 to BC6SA10.
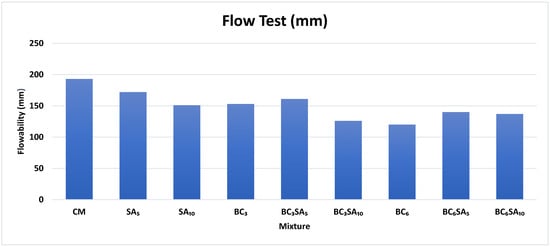
Figure 12.
Flowability.
The control mix had the highest flowability compared to all the mixes. The flow rate of SA10 also had the highest flowability compared to SA5, suggesting that increasing the percentage of sludge ash led to a higher flow rate. BC3 exhibited a higher flow rate compared to BC6, and increasing the percentage of biochar resulted in a reduction in flowability. Among the binary blends, BC3SA5 exhibited the highest flow rate compared to the other blends overall, and it was the mix with this blend that exhibited the highest is SA10 except control mix. The decrease in flowability observed in the mixtures, as compared to the control mix, can be attributed to the increased surface area of the materials. This greater surface area led to the absorption of some of the mixing water by the SA and BC, ultimately leading to a reduction in flowability.
It takes more water for cement to hydrate SA because SA grains are more irregularly shaped than those of other waste products, such as fly ash [41]. The substantial pore structure within the matrix, triggered by variations in both biochar and sludge ash, necessitates the addition of water to allow for the sample to flow effectively. Ash-like material or material that has undergone a high temperature typically necessitates the absorption of lots of water to sustain its flow, keep its form, or prevent it from hardening very quickly, which is the reason that the addition of superplasticizer has assisted in maintaining all of the water contents up until the samples were cast. Moreover, from chemical composition, it is shown that the main constituents of sludge ash are P2O5, SiO2, CaO, and adsorbed SO3. The high concentration of calcium and phosphorus slows the thermal hydrate flow pace; this is a defining characteristic of SA samples, as mentioned in Haustein et al. [42]. A hygroscopic matrix is created in SSA when P2O5 concentrations are high [43], and oxidizing SiO2 and CaO additionally decrease the water available, thus the lubricating effect between the interlocking and friction is reduced in the particles of SSA. This further led to the increasing flow of sludge in this study. When SSA is further milled, it becomes smoother and less porous, thus solving the known issue of flow deterioration [44]. By substituting additional hygroscopic components of concrete composites, such as fine aggregates, the deleterious effects of SA on the flowability of cement-based materials could be mitigated [45]. Biochar is claimed to be a material that absorbs and retains water to use for curing later [14,28]. The level of biochar present in a mix shows the level of pores that store and absorb water used in the mixture. According to an experiment by Asadi Zeidabadi et al. [2], given that biochar has a substantial surface area, more water is needed to enhance its flow, as for the water-to-binder (w/b) ratio to remain constant, the superplasticizer addition was required to maintain the values of slump. From the abovementioned reasons and results, this can evidently be seen as the reason for ternary blend BC3SA5 having 161 mm flow, as it consists of the two minimal qualities of the cement substitute, which constitute in a lower quantity have reduced the amount of water absorbed and properly bonded with lower pore structures.
3.2. Compressive Strength
The load-bearing capability of cement mortar after the hardening process is one of the crucial aspects to carefully assess when considering applying it in structural applications. The effectiveness of cement mortar’s ability to withstand and support varied loads determines how much of it may be used in structural operations. Its structural appropriateness and dependability are largely dependent on this. It is generally recognized that factors influencing strength properties include the existence of either main and secondary constituents in cement and waste, the specific surface area of particles, the distribution of grain sizes, and the morphology of the particles [46].
Figure 13 and Table 3 shows the compressive strength of the mixes. This graph illustrates the mean compression result of the tested materials of each blend at ages 7 and 28 days. According to Figure 14, the reference batch (CM) had a strength development of 65.37 MPa at 7 days and 72.1 MPa at 28 days. When compared to the reference mixture, all combinations showed noticeably higher strength levels after 28 days. Notably, those containing 5% and 10% of SA showed large increases of 19.52% and 13.78% at 7 days, as well as significant improvements of 24.76% and 21.68%, respectively, at 28 days. These findings mostly concur with those presented by Baeza-Brotons et al. [47]. The homogeneity and filled-pore structure from using SA led to the increase in strength. Porosity and strength are directly correlated with each other, and the smaller the pores in the structure of the mortar mixes, the stronger the strength (Vouk et al.) [48]. However, the binary blends with BC3SA10 and BC3SA5 exhibited a high strength compared to the control mix both at 7 days and 28 days, with percentage increments of 6.6% and 30.9%; and 2.2% and 14.1%, respectively. Haustein et al. [42] have supported their findings, suggesting that SA has an effect on the hydration of cement because of its chemical composition: a dense concentration of calcium and phosphorus, which slows the thermal hydrate flow pace, is a defining characteristic of SA samples
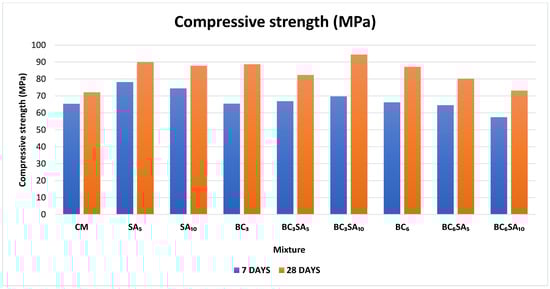
Figure 13.
Compressive strength of mixes.
Table 3.
Effect of biochar and sludge ash on the workability and mechanical properties of mortar.
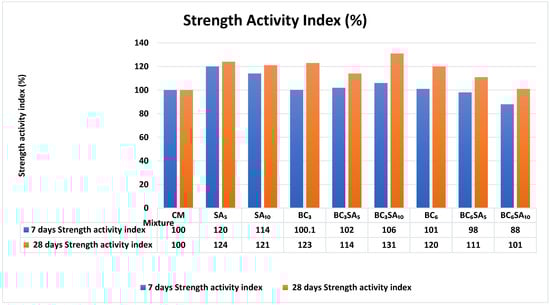
Figure 14.
Strength activity index.
The initial peak in heat flow was diminished, and its occurrence was delayed as the ash content increased. As the accumulating heat of hydration was reduced, there was less chance of early-stage concrete cracking, owing to the elevated SSA ratio, which pleasantly influenced the hardening of massive buildings. It probably had little pozzolanic action and mostly functioned as an additive. This might be due to the fact that the SA grains contained a lot of water and only a little quantity of CH from cement hydration, which was formed to take part in the pozzolan response with sludge ash and give the mortar samples strength. This phenomenon can be explained by recognizing that SA grains retain a substantial amount of water, leaving only a limited quantity of CH (calcium hydroxide) available from cement hydration to partake in the pozzolanic reaction with sludge ash. This study used a w/b ratio of 0.35, which can be attributed as one of many reasons for the increase in strength. The gradual increase in the cement ash-based mortar’s strength might be explained by a few different factors: primarily, the water absorbed by the ash pores lowers the liquid-to-cement ratio, counteracting the diluting effect (i.e., greater w/c ratio); and second, the water absorbed by the ash pores may very well be discharged directly to the composite, further enabling the hydration process. Moreover, the uneven form of ash particles improves the interconnection of ashes and cementing grains, ensuring better strength.
The BC3 and BC6 showed very little increases of 0.11% and 1.27% at 7 days simultaneously when in comparison with the control mix; nevertheless, by 28 days the strengths improved more by 22.94% and 20.89% in comparison to the control, and these increases indicate that at 28 days the 3% biochar improved by more than the 6% of biochar, exhibiting that as the proportion of biochar was increased, compressive strength trended downward. The fine grains of BC are effective in blocking the voids and pores in the cementitious mix, thus making the mortar more homogenous. The uniformity of solidified mortar and its improved ability to transmit stress under pressure can be attributed to the fine grains, which serve as fillers. These filler materials, although inherently insoluble and non-reactive, play a crucial role in promoting the development of a denser structure through two distinct mechanisms.
Based on the researchers view of the material, the type of material and the temperature at which it is were produced have a great impact on how it affects the properties of concrete. Choi et al. [49] have as well stated that in order to retain the humidity of cementitious materials throughout their initial phases and achieve the necessary strength, the biochar ingredient can lower the quantity of water loss from the cement mortars. This suggests that biochar functions as a self-curing agent. The uniformity and compressive strengths of the biochar–cement blends would be improved because fine biochar will occupy pore spaces among solid binders, similarly to what the above research found. Biochar has a greater capillary capacity as opposed to standard fillers, which allows it to hold onto the fluid. The trapped water will disperse and lead to internal curing, enabling the hydration of blends of biochar and cement [50]. Regarding sludge ash, Yusuf et al. [51] have mentioned in their study that the use of sludge ash seems more compactable with a cement of high C3A, and in regard to that low strength was not found. As the amount of cement substituted by SSA increased, the compressive strengths of the investigated mortars fell linearly, according to Chen et al. [52]. This impact is described by (i) the substantial amount of water that is necessary in mixes with sludge to preserve flow ability; and (ii) the low CaO level in ash (less than 10%), which influences the hydraulic characteristics. This study found that the measured loss in compressive strength for mixes with SSA contents of 10% was less than 25% compared to control samples devoid of SSA.
Figure 14 demonstrates that the strength activity index (SAI) for all mixtures at 7 and 28 days meets the performance criteria outlined in ASTM C618-19 [53]. As per the ASTM standard, the SAI should be equal to or greater than 75 percent. The SAI values obtained using the suggested constant volume did not exhibit a decrease compared to those obtained using the ASTM C311-18 [54] procedures, which involve adjusting the water content to comply with the requirements of ASTM C618. This suggests that the proposed constant volume protocol is as effective as the ASTM C311-18. In comparison to the control mix, the SA10 and SA5 mixtures both included 5% and 10% sludge ash and exhibited 114–120% higher strength activity values at both 7 days, respectively, and 121–124% at 28 days. This indicates that the inclusion of sludge ash improves the strength development of the mortar. The pozzolanic attributes of sludge ash allow it to react with calcium hydroxide in the presence of water to produce new cementitious compounds. Within the mortar, this pozzolanic process causes the formation of binding materials that are more tenacious and efficient. BC3, BC3SA5, and BC3SA10 at 7 days (100.1%, 102% and 106%) and 28 days (123%, 114%, and 131%) in these mixtures, incorporating both biochar and sludge ash, demonstrated varied SAI values. BC3 and BC3SA5 exhibited slightly higher SAI values, indicating improved strength development compared to the control mix. However, BC3SA10 demonstrated a significantly higher SAI, suggesting even greater strength development.
3.3. Flexural Strength
After 28 days of curing at a temperature of 20 °C, mortar prisms were tested to determine the flexural strength of the samples. Between these samples and the reference mix, a comparison was made. Figure 15 shows that, when compared to the control mix, all specimens showed a loss in strength, with the loss varying from 3.3% to 41.6%.
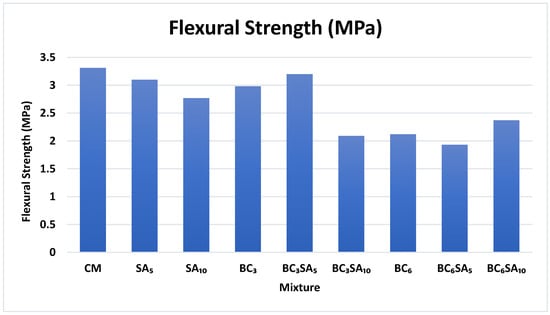
Figure 15.
The flexural strength of the mixtures at 28 days.
The strength of various mortar mixes was tested, and it was found that the SA5 mix showed a 6.3% decrease in strength, while the SA10 mix showed a 16% decrease in strength when compared to the control mix. The flexural strength of mortar with SSA is usually less than that of cement mortar, and this trend is consistent with the pattern observed in compressive strength [55]. As the replacement ratio increases, the flexural strength decreases further, as illustrated in Figure 16. Despite this, some researchers have discovered that the flexural strength of SSA mortar after 28 days can be higher than that of cement mortar when SSA is used in small replacement ratios. This increase in strength is attributed to the high water absorption and filling effect of SSA [56]. On the other hand, if the replacement rate of SSA exceeds 30%, a significant decline in flexural strength can be observed. This reduction is attributed to the low reactivity of SSA [57]. Similarly, the BC3 and BC6 mixes showed a 10% and 36% reduction in strength, respectively, when compared to the control mix. A greater concentration of carbon in biochar results in an increased presence of pores in the plane that undergoes tensile stress, as carbon has a naturally porous structure. These pores can act as a vulnerable point for the spread of cracks during tensile loading [9]. In the case of binary blends, the BC3SA5 mix showed a 3% reduction in strength, while the BC3SA10, BC6SA5, and BC6SA10 mixes exhibited 37%, 42%, and 28% decreases in strength, respectively, when compared to the control mix. BC3SA5 exhibited a higher flexural strength than BC3SA10. One probable explanation is that the larger percentage of sludge ash in the combination (biochar 3%, sludge ash 10%) increased water demand, resulting in a porous and weaker structure. Excess water might have caused the solidified mixture’s porosity to increase, reducing its strength and durability. The BC3SA5 mix had the highest flexural strength among all the mixes, with a slight reduction of only 3% when compared to the control mix.
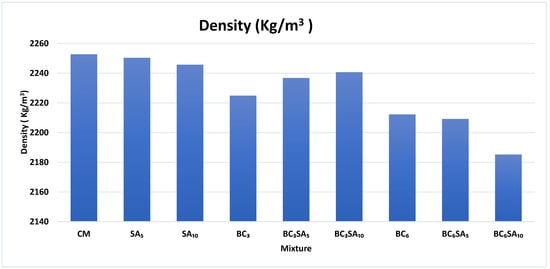
Figure 16.
The density of the mortar mixtures.
3.4. Density
The graph in Figure 16 compares the densities of the different mixtures, and the impacts of the inclusion of biochar and sludge ash as cement replacements on mortar density. The maximum amount of cement particles that can be packed into a specific volume is 2252.79 kg/m3. The cement pastes with SA 5%, SA 10%, and BC 6% SA 10% showed a close-range relationship with the control mix due to the filler effect of SA particles and their potential to increase the overall density. According to Vouk et al. (2015) [48], the density of SA is determined by the burning temperature of the sewage sludge ash, which accelerates the increase in the density. Measuring the density of blended mixtures is important to optimize performance. The implementation of blended mixtures like BC 6%, BC 3%, and BC 3% SA 5% in cement pastes resulted in marginal decreases in the particle densities, specifically by 1.79%, 0.3%, and 3%, respectively, when compared to the control mix. This was due to biochar’s porous nature, which may lessen the blend’s overall packing density. Additionally, the presence of biochar and sludge ash particles could displace certain cement pastes, thereby reducing the overall packing density. This displacement effect became more pronounced with higher concentrations of biochar and sludge ash, explaining why the BC6SA10 combination exhibited the most significant drop in particle density.
3.5. Water Absorption
It is widely accepted that materials consisting of minuscule granules have a greater propensity to absorb water in comparison to those comprised of larger particles, primarily due to the larger surface area available for water absorption in the latter. The sample of BC6 showed a respective reduction of 0.44% in comparison to the control mix; this was a result of the steady water required by biochar, as this channel for water absorption was reduced, and it is expected that the gaps reduced by internal curing and the filler effect of biochar prevented water from penetrating the cement matrix, hence lowering the water absorption of the mortars [57]. The sample consisting of the highest water absorption was SA10, with 5.4% in correlation to the control mix. The substantial impact of sludge ash on the water absorption capacity, as evident in Figure 17 and Table 4 for its value, can be attributed to multiple constructive factors, such as the porous structure of sludge ash providing ample space for water retention and absorption within the mortar. Additionally, the larger surface area of sludge ash particles offers more opportunities for water molecules to interact and be absorbed. The hydration reactions occurring between sludge ash and water further contribute to the increased water absorption capacity. Furthermore, the chemical composition of sludge ash, including hydrophilic properties, actively facilitates the absorption of water. Collectively, these constructive aspects of sludge ash, such as its porous structure, larger surface area, hydration reactions, and chemical composition, synergistically enhanced the water absorption capabilities of the mortar. Meanwhile, the binary blend samples consisting of BC6SA5 and BC6SA10 in the table showed respective increases of 2.84% and 2.24% in water absorption values. This can be explained by the impact of these binary mixes, as several factors can be attributed to the highest water absorption. Biochar is noted for its very porous nature, which allows it to form additional water absorption channels inside the mortar. When biochar particles are mixed into mortar, their natural pore structure improves the mixture’s moisture absorption capacity. This property of biochar enables it to improve the mortar’s ability to absorb and retain moisture. The proportion of macropores in the mortar mix increases as the biochar percentage increases. Macropores have been observed to have a significant impact on the transmission and permeation properties of cementitious composites, resulting in a high sorptivity and penetration depth [58,59].
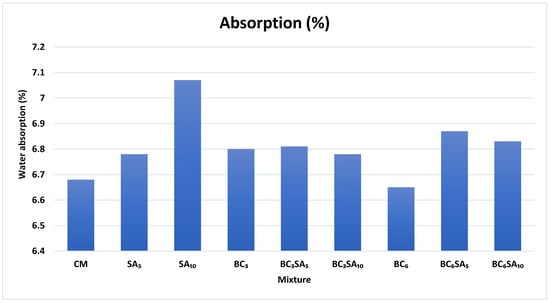
Figure 17.
Water absorption of all of the mixes at 28 days.
Table 4.
Effect of biochar and sludge ash on the density, absorption, and drying shrinkage of cement mortar.
Its distinctive qualities, particularly its high porosity and excellent adsorption capacity, are what give biochar its outstanding attribute to enhance the removal of pollutants from wastewater. These qualities make it possible for biochar to efficiently trap and accumulate hazardous compounds on its surfaces, resulting in the creation of a purified effluent that is not only free of pollutants but also rich in essential nutrients. This procedure aids in the development of wastewater treatment methods that are more effective and environmentally conscious. Another important observation in the increase in water retention and the formation of connected capillary pores in the concrete mix can be attributed to the porous structure of biochar. Upon the addition of biochar, connected capillary pores are formed, and their quantity increases with higher dosages of biochar [60]. This phenomenon is a result of the porous nature of biochar, which enhances water retention and facilitates the creation of interconnected capillary pathways within the concrete mixture.
3.6. Drying Shrinkage
Drying shrinkage is the phenomenon where concrete undergoes volume reduction due to moisture evaporation from its capillary pores when exposed to a lower humidity environment than its original state. Mehta and Monteiro have conducted extensive research, documented in their textbook (97), to investigate the constituents and factors that influence the drying and shrinking of concrete. Through rigorous experimentation, they aimed to identify and comprehend the specific elements that play a role in these processes. Their work sheds light on the intricate relationship between moisture dispersion and concrete behavior, offering valuable insights into the underlying mechanisms governing drying shrinkage. The findings of the drying shrinkage tests for various blends of mortar up to 32 days are displayed in Table 4. The drying shrinkage of mortar decreased when SA or BC was added compared to the control mortar, as shown in Figure 18. It is feasible to achieve an enhanced pore structure with finer and more refined pores by adding sludge ash to the concrete mixture. This is mostly related to sludge ash’s pozzolanic reactivity and filling effect. Consequently, the presence of this effect lessens the potential for concrete shrinkage. The mix binary blends with BC6SA10, BC3SA10, BC3SA5, BC6SA5, SA10, BC3, SA5, BC6 pozzolan, and a water–binder ratio of 0.35, showed reductions in dry shrinkage of 55.17%, 46.55%, 44.8%, 39.66%, 39.66%, 36.2%, 34.4%, and 13.79% compared to the control mix. The beneficial synergistic effects brought about by combining biochar (BC) and sludge ash (SA) may be responsible for the decreased drying shrinkage seen in the mixtures. An enhanced pore structure and less overall shrinkage are the results of these synergistic behaviors. The interaction between BC and SA improves the microstructure of the concrete, resulting in an improved dispersion of particles, as well as less fractures and correlated pores. As it restricts the paths for moisture evaporation and reduces the volume changes that happen during the drying process, this enhanced pore structure helps to reduce drying shrinkage. The variations in the morphology of pores inside the cementitious material occur through the combined implementation of biochar and sludge ash. The occurrence of drying shrinkage is consequently caused by these alterations. The amount of lime required to achieve a rapid hydration rate is greatly decreased by integrating BC and SA and substituting a portion of the cement content. A reduction in lime concentration is an efficient method for dealing with the problem of dry shrinkage, which is a common issue that frequently affects cement-based materials.
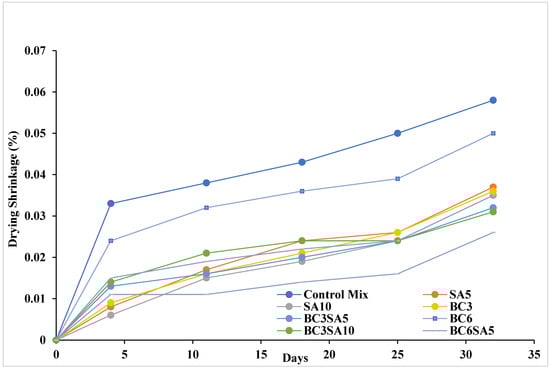
Figure 18.
The drying shrinkage values of the blended mixes.
3.7. Fire Resistance
Figure 19 and Figure 20 show the thermal resistance of different mortar mixtures. A material’s ability to endure heat and preserve its structural integrity is often assessed through the use of fire resistance testing. Several variables, including intended application and the materials under test, influence the precise temperature used for testing. The mortar mixtures were heated to temperatures of 400, 600, and 800 °C in accordance with ASTM E119 [37] standard regulations. Table 5 displays the strength and loss in the samples after fire testing.
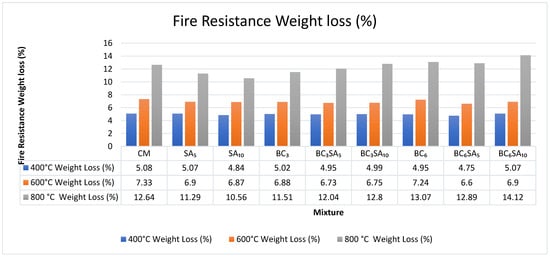
Figure 19.
Weight loss in the mixtures.
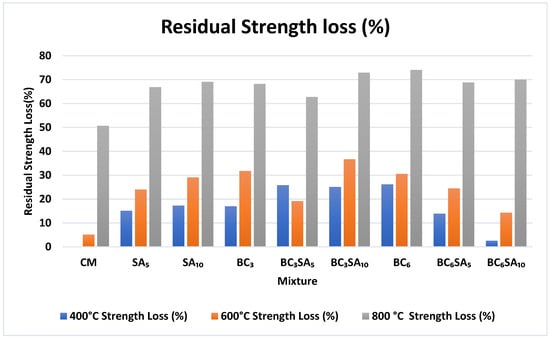
Figure 20.
Residual strength loss in the mixtures.
Table 5.
Effect of biochar and sludge on the fire resistance of cement mortar.
All the combinations noticeably displayed a percentage of weight loss and strength loss for each mix in comparison with the control mix (CM). At 400 °C, the CM experienced a weight loss of 5.08% and a strength loss of 8.87%. The mixes with SA and BC showed varying weight losses and strength losses compared to the CM. Some mixes had lower weight losses (BC6SA5, BC6SA10) or similar weight losses (SA5, SA10, BC3, BC3SA5, BC3SA10, BC6) but higher strength losses compared to the CM. This indicates that the presence of SA and BC did not provide significant benefits in terms of strength retention at this temperature. During decomposition caused by heat, it is possible for the organic materials in sludge or biochar to undergo thermal decomposition at 400 °C, which would result in the release of hydrocarbons and weight loss. Although the mortar’s strength may not necessarily increase, this breakdown process can help the materials to undergo weight loss. The establishment of substantial chemical interactions throughout the mortar matrix may be hampered by the inclusion of sludge or biochar. This may lead to lower surface bonding and a decreased overall strength between the cement particles.
The weight loss percentages of BC3, BC6, SA5, and SA10 are marginally less than that of the control mix (CM) at 600 °C. This suggests that incorporating biochar and sewage sludge ash into the cement mortar may provide some level of fire resistance, as these mixtures experience slightly less weight loss compared to the control mix. Organic components, which are susceptible to thermal degradation and combustion at high temperatures, are present in both biochar and sewage sludge ash. The chemical structure of these materials can be used to explain this behavior. At extremely high temperatures, biochar can still undergo further reactions since it is not entirely inert. Weight loss can result from the organic carbon in biochar oxidizing and releasing gases, notably carbon dioxide (CO2) and carbon monoxide (CO), leading to weight loss. The organic components included within the SSA could ignite when a construction material containing SSA is subjected to high temperatures. When its organic compounds interact chemically with oxygen from the environment or other sources, combustion results in the release of heat and the generation of combustion products, such as carbon dioxide (CO2), water vapor (H2O), and other gases. The combustion process can be accelerated further by the heat produced by this exothermic reaction.
In comparison to the control mix (CM), all of the mixes (SA5, SA10, BC3, BC3SA5, BC3SA10, BC6, BC6SA5, BC6SA10) showed some degree of strength loss that varied at 400 °C. Several factors can be considered the causes of strength loss: the blends’ tendency to lose moisture at this temperature, which reduces their strength; the absence of water can prevent the production of robust cementitious interactions, since water is essential to the hydration process of cement.
The strength loss became more noticeable above 600 °C, especially for mixtures including biochar (BC3, BC3SA5, BC3SA10, BC6, BC6SA5, BC6SA10). The thermal degradation of organic elements included in biochar and sludge is responsible for the greater strength loss seen at 600 °C compared to 400 °C. According to Li, Y. et al., 2020 [61], these organic components further decompose at higher temperatures, releasing large quantities of gases and volatile chemicals. As a result of this process, the cement mortar develops voids and microcracks. With the temperature reaching 600 °C, these pores and microcracks significantly reduce the overall strength of the structure. Phase transitions occur in cement at a temperature of 800 °C for certain mineral phases, such as calcium hydroxide. A drop in the cement matrix’s overall strength may result from these phase alterations. The integrity of the mortar may be harmed by changes in the crystalline structures and the disappearance of specific phases. The degradation of C-S-H (calcium silicate hydrate) and the dehydration of calcium hydroxide inside the mortar are to blame for the loss in strength. Internal stresses are produced as a result, which cause the development of microcracks that impair the connection between the material’s various constituent parts. The cohesiveness between its components gradually deteriorates because of the internal pressures brought on by the mortar’s volume expansion, which results in these microcracks.
3.8. Acid Resistance
The assessment of incorporating biochar and sludge ash as substitutes for cement in mortar rigidity is crucial for improving the durability of cement-based materials in acidic environments. Figure 21 demonstrates a marked increase in sulphate infiltration after 28 days when compared to the control mortar. Figure 22 and Figure 23 shows the results of evaluating various combinations of biochar (BC) and sludge ash (SA) after exposure to a diluted 5% sulfuric acid solution. Measurements of weight change and relative compressive strength were conducted to assess the performance of the mixtures under acidic conditions. The control mix had the weakest resistance to the H2SO4 attack, showing a reduction in compressive after 28 days at 20 °C. According to the literature, gypsum and ettringite are the two main cementitious materials that show potential effects against attack by sulfuric acid [62,63,64]. When calcium hydroxide and the binder gel are attacked over an extended period of time by sulfate ions, gypsum and ettringite are produced. This causes the C-S-H gel to delaminate and degrade, which is made easier by the entry of sulfate ions. The inspection of the materials that were exposed to sulfuric acid is depicted visually in Figure 22, which amply illustrates the degradation of the samples and the detrimental effects of the sulfuric acid attack on their surface. These illustrations clearly show the damage driven on by the interaction of the materials with the corrosive characteristics of sulfuric acid resistance. Figure 23 shows a comparison of the samples’ strength at 28 days compared to when they were tested for acid. Conceptively, the compressive strength of the BC3, BC6 and SA10 concrete mixes increased in strength by 58.8%, 35.2%, and 36.4%, respectively, compared to the control mix. This could have been due to the packing effect of the biochar particles and their capacity to lower permeability, which prevent the entry of sulfate ions into the concrete. However, the addition of more biochar, as demonstrated in the B3 and B6 concrete mixtures, has a distinct effect. In these situations, the higher biochar content causes a decrease in the synthesis of C-S-H compounds, which in turn causes a loss in compressive strength. The B3 and B6 concrete mixes are consequently more susceptible to sulfate-related degradation because of the more pronounced sulfate attack.
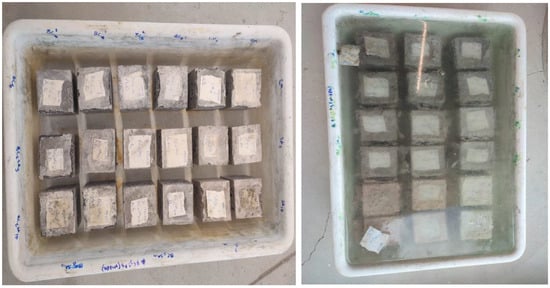
Figure 21.
The samples exposed to sulfuric acid.
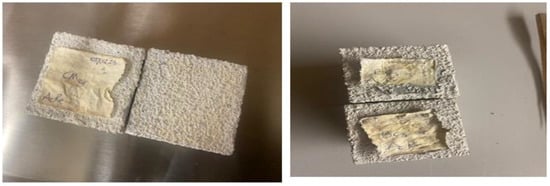
Figure 22.
Surface degradation of all mixtures after sulfuric acid attack.
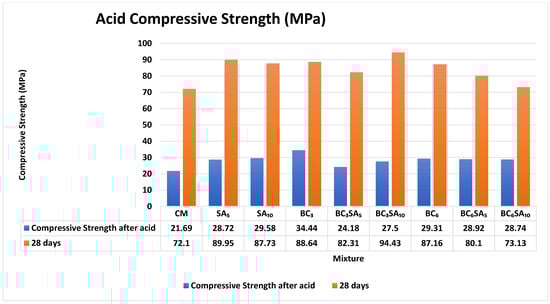
Figure 23.
Acid compressive strength.
In Table 6, the weight losses in mortar due to sulfuric acid are displayed in comparison to the samples’ weight before testing. The samples lost significant weight, with BC6 having the lowest loss of 4.05% and BC3SA5 having the highest loss of 9.79%.
Table 6.
Effect of biochar and sludge on acid resistance of cement mortar.
3.9. Sustainability Assessment for Biochar and Sewage Sludge Concrete Mixes
There has recently been a strong drive within the construction industry to embrace alternative materials by partially replacing ordinary Portland cement (OPC) with a varied spectrum of mineral admixtures and pozzolanic chemicals. This trend has been gaining traction as more researchers realize that such substitutes may result in significant reductions in the environmental footprint associated with concrete production. The industry hopes to solve the environmental problems associated with cement manufacturing by including mineral admixtures and pozzolanic materials into concrete mixes. These alternative materials frequently have positive features that improve the performance and sustainability of concrete, while also lowering the demand for tremendous quantities of cement, which contribute significantly to greenhouse gas emissions.
In recent times, there has been a substantial growth in the production of sludge, stemming from various sectors. This includes not only municipal operations but also industrial processes that generate sludge, as well as the cement and building materials industries. As a result, the co-processing of sludge in cement kilns has become an industry-wide strategy to reduce carbon emissions. The major approach for this sector’s synergistic co-reduction consists of two key components.
- i.
- Firstly, improved allocation and optimization are being focused on in order to manufacture materials that imitate raw materials and replace cement raw materials with sludge [65].
- ii.
- In several works of research, the use of sewage sludge in place of cement as a raw material in the manufacturing of concrete has been investigated, with favorable outcomes for the environment and the economy at large. When 10% sewage sludge was used as a cement substitute, Nakic [66] discovered that the total global warming potential (GWP) decreased by around 9%, resulting in a reduction of 184.00 kg CO2 in 1 m3 of experimental concrete. Between 5% and 11% reduction in the potential environmental impacts was also seen, according to the assessment of the environment impact.
The core idea behind utilizing biochar lies in the principles of a circular bio-economy, aiming to offer a viable solution for efficient resource management. In the pyrolysis process of organic materials, larger particles undergo decomposition, leading to the formation of smaller molecules. These resulting molecules are then released from the process in the form of gases, condensable fumes (oils), and solid residue. A reduction in cement usage and the supplementary factor of substance production are two positive impacts of integrating biochar. The factor of substance creation accounts for approximately 50% of the greenhouse gas emissions from cement manufacture, and the inclusion of BC helps mitigate this adverse effect [67]. According to Gupta et al., the work in [62] used varied mass percentages of waste BC as a substitute for cement to construct BC single-bond CCMs with the goals of environmental improvement and sustainable waste utilization.
This trend toward eco-friendly cement substitutes shows a rising commitment to more sustainable means of construction. As academics and industry experts continue to investigate and create new materials, the construction industry arrives closer to meeting its aims of avoiding adverse environmental impacts and developing a greener future.
4. Conclusions
This study delved into the potential of specimens containing biochar and sewage sludge ash, and the concrete mixture significantly altered the composite material’s mechanical properties. A set water-to-cement ratio of 0.35 was used to design a total of nine alternative ratios. The investigation objective was to evaluate the modified mortar mix by their mechanical characteristics, workability, and durability. The following are the outcomes of the research findings:
- Increasing sludge concentration reduces flowability but absorbs less water than biochar. Combining sludge with biochar enhances workability over biochar alone. As the sludge proportion increased (SA5 to BC6SA10), all materials showed a lower flow (21.76% to 37.82%) compared to the control mix. BC3SA5 had the highest flow rate among the binary blends. After the control mix, SA10 had the highest flow rate compared to the other mixes. The lower flowability in the mixes was caused by the increased surface area of the components, which resulted in water absorption by SA and BC, limiting flowability.
- The strength by compression of mixes comprising SA and BC at various dosages. All combinations had high strength at 28 days in comparison to the baseline mixture, while those constituting 5% and 10% of SA showed increases of 19.52 and 13.78% at 7 days, and 24.76% and 21.68% at 28 days.
- The addition of sludge ash and biochar enhanced the strength development of the mortar due to their pozzolanic properties. Sludge ash reacts with calcium hydroxide in the presence of water, forming new cementitious compounds. This pozzolanic process led to the creation of stronger and more effective binding materials within the mortar. At both 7 days (100.1%, 102%, and 106%) and 28 days (123%, 114%, and 131%), the BC3, BC3SA5, and BC3SA10 mixtures, incorporating biochar and sludge ash, showed varying strength activity index (SAI) values. BC3 and BC3SA5 exhibited slightly higher SAI values, indicating improved strength development compared to the control mix. Notably, BC3SA10 demonstrated a significantly higher SAI, suggesting even greater strength development.
- Among the binary blends, the BC3SA5 mix showed a mere 3% drop in strength, while the BC3SA10, BC6SA5, and BC6SA10 mixes showed more substantial declines of 37%, 42%, and 28%, respectively, when compared to the control mix. BC3SA5 also had better flexural strength than BC3SA10. This can be ascribed to the higher concentration of sludge ash in the mixture (3% biochar, 10% sludge ash), which increased water consumption and resulted in a weaker, more porous structure. Excess water may have increased the porosity of the combination, resulting in lower strength and durability. The BC3SA5 mixture had the highest flexural strength of any blend, with only a 3% loss when compared to the control blend.
- In a particular volume, the maximum packing density of cement particles is 2252.79 kg/m3. Cement pastes containing 5%, 10%, and 6% BC with 10% SA showed a strong resemblance to the control mix. The filler effect of the SA particles, which has the capacity to raise the overall density of the mixtures, was responsible for this proximity.
- The water absorption values of the binary blend samples made up of BC6SA5 and BC6SA10 increased by 2.84% and 2.24%, respectively. This can be explained by the impact of these binary mixes, and several factors can be attributed to the increased water absorption. Biochar is noted for its very porous nature, which allows it to form additional water absorption channels inside the mortar.
- With a pozzolan and water–binder ratio of 0.35, the binary blends with BC6SA10, BC3SA10, BC6SA5, SA10, BC3, SA5, and BC6 showed a considerable decrease in dry shrinkage when compared to the control mix. These decreases were due to the advantageous synergistic interactions between biochar (BC) and sludge ash (SA). This combination improved the stability and decreased volume variations during drying shrinkage, resulting in an improved pore structure and overall shrinkage.
The construction sector’s move toward alternative components, including mineral admixtures, sewage sludge, and biochar, demonstrates its commitment to long-term sustainability and environmentally friendly concrete manufacturing techniques. Accepting these alternatives reflects a commitment to lowering ecological impacts and creating a greener future for the built environment. As research and development proceed, the building industry becomes closer to realizing its objectives of reducing negative environmental effects, paving the path for a more sustainable construction industry.
Author Contributions
Conceptualization, A.P.B.; Methodology, M.A.M., S.B.O. and B.O.R.; Formal analysis, M.A.M.; Investigation, M.A.M.; Data curation, M.A.M.; Writing—original draft, B.O.R., B.O.O., S.B.O. and C.S.A.; Writing—review & editing, S.B.O.; Supervision, M.A.M.; Project administration, M.A.M. All authors have read and agreed to the published version of the manuscript.
Funding
This research received no external funding.
Data Availability Statement
Data is contained within the article.
Conflicts of Interest
The authors declare no conflict of interest.
References
- International Energy Agency (IEA). Global Energy Review 2020; IEA: Paris, France, 2020; Available online: https://www.iea.org/reports/global-energy-review-2020 (accessed on 9 April 2023).
- Zeidabadi, Z.A.; Bakhtiari, S.; Abbaslou, H.; Ghanizadeh, A.R. Synthesis, characterization and evaluation of biochar from agricultural waste biomass for use in building materials. Constr. Build. Mater. 2018, 181, 301–308. [Google Scholar] [CrossRef]
- Peters, G.P.; Andrew, R.M.; Boden, T.; Canadell, J.G.; Ciais, P.; Le Quéré, C.; Marland, G.; Raupach, M.R.; Wilson, C. The challenge to keep global warming below 2 C. Nat. Clim. Chang. 2013, 3, 4–6. [Google Scholar] [CrossRef]
- Eggleston, S.; Buendia, L.; Miwa, K.; Ngara, T.; Tanabe, K. IPCC Guidelines for National Greenhouse Gas Inventories. 2006. Available online: https://www.ipcc-nggip.iges.or.jp/public/2006gl/ (accessed on 12 April 2023).
- Torgal, F.P.; Miraldo, S.; Labrincha, J.; De Brito, J. An overview on concrete carbonation in the context of eco-efficient construction: Evaluation, use of SCMs and/or RAC. Constr. Build. Mater. 2012, 36, 141–150. [Google Scholar] [CrossRef]
- Kumar, S.G.; Aleem, M.A.; Dinesh, S. Application of geopolymer concrete. Int. Res. J. Eng. Technol. 2015, 2, 96–99. [Google Scholar]
- Yang, J.; Yue, L.; Hu, X.; Wang, L.; Zhao, Y.; Lin, Y.; Sun, Y.; DaCosta, H.; Guo, L. Efficient CO2 capture by porous carbons derived from coconut shell. Energy Fuels 2017, 31, 4287–4293. [Google Scholar] [CrossRef]
- Ambedkar, B.; Alex, J.; Dhanalakshmi, J. Enhancement of mechanical properties and durability of the cement concrete by RHA as cement replacement: Experiments and modeling. Constr. Build. Mater. 2017, 148, 167–175. [Google Scholar] [CrossRef]
- Akhtar, A.; Sarmah, A.K. Novel biochar-concrete composites: Manufacturing, characterization and evaluation of the mechanical properties. Sci. Total Environ. 2018, 616, 408–416. [Google Scholar] [CrossRef]
- Imbabi, M.S.; Carrigan, C.; McKenna, S. Trends and developments in green cement and concrete technology. Int. J. Sustain. Built Environ. 2012, 1, 194–216. [Google Scholar] [CrossRef]
- Kumar, A.; Bhattacharya, T.; Shaikh, W.A.; Chakraborty, S.; Sarkar, D.; Biswas, J.K. Biochar Modification Methods for Augmenting Sorption of Contaminants. Curr. Pollut. Rep. 2022, 8, 519–555. [Google Scholar] [CrossRef]
- Di Tommaso, M.; Bordonzotti, I. NOx adsorption, fire resistance and CO2 sequestration of high performance, high durability concrete containing activated carbon. In Book of Abstracts, Proceedings of Second International Conference on Concrete Sustainability (ICCS) 13–15 June, 2016, Madrid, Spain; International Center for Numerical Methods in Engineering (CIMNE): Barcelona, Spain, 2016; p. 192. [Google Scholar]
- Singhal, S. Biochar as a cost-effective and eco-friendly substitute for binder in concrete: A review. Eur. J. Environ. Civ. Eng. 2022, 27, 984–1009. [Google Scholar] [CrossRef]
- Qin, Y.; Pang, X.; Tan, K.; Bao, T. Evaluation of pervious concrete performance with pulverized biochar as cement replacement. Cem. Concr. Compos. 2021, 119, 104022. [Google Scholar] [CrossRef]
- Kwon, E.E.; Lee, T.; Ok, Y.S.; Tsang, D.C.W.; Park, C.; Lee, J. Effects of calcium carbonate on pyrolysis of sewage sludge. Energy 2018, 153, 726–731. [Google Scholar] [CrossRef]
- Lynn, C.; Dhir, J.R.; Ghataora, K.G.; West, R.P. Sewage sludge ash characteristics and potential for use in concrete. Constr. Build. Mater. 2015, 98, 767–779. [Google Scholar] [CrossRef]
- Lu, J.; Zhou, Y.; He, P.; Wang, S.; Shen, P.; Poon, C.S. Sustainable reuse of waste glass and incinerated sewage sludge ash in insulating building products: Functional and durability assessment. J. Clean. Prod. 2019, 236, 117635. [Google Scholar] [CrossRef]
- Liang, C.; Le, X.; Fang, W.; Zhao, J.; Fang, L.; Hou, S. The Utilization of Recycled Sewage Sludge Ash as a Supplementary Cementitious Material in Mortar: A Review. Sustainability 2022, 14, 4432. [Google Scholar] [CrossRef]
- Thongkhong, P.; Suksiripattanapong, C.; Chindaprasirt, P. Utilization of sludge ash as a cement replacement in high-strength mortar: Mechanical properties and durability. Constr. Build. Mater. 2020, 238, 117764. [Google Scholar]
- Krejcirikova, B.; Ottosen, L.M.; Kirkelund, G.M.; Rode, C.; Peuhkuri, R. Characterization of sewage sludge ash and its effect on moisture physics of mortar. J. Build. Eng. 2019, 21, 396–403. [Google Scholar] [CrossRef]
- Dyer, T.D.; Halliday, J.E.; Dhir, R.K. Hydration chemistry of sewage sludge ash used as a cement component. J. Mater. Civil Eng. 2011, 23, 648–655. [Google Scholar] [CrossRef]
- Gupta, S.; Kua, H.W. Factors determining the potential of biochar as a carbon capturing and sequestering construction material: Critical review. J. Mater. Civil Eng. 2017, 29, 04017086. [Google Scholar] [CrossRef]
- ASTM D3174-12; Standard Test Method for Ash in the Analysis Sample of Coal and Coke from Coal. ASTM International: West Conshohocken, PA, USA, 2012.
- ASTM E871-82; Standard Test Method for Moisture Analysis of Particulate Wood Fuels. American Society of Testing Materials: New York, NY, USA, 2006.
- Alayish, O.; Çelik, T. Extending disposal route of dewatered sewage sludge produced from the new wastewater treatment plant in Nicosia toward sustainable building materials. Environ. Earth Sci. 2021, 80, 146. [Google Scholar] [CrossRef]
- ASTM C150/C150M-21; Standard Specification for Portland Cement. ASTM International: West Conshohocken, PA, USA, 2021. [CrossRef]
- ASTM C1602-18; Standard Specification for Mixing Water Used in the Production of Hydraulic Cement Concrete. ASTM International: West Conshohocken, PA, USA, 2018.
- Maljaee, H.; Madadi, R.; Paiva, H.; Tarelho, L.; Ferreira, V.M. Incorporation of biochar in cementitious materials: A roadmap of biochar selection. Constr. Build. Mater. 2021, 283, 122757. [Google Scholar] [CrossRef]
- Standard Practice for Mechanical Mixing of Hydraulic Cement Pastes and Mortar of Plastic Consistency. ASTM C305-20; ASTM International: West Conshohocken, PA, USA, 2020.
- ASTM C1437-15; Standard Test Method for Flow of Hydraulic Cement Mortar, American Society for Testing and Materials. ASTM International: West Conshohocken, PA, USA, 2015.
- ASTM C642-21; Standard Test Method for Density, Absorption, and Voids in Hardened Concrete. ASTM International: West Conshohocken, PA, USA, 2013.
- ASTM C109/C109M-20; Standard Test Method for Compressive Strength of Hydraulic Cement Mortars (Using 2-in. or [50-mm] Cube Specimens). ASTM International: West Conshohocken, PA, USA, 2020.
- ASTM C348-21; Standard Test Method for Flexural Strength of Hydraulic-Cement Mortars. ASTM International: West Conshohocken, PA, USA, May 2021.
- ASTM C567-14; Standard Test Methods for Determination Density of Structural Lightweight Concrete. ASTM International, Annual Book of ASTM Standards, American Society for Testing and Materials: West Conshohocken, PA, USA, 2014.
- EN 1015-3; Methods of Test for Mortar for Masonry—Part 3: Determination of the Consistence of Fresh Mortar (by Flow Table). British Standards Institution: London, UK, 1999.
- ASTM C 596-18; Standard Test Method for Drying Shrinkage of Mortars Containing Hydraulic Cement. ASTM International: West Conshohocken, PA, USA, 2018.
- ASTM E119-20; Standard Test Methods for Fire Tests of Building Construction and Materials. ASTM International: West Conshohocken, PA, USA, 2020.
- Ramachandran, V.S. Concrete Admixtures Handbook: Properties, Science and Technology; William Andrew: Norwich, NY, USA, 1996. [Google Scholar]
- Daniel, D.G. Factors influencing concrete workability. In Significance of Tests and Properties of Concrete and Concrete-Making Materials; ASTM International: West Conshohocken, PA, USA, 2006. [Google Scholar]
- Madani, H.; Bagheri, A. The pozzolanic reactivity of monodispersed nanosilica hydrosols and their influence on the hydration characteristics of Portland cement. Cem. Concr. Res. 2012, 42, 1563–1570. [Google Scholar] [CrossRef]
- Donatello, S. Characteristics of Incinerated Sewage Sludge Ashes: Potential for Phosphate Extraction and Re-Use as a Pozzolanic Material in Construction Products. Doctoral Dissertation, Department of Civil and Environmental Engineering, Imperial College London, London, UK, 2009. [Google Scholar]
- Haustein, E.; Kuryłowicz-Cudowska, A.; Łuczkiewicz, A.; Fudala-Książek, S.; Cieślik, B.M. Influence of Cement Replacement with Sewage Sludge Ash (SSA) on the Heat of Hydration of Cement Mortar. Materials 2022, 15, 1547. [Google Scholar] [CrossRef] [PubMed]
- Nurse, R.W. The effect of phosphate on the constitution and hardening of portland cement. J. Appl. Chem. 1952, 2, 708–716. [Google Scholar] [CrossRef]
- Pan, S.C.; Tseng, D.H.; Lee, C.C.; Lee, C. Influence of the fineness of sewage sludge ash on the mortar properties. Waste Manag. 2003, 33, 1749–1754. [Google Scholar] [CrossRef]
- Danish, A.; Ozbakkaloglu, T. Greener cementitious composites incorporating sewage sludge ash as cement replacement: A review of progress, potentials, and future prospects. J. Clean. Prod. 2022, 371, 133364. [Google Scholar] [CrossRef]
- Lawrence, C.D. 8—Physicochemical and Mechanical Properties of Portland Cements. In Lea’s Chemistry of Cement and Concrete, 4th ed.; Hewlett, P.C., Ed.; Butterworth-Heinemann: Oxford, UK, 1998; pp. 343–419. [Google Scholar] [CrossRef]
- Baeza-Brotons, F.; Garcés, P.; Payá, J.; Saval, J.M. Portland cement systems with addition of sewage sludge ash. Application in concretes for the manufacture of blocks. J. Clean. Prod. 2014, 82, 112–124. [Google Scholar] [CrossRef]
- Vouk, D.; Nakic, D.; Stirmer, N. Reuse of sewage sludge—Problems and Possibilities. In Proceedings of the International Conference IWWATV, Athens, Grecce, 21–23 May 2015. [Google Scholar]
- Choi, W.; Yun, H.; Lee, J.Y. Mechanical properties of mortar containing bio-char from pyrolysis. J. Korea Inst. Struct. Maint. Insp. 2012, 16, 67–74. [Google Scholar]
- Wang, L.; Chen, L.; Poon, C.; Wang, C.H.; Ok, Y.S.; Mechtcherine, Y.; Tsang, D.C. Roles of biochar and CO2 curing in sustainable magnesia cement-based composites. ACS Sustain. Chem. Eng. 2021, 9, 8603–8610. [Google Scholar] [CrossRef]
- Yusuf, R.O.; Moh’d Fadhil, M.D.; Ahmad, H.A. Use of sewage sludge ash (SSA) in the production of cement and concrete—A review. Int. J. Glob. Environ. Issues 2012, 12, 214–228. [Google Scholar] [CrossRef]
- Chen, M.; Blanc, D.; Gautier, M.; Mehu, J.; Gourdon, R. Environmental and technical assessments of the potential utilization of sewage sludge ashes (SSAs) as secondary raw materials in construction. Waste Manag. 2013, 33, 1268–1275. [Google Scholar] [CrossRef]
- ASTM C618-19; Standard Specification for Coal Fly Ash and Raw or Calcined Natural Pozzolan for Use in Concrete. ASTM International: West Conshohocken, PA, USA, August 2022.
- ASTM C311/C311M-18; Historical Standard: Standard Test Methods for Sampling and Testing Fly Ash or Natural Pozzolans for Use in Portland-Cement Concrete. ASTM International: West Conshohocken, PA, USA, 2018.
- Pan, S. Use of sewage sludge ash as fine aggregate and pozzolan in portland cement mortar. J. Solid Waste Technol. Manag. 2002, 28, 121–130. [Google Scholar]
- Li, J.S.; Guo, M.Z.; Xue, Q.; Poon, C.S. Recycling of incinerated sewage sludge ash and cathode ray tube funnel glass in cement mortars. J. Clean. Prod. 2017, 152, 142–149. [Google Scholar] [CrossRef]
- Gupta, S.; Kua, H.W. Effect of water entrainment by pre-soaked biochar particles on strength and permeability of cement mortar. Constr. Build. Mater. 2018, 159, 107–125. [Google Scholar] [CrossRef]
- Selvarajoo, A. Slow pyrolysis of Durio zibethinus rind and the influence of carbonization temperature on biochar properties. In IOP Conference Series: Materials Science and Engineering; IOP Publishing Ltd.: Bristol, UK, 2021; Volume 1092, p. 012042. [Google Scholar] [CrossRef]
- Kua, H.W.; Gupta, S.; Aday, A.N.; Srubar, W.V. Biochar-immobilized bacteria and superabsorbent polymers enable self-healing of fiber-reinforced concrete after multiple damage cycles. Cem. Concr. Comps. 2019, 100, 35–52. [Google Scholar] [CrossRef]
- Tan, K.; Qin, Y.; Wang, J. Evaluation of the properties and carbon sequestration potential of biochar-modified pervious concrete. Constr. Build. Mater. 2022, 314, 125648. [Google Scholar] [CrossRef]
- Li, Y.; Xing, B.; Ding, Y.; Han, X.; Wang, S. A critical review of the production and advanced utilization of biochar via selective pyrolysis of lignocellulosic biomass. Bioresour. Technol. 2020, 312, 123614. [Google Scholar] [CrossRef] [PubMed]
- Gupta, S.; Muthukrishnan, S.; Kua, H.W. Comparing influence of inert biochar and silica rich biochar on cement mortar—Hydration kinetics and durability under chloride and sulfate environment. Constr. Build. Mater. 2021, 268, 121142. [Google Scholar] [CrossRef]
- Zhao, Q.; Lv, T.; Liang, H.; Zhang, J.; Zhang, J. Enhancement of sintered sludge ash-modified cement paste with CaSO4 and CaCl2. Constr. Build. Mater. 2023, 383, 131245. [Google Scholar] [CrossRef]
- Li, C.; Li, J.; Ren, Q.; Zhao, Y.; Jiang, Z. Degradation mechanism of blended cement pastes in sulfate-bearing environments under applied electric fields: Sulfate attack vs. decalcification. Compos. Part B Eng. 2022, 246, 110255. [Google Scholar] [CrossRef]
- Li, Y.; Wang, H.; Zhang, J.; Wang, J.; Ouyang, L. The Industrial Practice of Co-Processing Sewage Sludge in Cement Kiln. Procedia Environ. Sci. 2012, 16, 628–632. [Google Scholar] [CrossRef]
- Nakic, D. Environmental evaluation of concrete with sewage sludge ash based on LCA. Sustain. Prod. Consum. 2018, 16, 193–201. [Google Scholar] [CrossRef]
- Zaman, A.U. Life cycle environmental assessment of municipal solid waste to energy technologies. Glob. J. Environ. Res. 2009, 3, 155–163. [Google Scholar]
Disclaimer/Publisher’s Note: The statements, opinions and data contained in all publications are solely those of the individual author(s) and contributor(s) and not of MDPI and/or the editor(s). MDPI and/or the editor(s) disclaim responsibility for any injury to people or property resulting from any ideas, methods, instructions or products referred to in the content. |
© 2024 by the authors. Licensee MDPI, Basel, Switzerland. This article is an open access article distributed under the terms and conditions of the Creative Commons Attribution (CC BY) license (https://creativecommons.org/licenses/by/4.0/).