
Land Use/Land Cover Changes in a Mediterranean Summer Tourism Destination in Turkey


Abstract
1. Introduction
2. Materials and Methods
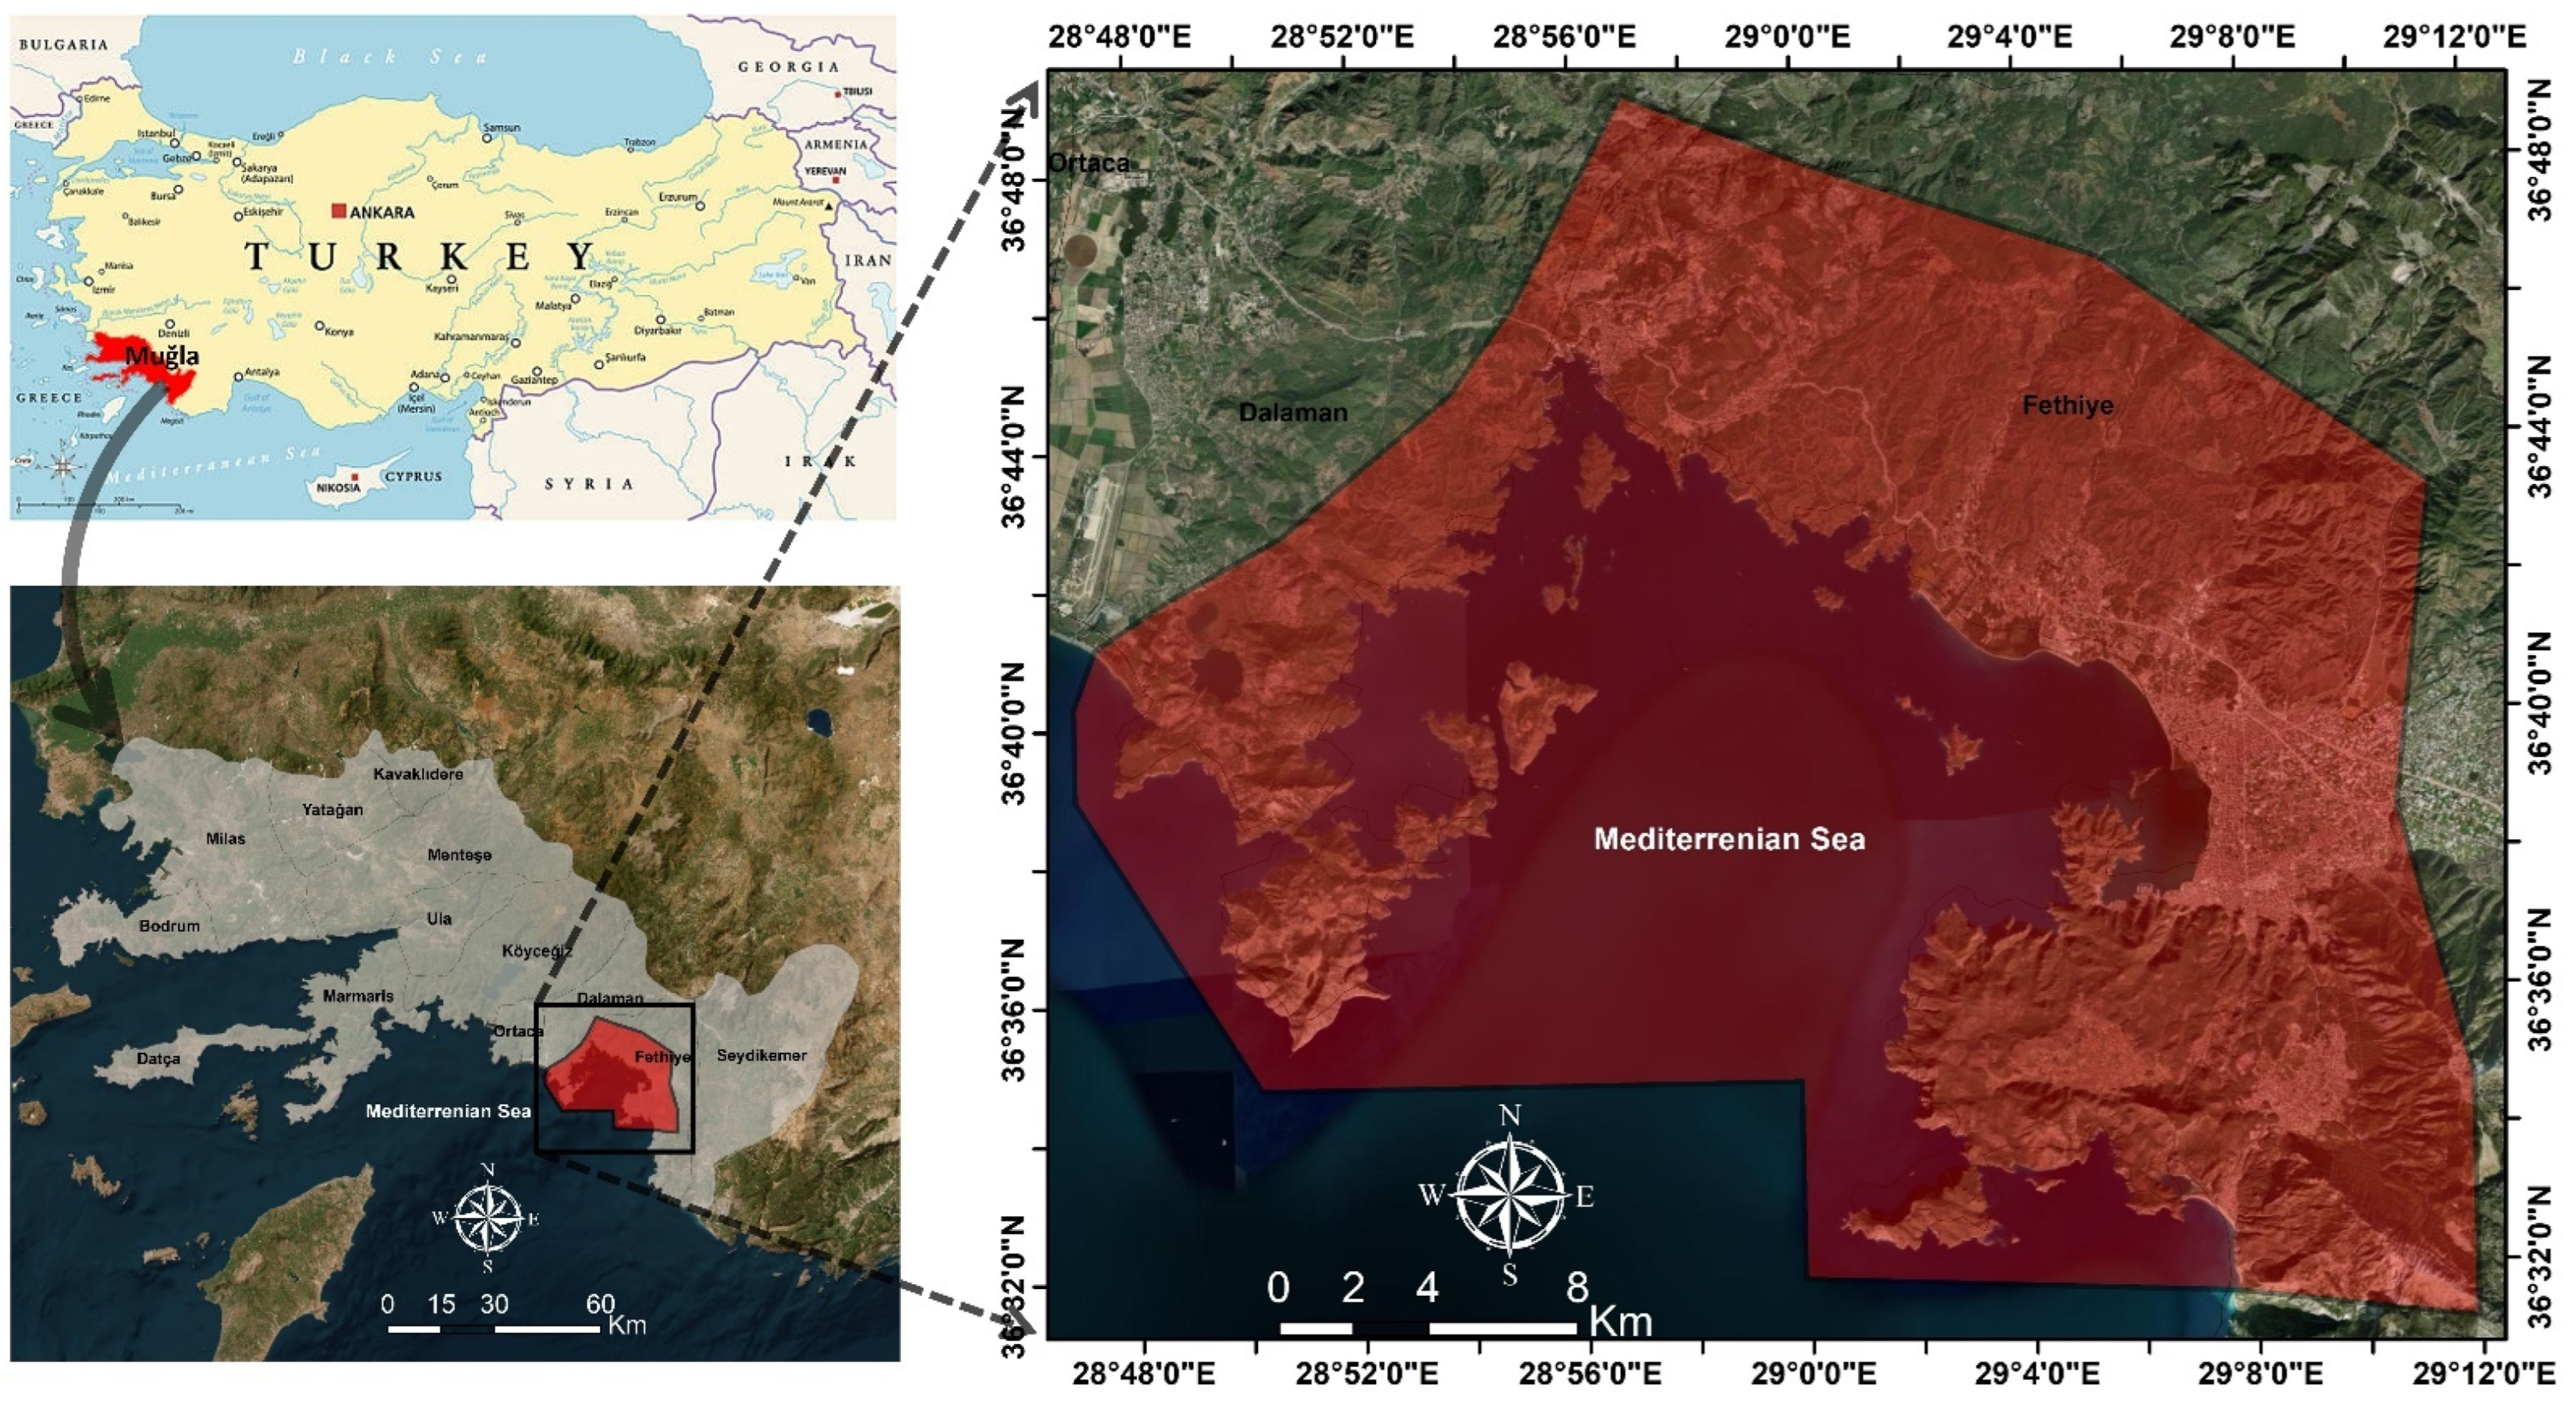
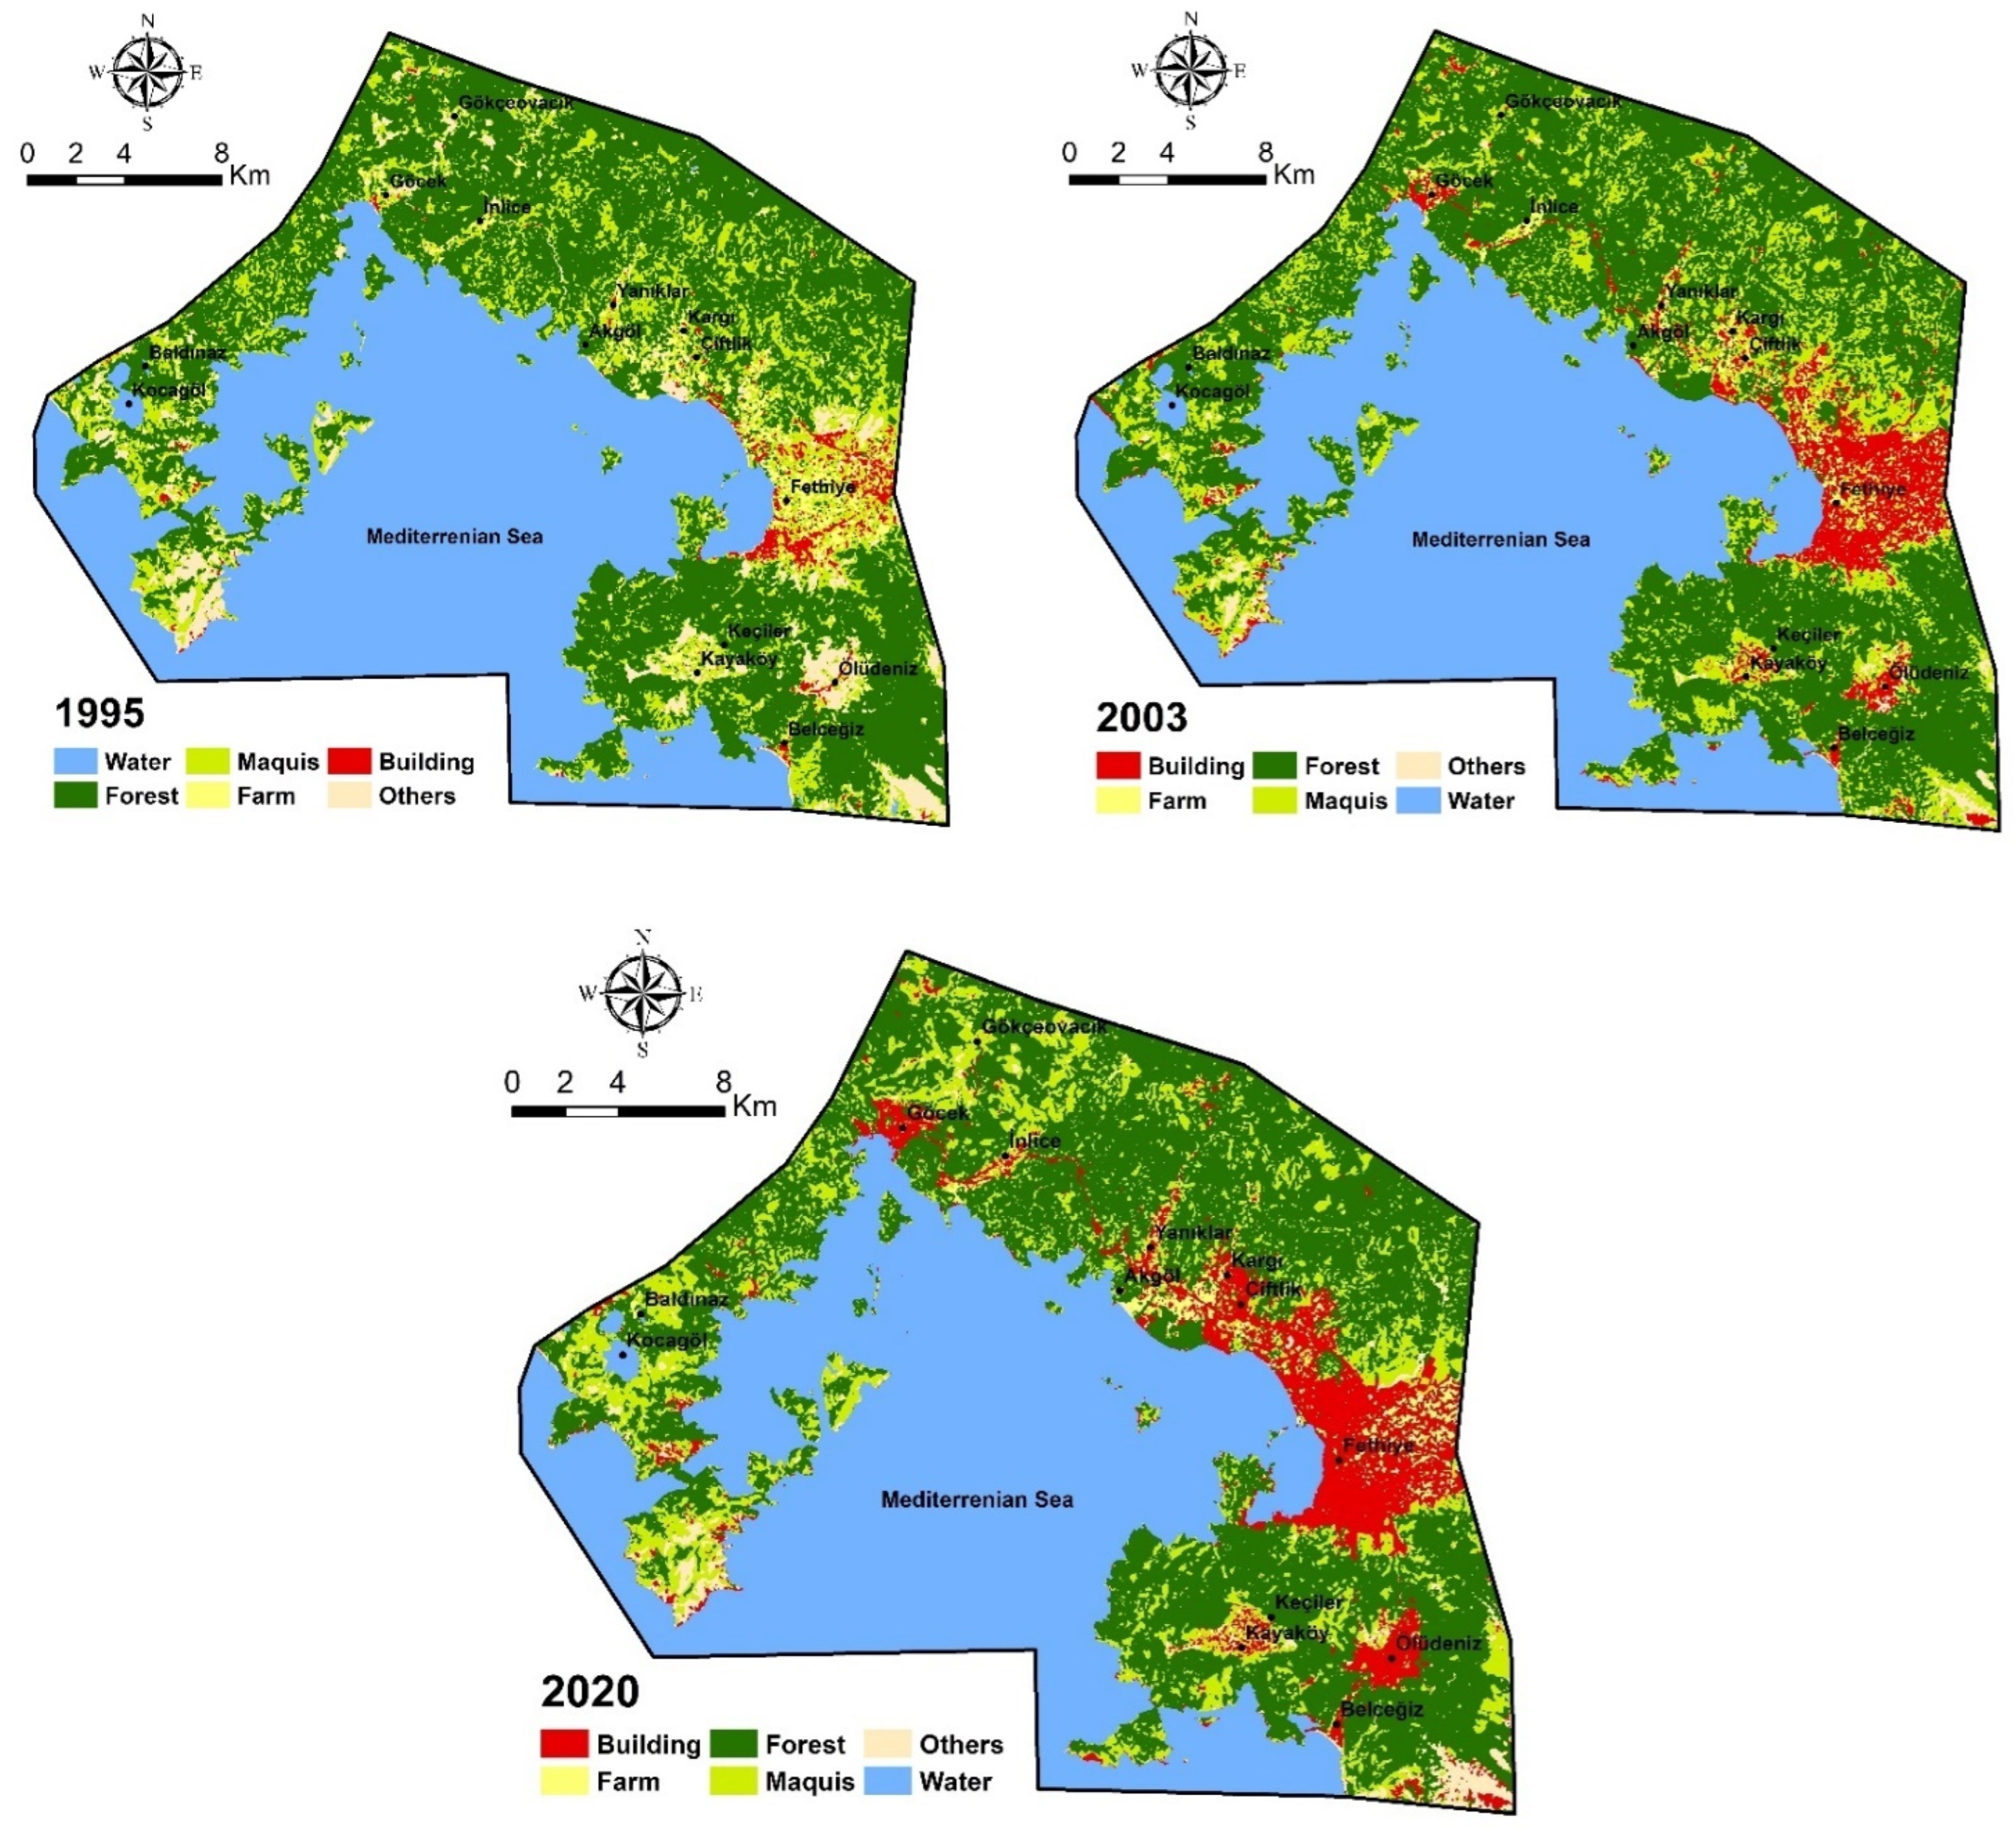
2.1. Study Area
2.2. LULC Retrieval
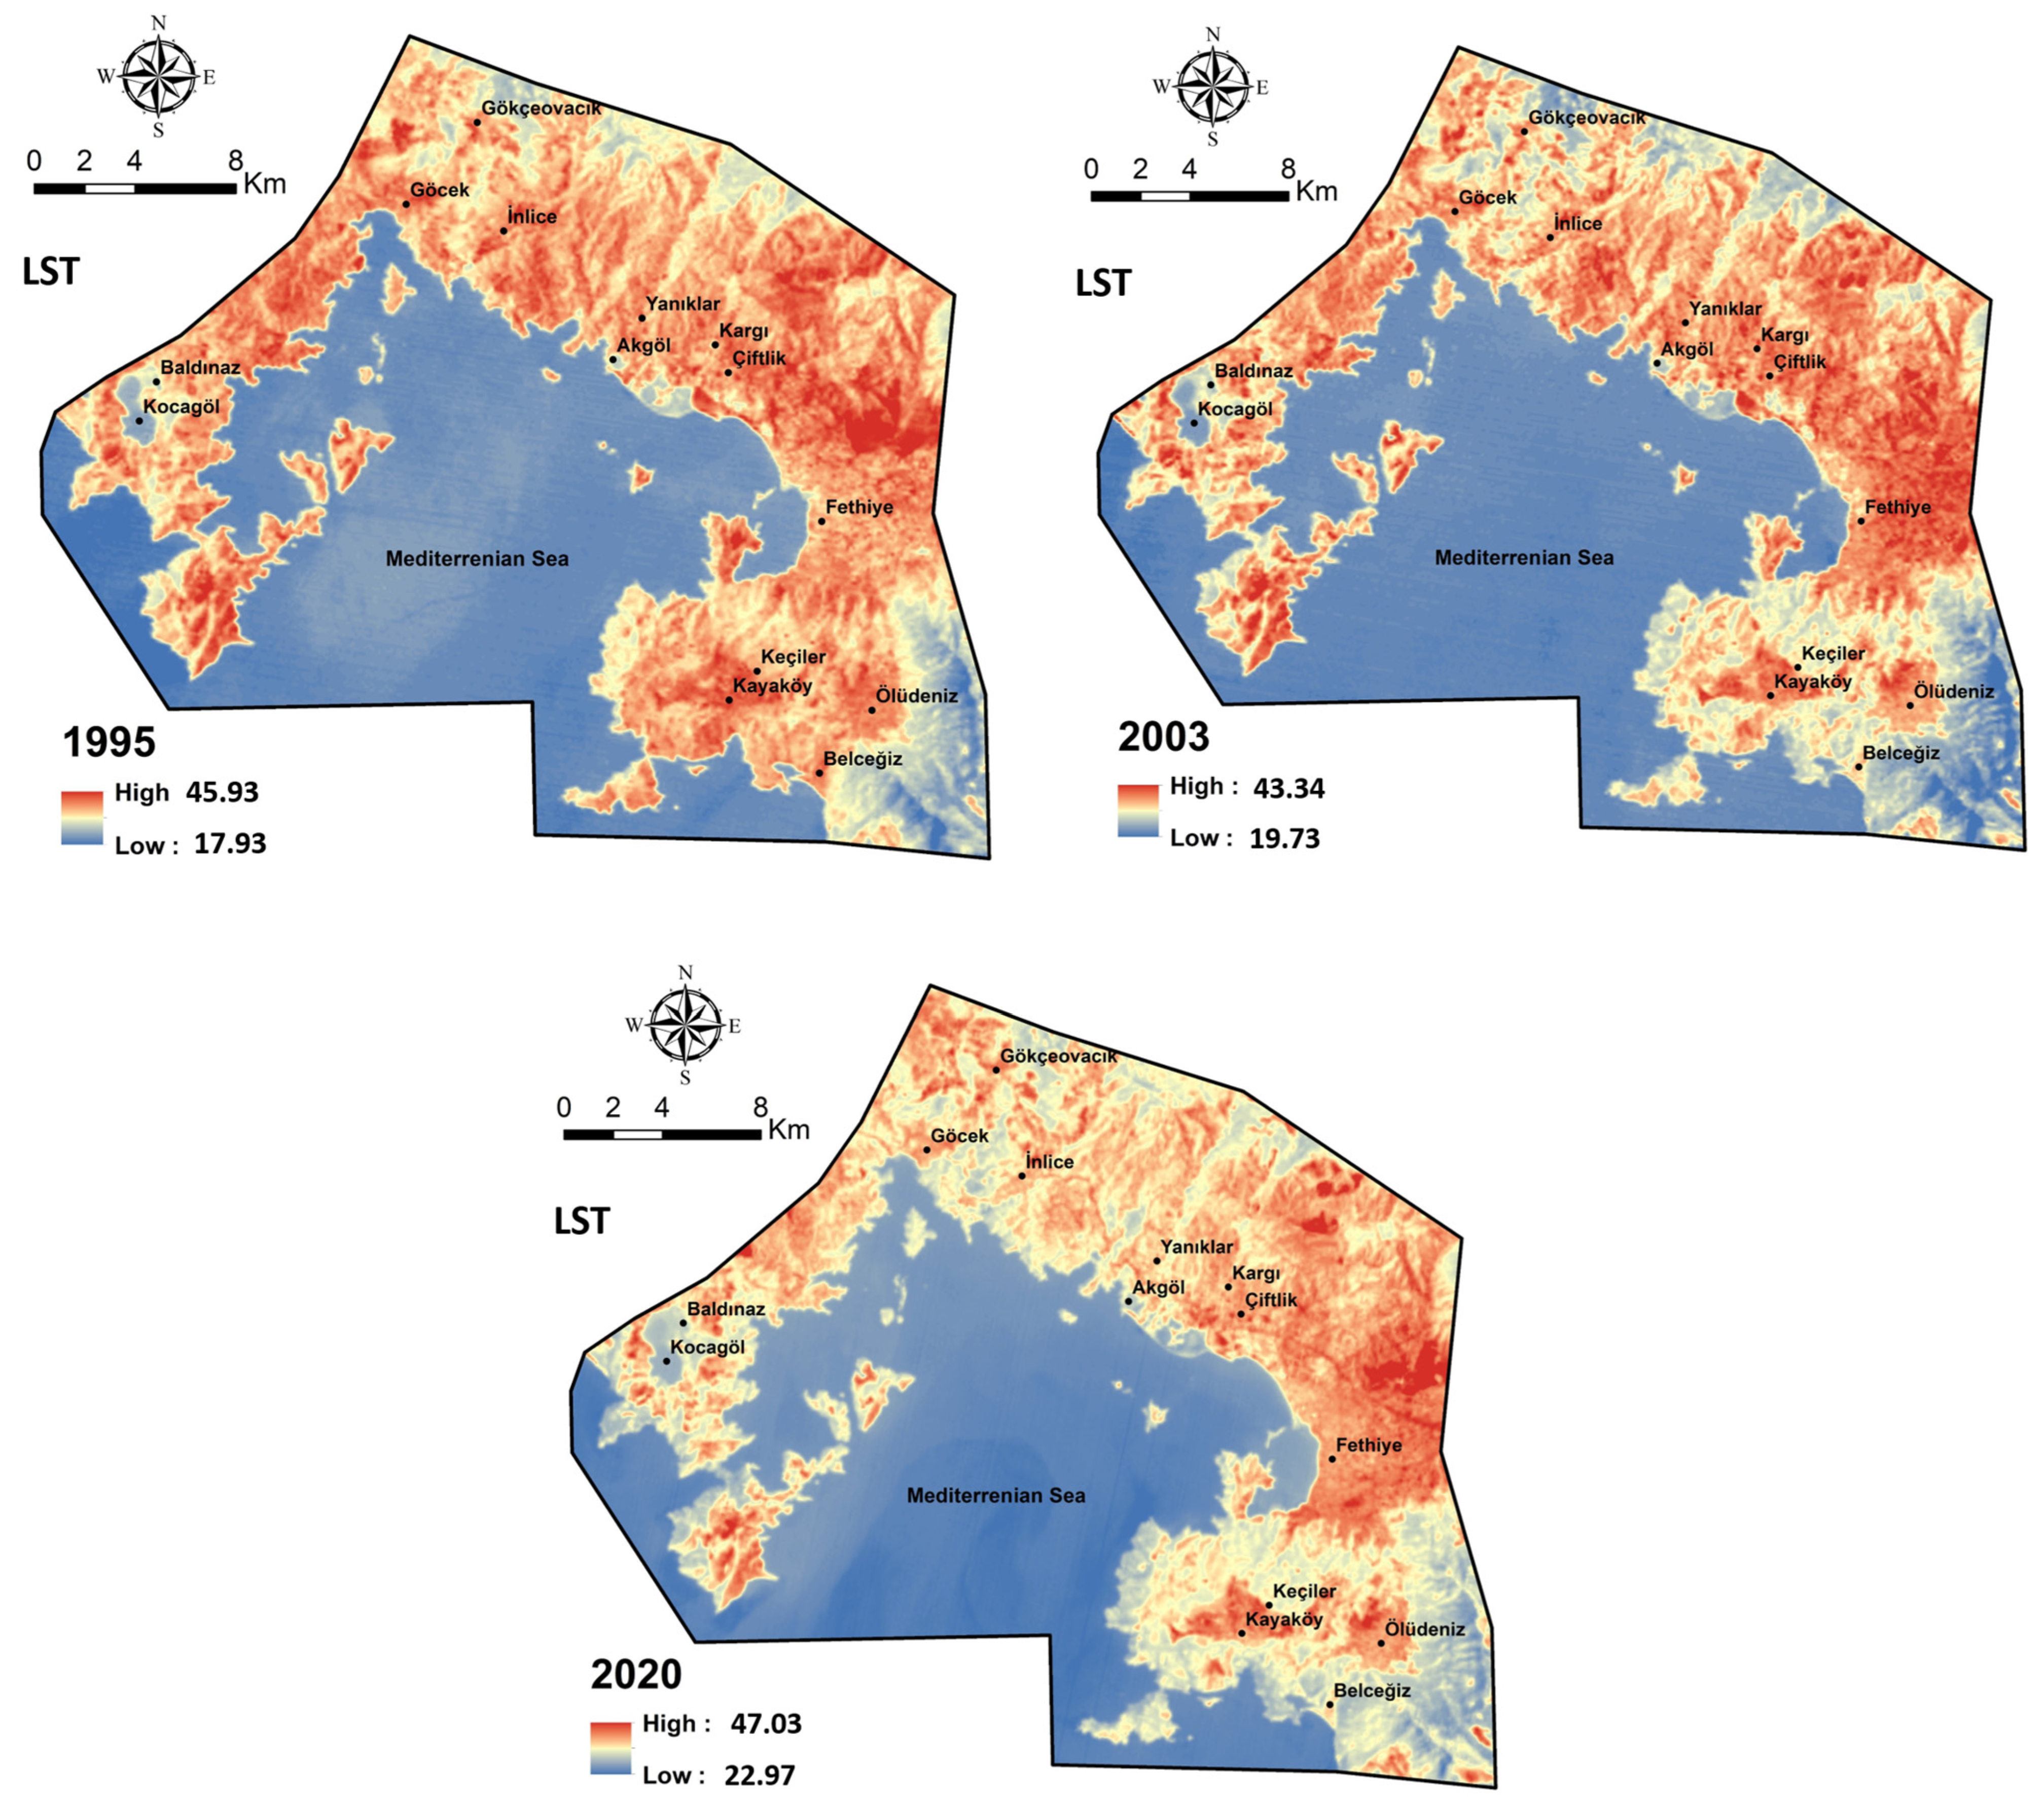
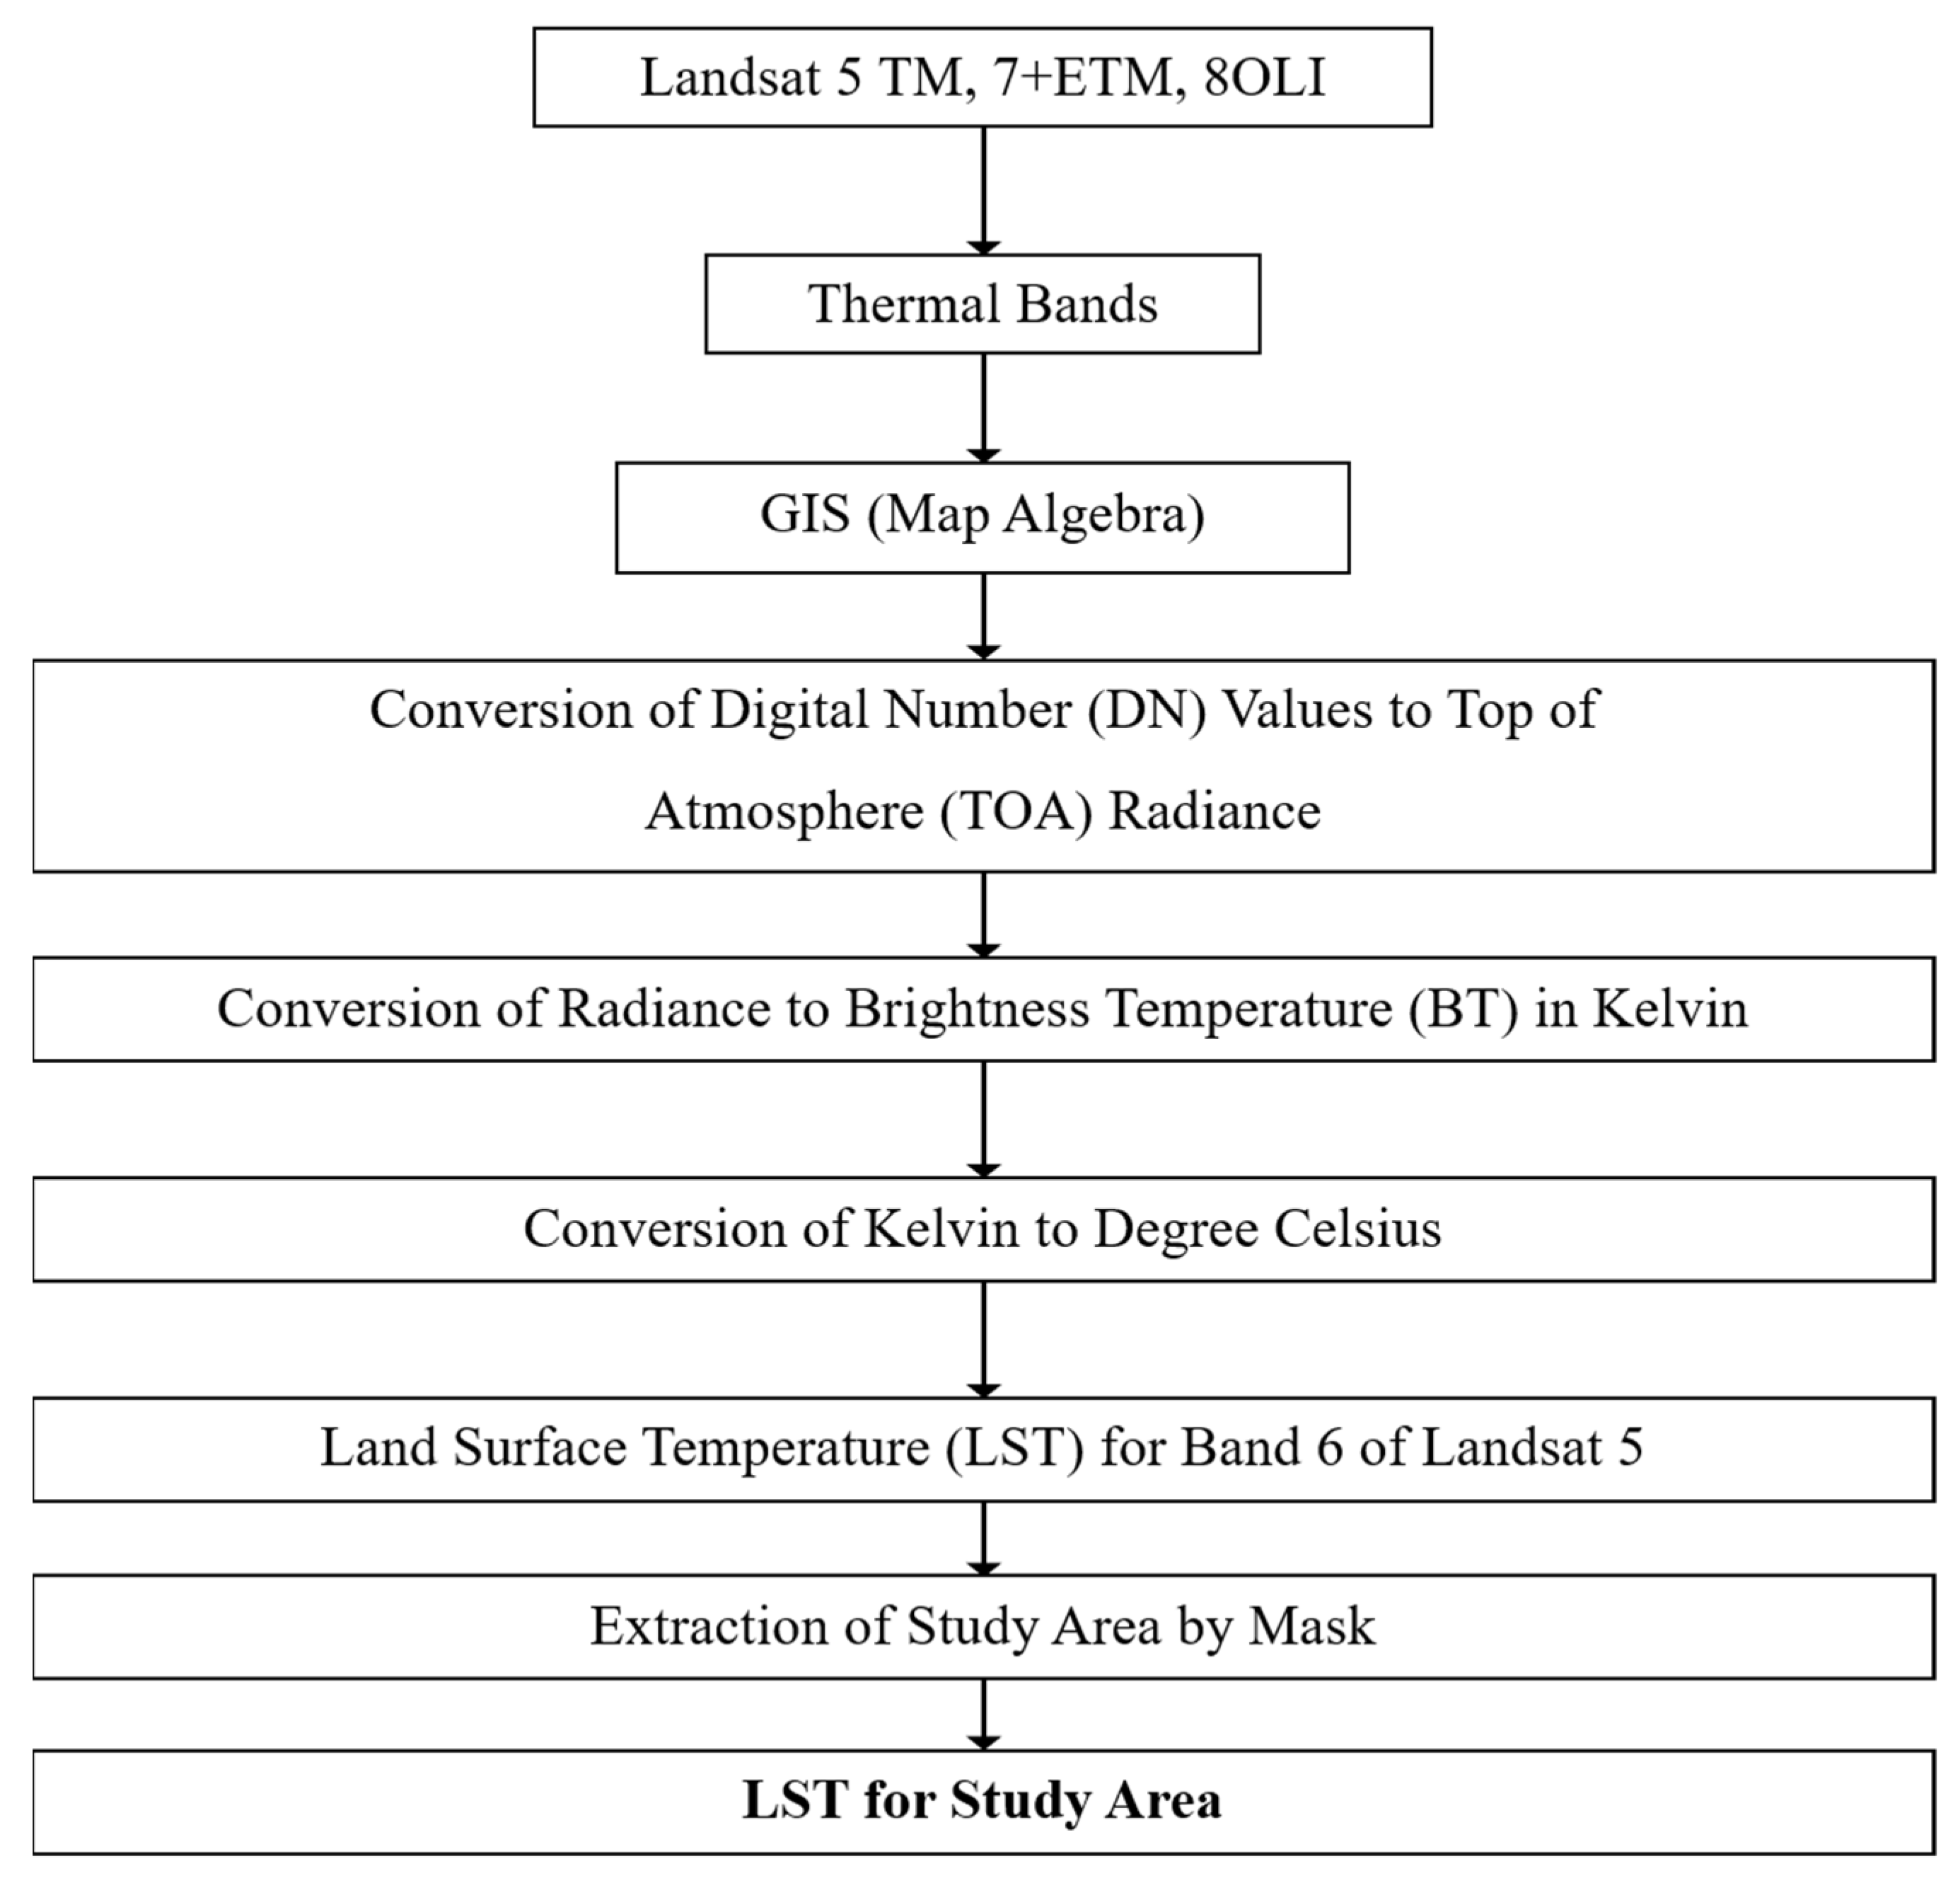
2.3. LST Retrieval
- 1.
- Conversion Digital Number (DN) to TOA Radiance
- 2.
- Convert radiance into Brightness Temperature (BT) (ln Kelvin)
- 3.
- Convert Degree Kelvin into degree Celsius
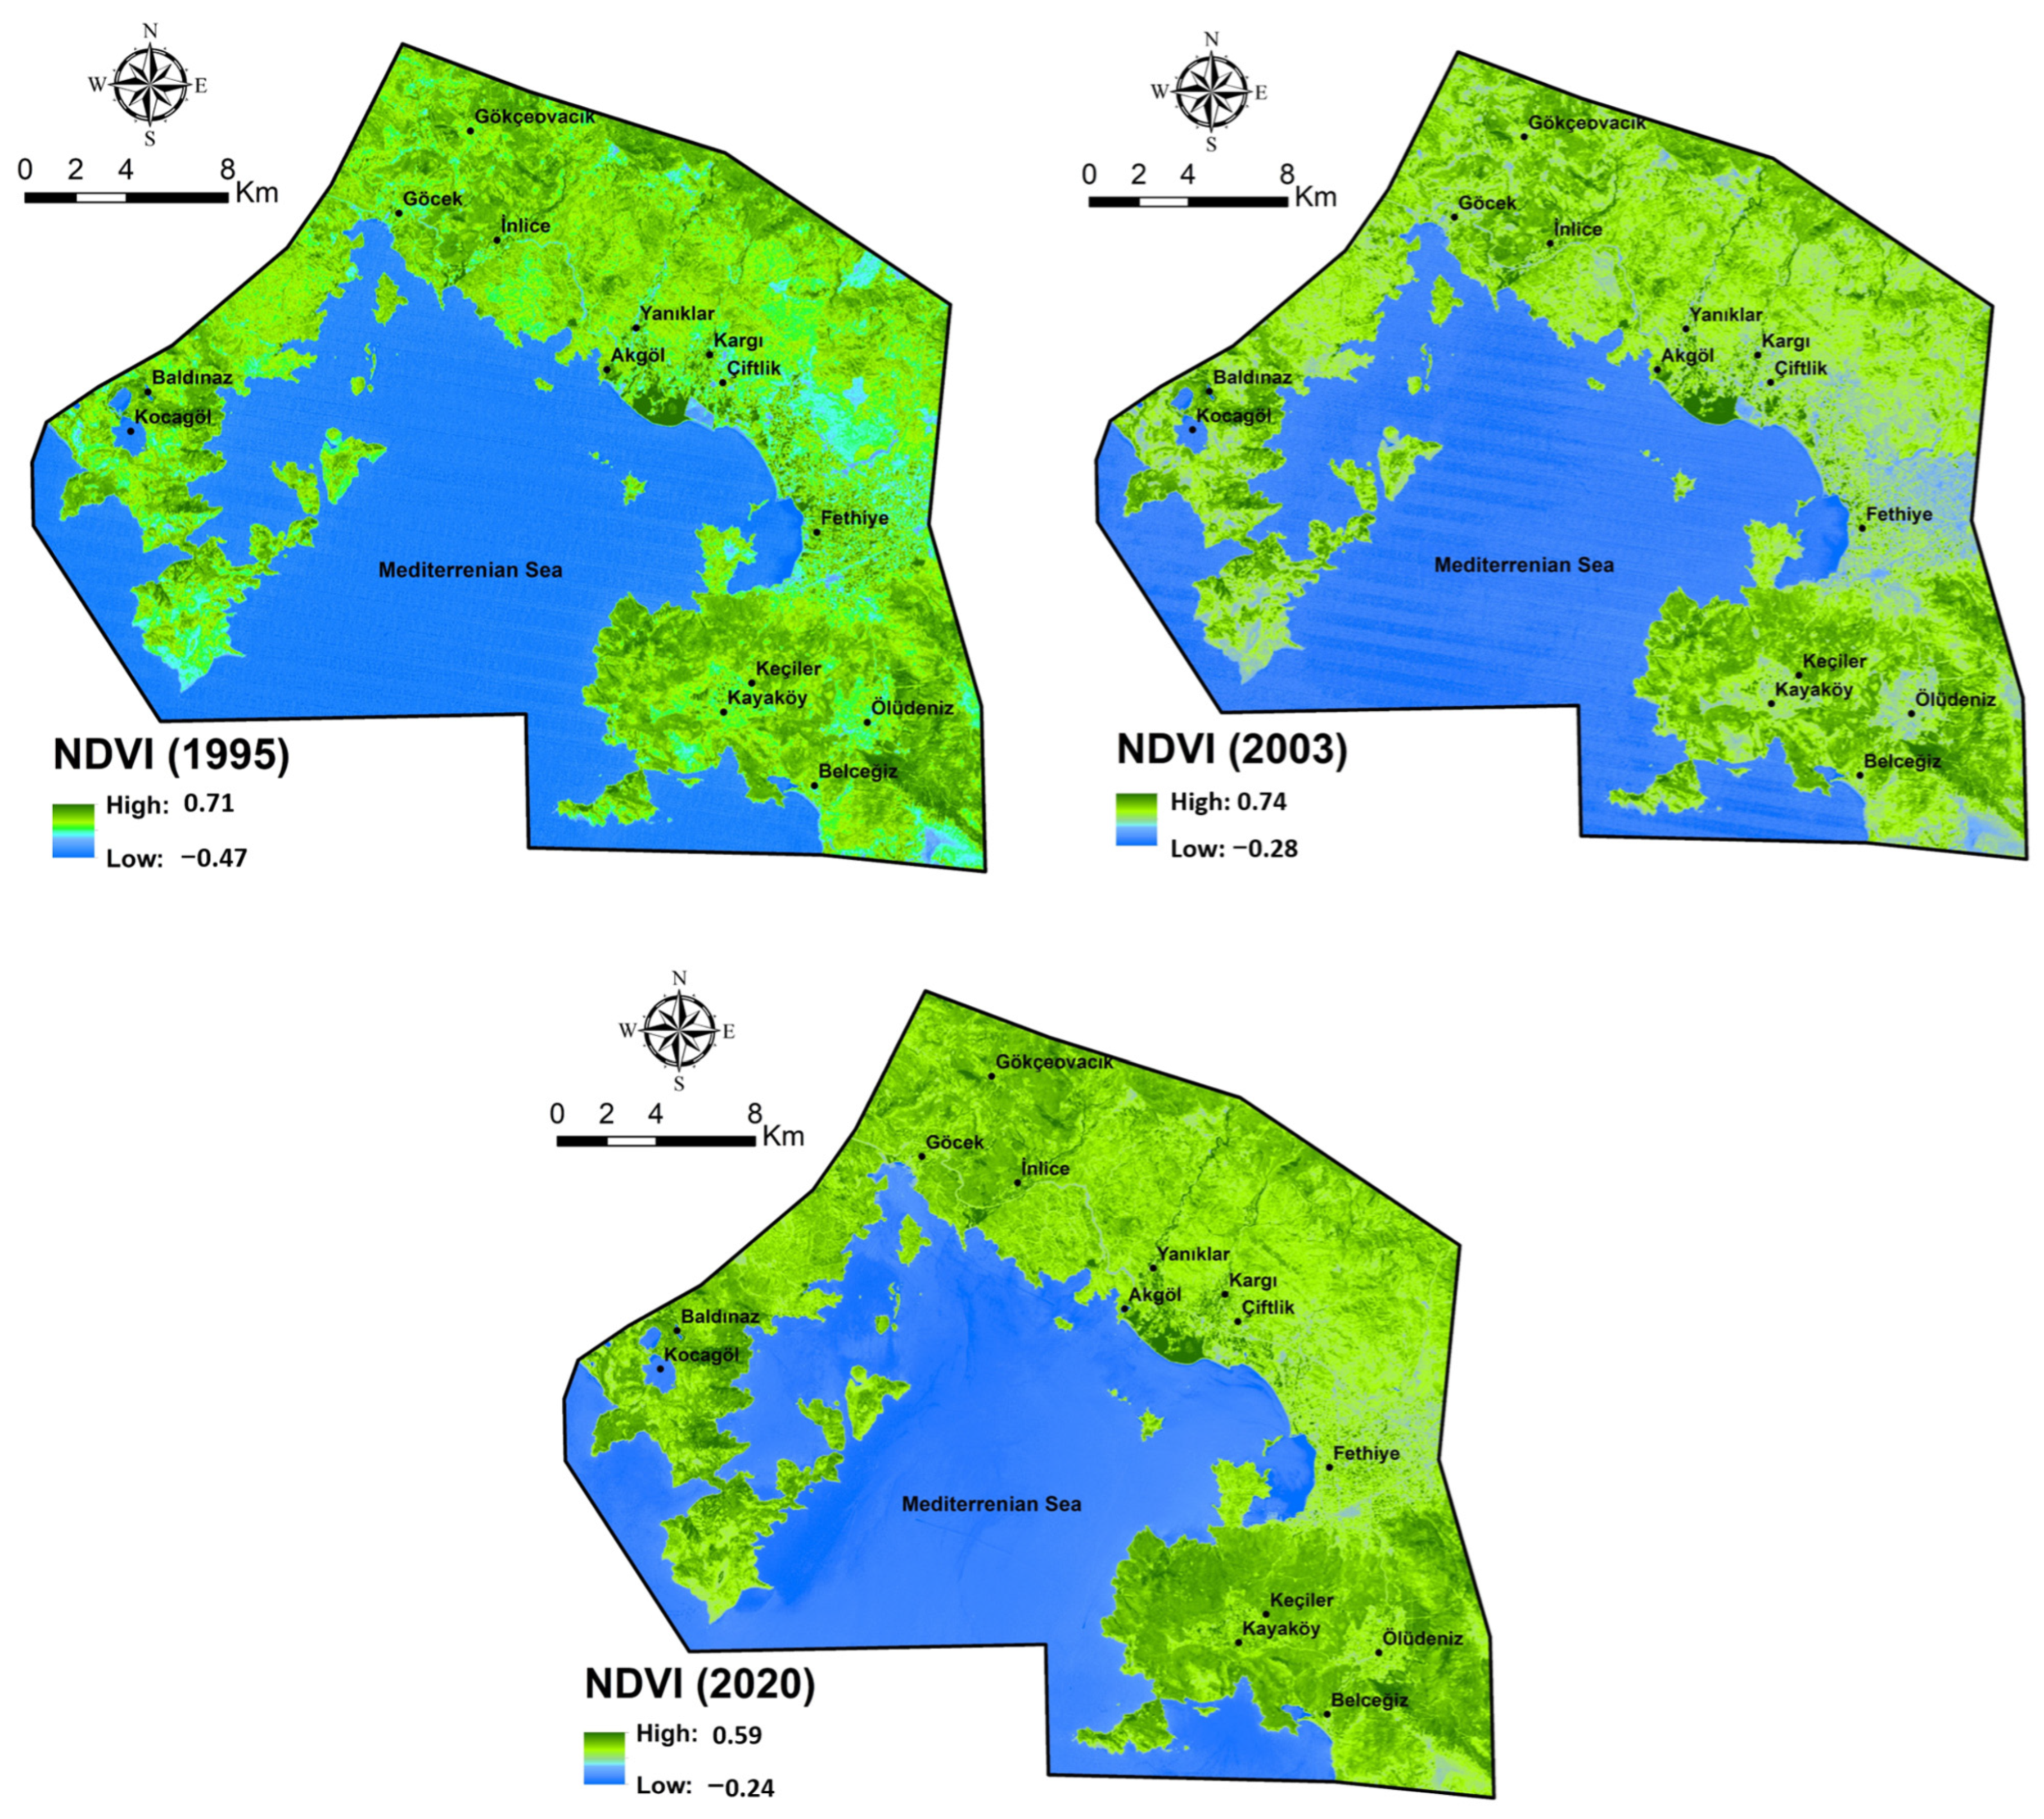
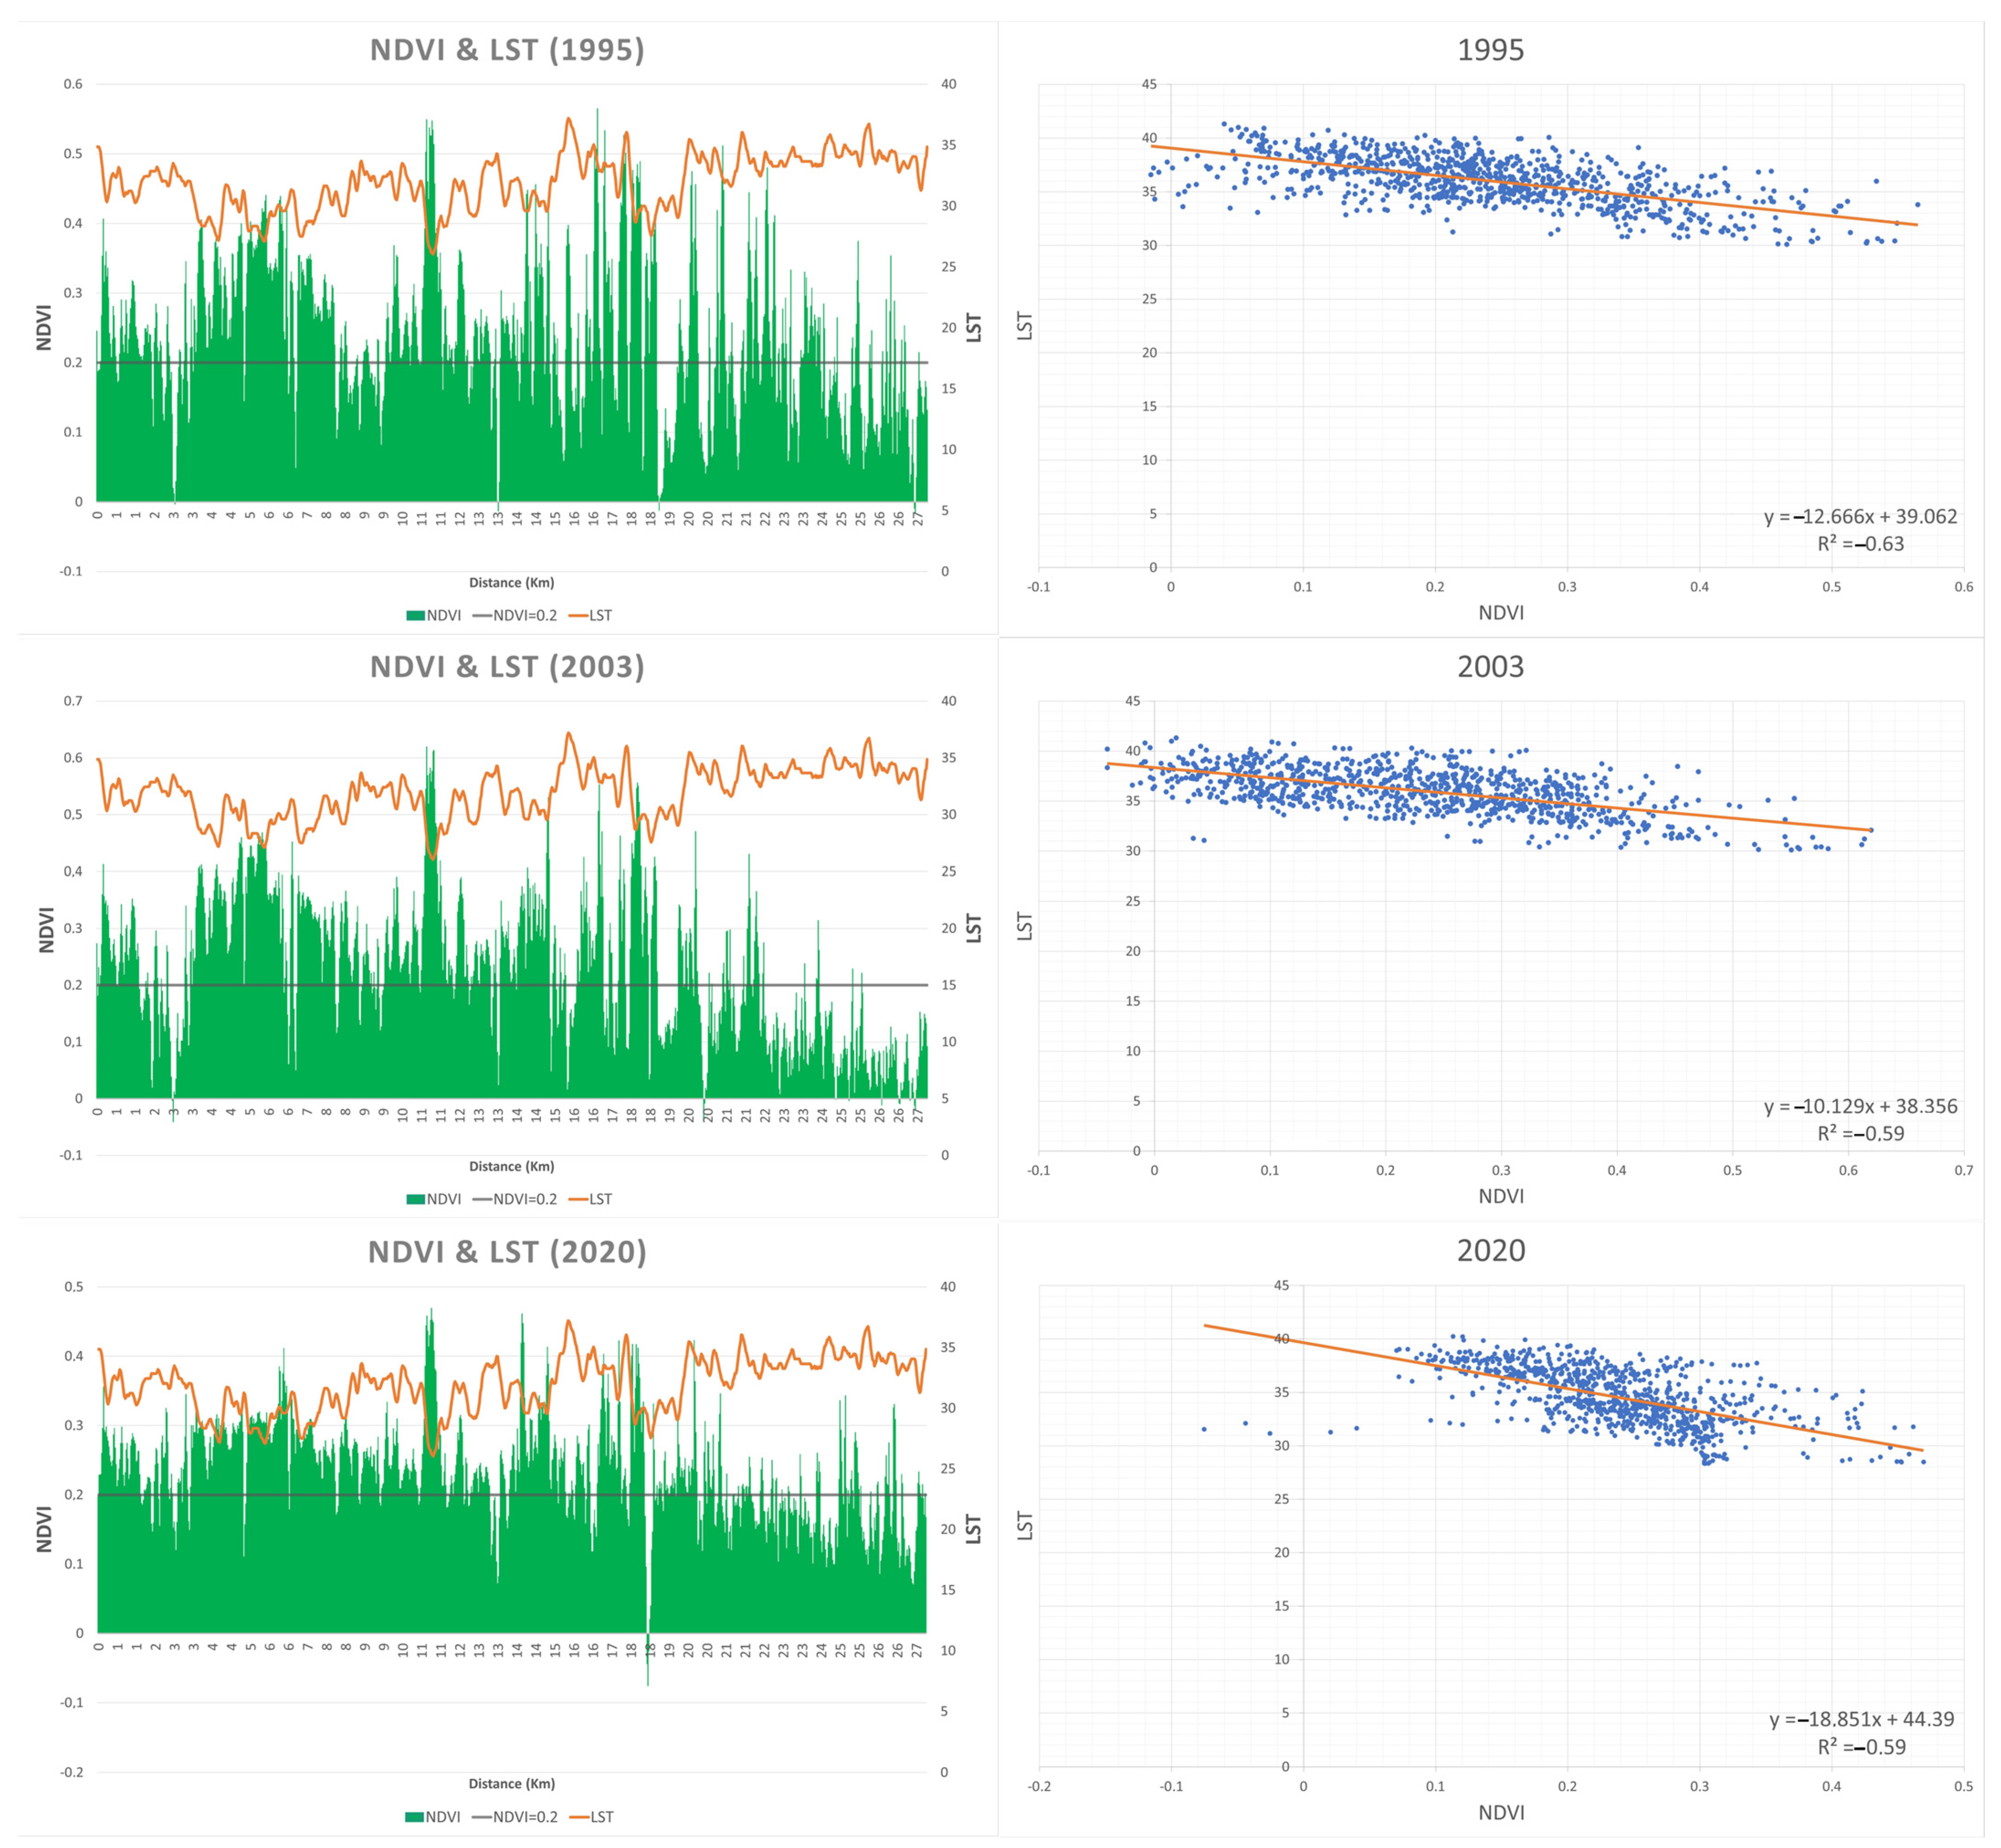
2.4. NDVI Retrieval
3. Results and Discussion
4. Conclusions
Author Contributions
Funding
Institutional Review Board Statement
Informed Consent Statement
Data Availability Statement
Conflicts of Interest
References
- Baede, A.P.M.; Ahlonsou, E.; Ding, Y.; Schimel, D.; Bolin, B.; Pollonais, S.; IPCC. The Climate System: An Overview Co-Ordinating 2018/03/TAR-01. 2018. Available online: https://www.ipcc.ch/site/assets/uploads/2018/03/TAR-01.pdf (accessed on 16 January 2024).
- Nedd, R.; Light, K.; Owens, M.; James, N.; Johnson, E.; Anandhi, A.A. Synthesis of Land Use/Land Cover Studies: Definitions, Classification Systems, Meta-Studies, Challenges and Knowledge Gaps on a Global Landscape. Land 2021, 10, 994. [Google Scholar] [CrossRef]
- IPCC. Climate Change 1994: Radiative Forcing of Climate Change and an Evaluation of the IPCC IS92 Emission Scenarios; Houghton, J.T., Meira Filho, L.G., Bruce, J., Lee, H., Callander, B.A., Haites, E., Harris, N., Maskell, K., Eds.; Cambridge University Press: Cambridge, UK; New York, NY, USA, 1994; 339p. [Google Scholar]
- Li, W.; Bai, Y.; Chen, Q.; Hee, K.; Ji, X. Discrepant impact of land use land cover on urban heat island: A case study of Shangai, China. Ecol. İndic. 2014, 47, 171–178. [Google Scholar] [CrossRef]
- Li, X.; Zhou, W.; Ouyang, Z.; Xu, W.; Zheng, H. Spatial pattern of green space affects land surface temperature: Evidence from the heavily urbanized Beijing metropolitan area China. Landsc. Ecol. 2012, 27, 887–898. [Google Scholar] [CrossRef]
- Alpagun, H.; Doygun, H. Post-classification comparison of land cover using multitemporal Landsat and ASTER imagery: The case of Kahramanmaraş, Turkey. Environ. Monit. Assess. 2009, 151, 327–336. [Google Scholar]
- Azadi, H.; Ho, P.; Hasfiati, L. Agricultural land conversion drivers: Acomparision between less developed, developing and developed countries. Land Degrad. Dev. 2010, 10, 1002–1037. [Google Scholar] [CrossRef]
- Cinar, I. Assessing the correlation between land cover conversion and temporal climate change—A pilot study in coastal Mediterranean city, Fethiye Turkey. Atmosphere 2015, 6, 1102–1118. [Google Scholar] [CrossRef]
- Hong, N.B.; Yabe, M. Improvement in irrigation water use efficiency: A strategy for climate change adaptation and sustainable development of Vietnamese tea production. Environ. Dev. Sustain. 2017, 19, 1247–1263. [Google Scholar] [CrossRef]
- Tan, R.; Beckmann, V.; van den Berg, L.; Qu, F. Governing Farmland conversion: Comparing China with Netherland and Germany. Land Use Policy 2009, 26, 961–974. [Google Scholar] [CrossRef]
- Wang, J.; Liu, Y. Tourism-Led Land-Use Changes and their Environmental Effects in the Southern Coastal Region of Hainan Island, China. J. Coast. Res. 2013, 29, 1118–1125. [Google Scholar] [CrossRef]
- Lin, G.C.S.; Ho, S.P.S. China’s land resources and land-use change: Insights from the 1996 land survey. Land Use Policy 2003, 20, 87–107. [Google Scholar] [CrossRef]
- Lin, G.C.S.; Ho, S.P.S. The state, land system, and land development processes in contemporary China. Ann. Assoc. Am. Geogr. 2005, 95, 411–436. [Google Scholar] [CrossRef]
- Lin, W.; Yu, T.; Chang, X.; Wu, W.; Zhang, Y. Calculating cooling extents of green parks using remote sensing. Landsc. Urban Plan. 2015, 134, 66–75. [Google Scholar] [CrossRef]
- Liu, J.Y.; Zhang, Z.X.; Xu, X.L.; Kuang, W.H.; Zhou, W.C.; Zhang, S.W.; Li, R.D.; Yan, C.Z.; Yu, D.S.; Wu, S.X.; et al. Spatial patterns and driving forces of land use change in China during the early 21st century. J. Geogr. Sci. 2010, 20, 483–494. [Google Scholar] [CrossRef]
- Xu, W. The changing dynamics of land-use change in rural China: A case study of Yuhang, Zhejiang Province. Environ. Plan. A 2004, 36, 1595–1615. [Google Scholar] [CrossRef]
- Liu, Y.S.; Wang, L.J.; Long, H.L. Spatio-temporal analysis of land-use conversion in the eastern coastal China during 1996–2005. J. Geogr. Sci. 2008, 18, 274–282. [Google Scholar] [CrossRef]
- Long, H.; Liu, Y.; Wu, X.; Dong, G. Spatio-temporal dynamic patterns of farmland and rural settlements in Su–Xi–Chang region: Implications for building a new countryside in coastal China. Land Use Policy 2009, 26, 322–333. [Google Scholar] [CrossRef]
- Wu, D.W.; Zhang, X.L.; Mao, H.Y.; Wu, H. Socio-economic driving forces of land-use change in Fuzhou, the southeastern coastal area of China. In Proceedings of the 2008 International Workshop on Earth Observation and Remote Sensing Applications, Beijing, China, 30 June–2 July 2008; pp. 261–271. [Google Scholar]
- World Data. 2023. Available online: https://www.worlddata.info/asia/turkey/tourism.php (accessed on 4 February 2024).
- UNWTO. International Tourism Highlights 2020 Edition. 2020. Available online: https://www.e-unwto.org/doi/epdf/10.18111/9789284422456 (accessed on 4 February 2024).
- Becken, S.; Scott, D. (Eds.) Tourism Panel on Climate Change. Tourism and Climate Change Stocktake. 2023. Available online: https://tpcc.info/ (accessed on 4 February 2024).
- Gossling, S. The consequences of tourism for sustainable water use on a tropical island: Zanzibar, Tanzania. J. Environ. Manag. 2001, 61, 179–191. [Google Scholar] [CrossRef] [PubMed]
- Rico-Amoros, A.M.; Olcina-Cantos, J.; Sauri, D. Tourist land use patterns and water demand: Evidence from the Western Mediterranean. Land Use Policy 2009, 26, 493–501. [Google Scholar] [CrossRef]
- Matei, N.A.; García-León, D.; Dosio, A.; Batista e Silva, F.; Ribeiro Barranco, R.; Císcar Martínez, J.C. Regional Impact of Climate Change on European Tourism Demand; Publications Office of the European Union: Luxembourg, 2023. [Google Scholar]
- Gossling, S. Global environmental consequences of tourism. Glob. Environ. Change—Hum. Policy Dimens. 2002, 12, 283–302. [Google Scholar] [CrossRef]
- Esbah, H.; Kara, B.; Deniz, B.; Kesgin, B. Changing land cover characteristics of a developing coastal town: A case study of Didim, Turkey. J. Coast. Res. 2010, 26, 274–282. [Google Scholar] [CrossRef]
- Kuvan, Y. The use of forests for the purpose of tourism: The case of Belek Tourism Center in Turkey. J. Environ. Manag. 2005, 75, 263–274. [Google Scholar] [CrossRef]
- Atik, M.; Altan, T.; Artar, M. Land Use Changes in Relation to Coastal Tourism Developments in Turkish Mediterranean. Pol. J. Environ. Stud. 2010, 19, 21–33. Available online: http://www.pjoes.com/pdf-88352-22210?filename=Land%20Use%20Changes%20in.pdf (accessed on 4 February 2024).
- İkiel, C.; Ustaoğlu, B.; Dutucu, A.A.; Kılıç, D.E. Determination of land cover change in Datça and Bozburun Peninsula in Turkey (1997–2018). In Proceedings of the 2019 8th International Conference on Agro-Geoinformatics (Agro-Geoinformatics), Istanbul, Turkey, 16–19 July 2019. [Google Scholar]
- Ustaoğlu, B. Land cover change analysis between 1990 and 2021 using Landsat images and object-based classification: A case study in Bodrum peninsula, Aegean Region, Turkey. Ege Coğrafya Derg. 2022, 31, 101–119. [Google Scholar] [CrossRef]
- MGM. Mean Climate Parameters. 2023. Available online: https://www.mgm.gov.tr/veridegerlendirme/il-ve-ilceler-istatistik.aspx?k=A&m=MUGLA (accessed on 21 January 2024).
- Turkish Ministry of Culture and Tourism. Accommodation Statistics Provided by Turkish Ministry of Culture and Tourism. 2023. Available online: https://yigm.ktb.gov.tr/TR-201120/konaklama-istatistikleri.html (accessed on 4 February 2024).
- Sreedhar, Y.; Nagaraju, A.; Murali Krishna, G. An Appraisal of Land Use/Land Cover Change Scenario of Tummalapalle, Cuddapah Region, India—A Remote Sensing and GIS Perspective. Adv. Remote Sens. 2016, 5, 232–245. [Google Scholar] [CrossRef]
- Duhamel, C. Land Use and Land Cover, Including Their Classification. Encylopedia Life Support Syst. 2012, 1, 9. Available online: https://www.eolss.net/Sample-Chapters/C12/E1-05-01-01.pdf (accessed on 4 February 2024).
- Mishra, P.K.; Rai, A.; Rai, S.C. Land use and land cover change detection using Geospatial Techniques in Sikkim Himalaya, India. Egypt. J. Remote Sens. Space Sci. 2020, 23, 133–143. [Google Scholar] [CrossRef]
- Sertel, E.; Musaoglu, N.; Alp, G.; Algan, Y.I.; Kaya, Ş.; Yüksel, B.; Yılmaz, A. 1:25.000 ölçekli ulusal arazi örtüsü/kullanımı sınıflandırma sistemi ile HGK TOPOVT veritabanının karşılaştırılması. Harit. Derg. 2018, 160, 34–46. [Google Scholar]
- Fazal, S. Urban expansion and loss of agricultural land—A GIS based study of Saharanpur City, India. Environ. Urban. 2000, 12, 133–149. [Google Scholar] [CrossRef]
- Lambin, E.F. Modelling and monitoring land-cover change processes in tropical regions. Prog. Phys. Geogr. 1997, 21, 375–393. [Google Scholar] [CrossRef]
- Yavaşlı, D.D.; Masek, J.G.; Franks, S. Muğla İlinde 2000–2010 Yılları Arasındaki Orman Bozunum ve Geri Kazanımının Landsat Görüntüleri İle İzlenmesi. Ege Coğrafya Derg. 2013, 22, 91–106. Available online: https://dergipark.org.tr/en/pub/ecd/issue/4866/66878 (accessed on 21 January 2024).
- Cüceloğlu, G.; Şeker, D.Z.; Tanık, A.; Öztürk, İ. SWAT Modeli Kullanılarak İki Farklı Arazi Kullanım Veri Kümesinin Hidrolojik Simülasyonlar Üzerindeki Etkilerinin İncelenmesi. Uluslararası Çevre Jeoinformatik Derg. 2021, 8, 172–185. [Google Scholar] [CrossRef]
- İkiel, C.; Koç, D. Analysis of The Changes in Vegetation of The Sapanca Lake Basin (in Turkey) Using Multitemporal Satallite Data. Int. J. Hum. Sci. 2015, 12, 1095–1116. [Google Scholar]
- Ren, J.; Yang, J.; Wu, F.; Sun, W.; Xiao, X.; Xia, J.C. Regional thermal environment changes: Integration of satellite data and land use/land cover. iScience 2023, 26, 105820. [Google Scholar] [CrossRef]
- Paramanik, S.; Punia, M. Assessment of green space cooling effects in dense urban landscape: A case study of Delhi, India. Mod. Earth. Syst. Environ. 2018, 5, 867–884. [Google Scholar] [CrossRef]
- Yin, C.; Yuan, M.; Lu, Y.; Huang, Y.; Liu, Y. Effect of urban form on the urban heat island effect based on spatial regression model. Sci. Total Environ. 2018, 634, 696–704. [Google Scholar] [CrossRef] [PubMed]
- Chen, A.; Yao, L.; Sun, R.; Chen, L. How many metrics are required to identify the effects of the landscape pattern on land surface temperature. Ecol. Indic. 2014, 45, 424–433. [Google Scholar] [CrossRef]
- Chen, Y.; Yang, J.; Yu, W.; Ren, J.; Xiao, X.; Xia, J.C. Relationship between urban spatial form and seasonal land surface temperature under different grid scales. Sustain. Cities Soc. 2023, 89, 104374. [Google Scholar] [CrossRef]
- Cinar, İ.; Cicek, İ.; Ardahanlioglu, Z.R.; Karakus, N. Thermal comfort assessment of the urban Mediterranean climate, South-west Anatolia, Turkey. Int. J. Adv. Sci. Eng. Technol. 2013, 4, 3. [Google Scholar]
- Shi, H.; Chen, J. Charesteristic of climate change and its relationship with land use/cover change in Yunna Province, China. Int. J. Clim. 2018, 38, 2520–2537. [Google Scholar] [CrossRef]
- Zhang, J.L.; Pham, T.-T.-H.; Kalacska, M.; Turner, S. Using Landsat Thematic Mapper records to map land cover change and the impacts of reforestation programmes in the borderlands of southeast Yunnan, China: 1990–2010. Int. J. Appl. Earth Obs. Geoinf. 2011, 31, 25–36. [Google Scholar] [CrossRef]
- Dadashpoor, H.; Khaleghinia, A.; Shabrang, A. Explaining the role of land use changes on land surface temperature in an arid and semi-arid metropolitan area with multi-scale spatial regression analysis. Environ. Monit. Assess. 2024, 196, 124. [Google Scholar] [CrossRef] [PubMed]
- Dewan, A.M.; Yamaguchi, Y. Land use and land cover change in Greater Dhaka, Bangladesh: Using remote sensing to promote sustainable urbanization. Appl. Geogr. 2009, 29, 390–401. [Google Scholar] [CrossRef]
- Ma, Y.; Wu, H.P.; Wang, L.Z.; Huang, B.M.; Ranjan, R.; Zomaya, A.; Jie, W. Remote sensing big data computing: Challenges and opportunities. Future Gener. Comp. Syst. 2015, 51, 47–60. [Google Scholar] [CrossRef]
- Zhao, C.; Jensen, J.; Weng, Q.; Weaver, R. A geographically weighted regression analysis of the underlying factors related to the surface Urban Heat Island Phenomenon. Remote Sens. 2018, 10, 1428. [Google Scholar] [CrossRef]
- Ekwe, M.C.; Adamu, F.; Gana, J.; Nwafor, G.C.; Usman, R.; Nom, J.; Onu, D.O.; Adedejı, O.I.; Halilu, S.A.; Aderoju, O.M. The effect of green spaces on the urban thermal enviroment during a hot-dry season: A case stufy of Port Harcourt, Nigeria. Environ. Dev. Sustain. 2020, 23, 10056–10079. [Google Scholar] [CrossRef]
- Qin, Z.-H.; Karnieli, A.; Berliner, P. A mono-window algorithm for retrieving land surface temperature from Landsat TM data and its application to the Israel-Egypt border region. Int. J. Remote Sens. 2001, 22, 3719–3746. [Google Scholar] [CrossRef]
- Weng, Q.; Lu, D.; Schubring, J. Estimation of land surface temperature-vegetation abundance relationship for urban heat island studies. Remote Sens. Environ. 2004, 89, 467–483. [Google Scholar] [CrossRef]
- Oguz, H. LST calculator: A program for retrieving land surface temperature from Landsat TM/ETM+ imagery. Environ. Eng. Manag. J. 2013, 12, 549–555. [Google Scholar] [CrossRef]
- Oguz, H.; Doygun, N.; Kısakürek, S.; Özcalık, M. Calculating surface temperature of Izmir, Turkey. J. Archit. Eng. Fine Arts 2019, 1, 36–46. [Google Scholar]
- Hardwick, S.R.; Ralf, T.; Marion, P.; Eadgar, T.; Reuben, N.; Ewers, R.M. The relationship between the leaf area index and microclimate in tropical forest and oil plant plantation: Forest disturbance drives changes in microclimate. Agric. For. Meteorol. 2015, 201, 187–195. [Google Scholar] [CrossRef]
- Wang, R.; Hou, H.; Derdoni, A. Spatiotemporal Analysis of Land Use/Cover Patterns and Their Relationship with Land Surface Temperature in Nanjing, China. Remote Sens. 2020, 12, 440. [Google Scholar] [CrossRef]
- Turkish Statistics Institution. Population of Province/District Centers and Towns/Villages and Annual Population Growth Rate by Province, 2021, 2022. 2023. Available online: https://data.tuik.gov.tr/Bulten/Index?p=49685 (accessed on 4 February 2024).
- Ardahanlioglu, Z.R. The Evaluation of Changes in the Usage of Area Within Ecological Planning in Fethiye Göcek Special Protection Area. Ph.D. Thesis, Ataturk University, Graduate School of Natural and Applied Sciences, Department of Landscape Architecture, Yakutiye, Türkiye, 2014; 269p. [Google Scholar]
- Lopes, N.D.R.; Li, T.; Zhang, P.; Matomela, N.; Ikhumhen, H.O.; Sá, R.M. Predicting future coastal land use/cover change and associated sea-level impact on habitat quality in the Northwestern Coastline of Guinea-Bissau. J. Environ. Manag. 2023, 327, 116804. [Google Scholar] [CrossRef]
- Şimşek, Ç.K.; Arabacı, D. Simulation of the climatic changes around the coastal land reclamation areas using artificial neural networks. Urban Clim. 2021, 38, 100914. [Google Scholar] [CrossRef]
- Çolak, E.; Sunar, F. Evaluation of forest fire risk in the Mediterranean Turkish forests: A case study of Menderes region, Izmir. Int. J. Disaster Risk Reduct. 2020, 45, 101479. [Google Scholar] [CrossRef]
- Feizizadeh, B.; Blaschke, T. Examining urban heat island relations to land use and air pollution: Multiple end member spectral mixture analysis for thermal remote sensing. IEEE J. Sel. Top. Appl. Earth Obs. Remote Sens. 2013, 6, 1749–1756. [Google Scholar] [CrossRef]
- Sarrat, C.; Lemonsu, A.; Masson, V.; Guedalia, D. Impact of urban heat island on regional atmospheric pollution. Atmos. Environ. 2006, 40, 1743–1758. [Google Scholar] [CrossRef]
- Silva, J.S.; da Silva, R.M.; Santos, C.A.G. Spatiotemporal impact of land use/land cover changes on urban heat islands: A case study of Paço do Lumiar, Brazil. Build. Environ. 2018, 136, 279–292. [Google Scholar] [CrossRef]
- Simwanda, M.; Ranagalage, M.; Estoque, R.C.; Murayama, Y. Spatial analysis of surface urban heat Islands in four rapidly growing african cities. Remote Sens. 2019, 11, 1645. [Google Scholar] [CrossRef]
- Singh, P.; Kikon, N.; Verma, P. Impact of land use change and urbanization on urban heat island in Lucknow city, Central India. A remote sensing -based estimate. Sustain. Cities Soc. 2017, 32, 100–114. [Google Scholar] [CrossRef]
- Siqi, J.; Yuhong, W. Efects of land use and land cover pattern on urban temperature variations: A case study in Hong Kong. Urban Clim. 2020, 34, 100693. [Google Scholar] [CrossRef]
- Solecki, W.D.; Rosenzweig, C.; Parshall, L.; Pope, G.; Clark, M.; Cox, J.; Wiencke, M. Mitigation of the heat island effect in urban New Jersey. Glob. Environ. Chang. B Environ. Hazards 2005, 6, 39–49. [Google Scholar] [CrossRef]
- Tran, H.; Uchihama, D.; Ochi, S.; Yasuoka, Y. Assessment with satellite data of the urban heat island effects in Asian mega cities. Int. J. Appl. Earth Obs. Geoinf. 2006, 8, 34–48. [Google Scholar] [CrossRef]
- Weng, Q. A remote sensing-GIS evaluation urban expansion and its impact on surface temperature in the Zhujian Delta, China. Int. J. Remote Sens. 2001, 10, 1999–2014. [Google Scholar]
- Seyam, M.H.; Haque, R.; Rahman, M. Identifying the land use land cover (LULC) changes using remote sensing and GIS approach: A case study at Bhaluka in Mymensingh, Bangladesh. Case Stud. Chem. Environ. Eng. 2023, 7, 100293. [Google Scholar] [CrossRef]
- Wang, H.; Feng, Q.; Ruan, X. Loss or gain: A spatial regression analysis of switching land conversion between agriculture and natural land. In Ecosystems and Environment; Elsevier: Amsterdam, The Netherlands, 2016; pp. 222–234. [Google Scholar]
- Churkina, G.; Running, S.W. Contrasting climatic controls on the estimated productivity of global terrestrial biomas. Ecosystems 1998, 1, 206–215. [Google Scholar] [CrossRef]
- Cohen, P.; Potchter, O.; Matzarakis, A. Daily and seasonal climatic conditions of green urban open spaces in the Mediterranean climate and their impacton human comfort. Build. Environ. 2012, 51, 285–295. [Google Scholar] [CrossRef]
- Hidalgo-García, D.; Arco-Díaz, J. Modeling the Surface Urban Heat Island (SUHI) to study of its relationship with variations in the thermal feld and with the indices of land use in the metropolitan area of Granada (Spain). Sustain. Cities Soc. 2022, 87, 104166. [Google Scholar] [CrossRef]
- Karnieli, A.; Agam, N.; Pinker, R.C.; Anderson, M.; Imhoff, M.; Gutman, G.G.; Panov, N.; Goldberg, A. Use of NDVI and Land Surface Temperature for Drought Assessment: Merits and Limitations. J. Clim. 2009, 23, 618–633. [Google Scholar] [CrossRef]
- Abulibdeh, A. Analysis of urban heat island characteristics and mitigation strategies for eight arid and semi-arid gulf region cities. Environ. Earth Sci. 2021, 80, 259. [Google Scholar] [CrossRef]
- Bokaie, M.; Zarkesh, M.K.; Aresteh, P.D.; Hasseini, A. Assessment of urban heat island based on the relationship between land surface temperature and land use/land cover in Tehran. Sustain. Cities Soc. 2016, 23, 94–104. [Google Scholar] [CrossRef]
- Kaplan, G.; Avdan, U.; Avdan, Z.Y. Urban Heat Island Analysis using Landsat 8 Satellite Data: A Case Study in Skopje, Macedonia; Multidisiplinary Dijital Publishing Institute Proceedings: Basel, Switzerland, 2018; Volume 2, p. 58. [Google Scholar]


| MUGLA Measurement Period (1928–2022) | January | February | March | April | May | June | July | August | September | October | November | December | Annual |
|---|---|---|---|---|---|---|---|---|---|---|---|---|---|
| Mean temperature (°C) | 5.3 | 6.1 | 8.5 | 12.8 | 17.8 | 22.8 | 26.4 | 26.3 | 21.9 | 16.2 | 10.8 | 7.0 | 15.2 |
| Mean maximum temperature (°C) | 9.8 | 11.0 | 14.1 | 18.9 | 24.3 | 29.6 | 33.4 | 33.6 | 29.3 | 23.1 | 16.7 | 11.5 | 21.3 |
| Mean minimum temperature (°C) | 1.6 | 1.9 | 3.5 | 7.0 | 11.4 | 16.1 | 19.7 | 19.6 | 15.3 | 10.3 | 5.9 | 3.2 | 9.6 |
| Mean sun shine duration (hour) | 3.5 | 4.4 | 5.7 | 7.3 | 8.7 | 10.5 | 11.4 | 10.9 | 9.5 | 6.8 | 4.7 | 3.3 | 7.2 |
| Mean number of rainy days | 14.95 | 12.32 | 10.47 | 8.61 | 7.37 | 3.72 | 1.52 | 1.41 | 2.62 | 6.32 | 9.67 | 14.53 | 93.5 |
| Monthly total rainfall (mm) | 245.7 | 178.3 | 122.4 | 63.7 | 49.9 | 24.6 | 11.7 | 14.6 | 23.1 | 72.8 | 135.6 | 265.0 | 1207.4 |
| Extreme maximum temperature (°C) | 20.9 | 25.5 | 28.8 | 31.6 | 39.4 | 40.8 | 42.1 | 41.2 | 39.2 | 36.8 | 29.0 | 23.8 | 42.1 |
| Extreme minimum temperature (°C) | −12.6 | −9.9 | −8.5 | −3.6 | 1.0 | 6.7 | 10.5 | 9.0 | 5.6 | 0.1 | −7.0 | −9.0 | −12.6 |
| Years | Fethiye (F) | Muğla (M) | Turkey (T) | F/M (%) | M/T (%) | F/T (%) |
|---|---|---|---|---|---|---|
| 2015 | 1.4 | 5.5 | 67.9 | 26.3 | 8.1 | 2.1 |
| 2016 | 0.9 | 4.6 | 59.4 | 19.9 | 7.8 | 1.6 |
| 2017 | 0.3 | 3.1 | 61.9 | 8.3 | 5.0 | 0.4 |
| 2018 | 0.4 | 3.9 | 71.9 | 9.5 | 5.5 | 0.5 |
| 2019 | 0.4 | 4.5 | 80.9 | 8.4 | 5.6 | 0.5 |
| 2020 | 0.3 | 2.3 | 41.9 | 11.7 | 5.5 | 0.6 |
| LULC Types | Changes for the Years (ha) | Changes for the Periods (ha) | Trend | ||||
|---|---|---|---|---|---|---|---|
| 1995 | 2003 | 2020 | 1995–2003 | 2003–2020 | 1995–2020 | ||
| Water (Sea, lake, river wetland) | 34,561 | 34,230 | 34,224 | 331 | 6 | 337 | Decrease |
| Forest (Coniferous, broad leaved) | 27,895 | 27,566 | 27,181 | 329 | 385 | 714 | Decrease |
| Maquis | 12,289 | 12,982 | 11,927 | −693 | 1055 | 362 | Decrease |
| Farm (Planted, greenhouses) | 1840 | 1511 | 930 | 329 | 581 | 910 | Decrease |
| Building (Urban fabric) | 1159 | 4078 | 5834 | −2919 | −1756 | −4675 | Increase |
| Others (Bare lands, coastal sands | 3858 | 1235 | 1506 | 2623 | −271 | 2352 | Decrease |
Disclaimer/Publisher’s Note: The statements, opinions and data contained in all publications are solely those of the individual author(s) and contributor(s) and not of MDPI and/or the editor(s). MDPI and/or the editor(s) disclaim responsibility for any injury to people or property resulting from any ideas, methods, instructions or products referred to in the content. |
© 2024 by the authors. Licensee MDPI, Basel, Switzerland. This article is an open access article distributed under the terms and conditions of the Creative Commons Attribution (CC BY) license (https://creativecommons.org/licenses/by/4.0/).
Share and Cite
Cinar, I.; Ardahanlıoğlu, Z.R.; Toy, S. Land Use/Land Cover Changes in a Mediterranean Summer Tourism Destination in Turkey. Sustainability 2024, 16, 1480. https://doi.org/10.3390/su16041480
Cinar I, Ardahanlıoğlu ZR, Toy S. Land Use/Land Cover Changes in a Mediterranean Summer Tourism Destination in Turkey. Sustainability. 2024; 16(4):1480. https://doi.org/10.3390/su16041480
Chicago/Turabian StyleCinar, Ismail, Zeynep R. Ardahanlıoğlu, and Süleyman Toy. 2024. "Land Use/Land Cover Changes in a Mediterranean Summer Tourism Destination in Turkey" Sustainability 16, no. 4: 1480. https://doi.org/10.3390/su16041480
APA StyleCinar, I., Ardahanlıoğlu, Z. R., & Toy, S. (2024). Land Use/Land Cover Changes in a Mediterranean Summer Tourism Destination in Turkey. Sustainability, 16(4), 1480. https://doi.org/10.3390/su16041480