Article

Response Study of Streamflow and Sediment Reduction in the Northeast Region of the Loess Plateau under Changing Environment

1
School of Geographical Science, Shanxi Normal University, Taiyuan 030031, China
2
Department of Resources and Environmental Engineering, Shandong Agricultural and Engineering University, Jinan 250100, China
3
Institute of Geographical Sciences, Hebei Academy of Sciences, Hebei Engineering Research Center for Geographic Information Application, Shijiazhuang 050011, China
*
Author to whom correspondence should be addressed.
Sustainability 2024, 16(4), 1475; https://doi.org/10.3390/su16041475
Submission received: 22 December 2023 / Revised: 30 January 2024 / Accepted: 31 January 2024 / Published: 9 February 2024

Abstract

:
The Sanggan River Basin in the loess hill and gully area is the primary water source for the establishment of the capital water conservation function area and the ecological environment support zone. Against the backdrop of global warming, population growth, and accelerated urbanization, water consumption in the Sanggan River Basin has persistently increased in recent years, leading to a series of issues, such as river pollution, surface streamflow reduction, groundwater over-exploitation, soil erosion, and decreased vegetation coverage. In this research, we employed the DMC approach, SWAT model, InVEST model, and CA-Markov model to quantitatively analyze the correlation between alterations in streamflow and sediment within this area and three influential factors: climate variations, LUCC, and other human interventions. Furthermore, we clarified the relative contributions of climate factor elements, land-use types, and human activities to streamflow and sediment in this region. The findings indicate a decline in the annual streamflow and sediment quantities observed within this region from 1960 to 2020, with reduction rates of 1.27 × 10⁸ m3/10 a and 129.07 × 10⁴ t/10 a, respectively, and an abrupt change year in 1983 and 1982. Compared to the annual streamflow, the annual sediment volume demonstrates more substantial variation. Based on the constructed model, three scenario simulation periods: P0 (1962–1981/1982), P1 (1983/1982–1999), and P2 (2000–2020) were set. Compared with P0, the respective contribution rates of climatic variation, land use, and other human intervention to streamflow (sediment volume) were 15.247% (19.601%), −0.03% (−1.349%), and 84.783% (81.748%) in P1. In P2, the contribution rates of these three factors on streamflow (sediment volume) were 9.160% (9.128%), 0.211% (3.053%), and 90.629% (84.818%), respectively. Through a quantitative analysis of climatic factors on streamflow and sediment, we found a positive correlation between precipitation and both streamflow and sediment. Additionally, there is an inverse relationship between temperature and streamflow, but streamflow will increase when temperature rises by 10%. Under three different future land-use scenarios, the variations in streamflow and sediment exhibited as ecological protection scenario < urban expansion scenario < natural development scenario. Changes in streamflow in this region are primarily caused by human intervention that alters the underlying surface. The increase in check dams and silted land could lead the runoff and sediment to decrease. Moreover, compared with the increase in industrial and agricultural water consumption, the increase in urban water consumption is the main factor for human water consumption.

1. Introduction

With the increasing influence of climatic variation and human intervention, the global water cycle has experienced constant alterations, leading to numerous water resource and water environment issues. This has significantly hindered long-term progress in both the economy and community [1,2]. In the context of global warming, the Loess Plateau (LP) generally presents the trend of rising temperatures and declining precipitation [3,4]. Continuous climate warming and LUCC have significantly impacted water and sediment transport processes [5]. The fragile natural ecosystem and unsuitable human intervention have caused serious soil and water erosion in the LP, which profoundly affect regional ecological conservation and high-quality economic and social progress [6]. Since the 1990s, this region has implemented numerous large-scale projects to alleviate soil erosion, including the grain for green, afforestation, and check dams and improving agricultural practices [7,8], which improved the regional vegetation condition and induced substantial alteration of the underlying surface in the basin. Thus, conducting comprehensive studies on the spatio-temporal dynamic characteristics of streamflow and sediment elements, as well as simulating streamflow and sediment processes, is crucial for gaining an in-depth understanding of change in hydrological processes and can offer scientific support for implementing soil and water conservation measures and managing the basin comprehensively.
Referred to as the main factors, human actions and climatic variation are widely acknowledged for their significant contribution to the decrease in streamflow and sediment in the watershed [9,10,11]. Climatic variation affects the streamflow in the LP mainly due to various climatic elements, including precipitation, temperature, sunshine duration, and wind velocity [12]. Precipitation is the dominant factor affecting regional streamflow variations [13], while temperature indirectly alters streamflow by modifying the watershed evapotranspiration process [14,15]. Yue et al. [16] reported a positive correlation between streamflow and precipitation variation, and the precipitation increase resulted in an increase in streamflow, while being negatively correlated with temperature in the Lancun Station to Fenhe Erba Station watershed of Fen River utilizing the SWAT model. Human intervention primarily impacts streamflow and sediment yields through direct water resource utilization and indirect underlying surface change [17]. The implementation of water conservation measures, for example, reservoirs, check dams, and artificial water diversions, has the potential to create a discrepancy between the availability and demand for water resources. Additionally, it can alter the hydrological cycle pattern and have a substantial impact on sediment–water processes within the basin [18,19,20]. Zhang et al. [21] analyzed the water and sediment sequences before and after the construction of the Longyangxia Reservoir in the upper reaches of the Yellow River Basin and found that the reservoir had a significant impact on the correlation between water and sediment, and the negative correlation increased. Feng et al. [22] and Yuan et al. [23] showed that the check dam not only reduced the total amount of flood and the flood peak, but also alleviated the occurrence of flood.
Currently, the investigation into the quantitative attribution of alterations in water and sediment primarily involves empirical methods, statistical analysis techniques, and model simulations [24]. The empirical method cannot accurately depict the nonlinear processes and characteristics of water and sediment changes, and the abrupt point is highly subjective. The statistical analysis method is unable to reveal the complex influencing factors in hydrological processes, resulting in certain uncertainties. Wu et al. [25] observed significant disparities between the outcomes obtained from the statistical analysis and SWAT when investigating the effect of climatic variation and human intervention on streamflow. Compared to other methods, the model simulation method serves as an effective approach for simulating, predicting, and quantitatively investigating revisions in streamflow and sediment [26]. At present, the commonly employed distributed hydrological models at home and abroad encompass SWAT, WEPP, EUROSEM, and so on. The SWAT model has gained widespread application in water resource simulation and estimation owing to the superior computational efficiency, long simulation time span, and good applicability in data-scarce regions and has demonstrated remarkable performance and extensive adoption across diverse basins worldwide. Ecosystem service models, such as InVEST and ARIES, commonly incorporate the soil erosion module. The Sediment Delivery Ratio (SDR) module in InVEST has made up for the limitations of the RUSLE and has been widely utilized in soil erosion simulations across diverse regions in China [27]. In recent years, extensive model simulation studies have been conducted in the LP to address the issue of soil erosion. Qiu et al. [28] demonstrated the applicability of SWAT in studying streamflow and sediment dynamics of the Zhifanggou in the hilly–gully area in the LP. According to the SWAT model, Yin et al. [29] presented that LUCC accounted for 54% and 71% of the observed streamflow decrease in the Jinghe Basin from the 1980s to the 1990s and from the 1990s to the 2000s, respectively. Shi et al. [30] accurately forecasted soil nutrient loss in the Beiluohe Basin. Zhai et al. [31] compared three models for estimating soil erosion in the Yanhe Basin and concluded that the InVEST was more suitable for soil erosion calculation. The research conducted by numerous scholars has provided technical and theoretical support for the comprehensive management in the LP. However, conclusions derived from studies on a single basin may not necessarily be applicable to all basins in this region, due to the vast area, numerous water systems, complex water–sediment processes, and changing natural environment of the LP. Therefore, it is a more effective direction to investigate soil and water erosion control measures on small basins.
Therefore, to examine the influence of climatic variation, LUCC, and other human interventions on streamflow and sediment variations in the LP, this study specifically focuses on the Sanggan River Basin located in the northeastern LP. This area holds significant importance for establishing a water conservation functional zone for the capital city as well as supporting efforts to preserve the ecological environment. There have been notable variations in the water and sand resource pattern due to multiple factors over the past few years. The primary aims are (1) to analyze the spatio-temporal evolution of streamflow and sediment in 1960–2020; (2) to evaluate the effect of climatic variation, LUCC, and other human interventions on changes in streamflow and sediment levels; a suitable SWAT model (for streamflow) and InVEST model (for sediment) will be constructed for a quantitative analysis; (3) to quantitatively investigate the effect of various climatic factors on streamflow and sediment yields by establishing multiple climate scenarios; (4) to examine the impact of different land surface conditions on streamflow and sediment variations, three scenarios were created using the CA-Markov model: natural development, ecological conservation, and urban expansion; (5) to analyze check dam and water consumption from 1960 to 2020 and clarify the impact of human activities on streamflow and sediment. The objective is to provide valuable insights for future initiatives that focus on ecological restoration and comprehensive management of soil and water conservation in the LP.

2. Materials and Methods

2.1. Study Area

The Sanggan River (Figure 1, 112°–115° E, 39°–41° N) is situated in the loess hill and gully region, serves as one of the main tributaries of the Hai River, and spans the Hebei, Shanxi, and Inner Mongolia Autonomous Regions. The main channel is approximately 506 km in length, covering an area of about 23,900 km2. The average annual temperature in the watershed is 6.1 °C, with four distinct seasons. The annual precipitation is mainly concentrated from June to September, with the annual mean rainfall of 441 mm. The surface of the basin is primarily loose and porous loess, which easily causes soil and water loss. The largest land-use type was farmland, accounting for approximately 46.8%, followed by grassland at 30.7%, and then forest at 15.8%. Chestnut soil and castano-cinnamon soil are the most abundant soils in this region, collectively accounting for 63.5%, followed by fluvo-aquic soil (13.4%), aeolian sandy soil (11.9%), and brown earth (9.7%). The primary industries are coal and electricity production, which have resulted in significant environmental challenges, including air pollution, water scarcity, groundwater contamination, and coal mining collapse.

2.2. Data

The main datasets primarily include meteorological, remote sensing, and statistical datasets (Table 1). The meteorological data used for SWAT were processed into numerous txt files adapted for SWAT model, while the meteorological data used for the invest model were treated with Kriging gridding. The streamflow and sediment data were statistical yearbook textual data. DEM, land use, and soil data were processed into raster data using a consistent coordinate system and projection. The check dam and water consumption data were Shanxi water resource bulletin textual data.

2.3. Methods

2.3.1. Soil and Water Assessment Tool (SWAT)

SWAT is the distributed hydrological model that can predict the various effects on hydrological cycle processes, such as climatic variations, LUCC, water resources management measures, and agricultural management practices [32,33]. Firstly, based on the DEM, a hydrological network was generated. The Shixiali hydrological station was designated as the outlet station for the basin. The basin was partitioned into 25 sub-watersheds through river network extraction, terrain factors, and channel parameter calculation. Then, corresponding land-use types, soil types, and slope settings were overlaid to obtain 486 Hydrological Response Units (HRUs). The model parameter sensitivity analysis and calibration were used by the SWAT-CUP [34]. Due to the abrupt change in streamflow pattern in 1983 (see Section 3.3.1 for details), the measured streamflows in 1973–1982 and 1983–1987 were used for calibration and verification, respectively. The squared correlation coefficient (R2) and Nash–Sutcliffe efficiency (Ens) are two indicators provided by the SWAT-CUP model. They were used to assess the consistency between simulation and observation. Generally, when both indicators are greater than 0.5, it indicates a satisfactory fitting effect [35,36].
Based on relevant research, the comprehensive impact on streamflow and sediment in this region is said to be influenced by three key factors: climatic variation, LUCC, and other human interventions. The scenario simulation [37] was used to differentiate the contributions of these three drivers to changes in streamflow or sediment during periods P0–P1 and P0–P2 (Table 2):
ΔQtotal = ΔQclime + ΔQlucc + ΔQhuman = obsj + obsi,
ΔQclime = Qclime(j)+lucc(i) − Qclime(i)+lucc(i),
ΔQlucc = Qclime(j)+lucc(j) − Qclime(j)+lucc(i),
ΔQhuman = ΔQtotal − ΔQclime − ΔQlucc,
where ΔQtotal represents the total variation volume in streamflow or sediment; ΔQclime, ΔQlucc, and ΔQhuman represent the extent to which climatic variation, land use, and other human interventions affect streamflow or sediment; obsi and obsj denote the observed values of streamflow or sediment, respectively, during periods Pi (i = 0, 1) and Pj (j = 1 or 2, with j > i); lucci and luccj indicate the land-use conditions during periods Pi and Pj, respectively; climei and climej represent the climate conditions within periods Pi and Pj; Qclime(j)+lucc(i) refers to simulated streamflow or sediment under the climate conditions of period Pj (climej) combined with land-use conditions of period Pi (lucci), as obtained through modeling.

2.3.2. Integrated Valuation of Ecosystem Services and Tradeoffs (InVESTs)

InVEST was used to describe the spatial processes of slope soil erosion and watershed sediment transport at the pixel scale [38]. The primary algorithm of the model is as follows [39]:
SEDRETx = Rx · Kx · LSx · (1 − Px − Cx) + SEDRx,
SEDR x   =   SE x Σ y = 1 x 1 USLE y Π z = y + 1 x 1 ( 1     SE y ) ,
RKLSx = Rx · Kx · LSx,
USLEx = Rx · Kx · LSx · Cx · Px
where SEDRx and SEDRETx represent the sediment and soil retention (t) of grid x, respectively. RKLSx and USLEx denote the potential and actual soil erosion (t) for grid x, respectively. USLEy signifies the actual soil erosion amount (t) for the uphill grid y. SEx refers to the sediment retention efficiency. Rx represents the precipitation erosivity factor (MJ mm hm−2 h−1 a−1), which is calculated based on monthly and annual precipitation [40]. Kx denotes the soil erodibility factor (t h MJ−1 mm−1), determined by employing the formula established by Williams et al. [41]. LSx represents the slope length factor without dimensions. Cx and Px (Table 3) embody the vegetation and management factors and water and soil conservation measures, respectively, which were assigned to the relevant research findings in the Haihe Basin [42]. By using the above algorithm and formula, the key parameters were obtained: the soil erodibility factor (K), rainfall erosivity factor (R), topographic factor (LS), soil and water conservation measure factor (P), vegetation cover and management factor (C), and confluence area threshold. Due to the abrupt change in sediment pattern in 1982 (see Section 3.3.1 for details), the measured sediment in 1973–1981 and 1982–1987 was used for calibration and verification, respectively. The prepared parameters were inputted into the Sediment Delivery Ratio (SDR) module of the InVEST model for sediment simulation. A good fit of the model was achieved by adjusting and debugging Threshold Flow Accumulation repeatedly. The squared correlation coefficient (R2) and Nash–Sutcliffe efficiency (Ens) were selected to assess the simulation accuracy of the InVEST model, and the contribution rate was also quantitatively differentiated through scenario simulation.

2.3.3. CA-Markov Model

The CA-Markov model effectively combines the intricate spatial system evolution of the CA model with the strength of the Markov model in long-term prediction and can accurately simulate land-use change [43,44].
Three scenarios based on the model were set to investigate LUCC of Sanggan River Basin in 2030: (1) Natural development scenario: LUCC maintains the same land transition trend between 1990 and 2010 and is not affected by external factors such as economic, political, and societal factors; (2) Ecological protection scenario: Strictly adhering to national guidelines for maintaining vegetation coverage of forest, the basic red line of farmland, and prohibiting the conversion of water bodies to any land types. The probability of converting farmland to forest is increased by 5%, while the probability of converting farmland, forest, grass, and unused land to construction land is reduced by 4%, 2%, 1%, and 1%, respectively; (3) Urban expansion scenario: It was established based on the current trend of construction land development; the construction land change was adjusted according to the main railway and highway networks, and the probability of converting unused land and farmland into construction land is increased.

3. Results

3.1. Model Evaluation

The streamflow and sediment data collected from 1973 to 1987 in the Sanggan River Basin were employed for model calibration and validation. Because 1983 marked an abrupt change year in streamflow, the monthly streamflow during 1973–1982 was used for the model calibration, while the monthly streamflow from 1983 to 1987 served for the model validation. Thirteen sensitivity parameters were selected for calibration (Table S1 in the Supplementary Materials). The ultimate results show that the simulated monthly streamflow by SWAT was in good accordance with the measured monthly streamflow data (Figure 2), with R2 = 0.83 and Ens = 0.73 in the calibration phase and R2 = 0.73 and Ens = 0.62 during the validation phase. The suitability of the SWAT for simulating streamflow in the Sanggan River Basin is evident.
The InVEST model was employed for the calibration and validation of annual sediment data. According to the abrupt change time of sediment in the region (1982), the annual sediment data from 1973 to 1981 were taken for model calibration. And the sediment data from 1982 to 1987, collected on an annual basis, were employed for the purpose of validating the model. R2 and Ens were selected to assess the simulation accuracy of the InVEST model. The simulated sediment transport demonstrated satisfactory agreement with the measured sediment transport (Figure 2), with R2 = 0.79 and Ens = 0.60 in the calibration period and R2 = 0.64 and Ens = 0.58 during the validation period. The suitability of the InVEST model’s sediment simulation for the Sanggan River Basin was demonstrated, and the outcomes provide valuable insights into water and soil loss as well as soil conservation.

3.2. Evolutionary Characteristics of Streamflow and Sediment

3.2.1. Temporal Variation

The Shixiali hydrological station functions as the discharge point for the Sanggan River Basin. According to the interannual variation curves observed at this station (Figure 3), it can be inferred that there is a declining pattern in both the streamflow and sediment levels within this area. The annual average streamflow in the region was 2.88 × 10⁸ m3 during 1960–2020, with a reduction rate of 1.27 × 10⁸ m3/10 a. Similarly, the annual average sediment volume was 172.04 × 10⁴ t, exhibiting a decline rate of 129.07 × 10⁴ t/10 a. The annual streamflow and sediment exhibited a coefficient of variation of 1.09 and 1.76, respectively, indicating the significant fluctuation in both variables, with the latter exhibiting the more dramatic change.

3.2.2. Spatial Pattern

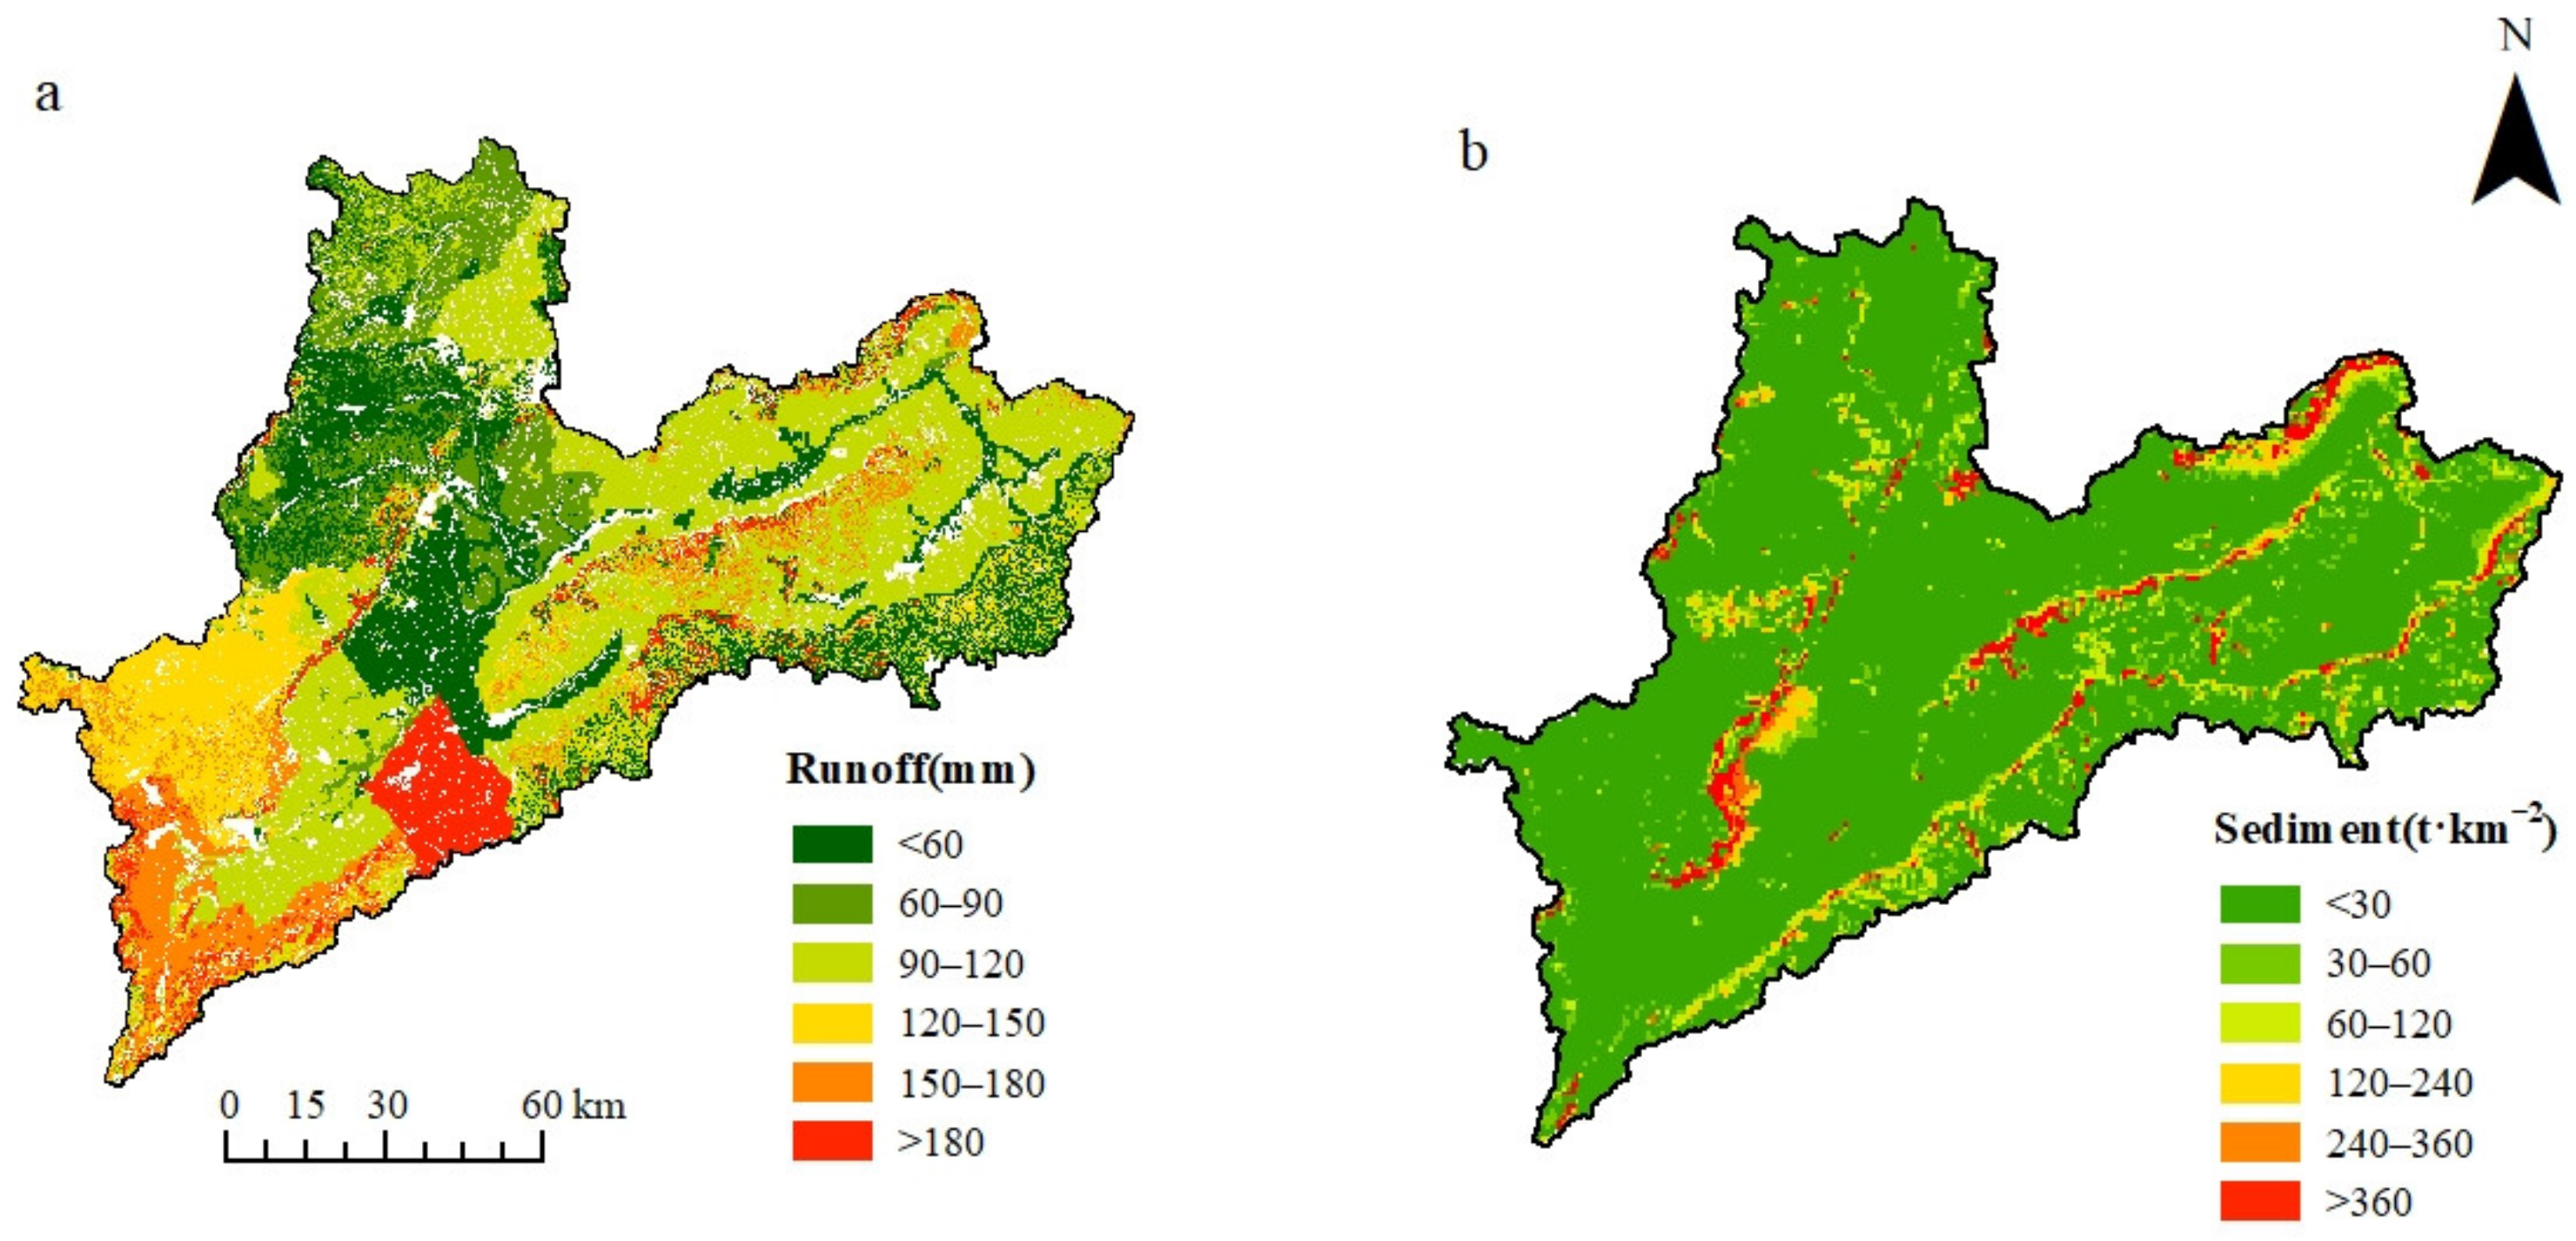
The depiction of the spatial pattern for the average annual streamflow and sediment within the region can be observed in Figure 4. The southern region experiences a significant increase in streamflow, while the northern region witnesses a comparatively lower level. The high streamflow area (>150 mm) constitutes 21.80%, which is mainly situated in the southwest region (Shuozhou City). The river flows through the mountainous areas at the north and south and the flat Datong Basin in the central area, with relatively low elevation, large water catchment, and numerous tributaries, including the Hui River, Yuanzi River, Huangshui River, and Hun River. The medium streamflow area (90–150 mm) is primarily situated in the eastern region, accounting for 37.32%. The low streamflow area (<90 mm) is primarily distributed in the central area, constituting 40.88% of the watershed, which may be associated with the higher latitude and elevation. The distribution pattern of sediment in space exhibits a general resemblance to the streamflow pattern. The high sediment area (>240 t/km2) constitutes approximately 7.56%, which is essentially consistent with the distribution of high streamflow, indicating the higher the streamflow, the higher the sediment transport volume. The medium sediment area (60–240 t/km2) is primarily situated in the eastern part, accounting for 11.92%. The low sediment area (<60 t/km2) is primarily distributed in the central region and accounts for 80.52% of the watershed.

3.3. Calculation of Streamflow and Sediment Contribution Rates by Multiple Factors

3.3.1. Calculation of the Relative Contribution Rate Utilizing the DMC

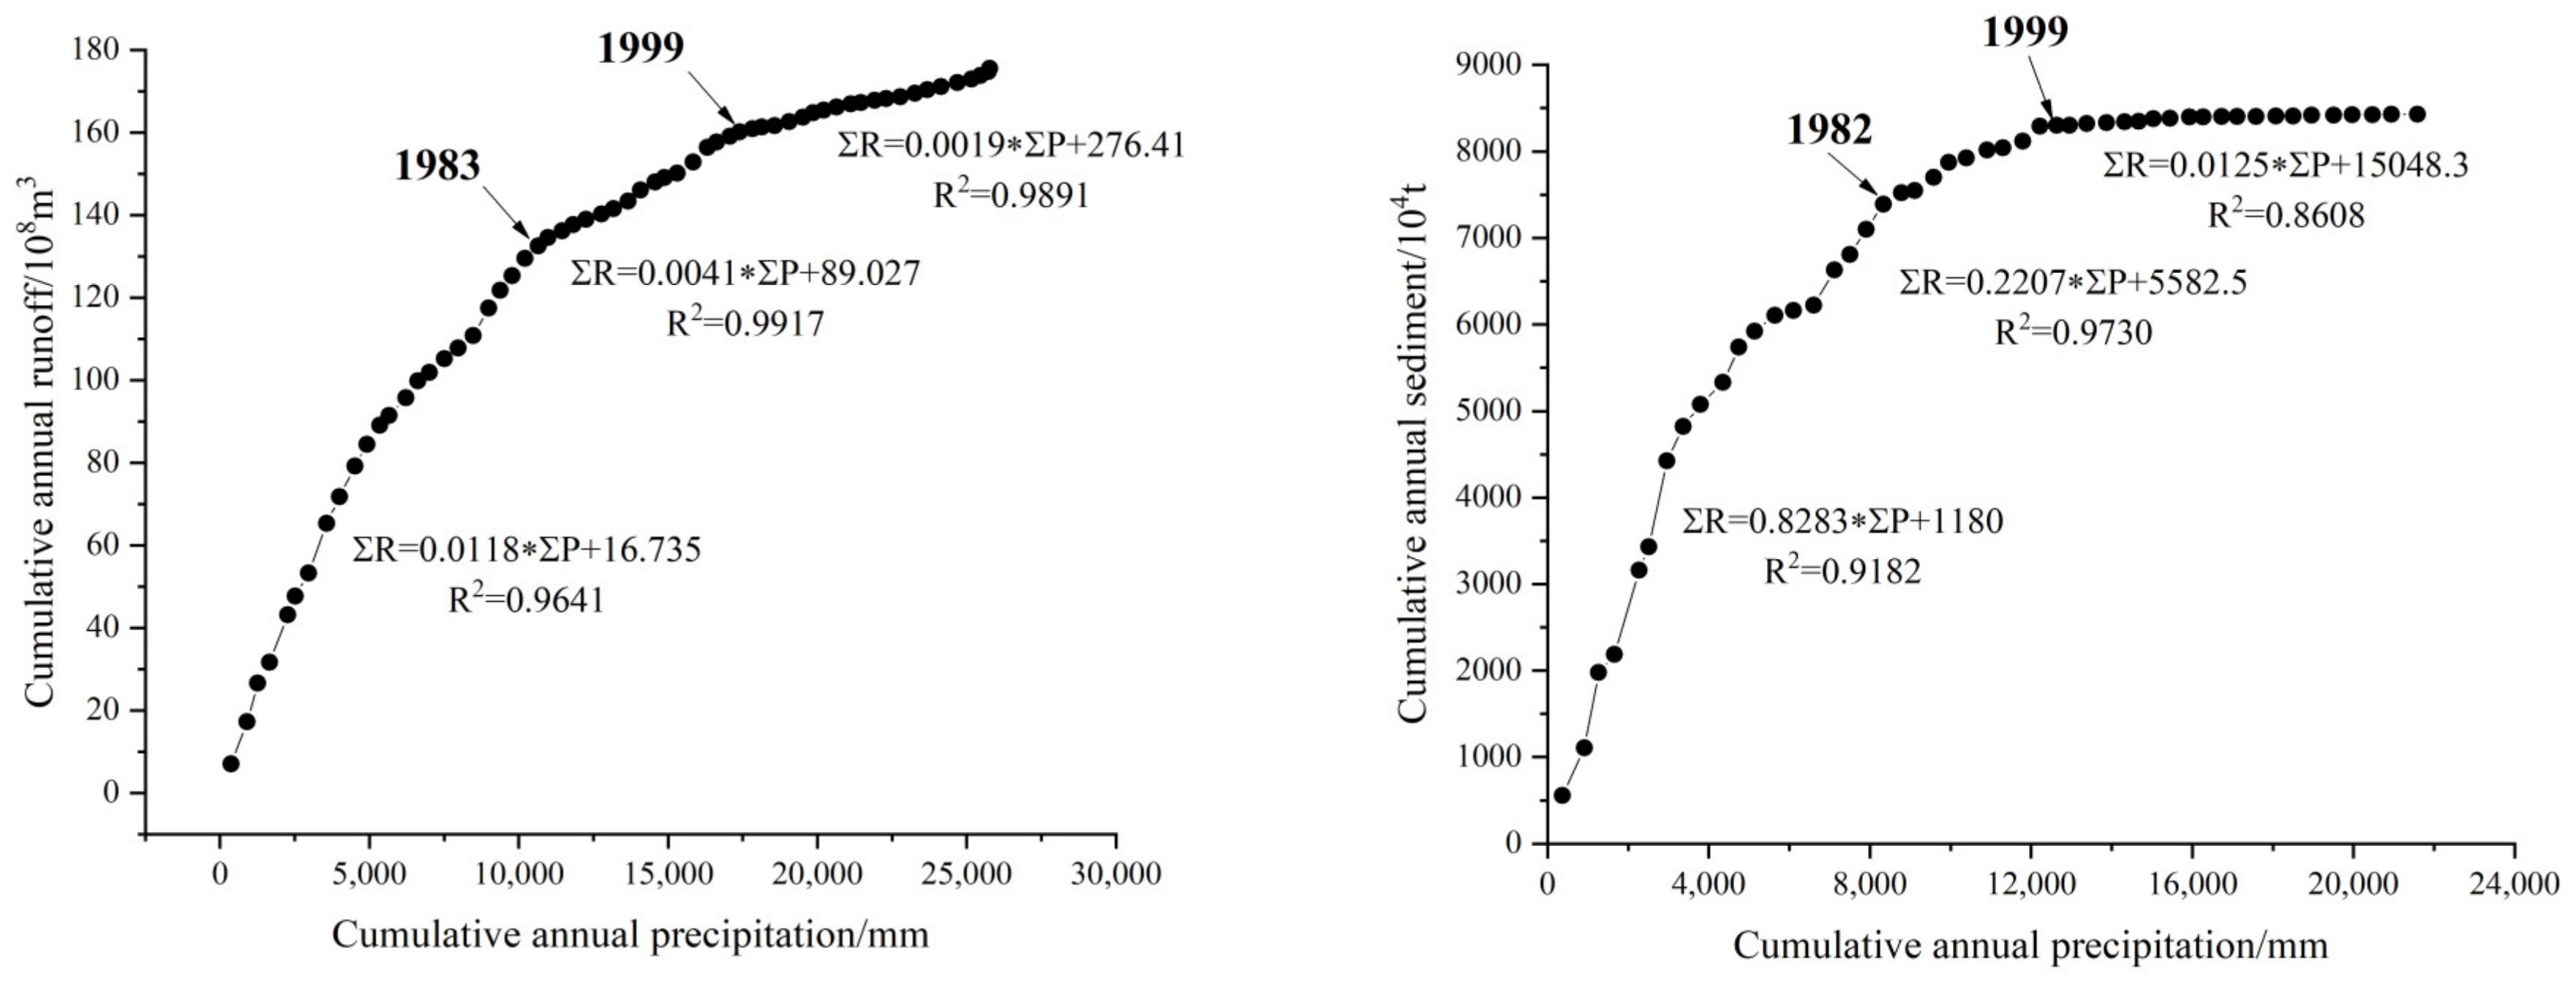
The precipitation vs. streamflow and sediment double-mass curves (DMCs) experienced significant shifts in the Sanggan River Basin, with one occurring around 1983/1982 and another around 1999, within the period of 1960–2020 (Figure 5). Combined with previous studies in this region [45], the results of the cumulative anomaly curve and sliding t-test (Table S2, Figures S1 and S2 in the Supplementary Material) indicate that 1983 was the abrupt point of streamflow and 1982 was the abrupt year of sediment. So, the entire period was split into the base phase (1960–1982/1981, denoted as P0) and the change phase (1983/1982–2020), which was further divided into P1 (1983/1982–1999), and P2 (2000–2020). The gradients of the streamflow and sediment regression lines during the P0, P1, and P2 were 0.012 (0.828), 0.004 (0.221), and 0.002 (0.013), respectively, suggesting a gradual reduction in sediment and streamflow.
In the change phase, the annual streamflow was influenced by climatic variation and human intervention, with a respective impact of 0.57 × 10⁸ m3 and 3.21 × 10⁸ m3 during the period of 1983–1999 (Table 4). Climatic change accounted for 15.01% of the total contribution, while human intervention accounted for 84.99%. From 2000 to 2020, the impact of the two factors on the annual streamflow was 0.23 × 10⁸ m3 and 4.54 × 10⁸ m3, respectively, contributing 4.73% and 95.27%, respectively. At the same time, the influence of the two factors on the annual sediment volume amounted to 37.50 × 10⁴ t and 237.78 × 10⁴ t, respectively, from 1982 to 1999, contributing 13.62% and 86.38%, respectively. In 2000–2020, the respective influence amounts were 25.00 × 10⁴ t and 362.98 × 10⁴ t, accounting for 6.44% and 93.56%, respectively. The findings indicate that the period from 2000 to 2020 witnessed a greater influence of human intervention on streamflow and sediment compared to the years from 1983/1982 to 1999 due to the initiation of the Grain for Green Project (GFGP) in 1999. In general, the primary factors contributing to the streamflow and sediment reductions were predominantly attributed to human intervention, which exerted a significantly greater influence compared to climatic variation. However, the DMC method has certain limitations and uncertainties when it comes to determining the sole contribution rate of influencing factors. In order to more accurately differentiate the extent of impact from various human interventions (LUCC and other human interventions), the scenario simulation of streamflow and sediment changes was conducted based on SWAT and InVEST models, respectively.

3.3.2. Calculation of Relative Contribution Rate Using the Model

Table 5 presents the relative contributions of three drivers to streamflow and sediment variations in P0–P1 and P0–P2. In general, while climatic variation plays a secondary role, other human interventions have predominantly contributed to the decline in streamflow and sediment, finally followed by LUCC. The alteration in streamflow is as follows: Compared with the base period (1960–1982), streamflow decreased by 3.78 × 10⁸ m3 from 1983 to 1999, with the contribution rates of three factors being 15.25%, −0.03%, and 84.78%, respectively. From 2000 to 2020, streamflow decreased by 4.76 × 10⁸ m3, with the three influencing factors contributing at rates of 9.16%, 0.21%, and 90.63%, respectively. Compared with the base period (1960–1981), sediment volume decreased by 275.28 × 10⁴ t during 1982–1999, with climatic variation, LUCC, and other human interventions accounting for 19.60%, −1.35%, and 81.75% of the overall contribution rates, respectively. During 2000–2020, the sediment volume further declined by 387.97 × 10⁴ t, with the contribution rates of the three influencing factors being 9.13%, 3.05%, and 87.82%, respectively.

4. Discussion

4.1. Impact of Climatic Factors on Streamflow and Sediment

With land-use conditions unchanged and the average climate conditions n during the research period as the basis, precipitation and temperature were adjusted by ±30% and ±10%, respectively. Figure 6 illustrates how climate factors influence the streamflow and sediment. Under the constant temperature condition, the variation in streamflow is 89.66% and −66.31% due to a precipitation variation of ±30%, and streamflow changed 30.15% and −23.41% due to precipitation fluctuations of ±10%. The findings indicate that the increase in precipitation resulted in a proportional increase in streamflow, with a greater increase observed as precipitation levels increased. Under constant precipitation conditions, temperature variations of ±30% and ±10% resulted in streamflow changes of −11.01% and 17.59% and 30.15% and 7.12%, respectively. The general decreasing trend of streamflow was observed with increasing temperature, except for the slight increase in streamflow when the temperature increased by 10%. With the increase in precipitation, the total water volume in the basin increased, and streamflow increased accordingly. However, a high temperature increased evaporation and plant transpiration in the basin, which in turn led to a streamflow reduction. Overall, as the variation in streamflow caused by changes in precipitation is more pronounced compared to changes in temperature, the effect of precipitation on streamflow is more evident than that of temperature. The relationship between precipitation changes, and sediment is easily understood as the two factors show a strong positive correlation (r ≈ 1, p < 0.01). An increase in precipitation led to an increase in sediment volume, with every 10% increment (decrement) in rainfall resulting in a 10.28 t/km2 increase (decrease) in sediment transport.

4.2. Impact of LUCC on Streamflow and Sediment

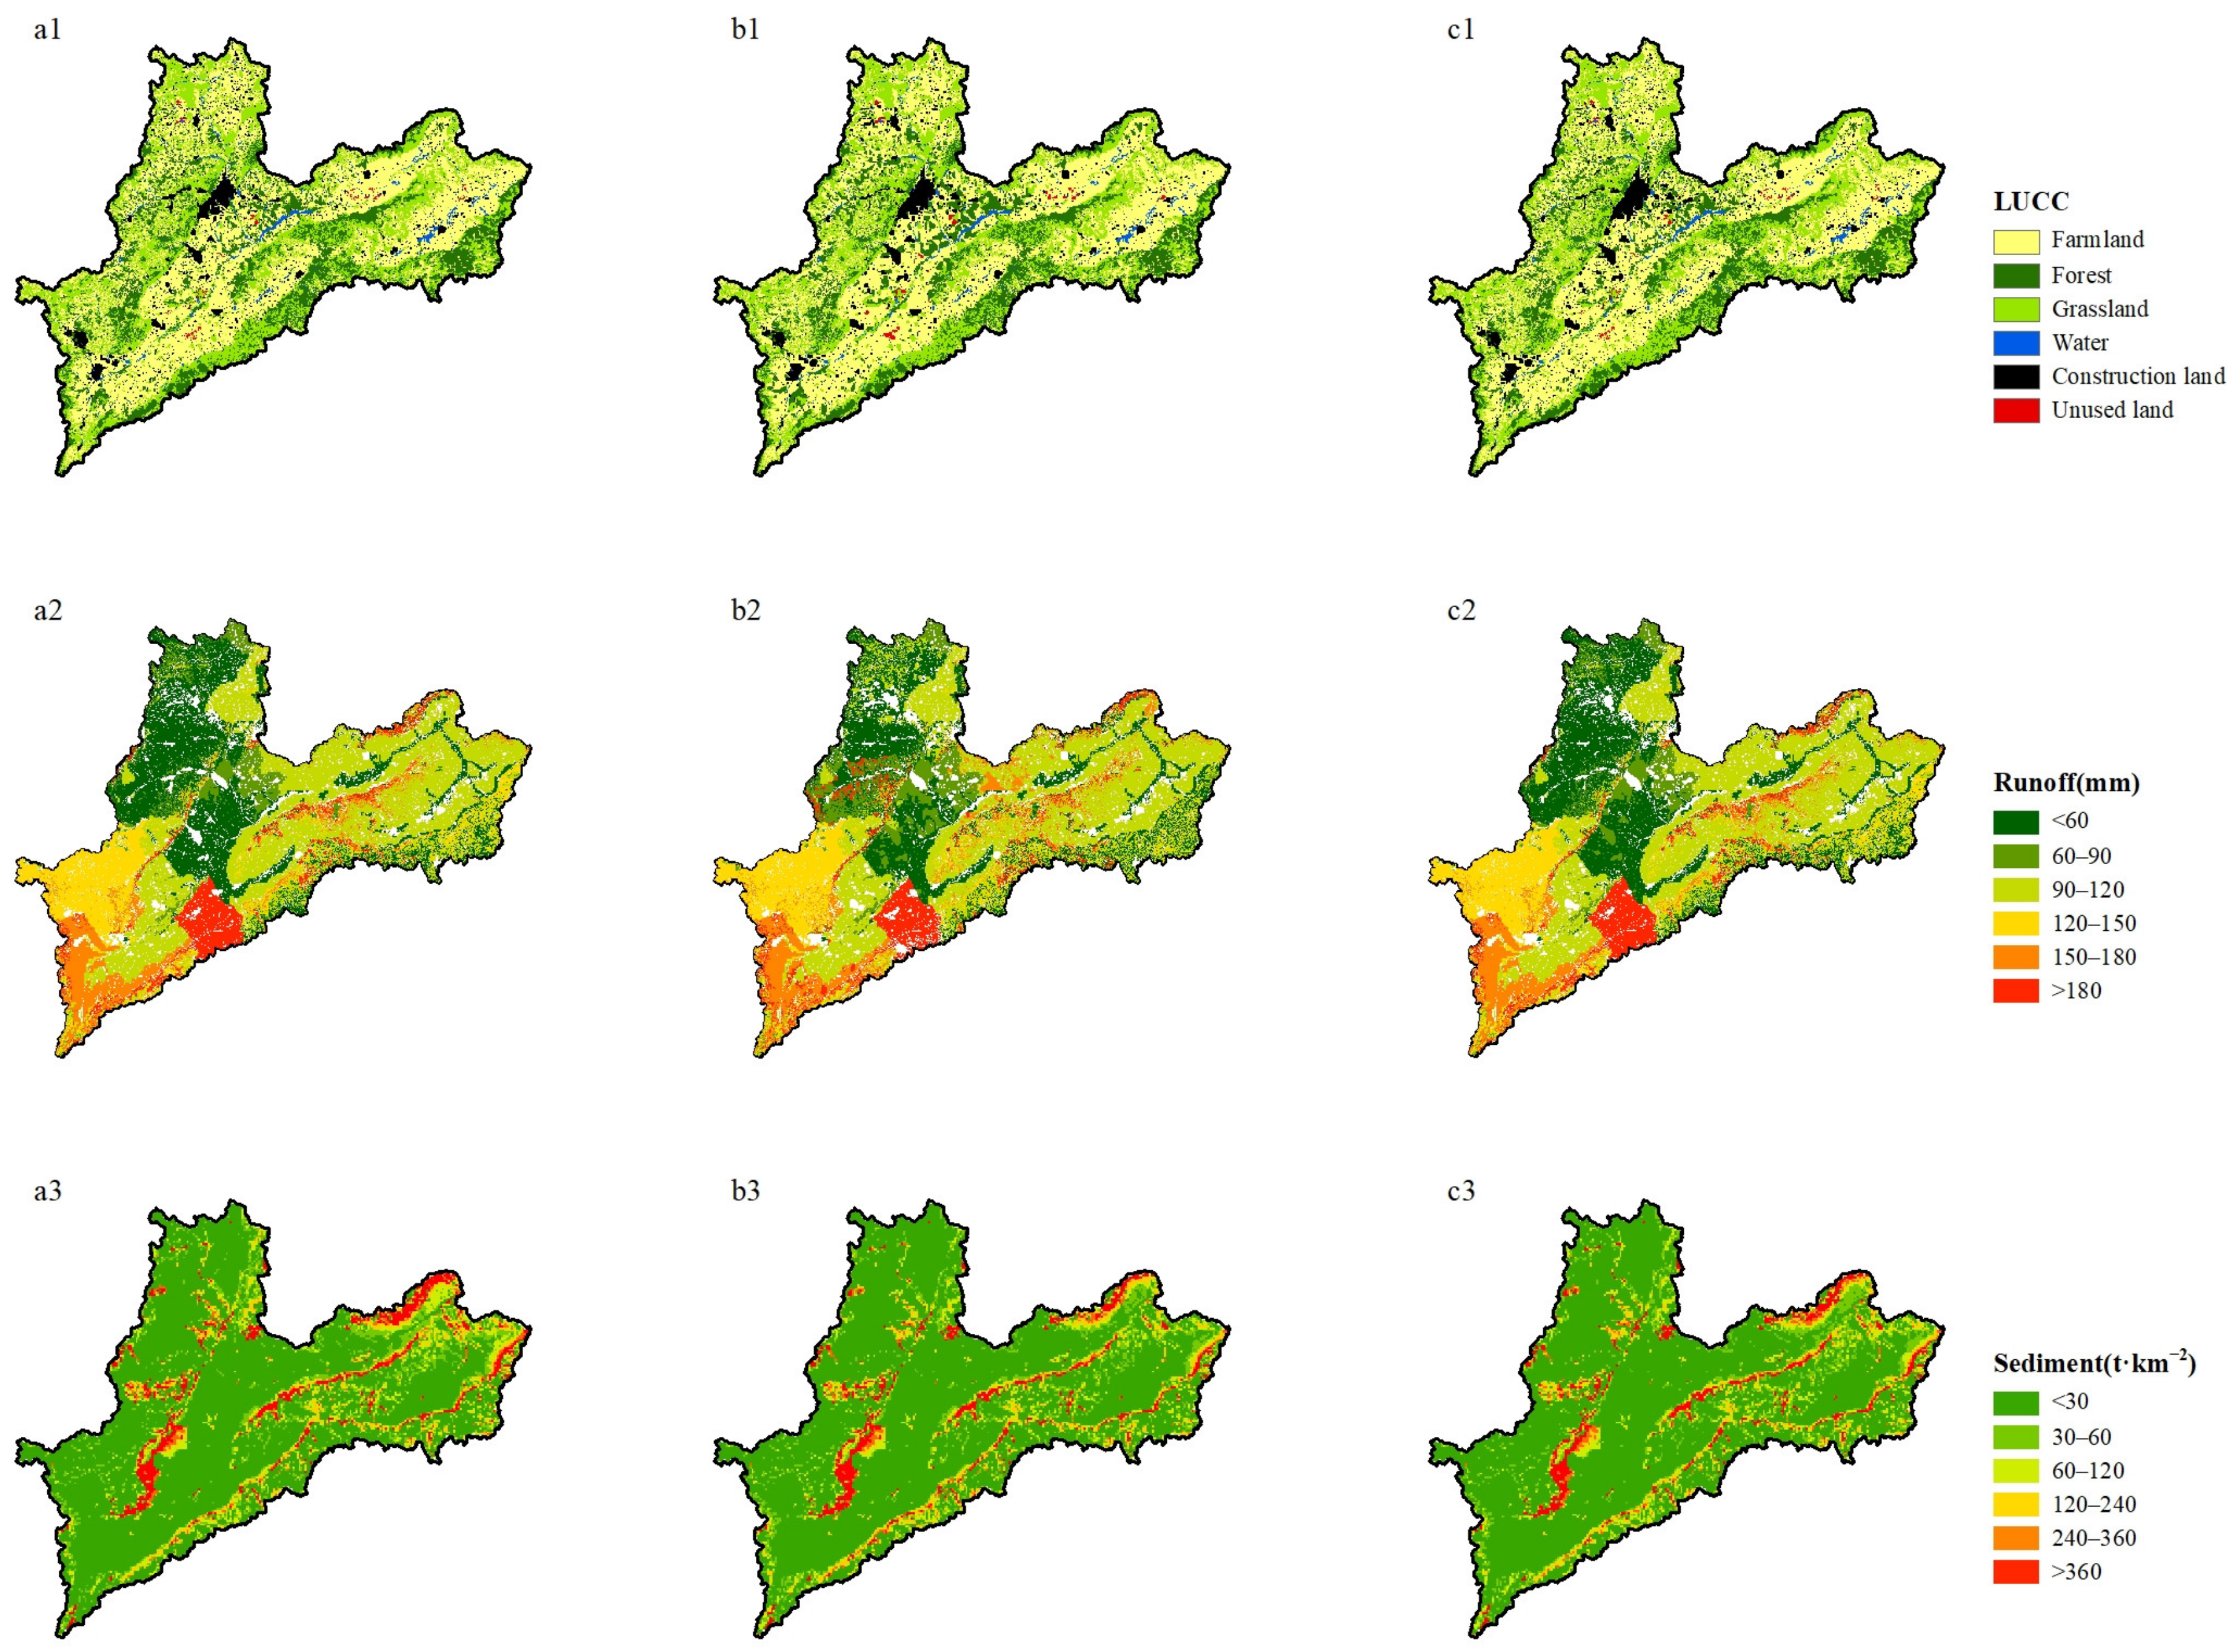
Scenario simulation can simulate changes in land use, streamflow, and sediment under different development conditions (natural development, ecological protection, and urban expansion). From a land-use perspective (Figure 7 and Table 6), the Sanggan River Basin is primarily composed of farmland, forest, and grassland, accounting for approximately 94%. The population growth triggered significant urbanization, which was reflected in the expansion of construction land, increasing by 326 km2 during 1990–2020. At the same time, the ‘grain for green’ initiative resulted in a reduction in farmland by 434 km2 and an increase in forest by 118 km2. Under the scenario of natural development in 2030, there has been a significant increase in construction land, while farmland is experiencing a considerable decrease compared to the year 2020. In the ecological protection scenario, there is a significant reduction in the construction land expansion, while forests, grasslands, and bodies of water are experiencing substantial growth. This results in an overall improvement of the ecological environment. In the urban expansion scenario, the construction land expands rapidly, accompanied by a substantial decrease in farmland and modest growth of other land types. On the whole, the basin still presents the mosaic distribution pattern of farmland, grassland, and forest.
The spatial arrangement of sediment and streamflow in this area by 2030 is illustrated in Figure 7, considering three different scenarios. The streamflow is high under the natural development scenario (113.19 mm), followed by the urban expansion scenario (113.10 mm), and then the ecological protection scenario (109.03 mm). Compared to the 1990s, streamflow increases in varying degrees under both natural development and urban expansion scenarios in 2030, while it decreases under the ecological protection scenario. The augmentation of vegetation coverage enhances soil infiltration and reduces regional streamflow. The spatial distribution of streamflow demonstrates an escalating trend from the north to south. The sediment transport presents a natural development scenario (190.37 t/km2) > urban expansion scenario (187.14 t/km2) > ecological conservation scenario (169.07 t/km2), and the spatial distribution pattern remains relatively consistent.

4.3. Impact of Human Activities on Streamflow and Sediment

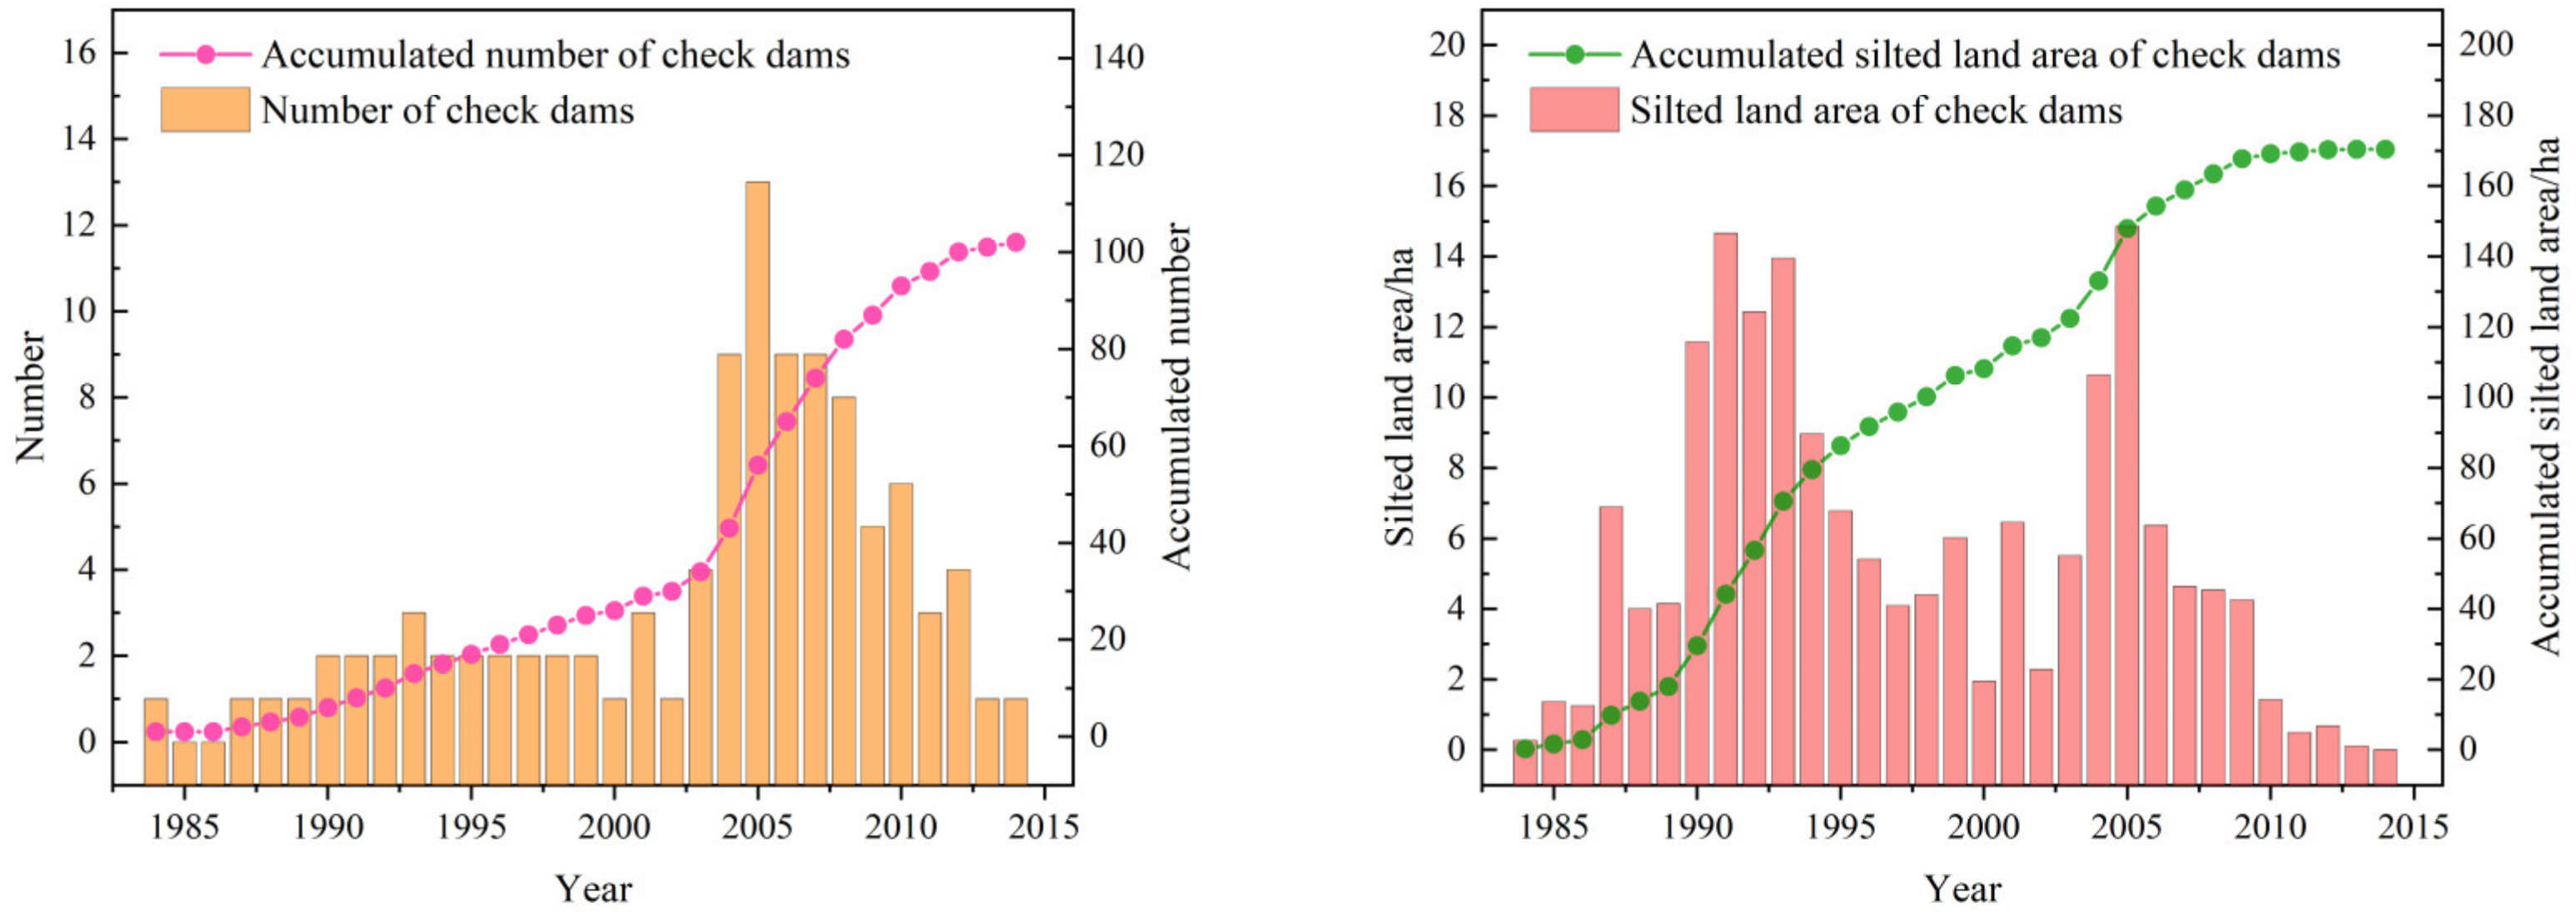
The research results show that human activities exerted a substantial influence on runoff and sediment reductions in the Sanggan River Basin, followed by climate change and then land-use change. Human activities, especially water conservation projects, play a dominant role in reducing runoff and sediment loads. By analyzing the data of check dams and human water consumption in the Sanggan River Basin after the abrupt year (1983), the year in which check dams increased rapidly was basically consistent with the years when the runoff and sediment loads sharply decreased (Figure 8). During P2, a total of 77 check dams were constructed, constituting 75% of the overall project. During P1 (1984–2000), two check dams were added each year, with an average silted land increase of 6.64 ha, and there was an average annual increase of five check dams and 4.28 ha in silted land area in P2 (2000–2014). The annual average total water consumption was 9.674 × 10⁸ m3 in 1984–2020, with industrial, agricultural, and urban water contributing 21.58%, 68.21%, and 10.21%, respectively (Figure 9). The average annual water consumption was 9.448 × 10⁸ m3 in 1984–1999, with a decreasing trend of −0.019 × 10⁸ m3/a. The average annual water consumption was 9.846 × 10⁸ m3 in 2000–2020, with a rising trend of 0.028 × 10⁸ m3/a. Compared with 1984–1999, the industrial water of 2000–2020 significantly decreased by 6.61% (−0.143 × 10⁸ m3), and agricultural water decreased slightly by 3.32% (−0.223 × 10⁸ m3), while urban water significantly increased by 138.27% (0.765 × 10⁸ m3). Human activities (except land-use change) reduced runoff and sediment by 1.115 × 10⁸ m3 and 118.185 × 10⁴ t during the P1–P2, with the contribution rates of 113% and 105%, respectively.

5. Conclusions

By constructing a SWAT model and an InVEST model applicable to the Sanggan River Basin, the study aimed to clarify the variations in streamflow and sediment over space and time, while assessing the impact of climatic variation, LUCC, and other human interventions on the streamflow and sediment. The Sanggan River Basin experienced an annual average streamflow of 2.88 × 10⁸ m3 and sediment deposition of 172.04 × 10⁴ t from 1960 to 2020 and demonstrated a downward trend, with sediment fluctuating more drastically. The investigation period was divided into two distinct phases, namely the base phase and the change phase, determined by the abrupt point. Through scenario simulation analysis in the SWAT model and the InVEST model, the contributions of other human interventions to streamflow and sediment variations in the P1 (1983/1982–1999) and P2 (1999–2020) periods were 84.783% (81.748%) and 90.629% (84.818%), respectively, followed by the impact of climatic variation with 15.247% (19.601%) and 9.160% (9.128%), and finally land-use changes with −0.03% (−1.349%) and 0.211% (3.053%), respectively. The findings are generally consistent with the results obtained from the DMC method, which can be mutually verified. Climate change and LUCC are the primary drivers of streamflow and sediment variations. By quantifying the role of climatic factors on streamflow and sediment, indicating that a precipitation increase resulted in streamflow and sediment increases, while a high temperature led to a streamflow reduction, except when the temperature increased by 10%. However, land-use change presents a relative weak effect, and streamflow and sediment volumes will increase under the three scenarios, with the ecological protection scenario < urban expansion scenario < natural development scenario. Human activities are the dominant factors affecting runoff and sediment variations. Water conservation projects, such as check dams, could reduce runoff and sediment. In addition, the main factor leading to a water consumption increase relating to human activities is the increase in urban water consumption.

Supplementary Materials

The following supporting information can be downloaded at: https://www.mdpi.com/article/10.3390/su16041475/s1, Figure S1: Sliding t-test diagram of annual runoff and sediment in Sanggan River basin. Figure S2: Cumulative deviation curve of annual runoff and sediment in Sanggan River Basin. Table S1: Sensitivity analysis and parameter calibration of SWAT model at Shixiali station. Table S2: Mutation test of annual runoff and sediment at Shixiali station of Sanggan River Basin.

Author Contributions

Conceptualization, J.W. and S.W.; Methodology, M.L., X.L. and S.W.; Software, M.L., Y.L. and L.Z.; Validation, X.L. and Q.L.; Formal analysis, J.W., M.L. and S.W.; Investigation, J.W., X.L. and Q.L.; Resources, S.W.; Data curation, M.L., Y.L. and L.Z.; Writing—original draft, J.W.; Writing—review & editing, J.W. and M.L.; Visualization, S.W.; Supervision, S.W. and Q.L.; Project administration, Q.L. All authors have read and agreed to the published version of the manuscript.

Funding

This research was funded by the National Natural Science Foundation of China (41801007, 42077069), Second Tibetan Plateau Scientific Expedition and Research Program (2019QZKK0201), Science and Technology Project of Hebei Academy of Sciences (23107), Basic Research Program of Shanxi Province (202203021211258, 202103021223248), Shanxi Philosophy and Social Science Planning Project (2023YJ045), Shanxi Postgraduate Education and Teaching Reform Project (2021YJJG154, 2022YJJG137), Shanxi Universities Teaching Reform and Innovation Project (J2021284, J20220457), Shanxi Normal University Graduate Innovation Project (2022XSY011).

Institutional Review Board Statement

Not applicable.

Informed Consent Statement

Not applicable.

Data Availability Statement

No new data were created or analyzed in this study. Data sharing is not applicable to this article.

Conflicts of Interest

The authors declare no conflict of interest.

References

  1. Xia, J.; Shi, W. Perspective on water security issue of changing environment in China. J. Hydraul. Eng. 2016, 47, 292–301. [Google Scholar] [CrossRef]
  2. Guan, X.X.; Zhang, J.Y.; Bao, Z.X.; Liu, C.S.; Jin, J.L.; Wang, G.Q. Past variations and future projection of runoff in typical basins in 10 water zones, China. Sci. Total Environ. 2021, 798, 149277. [Google Scholar] [CrossRef] [PubMed]
  3. Wang, S.J.; Zhao, G.Q.; Wang, M.Y.; Fang, X.F.; Wang, C.G. Characteristics of Climate Change in the Yellow River Basin from 1961 to 2020. Meteorol. Environ. Sci. 2021, 44, 1–8. [Google Scholar] [CrossRef]
  4. Wang, Y.P.; Wang, S.; Zhao, W.W.; Liu, Y.X. The increasing contribution of potential evapotranspiration to severe droughts in the Yellow River basin. J. Hydrol. 2022, 605, 127310. [Google Scholar] [CrossRef]
  5. Wang, S.; Fu, B.J.; Piao, S.L.; Lu, Y.H.; Ciais, P.; Feng, X.M.; Wang, Y.F. Reduced sediment transport in the Yellow River due to anthropogenic change. Nat. Geosci. 2016, 9, 38–41. [Google Scholar] [CrossRef]
  6. Fu, B.J.; Wang, S.; Liu, Y.; Liu, J.B.; Liang, W.; Miao, C.Y. Hydrogeomorphic ecosystem responses to natural and anthropogenic changes in the Loess Plateau of China. Annu. Rev. Earth Planet Sci. 2017, 45, 223–243. [Google Scholar] [CrossRef]
  7. Wang, Z.J.; Xu, M.Z.; Liu, X.; Singh, D.K.; Fu, X.D. Quantifying the impact of climate change and anthropogenic activities on runoff and sediment load reduction in a typical Loess Plateau watershed. J. Hydrol.-Reg. Stud. 2022, 39, 100992. [Google Scholar] [CrossRef]
  8. Jiang, K.X.; Mo, S.H.; Yu, K.X.; Li, Z.B. Research Progress on Sediment Retention Analysis Methods of Yudiba Dams in the Loess Plateau. J. Soil Water Conserv. 2023, 37, 1–10. [Google Scholar] [CrossRef]
  9. Li, H.Y.; Zhang, Y.Q.; Vaze, J.; Wang, B.D. Separating effects of vegetation change and climate variability using hydrological modelling and sensitivity-based approaches. J. Hydrol. 2012, 420/421, 403–418. [Google Scholar] [CrossRef]
  10. Kour, R.; Patel, N.; Krishna, A.P. Climate and hydrological models to assess the impact of climate change on hydrological regime: A review. Arab. J. Geosci. 2016, 9, 544. [Google Scholar] [CrossRef]
  11. Wang, S.N.; Li, J.H.; Pu, J.B.; Huo, W.J.; Zhang, T.; Huang, S.Y.; Yuan, D.X. Impacts of climate change and human activities on the interannual flow changes in a typical karst subterranean river, South China. J. Nat. Resour. 2019, 34, 759–770. [Google Scholar] [CrossRef]
  12. Wang, G.Q.; Wang, X.Z.; Zhang, J.Y.; Jin, J.L.; Liu, C.S.; Yan, X.L. Hydrological Characteristics and Its Responses to Climate Change for Typical River Basin in Northeastern China. Sci. Geol. Sin. 2011, 31, 641–646. [Google Scholar]
  13. Zhang, G.H.; Wang, X.L.; Guo, M.P.; Wu, X.Z.; Zhang, H.Y. The spatial and temporal structure of runoff variation and the climate back ground in the Yellow River basin during the past 60 years. J. Arid Land Resour. Environ. 2013, 27, 91–95. [Google Scholar] [CrossRef]
  14. Ding, X.Y.; Jia, Y.W.; Wang, H.; Niu, C.W. Impacts of climate change on water resources in the Haihe River basin and corresponding countermeasures. J. Nat. Resour. 2010, 25, 604–613. [Google Scholar] [CrossRef]
  15. Wang, K.; Pu, T.; Shi, X.Y.; Kong, Y.L. Impact of temperature and precipitation on runoff change in the source region of Lancang River. Clim. Chang. Res. 2020, 16, 306–315. [Google Scholar] [CrossRef]
  16. Yue, G.T.; Zhu, X.P.; Yang, J.S.; Hu, D.S.; Zhang, A.R. Runoff simulation of Lancun station to Fenhe Erba station watershed of Fenhe River and the impacts of climate change on runoff. China Rural Water Hydropower 2021, 3, 46–52. [Google Scholar]
  17. Zhao, G.J.; Tian, P.; Mu, X.M.; Jiao, J.Y.; Wang, F.; Gao, P. Quantifying the impact of climate variability and human activities on streamflow in the middle reaches of the Yellow River Basin, China. J. Hydrol. 2014, 519, 387–398. [Google Scholar] [CrossRef]
  18. Yin, Y.Y.; Tang, Q.H.; Liu, X.C.; Zhang, X.J. Water scarcity under various socio-economic pathways and its potential effects on food production in the Yellow River Basin. Hydrol. Earth Syst. Sci. 2017, 21, 791–804. [Google Scholar] [CrossRef]
  19. Li, E.H.; Mu, X.M.; Zhao, G.J.; Gao, P.; Sun, W.Y. Effects of check dams on runoff and sediment load in a semi-arid river basin of the Yellow River. Stoch. Environ. Res. Risk Assess. 2017, 31, 1791–1803. [Google Scholar] [CrossRef]
  20. Ren, B.P.; Du, X.Y. Strategy of ecological protection and high-quality development in the Middle Yellow River. Yellow River 2021, 43, 1–5. [Google Scholar]
  21. Zhang, J.P.; Xiao, H.L.; Zhang, X.; Li, F.W. Impact of reservoir operation on runoff and sediment load at multi-time scales based on entropy theory. J. Hydrol. 2019, 569, 809–815. [Google Scholar] [CrossRef]
  22. Feng, Z.H.; Li, Z.B.; Shi, P.; Li, P.; Wang, T.; Duan, J.X. Impact of sedimentation by check dam on the hydrodynamics in the channel on the Loess Plateau of China. Nat. Hazards 2021, 107, 953–969. [Google Scholar] [CrossRef]
  23. Yuan, S.L.; Li, Z.B.; Chen, L.; Li, P.; Zhang, Z.Y.; Zhang, J.Z.; Wang, A.N.; Yuan, K.X. Effects of a check dam system on the runoff generation and concentration processes of a catchment on the Loess Plateau. Int. Soil Water Conserv. 2022, 10, 86–98. [Google Scholar] [CrossRef]
  24. Dey, P.; Mishra, A. Separating the impacts of climate change and human activities on streamflow: A review of methodologies and critical assumptions. J. Hydrol. 2017, 548, 278–290. [Google Scholar] [CrossRef]
  25. Wu, J.W.; Miao, C.Y.; Zhang, X.M.; Yang, T.T.; Duan, Q.Y. Detecting the quantitative hydrological response to changes in climate and human activities. Sci. Total Environ. 2017, 586, 328–337. [Google Scholar] [CrossRef]
  26. Duethmann, D.; Smith, A.; Soulsby, C.; Kleine, L.; Wagner, W.; Hahn, S.; Tetzlaff, D. Evaluating satellite-derived soil moisture data for improving the internal consistency of process-based ecohydrological modelling. J. Hydrol. 2022, 614, 128462. [Google Scholar] [CrossRef]
  27. Liu, Y.; Zhao, W.W.; Jia, L.Z. Soil conservation service: Concept, assessment, and outlook. Acta Ecol. Sin. 2019, 39, 432–440. [Google Scholar] [CrossRef]
  28. Qiu, L.J.; Zheng, F.L.; Yin, R.S. SWAT-based runoff and sediment simulation in a small watershed, the loessial hilly-gullied region of China: Capabilities and challenges. Int. J. Sediment Res. 2012, 27, 226–234. [Google Scholar] [CrossRef]
  29. Yin, J.; He, F.; Xiong, Y.J.; Qiu, G.Y. Effects of land use/land cover and climate changes on surface runoff in a semi-humid and semi-arid transition zone in northwest China. Hydrol. Earth Syst. Sci. 2017, 21, 183–196. [Google Scholar] [CrossRef]
  30. Shi, W.H.; Huang, M.B. Predictions of soil and nutrient losses using a modified SWAT model in a large hilly-gully watershed of the Chinese Loess Plateau. Int. Soil Water Conserv. Res. 2021, 9, 291–304. [Google Scholar] [CrossRef]
  31. Zhai, R.J.; Zhao, W.W.; Jia, L.Z. A comparative study of soil erosion estimation based on RUSLE, InVEST and USPED models: A encase study of the Yanhe River Basin in Northern Shanxi. Res. Agric. Modern. 2020, 41, 1059–1068. [Google Scholar] [CrossRef]
  32. Williams, J.R.; Nicks, A.D.; Arnold, J.G. Simulator for water resources in rural basin. J. Hydraul. Eng. 1985, 111, 970–986. [Google Scholar] [CrossRef]
  33. Arnold, J.G.; Allen, P.M.; Bernhardt, G. A Comprehensive surface groundwater flow model. J. Hydrol. 1993, 142, 47–69. [Google Scholar] [CrossRef]
  34. Servadio, J.; Convertino, M. Optimal information networks: Application for data-driven integrated health in populations. Sci. Adv. 2018, 4, e1701088. [Google Scholar] [CrossRef] [PubMed]
  35. Santhi, C.; Arnold, J.G.; Williams, J.R.; Dugas, W.A.; Srinivasan, R.; Hauck, L.M. Validation of the swat model on a large river basin with point and nonpoint sources. J. Am. Water Resour. Assoc. 2001, 37, 1169–1188. [Google Scholar] [CrossRef]
  36. Meaurio, M.; Zabaleta, A.; Uriarte, A.J.; Srinivasan, R.; Antiguedad, I. Evaluation of SWAT model performance to simulate streamflow spatial origin. The case of a small forested watershed. J. Hydrol. 2015, 525, 326–334. [Google Scholar] [CrossRef]
  37. Wang, J.F.; Li, Y.W.; Wang, S.; Li, Q.; Li, M. Determining relative contributions of climate change and multiple human activities to runoff and sediment reduction in the eastern Loess Plateau, China. Catena 2023, 232, 107376. [Google Scholar] [CrossRef]
  38. Li, Z.; Zhang, Y.F. Spatiotemporal evolution of ecosystem services in the main and tributaries of Weihe River Basin based on InVEST model. J. Soil Water Conserv. 2021, 35, 178–185. [Google Scholar] [CrossRef]
  39. Zhang, W.; Wang, F.C.; Wan, H.L.; Zhang, L.J.; Li, Z.M.; Wang, H.X. Spatiotemporal variations and influencing factors of soil conservation service based on InVEST model: A case study of Miyun Reservoir upstream basin of Zhangcheng area in Hebei. Prog. Geophys. 2022, 37, 2339–2350. [Google Scholar] [CrossRef]
  40. Wischmeier, W.H.; Johnson, C.B.; Cross, B. Soil erodibility nomograph for farmland and construction sites. J. Soil Water Coserv. 1971, 26, 5189. [Google Scholar]
  41. Williams, J.R.; Jones, C.A.; Dyke, P.T. A modeling approach to determining the relationship between erosion and soil productivity. Trans. ASAE 1984, 27, 129–144. [Google Scholar] [CrossRef]
  42. Zhao, X.Y.; Wang, J.F.; Li, Q.; Li, W.J. The function of soil conservation in Beisan River Basin based on InVEST model. J. Shihezi Univ. (Nat. Sci.) 2022, 40, 487–496. [Google Scholar] [CrossRef]
  43. Zhang, C.X.; Xu, J.J.; Wen, J.; Yang, X.B.; Wang, J.H.; Zhao, B. Dynamic simulation of landscape change in the Baiyangdian basin based on the CA-Markov model and MCE constraints. JARE 2021, 38, 655–664. [Google Scholar] [CrossRef]
  44. Wu, J.J.; Tian, Y.Z.; Xu, W.X.; Xiao, Y.; Xie, Y.; Cheng, Y.S. Scenario Analysis of Land Use Change in the Lower Reaches of Wujiang River Based on CA-Markov Model. Int. Soil Water Conserv. Res. 2016, 24, 133–139. [Google Scholar] [CrossRef]
  45. Zhang, L.; Karthikeyan, R.; Bai, Z.K.; Srinivasan, R. Analysis of streamflow responses to climate variability and land use change in the Loess Plateau region of China. Catena 2017, 154, 1–11. [Google Scholar] [CrossRef]
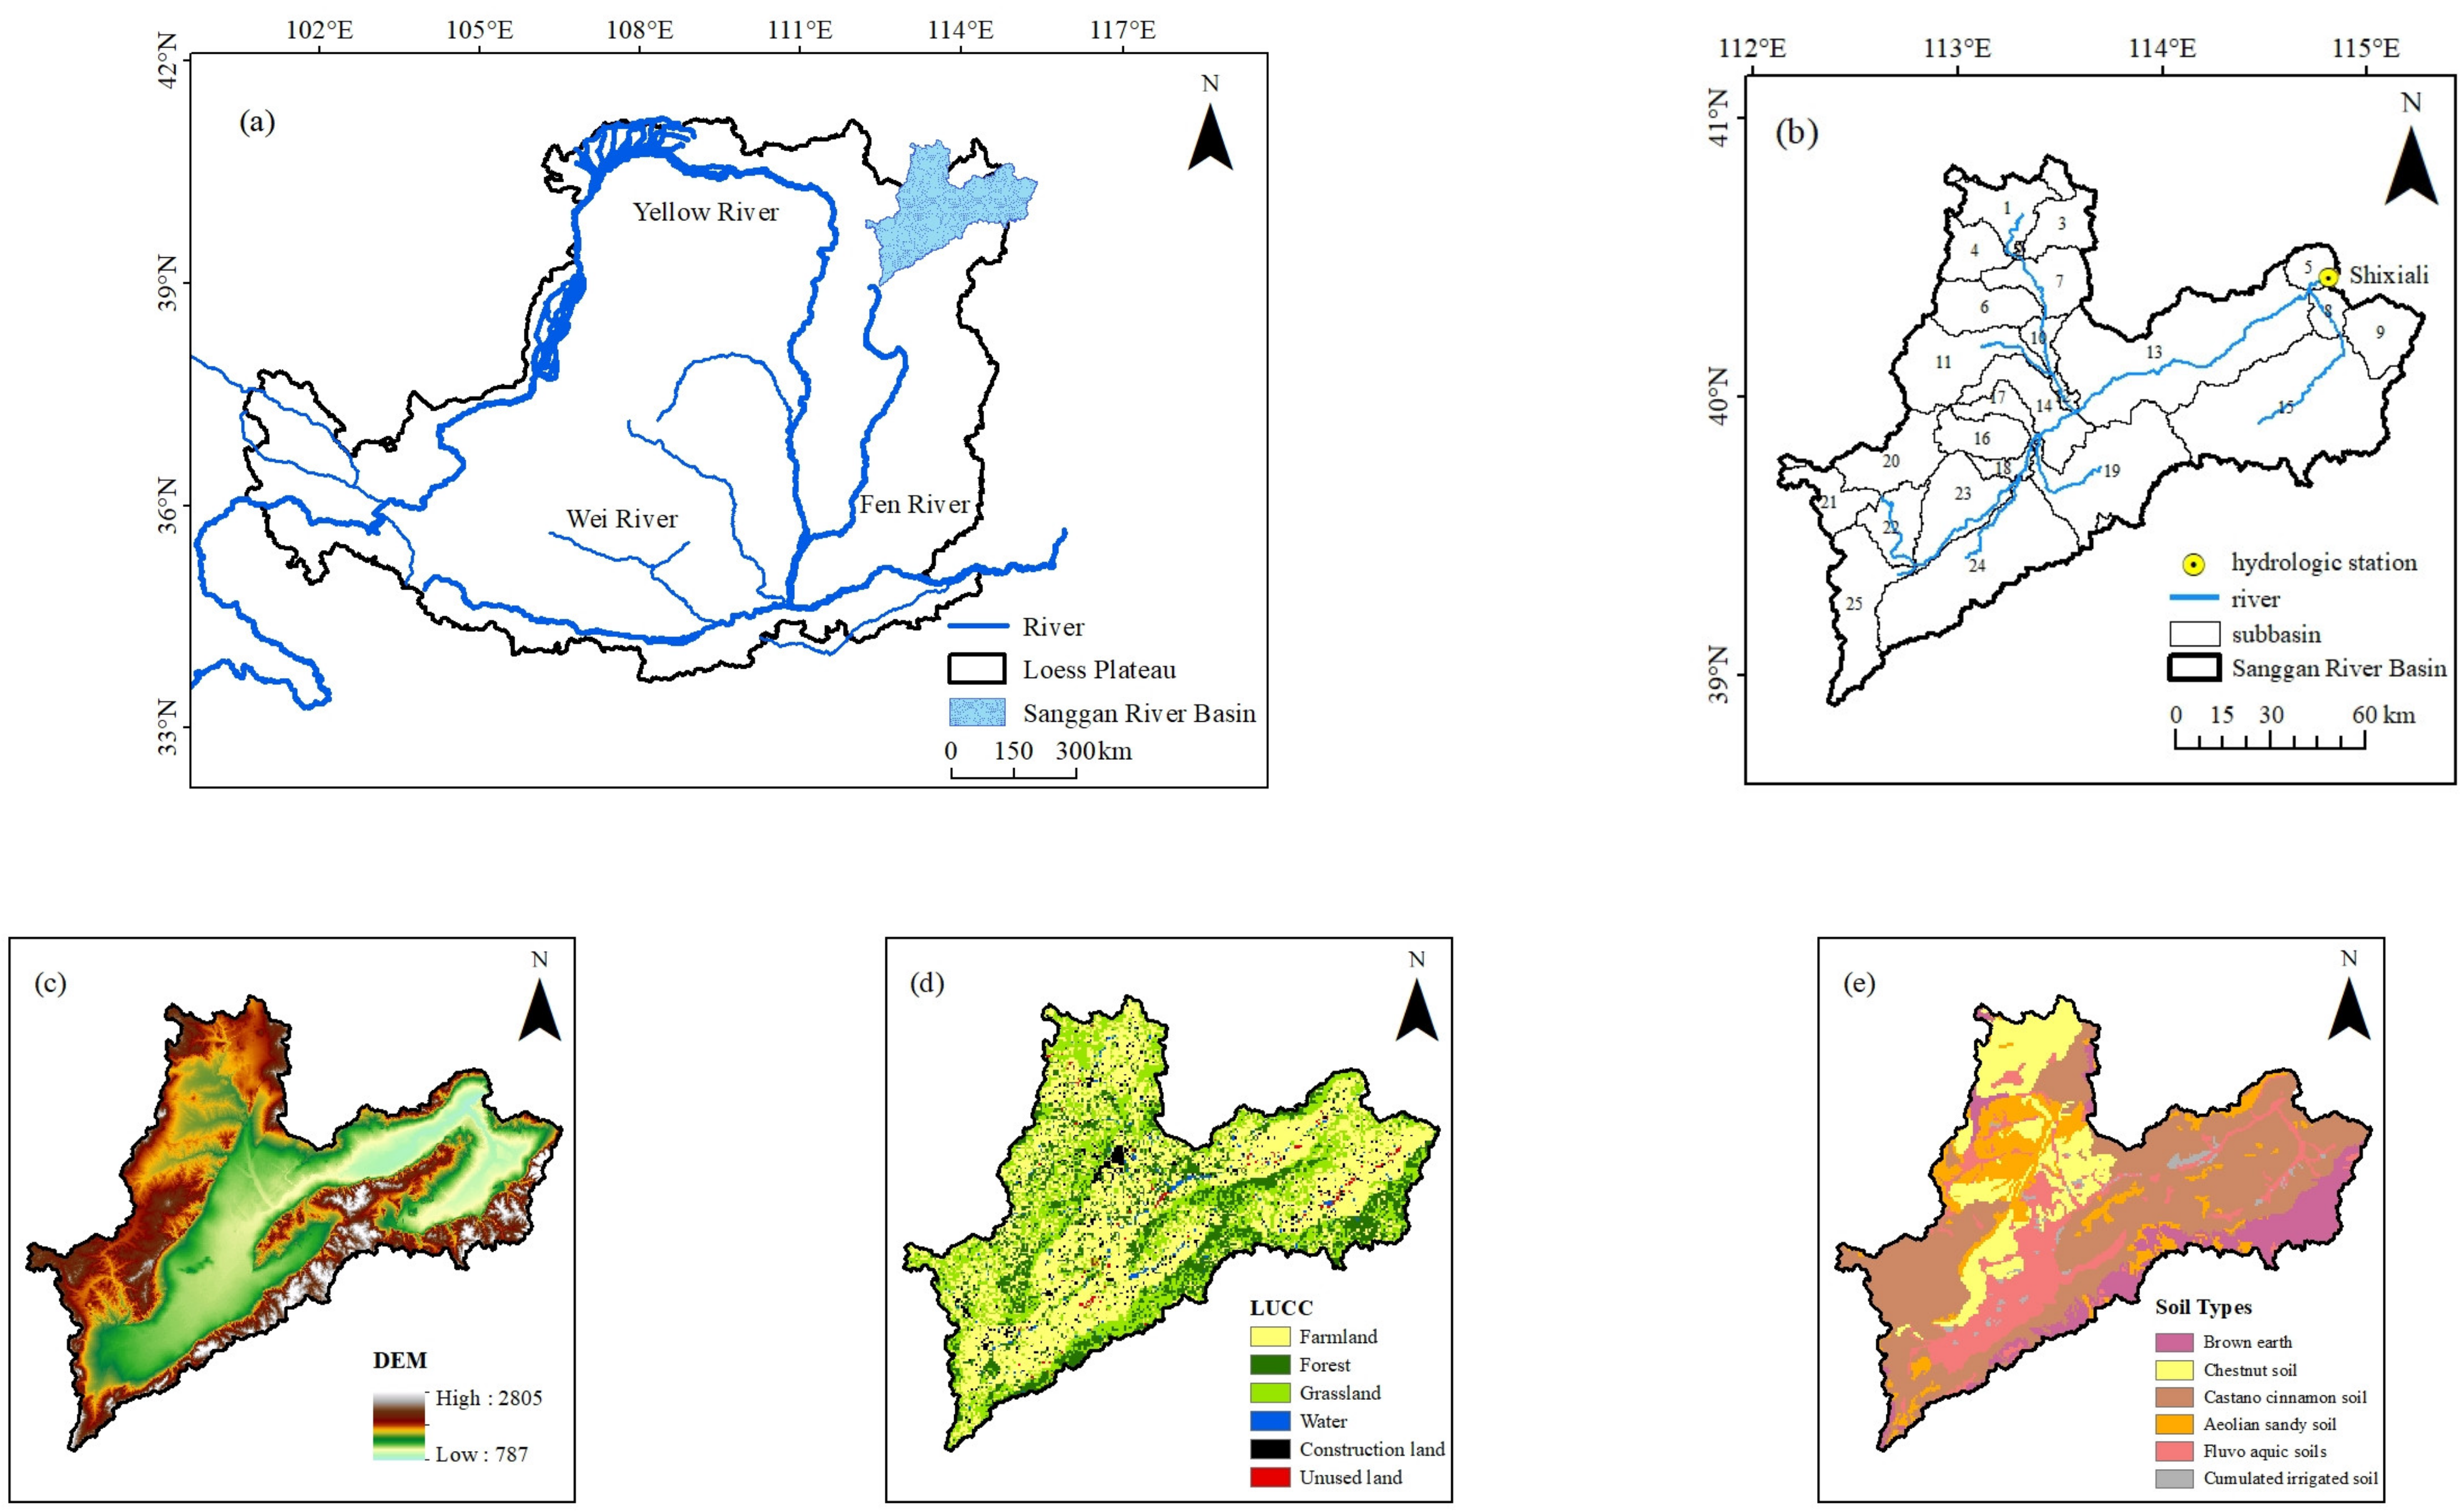
Figure 1. Specific situation of the Sanggan River Basin: (a,b) location, (c) DEM, (d) LUCC, and (e) soil types.
Sustainability 16 01475 g001
Figure 2. Evaluating simulated and observed monthly streamflow and annual sediment at Shixiali hydrological station for different periods.
Sustainability 16 01475 g002
Figure 3. Temporal evolution of streamflow and sediment.
Sustainability 16 01475 g003
Figure 4. Spatial pattern of (a) streamflow and (b) sediment.
Sustainability 16 01475 g004
Figure 5. Double-mass curve of precipitation vs. streamflow and sediment.
Sustainability 16 01475 g005
Figure 6. Impacts of climate drivers on streamflow and sediment.
Sustainability 16 01475 g006
Figure 7. Spatial distribution of (a1,b1,c1) LUCC, (a2,b2,c2) streamflow, and (a3,b3,c3) sediment under (a) natural development, (b) ecological, (c) protection, and urban expansion scenarios in 2030.
Sustainability 16 01475 g007
Figure 8. The check dam number and the silted land during 1984–2014.
Sustainability 16 01475 g008
Figure 9. The annual human water consumption during 1984–2020.
Sustainability 16 01475 g009
Table 1. The detailed information of datasets.
DatasetsInformationTypeResolutionPeriodSources
Meteorological dataThe daily maximum temperature, minimum temperature, precipitation, wind speed, evaporation, relative humidity, and total radiation from 26 weather stations within and outside the Sanggan River BasinTxt (for SWAT)-1960–2020China Meteorological Science Data Center
Raster
(for InVEST)
90 m
Streamflow and SedimentMonthly streamflow and annual sediment data at Shixiali hydrological stationText-1960–2020Hydrological Yearbooks of Haihe Basin
DEMSRTM (Shuttle Radar Topography Mission) dataRaster90 m-Geospatial Data Cloud
Land use/cover dateChina remote sensing monitoring databaseRaster90 m1990, 2000, 2010, and 2020Data Center for Resources and Environmental Sciences, CAS
Soil dataChina soil database (1:100,000)Raster90 m-Soil Information System of China
Check dam dataThe number of check dams and the silted land area of check damsText-1984–2014Shanxi Water Resources Bulletin
Water consumption dataIndustrial, agricultural, urban, and total water consumption in the Sanggan River Basin.Text-1984–2020Shanxi Water Resources Bulletin
Table 2. Relative contribution rates of different driving factors vary in different periods.
PeriodsΔQclimeΔQluccΔQtotal
P0–P1Qclime1+lucc0 − Qclime0+lucc0Qclime1+lucc1 − Qclime1+lucc0Obs1 − Obs0
P0–P2Qclime2+lucc0 − Qclime0+lucc0Qclime2+lucc2 − Qclime2+lucc0Obs2 − Obs0
Note: The study established three climate modes and three land-use modes: clime0 (1963–1982), clime1 (1983–1999), and clime2 (2000–2017) and lucc0 (1990), lucc1 (2000), and lucc2 (2010).
Table 3. The relative C and P for various land-use types.
Land-Use TypesFarmlandForestGrasslandWaterConstruction LandUnused Land
C0.080.0030.0400.0011
P11100.0011
Table 4. Contributions of two driving factors in different phases.
Hydrological ElementsPeriodClimate ChangeHuman InterventionΔQtotal
ΔQclimeContribution (%)ΔQhumanContribution (%)
streamflow/108 m3P0–P1−0.566715.007−3.209884.993−3.7765
P0–P2−0.22514.726−4.538395.274−4.7635
sediment/104 tP0–P1−37.50313.623−237.78286.377−275.284
P0–P2−24.9976.443−362.97793.557−387.973
Table 5. Contributions of three drivers in different phases.
Hydrological ElementsPeriodClimate ChangeLUCCOther Human InterventionsΔQtotal
ΔQclimeContribution (%)ΔQluccContribution (%)ΔQhumanContribution (%)
streamflow/108 m3P0–P1−0.575815.2470.0011−0.03−3.201884.783−3.7765
P0–P2−0.43639.160−0.01010.211−4.317190.629−4.7635
sediment/104 tP0–P1−53.959219.6013.7132−1.349−225.03881.748−275.284
P0–P2−35.41589.128−11.84573.053−340.711587.818−387.973
Table 6. Land-use changes in 1990, 2020, and 2030 under different scenarios.
Land-Use TypesArea/103 km2
19902020Natural Development Scenario in 2030Ecological Protection Scenario in 2030Urban Expansion Scenario in 2030
Farmland11.5011.0710.510.4910.47
Forest3.653.773.873.893.87
Grassland7.317.297.497.497.48
Water0.460.400.480.490.48
Construction land0.81.131.381.361.42
Unused land0.180.240.180.180.18
Disclaimer/Publisher’s Note: The statements, opinions and data contained in all publications are solely those of the individual author(s) and contributor(s) and not of MDPI and/or the editor(s). MDPI and/or the editor(s) disclaim responsibility for any injury to people or property resulting from any ideas, methods, instructions or products referred to in the content.