1. Introduction
Early-stage ventures, commonly known as nascent entrepreneurship, are garnering increasing academic and institutional attention not only for their growth dynamics but also for their potential impact on sustainable economic development. Our study focuses on firms, exploring their growth and sustainability in the entrepreneurial landscape. This is more so in the case of the two main manifestations of firm dynamics, venture creation and growth, as traditionally shown by Gartner [
1], Acs [
2], and Audretsch [
3,
4] and more recently by Singh [
5], Munyo and Veiga [
6], Van Stel et al. [
7], and Prasetyo and Kistanti [
8]. However, financial models traditionally used to assess the potential of projects or conduct due diligence processes often fall short when applied to early-stage firms, which not only lack historical information and current revenue but also face the challenge of integrating sustainable practices from their inception.
The increasing emphasis on sustainability, stressed by the literature and policymakers, advocates for aligning with the United Nations’ Sustainable Development Goals (SDGs) as a collaborative framework involving governments, the private sector, and society [
9,
10,
11]. This study explores the impact of experienced management teams on the development of the firm. This study also represents a first step towards a new methodology to conduct the analysis of sustainable management practices within entrepreneurial firms, particularly adopting Environmental, Social, and Governance (ESG) practices, despite current data limitations. Concurrently, it examines firm growth sustainability, identifying resilient growth patterns as crucial for long-term profitability.
Wahl [
12] introduces the concept of regenerative cultures, advocating for a shift beyond traditional sustainability towards maximizing positive environmental and societal impacts. This concept aligns with the efficient resource use ethos [
13] and suggests that embracing regenerative practices could pave the way for achieving the SDGs more resiliently [
14]. This dual focus on sustainable management and the potential of regenerative cultures underscores the necessity of integrating these approaches into business growth strategies, highlighting the interconnectedness of environmental stewardship, social transformation, and sustainable entrepreneurship for long-term success.
In The Theory of the Growth of the Firm (TGF), Edith Penrose (1959) [
13] asserts that growth is limited by managerial resources, a concept highlighting the importance of strategic decision making for expansion. Integrating sustainability into these decisions poses an additional challenge for managers in balancing growth objectives with sustainable practices. In this context, any effort to predict which early-stage projects may, at some point, become relevant high-growth firms (HGFs) [
15,
16] appears even more dubious. Such firms, as defined by the Organisation for Economic Co-operation and Development (OECD), are those achieving an average annualized growth exceeding 20% per year in employee numbers over a three-year period and with ten or more employees at the beginning of the observation period [
17,
18]. This definition combines both relative and absolute rates of employment expansion. The growth paths of early-stage firms present a paradox, where the need for rapid growth may conflict with sustainable practices, especially in the initial stages, where survival is paramount (as emphasized by the concepts of liability of newness and size). As firms mature, the dynamics between growth and sustainability evolve, underscoring the need for a stage-sensitive understanding of their development.
Extremely low survival rates and highly variable growth rates among early-stage firms are common empirically observed outcomes. In addition, only a low percentage of projects qualify as HGFs, generating most of the growth in terms of revenues and employment. Moreover, understanding the causes underlying these patterns is of paramount importance in the field of entrepreneurship [
19]. The so-called Gibrat’s law, which states that the growth of a company in any given period is random and independent of its size, has enjoyed the considerable support of scholars. However, as posited by Segarra and Callejón: “it is now a well-established empirical fact that Gibrat’s Law does not hold, at least, for small new entrants” [
20]. In this context, a better and more sophisticated understanding of the processes that this type of venture undergoes during its initial phases would allow for more accurate predictions and, thus, improved resource allocation by both private and public entities.
In the last two decades, there has also been a growing consensus about the limits to plausibly understanding firm dynamics within the current level and unit of analysis [
4,
21,
22,
23,
24,
25]. This has prompted a review of the research agenda and triggered a new revenue of research in which new methodologies and sources of information contribute to expanding our understanding of the complex dynamics underlying the growth of new businesses.
Within this expanding area of research, a growing corpus of academic production has emerged over the last fifteen years exploring specific aspects of the growth of early-stage firms. We elaborate, among others, on the general work of Delmar [
22] that “There appears to be some kind of order in how a firm grows, and therefore, a potential for gaining a deeper understanding of how high firm growth occurs”.
Moreover, we also find there is a fundamental and solid public policy interest and justification for our broad research area (Reynolds et al., as cited in Stam, Suddle, Hessels, and Stel [
26]) and, more recently, in public policy developed for our specific object of study [
27].
Finally, an even stronger justification supporting the interest in this line of research is the fact that there is awareness among scholars regarding some of Penrose’s unanswered questions and alternative lines of research, but there are no satisfactory answers to date. According to Kor and Mahoney [
28], “in order to find comprehensive and rigorous answers to the questions Penrose [
13] posed concerning firm growth processes, more conceptual and especially empirical research needs to be done on the dynamics of growth, that is analyzing the paths and the effects on the outcome of different sequences in the growth process” [
29].
Despite this interest and the presence of traditional unexplored questions, most of the available research is limited, as the majority of studies use a geographically concentrated or an industry-specific sample [
22,
30,
31,
32,
33]. Our aim is to identify general or specific growth patterns based on a global dataset produced through surveys by the World Bank, with over 140,000 entries comprising over 350 relevant variables in which the unit of analysis is the firm.
Our findings indicate that specific growth patterns often align with particular regional or sectoral contexts. Our analysis of the data from the WBES dataset suggests that while theoretical models like those of Garnsey and Audretsch offer valuable conceptual frameworks, the actual data do not fully align with these models. This indicates that the models for understanding this phenomenon remain largely theoretical. Moreover, the analysis underscores that during their expansion, firms with experienced management teams not only see growth in employee numbers but also maintain efficiency gains. This dataset is one of the largest and most rigorous available sources of information spanning multiple countries and providing data at the firm level rather than industry- or country-level aggregated information. The global representativeness of these data helps with the identification of broad universal growth patterns in early-stage firms. By using this dataset in our study, we aim to uncover findings that are universally applicable, avoiding the limitations of regional or sector-specific data. Therefore, while our main objective centers on leveraging this dataset to understand the diverse growth patterns of early-stage firms across various developmental contexts, we acknowledge that this research could be extended to explore how these growth patterns intersect with sustainable business practices.
As a consequence of firm growth being a multi-faceted object of study, theoretical construction in this area has evolved in an unusual multilinear sequence over the last five decades. Several alternative and fragmented theories spanning different areas and disciplines have arisen, most of them somewhat linked to the contributions of Penrose. Among the most notable developments, the resource-based view of the firm (RBV) is probably the one receiving the most widespread recognition among scholars.
Not only for our research but also for a considerable group of scholars and practitioners, one of Penrose’s most remarkable ideas is the fact that “history matters”. In other words, growth is path-dependent. We rely heavily on this view to support the importance and appropriateness of our research as well as the used methodology.
Our contribution to the literature consists of a set of theory-testing analyses. We observe an empirically based set of growth patterns associated with early-stage firms. In the previously available taxonomies, clusters are identified with sometimes unclear meaning and similar constituent features. We aim to extend upon this theoretical body by linking business clusters with identifiable growth patterns or trajectories.
The presence of abundant data points, as well as the nature of the object of study, may suggest that a quantitatively intensive approach should be used. However, given the limitations of the available data and the more modest goal of this analysis, exploratory data analysis techniques and data visualization processes are mostly used instead. To complement these techniques, we introduce a first set of machine learning techniques in order to enhance the predictive capacity of growth models. Our approach is aligned with the growing trend of applying machine learning across various fields, as evidenced by the work of Sharon and Rousseau in 2024 [
34]. Their study demonstrates the effective use of machine learning even with smaller datasets, highlighting the versatility and expanding the applicability of these techniques in different research contexts. In deciding to avoid the complexities of econometric modeling, we follow the classical study of Pavitt in the field of innovation, in which excellent results were obtained also without relying on econometric modeling [
35]. Although we focus on predictive analysis, our study is informed by Shmueli’s [
36] comprehensive examination of both explanatory and predictive methods. He highlights the critical importance of predictive modeling in research, noting its capability to reveal new causal links, refine existing models, and serve as a crucial reality check for theoretical applications. This significance is exemplified in Svanberg’s (2022) [
37] application of machine learning for governance prediction within Environmental, Social, and Governance (ESG) frameworks, illustrating the impactful use of predictive analysis in contemporary research settings. Similarly, Chandler [
38] provides further justification as to why a more clean and simple approach could be desirable when modeling venture performance.
New venture growth is a phenomenon with a manifest and significant degree of intrinsic variability. Chandler acknowledges the limited potential to both observe significant effects and explain a large part of venture growth variability: “Even comprehensive models rarely explain large proportions of the total variance in venture performance. This may occur because the models are not adequately specified, there is error in measurement, there is inherent randomness, or a combination of the above” [
38]. Moreover, the range of theoretically possible growth patterns that any given new venture could follow is very diverse and has been considerably well theorized since the 1990s [
39].
Therefore, the goal of this investigation is to find empirical evidence to explore which of the theoretically possible growth trajectories emerges more frequently and characterize the results obtained in each case in terms of firm growth, regardless of the operationalization used. In particular, our driving research questions focus on testing theories related to firm growth, particularly in the context of Penrose’s TGF and the conceptual models of Audretsch and Garnsey. This study makes the following contributions:
Our study aims to empirically test whether potential firm size is unlimited while growth rates are bounded, as TGF posits.
Additionally, we assess the hypothesis that effective management can drive growth with an examination of the relationship between management teams and firm growth.
Similarly, this study helps in validating and challenging existing theories and evaluates the theoretical paths described by Audretsch and Garnsey, which conceptualize different growth trajectories for new firms.
We provide additional evidence to support certain theoretical claims, such as the important role of the stage of development or the apparent limit to growth rates.
In addition, we find counterintuitive indications of the lack of a relationship between labor cost, as a proxy for the quality of the labor force, and firm growth.
By tackling an uncharted object of study, we contribute to consolidating understanding of the new firm dynamics and deepening the current descriptive and predictive capacities available for both academics and practitioners alike.
This paper is structured as follows:
Section 2 provides the theoretical framework, and
Section 3 delineates the data sources, preparation, and research methodology of this study. Next, in
Section 4, we present the results as a set of three stylized facts. Finally,
Section 5 highlights the conclusions drawn from this study, limitations, and potential applications, as well as future lines of research that could emerge if the methodology used in our analysis were to be continued and improved.
2. Theoretical Framework
Firm creation is an inherently social activity, and organizations are social constructions [
40]. Yet, entrepreneurship is a multidimensional concept, and to further develop this concept and the field, multidisciplinary research including psychology, anthropology, sociology, law, and economics should be considered [
41]. Thus, with generalization being the main driving force of our study, we cannot exclusively rely on descriptive and fragmented conceptualizations of the phenomenon of firm creation. We embrace a comprehensive approach and a holistic understanding of firm growth and, therefore, draw on the concept of ecological validity, understood in the context of our analysis as the “ability to generalize a study’s findings to the specific people and circumstances of interest to entrepreneurship research” [
42]. Moreover, as posited by Terjesen et al. [
43]: “It is easier to claim generalizability when results are confirmed across different national contexts”, and this is part of the reason why, as we explain in the next section, we decided to use the WBES dataset.
The study of firm growth, and more specifically, of HGFs, suffers from existing fragmentation regarding the conceptualization and operationalization of key concepts within the field of entrepreneurship. Different measures of growth and growth patterns are classic examples of this lack of consensus [
15]. Given the critical role that the selection of variables plays in our analysis, we elaborate more on this issue in the next section. As of June 2023, data from the Web of Science (WoS) core collection shows that over 90% of the academic publications related to firm growth were published in the 21st century.
Within the field of firm dynamics, Penrose’s work, in particular, her work The Theory of the Growth of the Firm [misspelled in the original] (1959), represents the most influential contribution to date. For details about the controversy regarding the influence of Penrose’s work in the development of the resource-based view of the firm (RBV) and its contribution to a better understanding of firm performance, see Kor and Mahoney [
28] and Rugman and Verbeke [
44].
Particularly relevant for our analysis is the distinction that Penrose proposes between two different approaches to the firm size concept. We build on the “growth approach”, in which firm size is considered a consequence of the growth process, and growth is considered dependent on human motivation. As will be made clearer in the next section, equally pertinent for our analysis—for the emphasis placed on managerial resources and for the focus placed on growth—is Penrose’s consideration that while the growth of a firm is limited by its capacity to make use of managerial capital, there is no practical limitation to the size a specific firm may achieve. This constraint, related to the capacities of a firm’s management, is known as the Penrose effect. This Penrose effect and the Penrosean understanding of growth is even more important when considering strategic diversification and internationalization, especially after including other forms of growth that differ from organic growth, such as mergers and acquisitions [
13]. In line with Penrose’s insights on the importance of managerial capabilities in determining firm growth, this concept is further validated by recent research. This is exemplified in the study by Rahoo et al. in 2023 [
45], which examines how entrepreneurial skills and information technology competence collectively influence business success. The findings underscore the critical role of management team capacities in navigating business growth, especially in the context of rapidly evolving technological landscapes, reinforcing the relevance of the Penrose effect in contemporary business environments.
Other than Penrose’s classical contributions, diverse general studies about growth have been developed, including Gibrat’s law from the 1930s [
46], a widespread and fundamental law for understanding growth distribution in consolidated businesses. Although there is a vast academic corpus on Gibrat’s law, supporting or partially refuting it, plenty of recent research continues to refer to the different expected outcomes based on its predictions [
23]. In addition, a variety of lines of research focusing on different manifestations of the phenomenon have emerged over the years. Some of these manifestations on which research has started to focus include high-growth, early-stage, knowledge-based, or industry-specific ventures, to name a few.
For competing—sometimes considered complementary—approaches to Penrose’s views, see Baumol (1959), Williamson (1964), and Marris (1964), all as cited in Thompson and Wright [
47]. Not exempt from criticism, mainly in relation to oversimplified assumptions, Marris, in his work, proposes a model in which the interests of managers and owners of a firm are aligned to achieve balanced growth, establishing a clear agency role for top management when making strategic decisions.
However, a fundamental and more specific research stream has been evolving over the last two decades, with some of the main contributions covering the theorization of early-stage firms. These works include the application of Penrosean views to the case of early-stage firms, where different possible paths are exposed in relating assets of the firm to its size and its evolution along the time
x-axis as a representation of growth [
39], exploring early growth processes and paths [
29], or studying the different evolution trajectories for new firms [
4]. Garnsey also underlines the importance of growth paths and builds on Penrose’s ideas in doing so. See, for example, [
39].
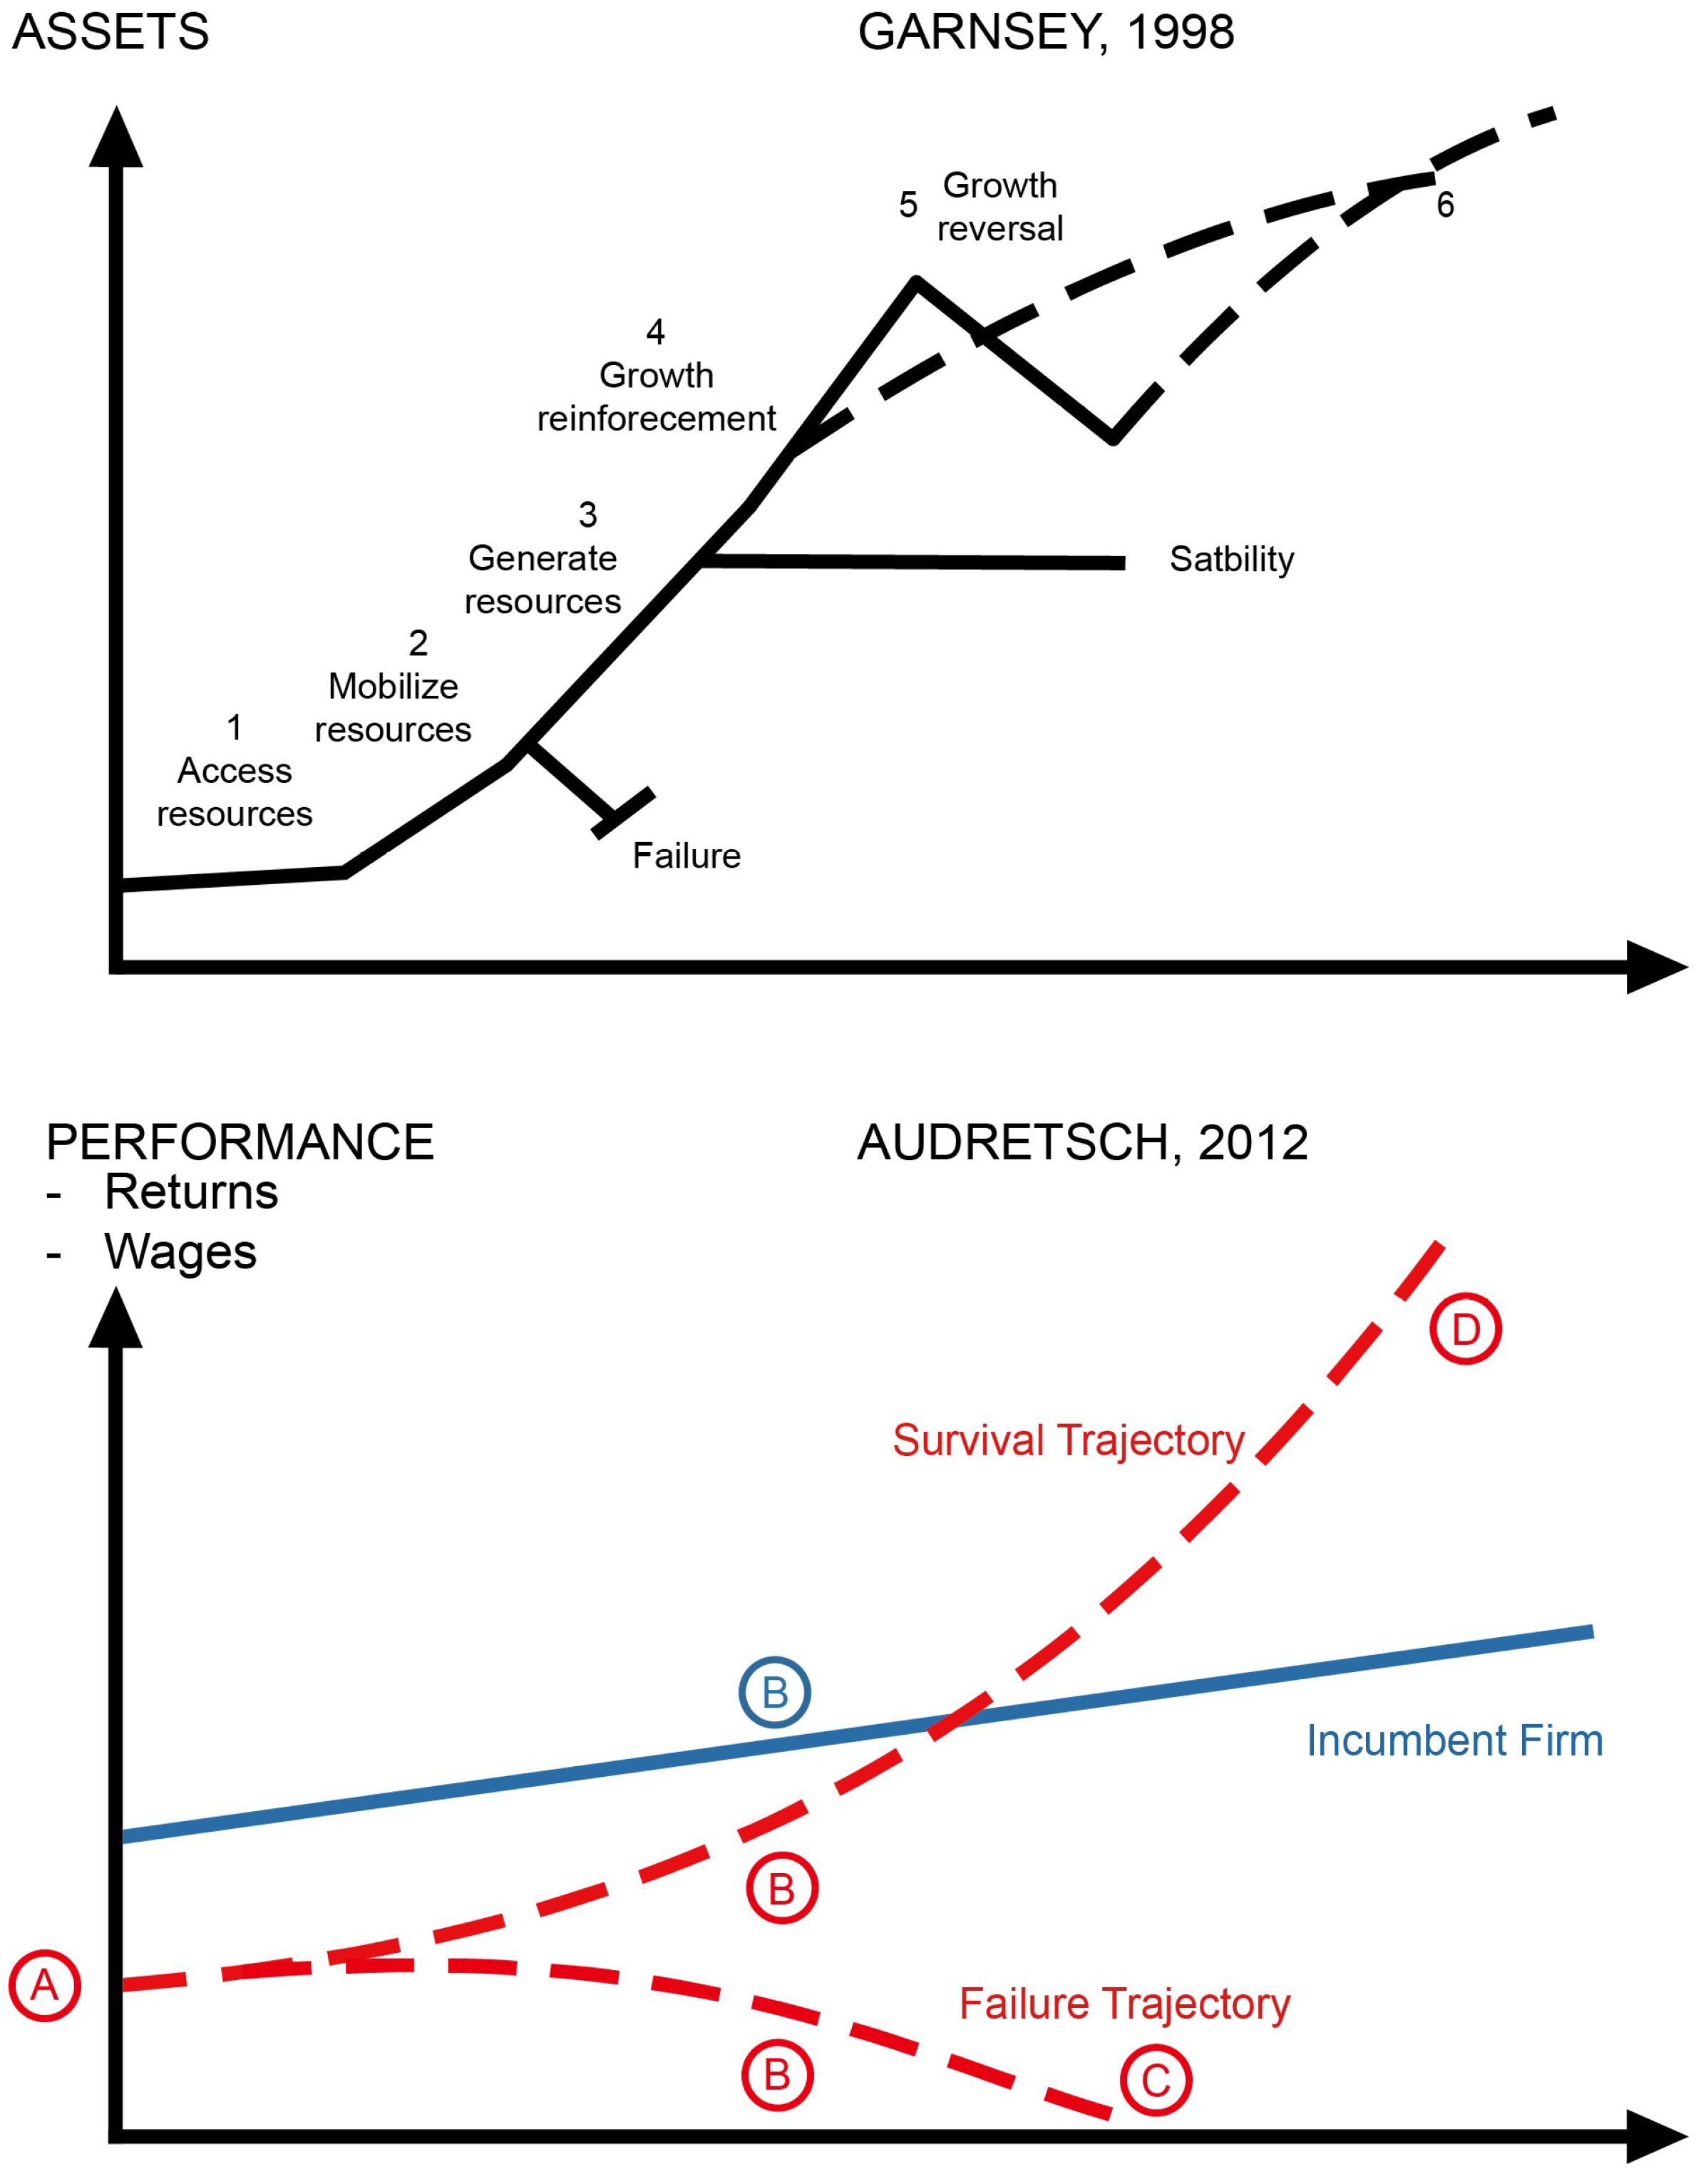
In
Figure 1, we include the original diagrams from Garnsey and Audretsch to reveal the differences in their approaches, not only in terms of the variable selected for studying its evolution but also to emphasize the different scope and level of detail used in each case. Audretsch measures the evolution of firm performance and distinguishes different patterns depending on the final reached outcome, be it survival, failure, or stable growth, whereas Garnsey relies on the evolution of assets and identifies a more varied number of potential trajectories. “Case study evidence on the internal dynamics of growth suggests that there are three more common scenarios: early failure; an early growth plateau once resource generation is achieved; and growth reversal following early expansion” [
39].
3. Data and Research Methodology
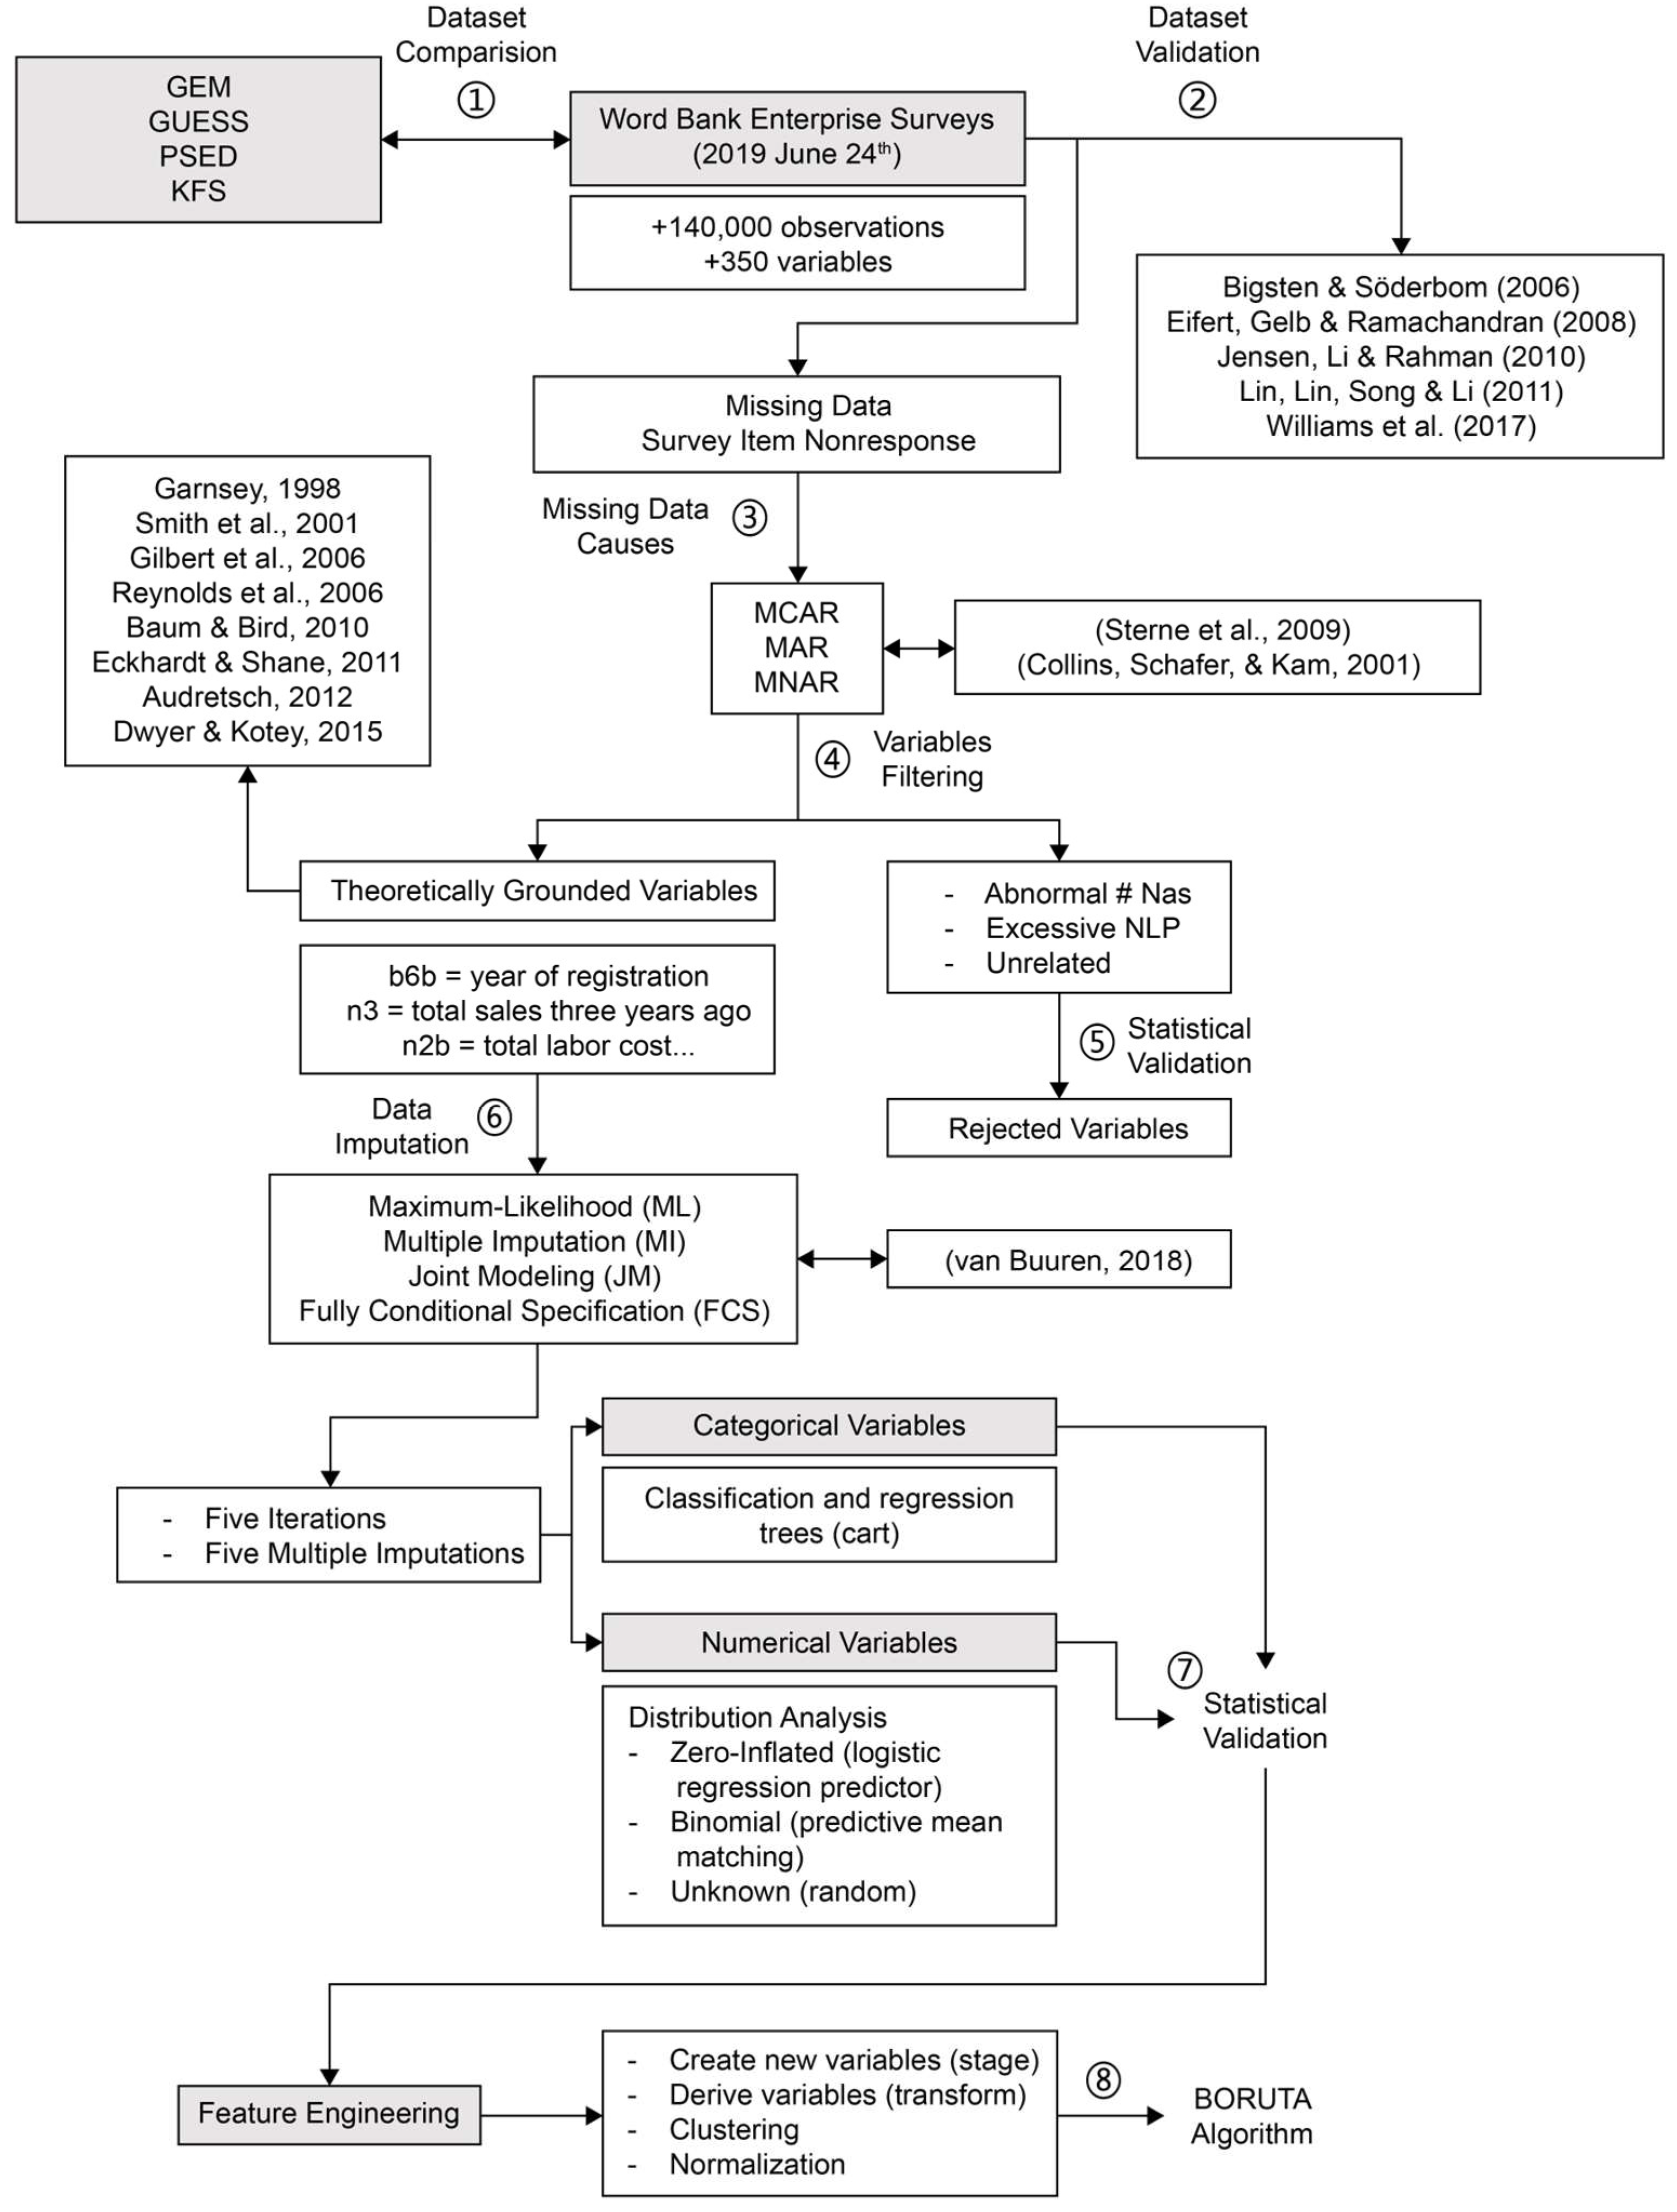
In this section, we explain the data sources, the process of preparing the data, and their treatment and manipulation. We used R (R version 3.6.1 (2019-07-05)—“Action of the Toes”) [
48] for the entire analysis. Graphical materials were produced using the ggplot2 package [
49]. The complete workflow related to it is shown in
Figure 2.
The data source we used for the analysis is the 24 June 2019 version of the comprehensive standardized dataset from the Enterprise Surveys project of the World Bank. The raw data contain over 140,000 entries and over 350 standardized variables, not including country-specific questions available in certain countries. The content for this dataset was obtained through face-to-face interviews with business owners and top managers, differentiating between manufacturing and services firms. The firms were selected through a stratified random sampling procedure that was conducted by independent contractors to guarantee the independence and anonymity of the replies. The dataset, covering 155 countries, provides a comprehensive snapshot for cross-sectional analysis. The standard indicators for the Enterprise Surveys are calculated using a consistent set of questions across countries and time and are therefore reliable benchmarks. Most variables in the dataset refer to the previous fiscal year, with some extending three years prior, and others, like the incorporation date, reaching even further back. This temporal span enriches the analysis with both current and historical perspectives on enterprise dynamics. Given its potential impact on the results, we incorporate an analysis of corruption in the replies recorded in the World Bank Enterprise Surveys in different countries [
55].
“The sampling frame is derived from the universe of eligible firms, normally obtained from the country’s statistical office or another government agency such as the tax or business licensing authorities. Since 2006, all national surveys explain the source of the sample frame. To deal with nonresponse, the sampling strategy factors in a 25% nonresponse rate per stratum, so that there are sufficient valid responses to compute performance indicators with the required precision level” [
59].
In addition to considering the rigor provided by the preparation process and the institution from which the dataset originates, we note that the same dataset and similar country or industry datasets obtained from the same World Bank project have been used in a variety of studies, generating a considerable research stream. Bigsten and Söderbom [
51] analyze research conducted on firm performance in different African countries, based on a prior version of the surveys from the nineties. Eifert, Gelb, and Ramachandran [
53] also use data from the World Bank Enterprise Surveys in African countries to study how indirect costs impact performance assessments of African manufacturing firms. The abovementioned work of Jensen, Li, and Rahman [
55] also contributes to a better understanding of how the political environment influences and even constrains firm development in certain countries with a high level of corruption. Lin, Lin, Song, and Li [
56] use a subset of over one thousand Chinese manufacturing companies to study innovation performance and its relationship with managerial incentives. More recently, Williams et al. [
59] used WBES data to explore the relationship between firm registration at an early stage in developing economies and their subsequent achieved growth.
Each of these datasets differs. For example, Z.J. Acs, Desai, and Klapper [
60] underline the following differences between WBES and GEM data in the conclusions of their comparative analysis:
- –
“First, the GEM data tend to report significantly lower levels of early-stage entrepreneurial activity in developed countries.”
- –
“Second, the GEM data tend to be higher for developing countries than for developed countries.”
Other differences worth highlighting are those between the WBES and PSED. “PSED is a longitudinal study in which individuals remain over the years and are interviewed at regular intervals. The aim is to obtain information about the characteristics of the process, the population involved in new firm creation, and the activities and attributes of the nascent firms” [
61].
Given its scholarly acceptance and unique composition, including variables on workforce composition (full-time, part-time, male, female, etc.), management practices, governmental interactions, and ownership types, the WBES dataset stands out as the optimal choice for our study. Its diverse variables offer a rich ground for analyzing not only growth patterns but also their implications in the realm of sustainable practices in early-stage firms.
In its original form, the dataset has multiple missing values as well as other issues related to the quality of the data that require specific treatment. “Missing values are part of the more general concept of coarsened data, which includes numbers that have been grouped, aggregated, rounded, censored, or truncated, resulting in partial loss of information” [
62]. Since the late eighties, with the classical reference of the book Statistical Analysis with Missing Data by Little and Rubin [
63], the shortcomings of case deletion and single imputation methods have become clear, and more sophisticated methods have since been introduced. From a survey methodological standpoint, there is only item nonresponse present in our dataset, which means that at least partial data are available for all entries.
Exploratory analysis of our missing data suggests that no specific pattern is present. “Reasons for missing data are commonly classified as: missing completely at random (MCAR), missing at random (MAR), and missing not at random (MNAR)” [
58]. This, together with the lack of a definitive method to evaluate whether the missing-at-random hypothesis holds in a dataset and the minor impact expected on estimates and standard errors [
52,
64], lead us to confidently proceed with the analysis without further attention to causes of or patterns in missing data.
Our first step, however, was to remove variables with an abnormal percentage of missing values before performing any type of imputation or analysis, wherein we used the commonly accepted threshold of 20% within a conservative flexible approach. We did not apply this filter to variables that were either strongly theoretically grounded or could be rigorously reconstructed. Examples of such variables are b6b (year of registration), n3 (total sales three years ago), and n2b (total labor cost). In this phase of the analysis, we built on a large academic corpus, including [
4,
19,
23,
25,
39,
50,
54,
57], among others.
In this study, we removed certain qualitative variables due to their need for extensive manual processing or advanced natural language processing (NLP) methods such as Name Entity Recognition (NER) or Sentiment Analysis. However, NLP could be utilized to analyze these variables in future research, particularly those related to such aspects of sustainability as workforce diversity and management practices, thereby providing a more nuanced understanding of sustainable practices in early-stage firms. Finally, we also removed variables that, to the best of our knowledge, were not based on any theoretical foundation nor had any apparent relation to the goal of this study. Such variables can introduce noise and potentially lead to spurious correlations, affecting the integrity of the results, but are typically easy to identify. In any case, we were extremely cautious to remove only those that were clear to all of us. Examples of these variables include overly specific indicators such as “the amount the company spent security as a percentage of sales”, or “duration of a typical electrical outage (in hours)”. By removing these, we aimed to maintain a focused and relevant dataset for our analysis. We double-checked all these exclusions by conducting a preliminary significance test and avoided omitting variables that could be relevant to the results. In the different subsets we used for the next steps, we removed over 80% of the initially available variables in the questionnaires, leaving 36 preliminary variables.
Next, we addressed the missing data to reduce the likelihood of its negative impacts including inflation of Type I and Type II error rates, degradation of the performance of confidence intervals, and reduction of statistical power [
52]. We considered the most rigorous, robust, and commonly used data imputation procedures and decided to use a multiple imputation system of chained equations as in Williams et al. [
59]. Moreover, “Multiple imputation is now accepted as the best general method to deal with incomplete data in many fields” (van Buuren, 2018 [
65]). The chained equations imputation model should: “account for the process that created the missing data, preserve the relations in the data, and preserve the uncertainty about these relations” [
66]. “Multiple imputation creates m > 1 complete datasets. Each of these datasets is analyzed by standard analysis software. The m results are pooled into a final point estimate plus standard error by pooling rules (“Rubin’s rules”)” [
65]. We used the mice (multivariate imputation by chained equations in R) package in R [
67] to perform the imputation process. More advanced and recent reviews are discussed in Salfrán et al. [
68] but are beyond the scope of our study. For details about different missing data imputation procedures such as Maximum Likelihood (ML) or Multiple Imputation (MI) see [
52,
69,
70,
71,
72,
73]. For details about other methods such as Joint Modeling (JM) or Fully Conditional Specification, see van Buuren [
74].
Data imputation was performed with 5 to 10 iterations and 5 to 10 multiple imputations to account for the potential variability introduced by the data imputation process. For categorical variables, we used a method based on classification and regression trees (cart). For numerical variables, we first analyzed the distribution of each individual variable and classified them into one of the following “categories” depending on the type of distribution the variable approximates: zero-inflated (i.e., workers_y0), binomial (national_sales, direct_exports, etc.), and unknown (i.e., total_sales_1y, temporal_workers, cost_production, etc.). A relevant point is that none of the variables seemed to approach a normal distribution. For variables in the zero-inflated category, we used a logistic regression predictor. We used predictive mean matching for binomial variables and random imputation for the variables whose distribution we could not determine. We checked the final output for inconsistent distributions or alterations in statistical properties and found the resulting dataset to be valid for continuing the analysis.
We performed one last set of steps within the data preparation process, all of which were related to the creation of a wider set of potential predictors (variables) that we then filtered and selected using an embedded method in which feature selection and model fitting are conducted simultaneously by means of a feedback mechanism. These steps included:
- –
Creation of new variables such as a categorical variable with the level of development. This concept of “level of development” varies across different organizations such as the IMF (the criteria have evolved significantly and are used for operational and analytical purposes), the United Nations (based on the Human Development Index), and the World Bank (four income groups). Each uses its own criteria and methods to categorize countries. For our study, we specifically utilized the classification provided by the World Economic Forum (WEF), where countries are classified into five groups (factor-driven, efficiency-driven, and innovation-driven, as well as two transition groups). Moreover, categorical variables are created by clustering the observations according to the variable age, where age is calculated as the difference between the year of the interview and the year in which the firm was registered;
- –
Mathematical derivation of new variables (i.e., growth ratio for variables where values in two moments in time were available, per capita indicators such as sales per employee, etc.);
- –
Aggregation of variables obtained with clustering (k-means and hierarchical clustering) and validated via the silhouette index, Dunn index, and connectivity index for different values of k;
- –
Normalization of variables so that they provide information about the relative situation of an observation when compared with the within-group averages.
Aside from the previous steps, since all monetary variables in the survey are expressed in local currency units (LCUs), we standardized these variables considering the average exchange rates for each country and year. These exchange rates were meticulously compiled from a variety of official sources, given the complexity of covering multiple countries and spanning several years. Our sources included internationally recognized institutions such as the International Monetary Fund (IMF), the World Bank, and various Central Banks, ensuring the accuracy and reliability of the exchange rate data used in our standardization process.
During the exploratory stage, we performed pairwise comparisons for all the possible combinations of the available variables. We also used different standard techniques such as regression analysis, necessary condition analysis (NCA), clustering, etc., to inform the process of variable selection and pattern discovery.
Finally, for the evaluation and selection of the variables, we utilized the Boruta algorithm, which excels in identifying all relevant features by comparing them against randomized shadow features, ensuring a comprehensive and robust selection. This algorithm, building upon the random forest classification framework, is especially effective in complex datasets, such as the one used in our study, where identifying influential variables is critical. Lastly, we conducted a correlation analysis to verify the robustness of the obtained results, which contributed to the identification of the relevant variables.
The reason we decided to follow this exploratory and experimental methodological approach is threefold: (i) As we mention elsewhere in this paper, most traditional attempts to model the phenomenon object of this study suggest that only a small proportion of the variance can be explained. Thus, limited or zero predictive capacity is to be expected. (ii) Following traditional works, our initial approach is to use a method most likely characterized as inductive. (iii) In contrast to the majority of the academic corpus that we use as a foundation for this research, our study is concerned with theory testing. This does not imply that our findings cannot represent a solid starting point for new theory building; however, those attempts are one of the main future lines of research we hope to address.
4. Results and Discussion
The exploratory and inductive nature of our study leads us to structure the results section as a series of stylized facts. In this context, we acknowledge a certain degree of survivor bias inherent in our dataset, which arises because the World Bank’s data collection process only interviews active businesses, excluding those that have ceased operations. Survivor bias refers to the potential distortion in data analysis caused by focusing only on surviving subjects, overlooking those that did not endure. However, we believe this bias does not significantly impact our goal of describing growth patterns. Our focus is on characterizing these patterns rather than determining causes for business survival or failure. The comprehensive nature of the dataset, encompassing a vast array of observations across various stages and ages of businesses, ensures that a broad spectrum of growth trajectories is captured, thus providing a balanced representation of business development stages. Following the procedure described in the previous section, we attained a set of 36 primitive variables. Later on, we added a series of derived and transformed features, which in itself represents a contribution of our study because it serves as one of the applications of predictive modeling mentioned by Shmueli [
36]: “discover new measures as well as to compare different operationalizations of constructs”.
Where possible, among the different alternative measures used in the literature to operationalize firm size and growth, and since most of these measures are highly correlated, we favored the number of employees for at least three important reasons: (1) we consider that employment is a better measure of the real impact that firms have on society; (2) employment is less affected by exchange rates, currency fluctuations, and other monetary anomalies that could affect the comparability of, for example, sales data, and (3) it belongs to the group of variables normally used, some of which are not available in the WBES dataset.
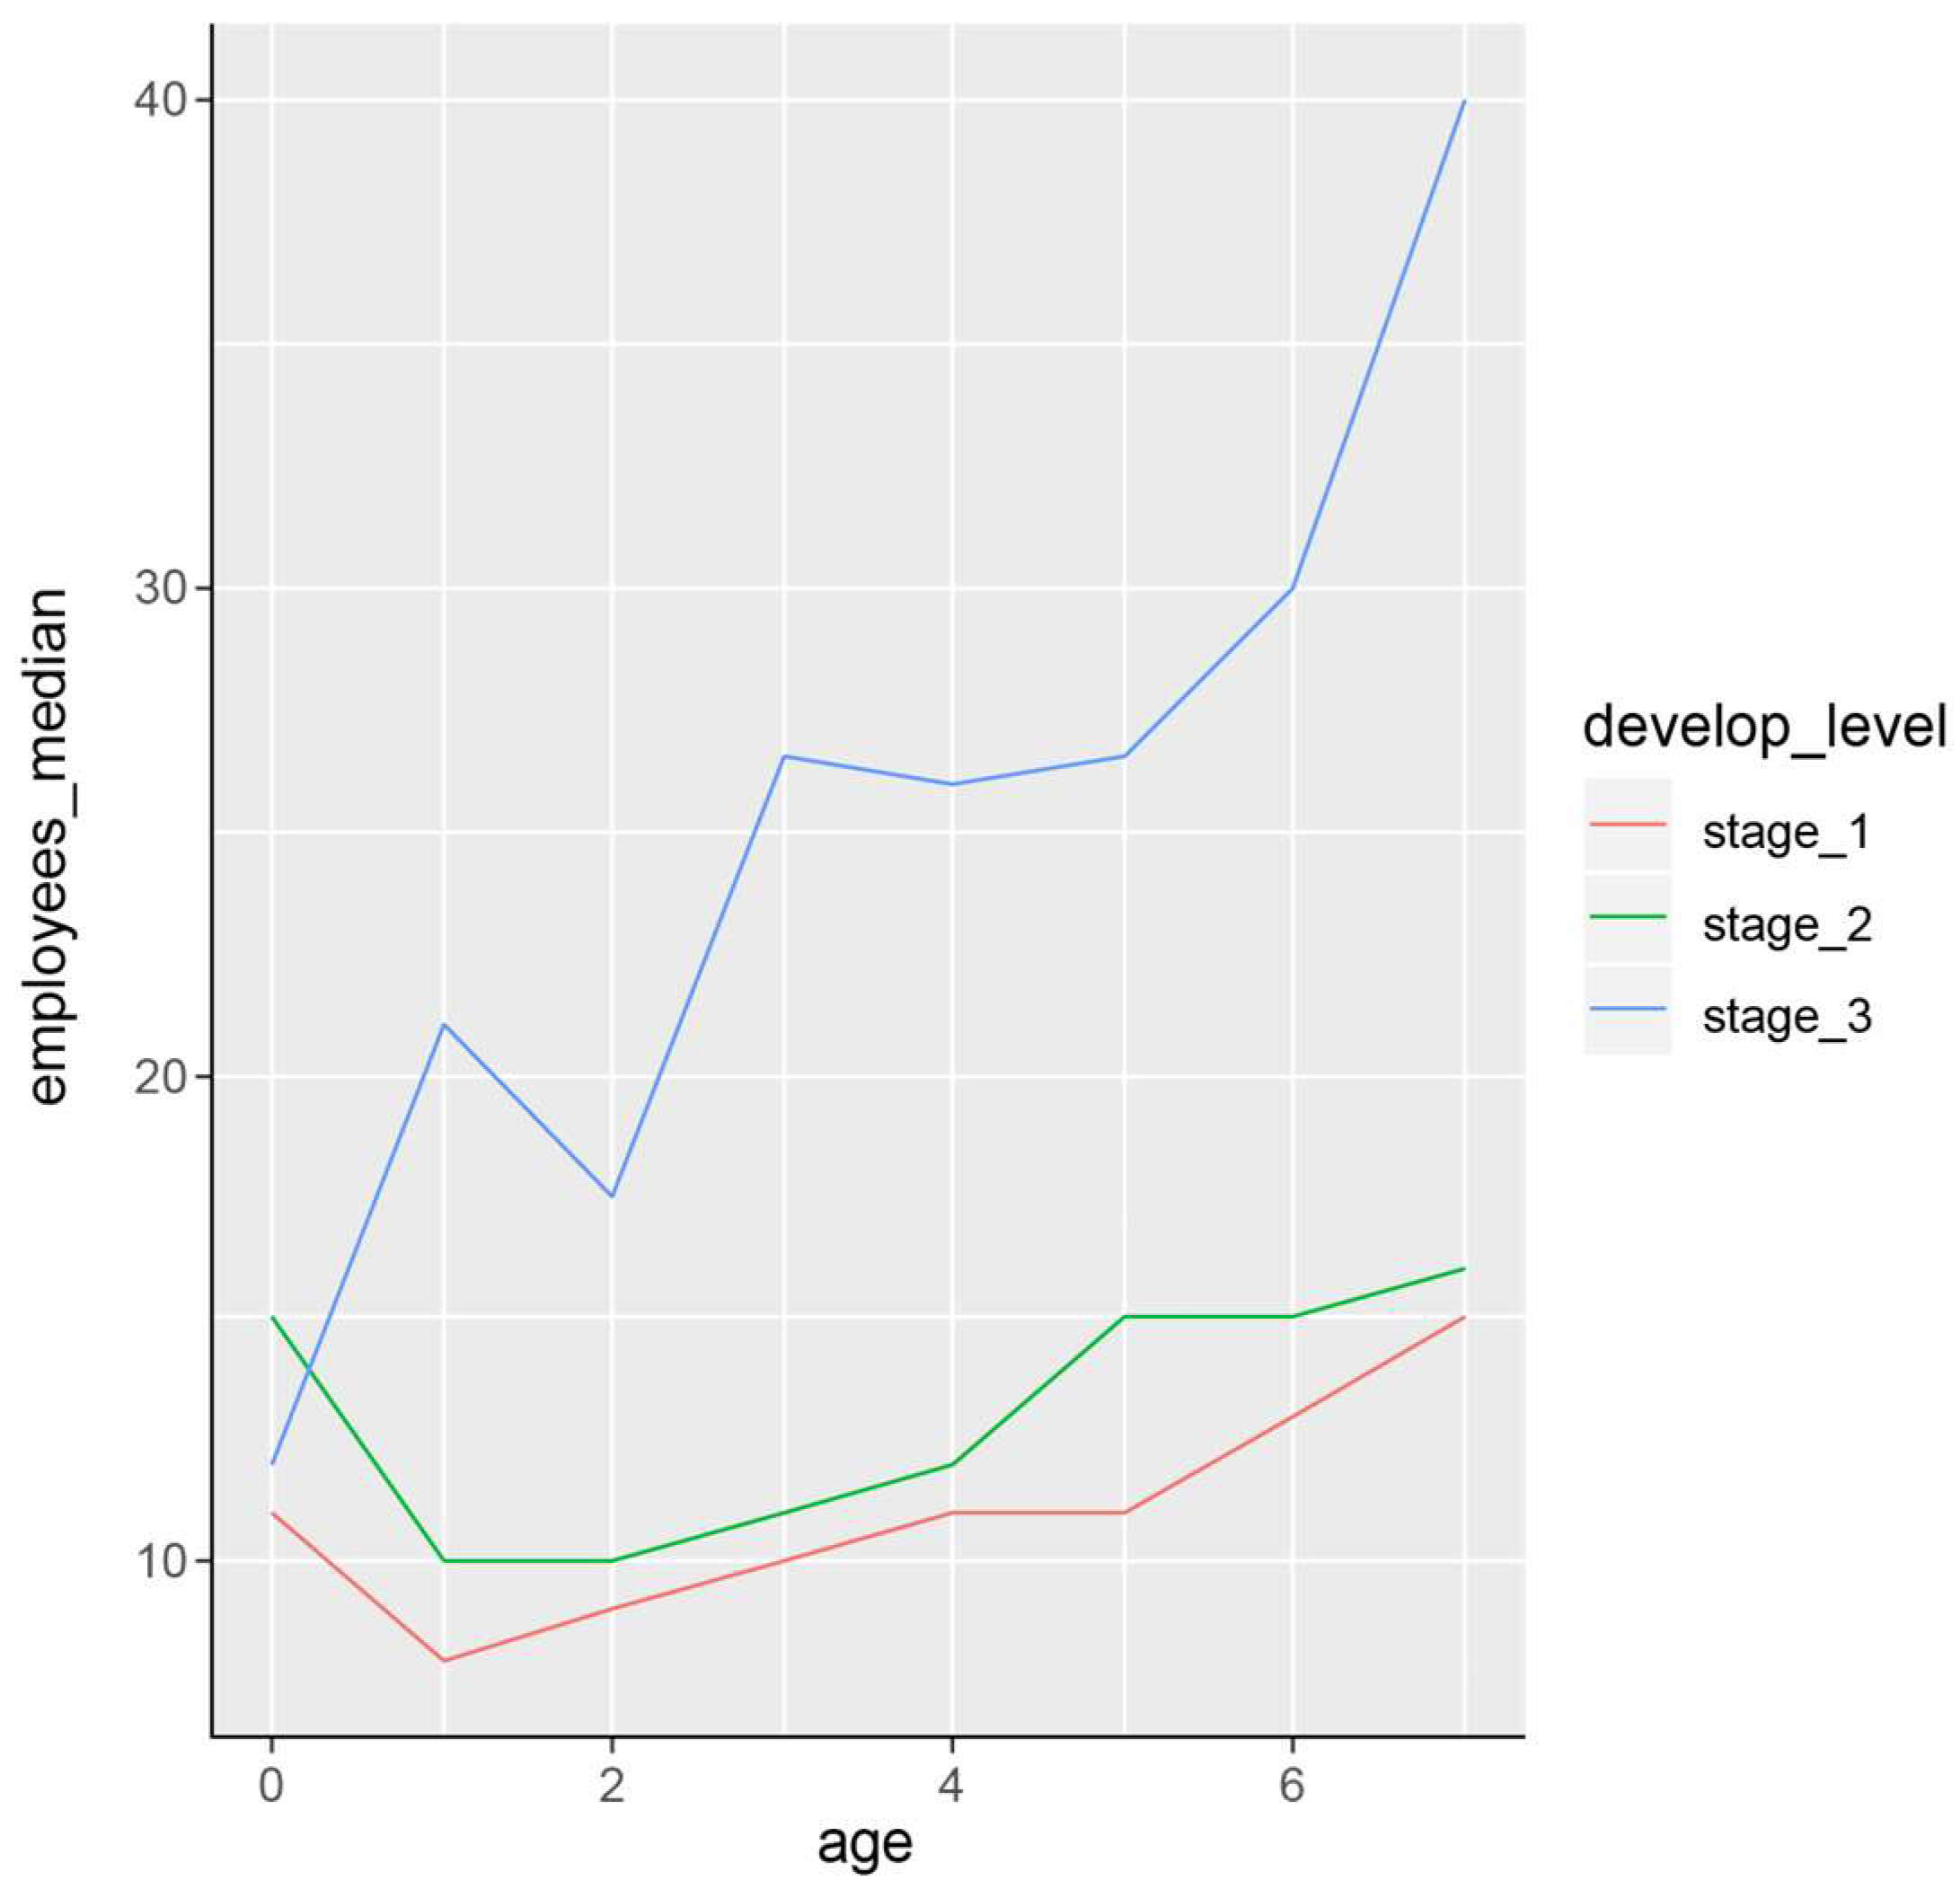
Stylized fact #1. As can be seen in
Figure 3, firms tend to have faster and more stable growth in terms of the number of employees when located in developed countries, despite having a similar size at birth to those located elsewhere. We chose to keep a similar visualization to the theoretical ones of Garnsey or Audretsch, as shown in
Figure 1. The calculation is based on the median, so it is less sensitive to outliers, but the path visualization is robust to changes in the considered measures. Countries in stages 1 and 2 present similar growth paths. Adding countries in transition stages makes the differences less obvious, but an overall similar pattern still remains. When other variables such as “industry”, “region”, or even “degree of competition” are used, no such evident differences appear. Thus, we conclude that “stage of development” is the variable with the highest discriminant capacity in this context. This finding is consistent with the importance of stages of development for entrepreneurship [
75] and in line with Delmar’s ideas of firm growth presenting different patterns [
22]. Our intuition is that a main sequence and a set of alternative firm growth patterns may be found.
Stylized fact #2. Firm size seems to be unlimited and even more so in the case of early-stage firms. However, the firm growth rate has a much more stable and similar pattern, as we show in
Figure 4. This finding is in line with the predictions of Penrose’s theory [
13]. There is a slight lag in the growth rate of firms located in less developed countries, but the path is practically identical. This stylized fact is also robust to changes in the calculation methodology and when variables other than “growth of employment” are considered. Particularly counterintuitive is the fact that not even the “degree of competition” has a critical impact on the growth rate. The only variable that generates a different path is “region”, where Latin America is the only region with a slightly different pattern.
Stylized fact #3. No clear generalizable relationship is observed between the “cost of labor” per capita, as a proxy of labor quality, and the growth of early-stage firms. This result seems to contradict theoretical predictions, and thus, further empirical research is needed. Although a consistently higher similarity is observed between firms located in stage 2 and stage 3 countries, there is an absence of recognizable patterns in the observed distributions, especially in terms of evolutionary trajectories. Moreover, the correlations observed between different groups of features do not allow us to proceed with proposals of causal relationships.
The introduction of more advanced clustering models seems to have a considerable impact on the type of relationships observed, but such data modeling is not within the scope of our current research. It is, however, one of the most promising lines of future research, since remarkable and stable patterns arise from substantially different initial groups.
We find, however, an interesting preliminary relationship between the experience level of the top management of the firm and the path that the firm follows in terms of “growth of employees” and “cost of labor per employee” (
Figure 5). Whereas firms with less experienced managers tend to maintain a high cost of labor as the size of the firm increases, those with more experienced managers follow a clear downward path in terms of labor costs while maintaining an increasing rate of employment growth.
6. Policy and Practical Implications
The findings of our study on the growth patterns of early-stage ventures carry significant implications, not only for practitioners, such as investors and entrepreneurs, but also for policymakers shaping the entrepreneurial ecosystem. These implications extend beyond traditional economic perspectives, touching upon the integration of sustainable practices in entrepreneurial growth and policy formulation. Until recently, the convergence of global, detailed datasets, advanced algorithms, and sufficient computing power necessary for this kind of in-depth analysis has not been available. Now, with these elements coming together, exciting avenues for future research have opened, promising impactful developments in sustainable entrepreneurship practices and policies.
For practitioners, particularly investors, and entrepreneurs, our study offers valuable insights into the growth patterns of early-stage ventures. The identified patterns and associated variables can help guide investment decisions and strategic planning. For example, understanding the relationship between management experience and firm growth could inform human resource strategies and investment evaluations, enhancing the chances of selecting ventures with high growth potential. Additionally, practitioners can utilize our findings to develop predictive models that anticipate market trends and identify emerging opportunities, allowing for proactive rather than reactive strategies in the highly dynamic entrepreneurship landscape. This approach lays the foundation for conducting deeper analyses to identify ventures that balance growth with sustainable practices, which is crucial for long-term success in today’s environmentally conscious market.
For policymakers, the findings provide empirical evidence to inform policies promoting entrepreneurship and economic development. Recognizing the factors that contribute to venture growth can lead to targeted support programs and initiatives. Policies could focus on fostering environments that support key growth drivers identified in this study, such as management training programs, which could significantly impact the success rates of early-stage ventures. Beyond this, policymakers can leverage these insights to create more inclusive economic growth strategies, ensuring that support systems are accessible to a diverse range of entrepreneurs, thereby fostering a more equitable and vibrant entrepreneurial ecosystem. Policymakers, in turn, can utilize these insights to craft policies that not only stimulate economic growth but also emphasize sustainable business practices. By encouraging sustainable entrepreneurship, policies can foster the creation of a more resilient and responsible business environment, aligning economic development with broader sustainability goals.
7. Limitations and Avenues for Future Research
An important limitation of our study is the absence of widely accepted, empirically tested theories that offer causal explanations for firm growth. While there are established theories, their empirical validation often remains superficial or context-specific. This highlights the necessity for more comprehensive empirical research to develop and test theories that provide a deeper causal understanding of firm growth patterns. Future empirical validation could help with refining theoretical frameworks for firm growth, particularly by offering causal explanations about the underlying mechanisms that could make a firm follow the different paths explained in the theory.
Another limitation of our study is the complex role of individual agencies in venture development. In contrast to more deterministic fields, entrepreneurship research deals with unpredictable human behavior and decisions. For instance, a founder’s unique decision-making style can significantly alter a startup’s growth trajectory, adding a layer of complexity to any predictive model. Thus, there is a clear need for additional studies that delve into how individual decision making and agency influence venture development while considering the interplay between personal, processual, and environmental factors.
Additionally, the high variability in growth patterns among startups presents a challenge. Two similar startups in the same industry might experience vastly different growth rates due to a range of internal and external factors. This variability complicates the creation of generalizable models and affects their predictive reliability. Future research could focus on understanding the factors contributing to the high variability in growth patterns among startups, aiming to develop models that can accommodate this diversity. However, some fundamental concerns regarding the intrinsic variability in the phenomenon are difficult to comprehensively address.
The scope of the World Bank dataset, while extensive, does not encompass all countries, notably omitting some major economies such as the United States. This limitation affects the comprehensiveness of our analysis and necessitates a cautious approach when extrapolating our findings to a global scale. Future studies could supplement the WBES dataset with additional data sources, particularly from underrepresented countries, to provide a more globally comprehensive analysis.
The limited range of machine learning algorithms applied in our study is another limitation. Different algorithms might interpret the same data in varied ways, suggesting the need for a more diverse application of machine learning techniques to capture the full spectrum of data insights. Clearly, there is scope for applying a wider range of machine learning algorithms to better capture the complexities of entrepreneurship data, which could be a fruitful path for future research.
An additional limitation stems from the selection of variables based on the existing literature, through which newer or less-known factors that impact venture growth may have been overlooked. Conducting systematic literature reviews (SLRs) or meta-analyses could help in identifying these missed variables towards enhancing the robustness of our variable selection.
One more limitation of our study pertains to the available data on specific sustainable management practices. The World Bank dataset, while extensive in its coverage of firm-level dynamics, does not offer detailed insights into the sustainable management practices of these firms. This limits our ability to analyze how such practices impact growth patterns and overall venture success. Future research could benefit from integrating datasets that specifically capture information on sustainability practices, thereby offering a more comprehensive understanding of their role in early-stage venture development.
Lastly, the dynamic nature of the entrepreneurship field, with its rapidly evolving market conditions and business models, poses a challenge to the long-term applicability of our findings. This inherent limitation in entrepreneurship research impacts the stability and longevity of our results.


