1. Introduction
Agricultural production and transport systems are basic components of the social and economic development of every country, but they have adverse impacts on the environment and human health. According to the estimates by the World Health Organization [
1], exposure to polluted air causes the premature death of about 4.5 million people annually on a global level. A summary of the results of the research and measurements has shown that 96% of the world’s population in suburban and urban environments is exposed to increased concentrations of air pollutants [
2]. In the document of the World Health Organization’s Global Strategy on Health, Environment, and Climate Change [
3], the reduction in air pollution is set as one of the leading strategic goals of future development.
The World Health Organization is making efforts to introduce a unified methodology for collecting, analyzing, and presenting air pollution data so that the results at the global level are comparable. The furthest step toward this goal has been achieved in the European Union [
2] by introducing the same methodology of measurement, data analysis, and risk assessment of air pollution. The risk assessment is based on the air quality index, which introduces a prerequisite for comparing results and adopting strategies for reducing and controlling emissions in the urban and suburban areas of the European Union. The methodology of the European Union is implemented by the Republic of Croatia in the Air Protection Act, which was adopted in December 2019, with amendments and additions in May 2022 [
4]. The provisions of the law (Art. 6, 11, 18, 40, and others) imply that spatial interventions (such as the construction and reconstruction of transport infrastructure or the selection of the type of agricultural production) must not negatively affect the emission quotas prescribed by the law, and that their impact must be quantified already in the planning phase.
Agricultural production is linked to suburban settlements, and the transport system is generated by the fundamental aspirations of society, such as accessibility and mobility, from the aspect of the needs of the economy, as well as those of every individual.
The air pollution caused by the operationalization of transport systems represents a constant source of air pollution, especially in the emission of nitrogen oxides and polluting particles, and the quantification of the impact of transport systems on the total air pollution is the subject of numerous studies. Conceptually, research can be divided into two groups, as follows: the first group of research focuses on the quantification and modeling of the emissions of harmful gases and particles that are released from traffic, while the second, larger group of research is directed toward the analysis of the impact of air pollution on human health and the environment. The results of the first group of research show a significant correlation between traffic load and the structure of the traffic flow and the concentration of polluting suspended particles [
5,
6,
7,
8,
9], and the second group of research establishes a clear correlation between a high concentration of pollutants and diseases of the respiratory and cardiovascular systems [
10].
The impact of the environment and weather conditions is significant on the results of the measurement of air pollution. An analysis of different studies [
6,
7,
8,
9,
10,
11] shows the adverse impact of narrow roads and high surrounding construction on the results of air pollution. The research [
9] analyzes the impact of different parameters on the measured results of the emission of exhaust gases, such as the proximity of the road to the measurement station; environment; type of construction; greenery; weather conditions, especially wind; the proximity of water; and the size, speed, and structure of traffic flow. The study clearly shows that the application of the same methodology measurement and the consideration of environmental factors are the prerequisites for the comparability of results.
Different sources contribute to the emission of gases, such as transportation, household energy use, industry, energy generation, agriculture, and shipping. These emissions happen at different stages of farming, including making and using fertilizers, and tasks like planting, harvesting, and moving crops. This interaction between the changes in land use and the emissions they cause is crucial in shaping the local temperature changes and broader effects on the environment [
12].
Nitrous oxide (N
2O) and methane (CH
4) are the main greenhouse gases emitted from agricultural activities, while carbon dioxide (CO
2) has the smallest impact on direct emissions within the agricultural sector [
13].
Various practices in agricultural production contribute to the direct increase in N
2O emissions. These practices encompass the use of organic manure and composts, fertilization, storage of crop residues on soil, and the cultivation of nitrogen-fixing crops and forages, as well as the tilling of soils abundant in organic matter. Additionally, actions such as irrigation, drainage interventions, tillage operations, and fallowing also exert a direct influence on the increase in N
2O emissions. This increase is attributed to anthropogenic activities, including fossil fuel burning, deforestation emission from automobiles, forest fires, etc., [
14].
The nitrogen fertilizers used in farming generate notable amounts of nitrogen-containing gases, like ammonia, nitric oxide, and nitrous oxide. By adopting improved practices for managing farmland, it is possible to lower the release of these nitrogen-containing gases, leading to both a cleaner water environment and more climate-resilient agricultural methods [
15].
Bearing in mind the great problem of air quality in populated places, it is important to assess the environmental impact in the planning phase for planning the construction and reconstruction of transport infrastructure and planning agricultural production, which the application of models enables.
This paper deals with the analysis of the joint impact of agricultural production and different infrastructure facilities on nitrogen oxide emissions using modeling. For the impact of traffic, microsimulation traffic modeling was used, which takes into account the traffic load, traffic structure, speed characteristics of vehicles, engine power, acceleration/deceleration parameters, vehicle fleet characteristics, and other parameters.
The analysis of the impact of traffic was made using microsimulation traffic modeling on three different traffic infrastructure facilities while, from the aspect of agricultural production, the impact of the winter wheat production in an open field and the intercropping system of walnuts and winter wheat production was observed.
The previous impact analysis resulting from the research objective included the development of a new methodology for assessing the combined impact of different types of agricultural production, traffic load, and traffic flow structure on the emission of nitrogen oxides.
Each of the mentioned areas of human activity, such as transport and agricultural production, has models and methodology for air pollution assessment. The air quality is the result of the joint action of different sources of pollution, and, in predicting their impact, the superimposing influences of the different sources of pollution can be predicted. The scientific contribution of this paper is the development and application of a methodology for assessing the joint impact on air quality of two different sources of air pollution.
2. Materials and Methods
For the analysis of the joint impact of traffic and agricultural production, a new impact assessment methodology was developed, which is based on two selected impact prediction models. The following two models were used to predict the impact: the BioGrace model and the microsimulation model VISSIM.
The Task Force on National Greenhouse Gas Inventories has developed guidelines for calculating greenhouse gas emissions within agriculture, forestry, and other land use sectors at a national level [
16,
17]. The guidelines provided by these calculations are frequently employed by process-based models like the BioGrace model (specifically, BioGrace version 4d 2015) [
18] to compute greenhouse gas emissions. This model’s validity has been acknowledged by the European Commission as a voluntary system that aligns with the sustainability standards of the Renewable Energy Directive [
19]. The model permits users to input their data voluntarily, serving as an approved scheme to showcase the adherence to the EU-RED. BioGrace uses energy distribution in accordance with various regulations and has been used by numerous authors in their research [
20,
21,
22].
VISSIM 11 is a widespread microsimulation software intended for the analysis of functional traffic parameters for various infrastructure solutions and traffic regulation [
23]. One of the output indicators of microsimulations is fuel consumption and air pollution indicators. VISSIM has a different simulator structure from the other microsimulation models, whereby the nodes are modeled through links and connectors, which enables the modeling of highly complex intersections and non-specific infrastructure solutions.
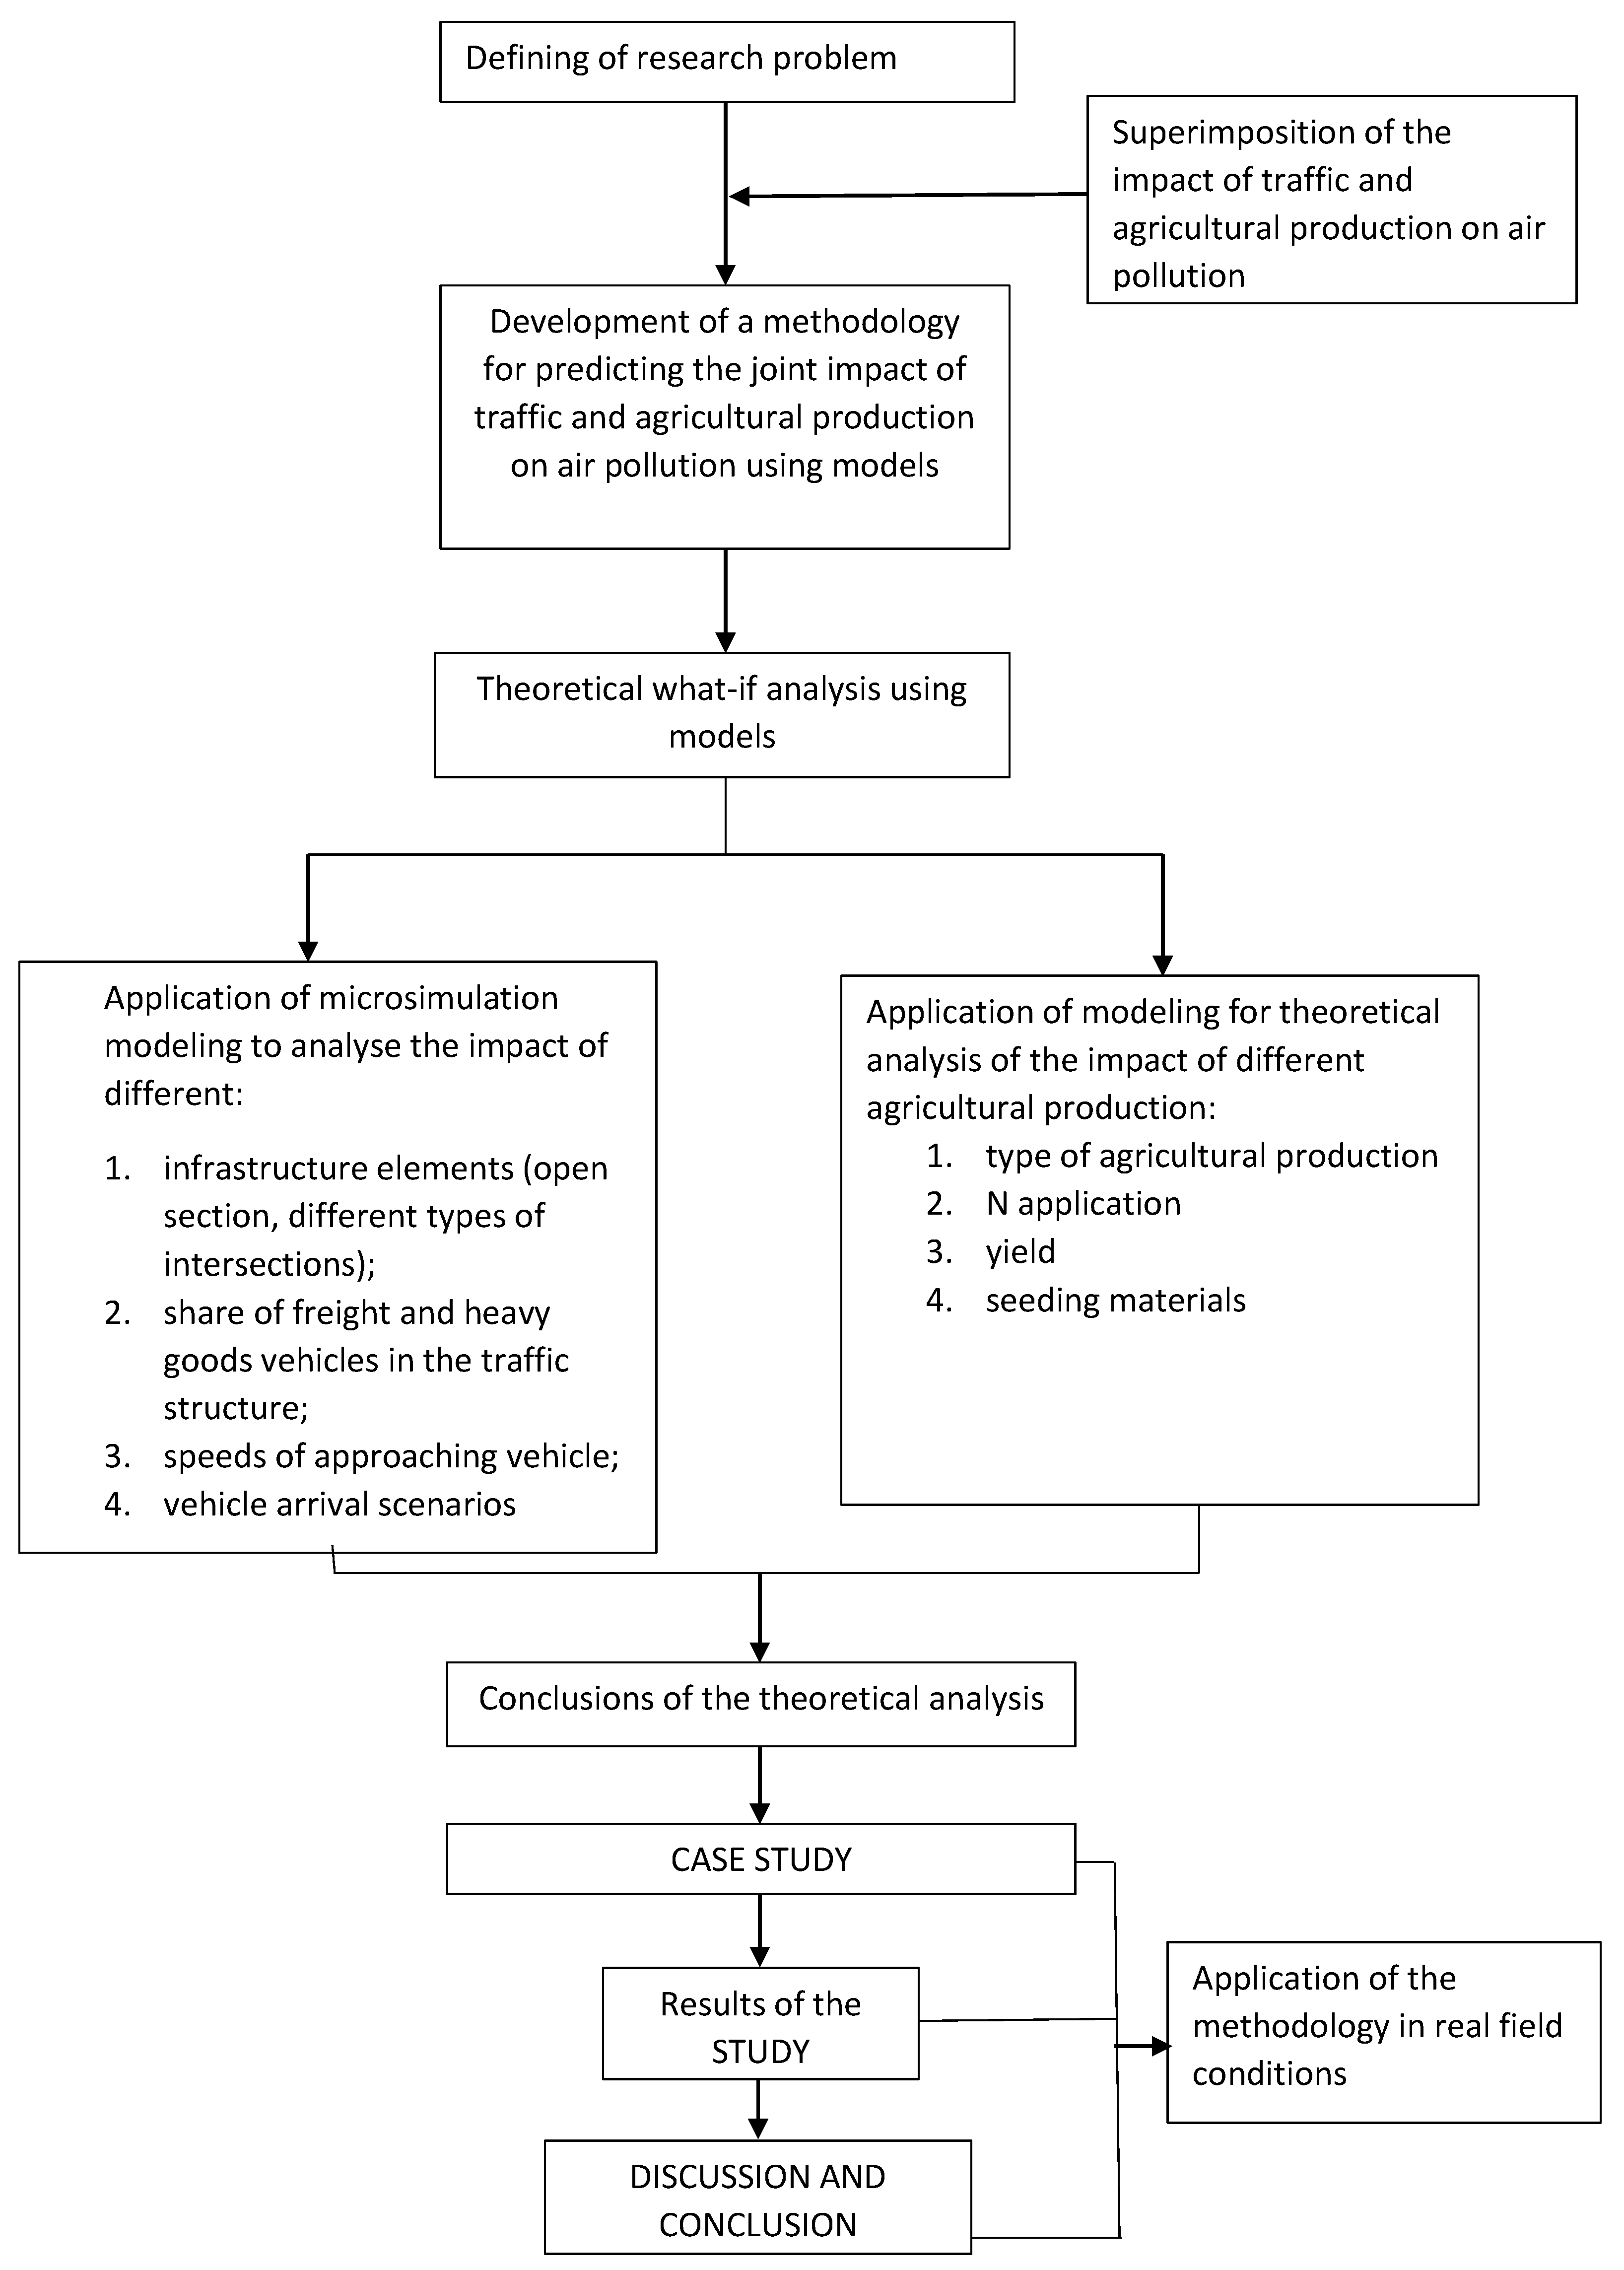
The basic methodological steps are shown in
Figure 1.
2.1. Development of a Methodology
In the first step, a methodology was developed for evaluating the impact of nitrogen oxide emissions based on the selected models.
The calculations of NOx emissions from the different systems of agricultural production were made with the BioGrace model (version 4d 2015) based on the application of N-fertilizers, yield, and sowing rate during the growing season and using the BioGrace excel NOx emission tools.
The analysis of the impact of traffic on the emission of nitrogen oxides was made by applying microsimulation traffic modeling (VISSIM) to three different traffic infrastructure facilities. The open road, three-leg, and four-leg intersections without traffic lights were analyzed, because these are the most common infrastructure facilities in suburban and non-urban networks with low and medium traffic loads. The influence of traffic flow speeds of 50 km/h and 100 km/h was analyzed. The different structures of traffic flow were analyzed, and the percentage of the share of freight vehicles varied, at 10, 20, and 30%. In the total share of freight vehicles, the percentage of heavy goods vehicles varied between 5, 10, and 20%. The traffic load was modeled for 1000 vehicles per hour, in all types of traffic infrastructure.
Respecting the stochastic nature of traffic flow, ten different scenarios of incoming vehicles were analyzed for each combination of model input parameters, with the same initial value and the same step of the random number generator. In this way, we analyzed the same ten traffic scenarios for all input data and all infrastructure facilities, which made the results comparable. A total of 180 scenarios were analyzed for each infrastructure solution.
2.2. Case Study
In the second step, the methodology was applied to a case study.
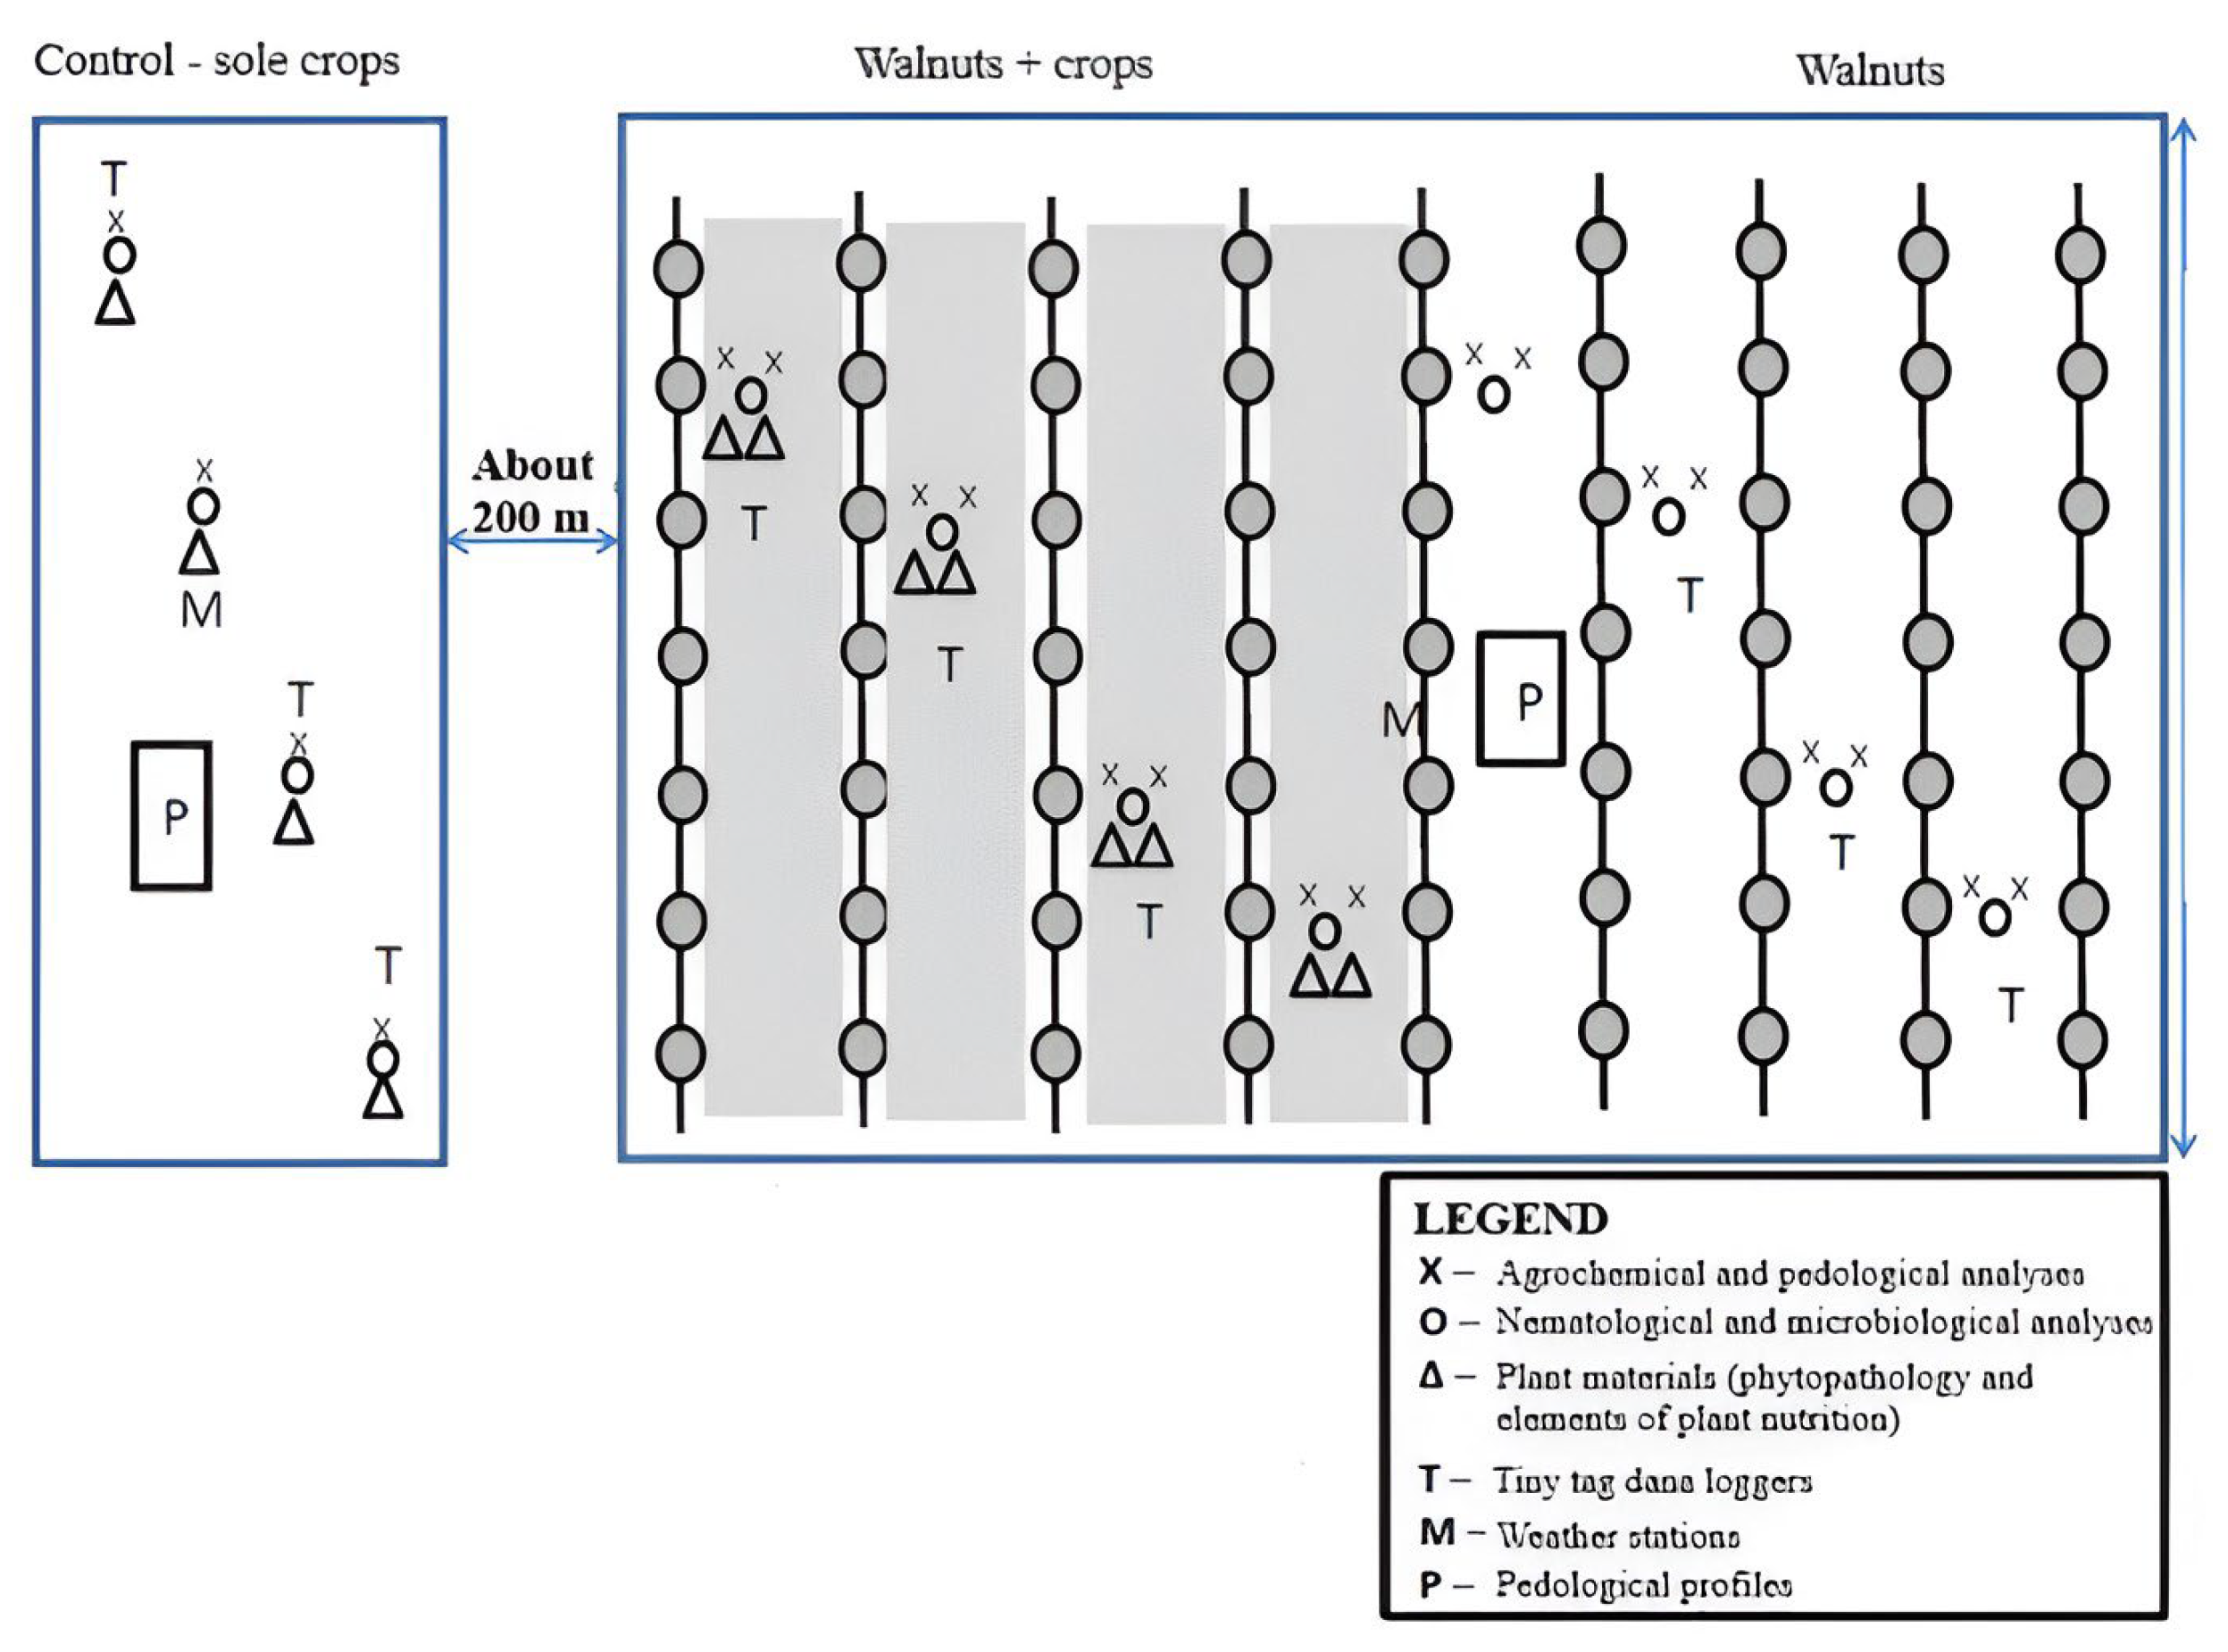
The field experiments took place at locations in eastern Croatia, Ðakovo (45°18024.0900 N, 18°26020.500 E). The elevation of the Ðakovo site measures 111 m above sea level. The soil type is characterized as luvisol pseudogley on loess, with an effective soil depth of 1500 mm [
24]. The Đakovo region experiences a continental climate characterized by warm summers and cold winters, and it receives an average annual rainfall ranging from 600 to 1000 mm, evenly distributed throughout the year [
25]. The experiment involved three distinct plots, each covering roughly 1.3 hectares, as follows: (a.) a control plot comprising a monoculture winter wheat system in an arable field; (b.) an exclusive walnut orchard; and (c.) a walnut orchard intercropped with bio winter wheat—200 kg ha
−1. The walnut orchard consisted of Juglans regia L. trees, with the orchard’s layout consisting of 8-m-wide alleys between the trees, and the spacing within the rows of walnut trees was 7 m. The tree density was consistent for both the exclusive walnut orchard and the intercropped version. The average height of the walnut trees was 5.5 m, with a canopy width of 5 m (
Scheme 1) [
25].
In our study, winter wheat was in primary focus, due to its status as the predominant grain (bread) crop in the Republic of Croatia. According to the Croatian Bureau of Statistics [
26], there were 161,000.00 ha under the winter wheat production in Croatia. By choosing winter wheat, our intention was to approximate the prevailing agricultural practices and conditions in Croatia, which enabled us to investigate the real impact of the intercropping system on the crops most commonly grown in the region, encouraging a stronger connection between scientific research and the economic reality. On the other hand, given the fact that walnut cultivation is widespread in Croatia and holds significance in local agriculture, it was also included in our study. Notably, walnut trees have the potential to acidify soil. Consequently, we chose agricultural crops that demonstrate a tolerance to acidic soil conditions. This decision adds an extra layer of relevance to our research, as it aligns with the prevalent conditions in areas where walnuts are commonly cultivated. Simultaneously, this type of cultivation fosters allelopathic interactions among plants, a phenomenon characterized by the release of different chemical substances and compounds into the surrounding soil, influencing the neighboring plants. These chemical compounds are typically by-products of essential plant processes and are generated in various plant components, such as the roots, stems, leaves, flowers, and fruits. In intercropping systems involving walnuts, it is preferable to select orchards with grafted plants. This preference arises because walnut trees produce juglone, a substance that can have a detrimental impact on the germination of other plants. Orchards featuring grafted walnut trees exhibit a less intense secretion of juglone, and, within the initial 15 years of such intercropping systems, the juglone’s activity does not exert a significant toxic effect. Furthermore, it is recommended to incorporate organic matter through practices like the application of green manure or organic fertilizers. These approaches enhance microbiological activity in the soil, facilitating the decomposition of juglone [
25]. Moreover, the selection of walnuts as a focal point is motivated by their added value. Croatia boasts a stable industry dedicated to the production of alcoholic beverages, particularly liqueurs, which actively procures walnuts as a key raw material. This industry-driven demand for walnuts further underscores the practical relevance of our study, as it addresses the interconnectedness of agricultural production with downstream economic activities, providing valuable insights for both the agricultural and industrial sectors in Croatia.
2.2.1. Methodology for Analyzing the Impact of Agricultural Production
The emissions from the production of fertilizers (primarily N emission) are calculated by using the following equation:
EM fertilizer represents the production of gas emissions from the total amount of fertilizers used for the vegetation, and EF refers to the total amount of nitrogen fertilizers used for the vegetation. In our research, nitrogen was applied by only using organic fertilizers, because the case study was set up in agricultural production that was carried out according to the principles of ecological production.
The greenhouse gas emissions associated with fertilizer production vary according to the different processing technologies of different nitrogen fertilizers and energy sources. New technologies, including catalytic cleaning of NOx and N
2O, have lowered the emissions from the production of fertilizers. Fertilizers Europe (2014) [
27] states that all operating plants in Europe have had abatement systems since the mid-2010s.
2.2.2. Methodology for Analyzing the Impact of Transport Infrastructure
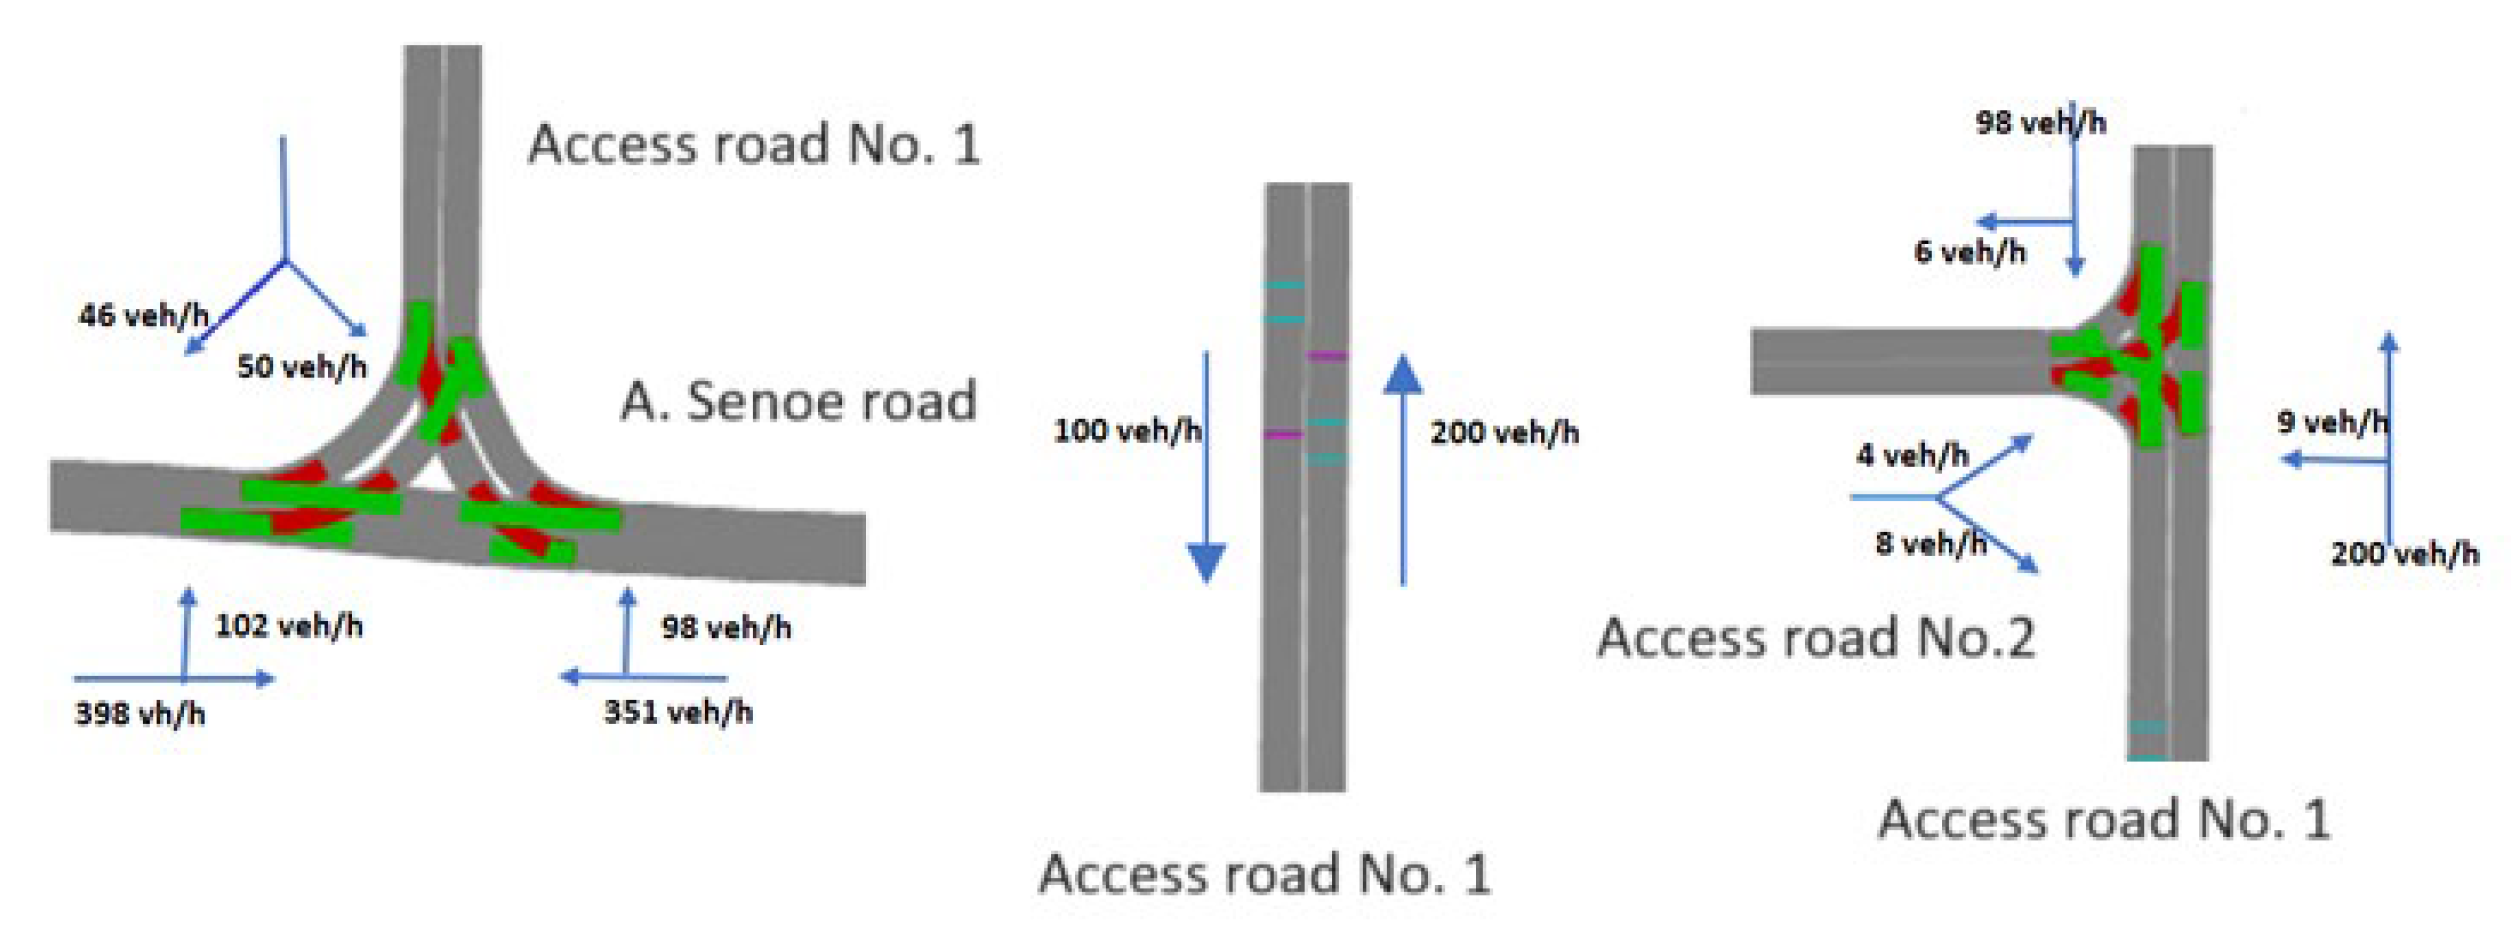
For a basic insight into the traffic load, a one-hour traffic count was made on the traffic network located near the observed experimental field. The observed location includes two three-leg intersections, one of primary functional level and higher traffic load (the intersection of A. Senoe Road and Access Road No. 1), and one of secondary functional level (the intersection of Access Road No. 1 and Access Road No. 2), which serves to access agricultural areas (
Scheme 2). The traffic was recorded with a video camera from 15:00 to 16:00 on Thursday, 6 October 2022. The recording was made for several hourly traffic loads, e.g., the morning peak hour (7:00 to 8:00), however, the afternoon peak hour has the highest traffic load in the observed location. Considering the positive correlation between traffic load and air pollution [
5,
6,
7,
8,
9], the maximum traffic load produces the highest amount of air pollution, which represents a critical influence. The traffic structure determined at the observed location had 81% of passenger vehicles, 18.5% of goods vehicles, and 0.5% of buses. In the structure of the goods vehicles, 15% were heavy goods vehicles.
The calculated traffic load and traffic structure represent the input data of the modeling. The different vehicle arrival scenarios represent a stochastic variable in the traffic impact analysis. VISSIM provides the ability to model the stochastic nature of the traffic flow by using a random number generator to generate the traffic load. For this analysis, the initial value of the random seed generator (random seed 42) and the increment of 10 were set, which selected 10 random scenarios. The same data input into the random number generator will yield the same vehicle arrival scenarios, making the experiment repeatable.
The average speeds are 90 km/h on the main road, 50 km/h on the secondary road, and 30 km/h on the access road toward the experimental location.
2.2.3. Statistical Analysis
The database was created for the emission of nitrogen oxides in time intervals of one minute for ten scenarios of different vehicle arrival scenarios for the calculated hourly traffic load in the field. In this way, 60 emission data points were obtained for each observed vehicle arrival scenario. An analysis of data distribution was made using the Anderson–Darling test, and the null hypothesis was that the data would follow a normal distribution pattern, with a set significance threshold of 0.05. The analysis of the data distribution was made due to the selection of a statistical test for the evaluation of statistically significant differences in the individual data sets.
Bonett and Levene tests were used to evaluate the statistically significant differences between sets of nitrogen oxide emissions data for different vehicle arrival scenarios [
28], which were applicable to data that do not follow a normal distribution pattern. The null hypothesis was that the data sets would not differ statistically significantly, i.e., that the ratios of standard deviations and variances would be approximately equal to 1 (σx/σy = 1; Vx/Vy = 1; where x and y are the markers of different scenarios), and the significance threshold was set as 0.05.
The statistical analysis of the obtained results for agricultural production was processed by the ANOVA LSD test (p < 0.05). As a dependent variable in the analysis of variance, the data on NOx emissions in different production systems were used in accordance with the intervals used for the database for the analysis of traffic scenarios. All measurements were performed in 4 repetitions.
4. Discussion
The aim of this work was to develop and apply a methodology for the analysis of the joint influence of the type of agricultural production and traffic on the emission of nitrogen oxides.
The timing, fertilizer quantity, fertilizer source, and type of agricultural production system used can all influence the rise in NOx emissions. Moreover, the manufacturing, application, and transportation processes contribute to increased CO
2 and N
2O emissions [
29,
30]. Of even greater significance is the observation that the excessive use of N fertilizers can lead to a proportional increase in NOx emissions, particularly when the nitrogen application rates exceed the actual requirements of the crops [
31,
32]. The substantial utilization of nitrogen in agricultural production is primarily reliant on considerable amounts of non-renewable energy, as estimated by [
33], ultimately resulting in potential disadvantages. Such excessive practical application leads to heightened N
2O emissions, consequently escalating the GHG (greenhouse gas) emissions when normalized by yield. However, even more crucially, it can decrease both the efficiency of nitrogen utilization and, moreover, crop productivity, as indicated by [
34]. According to [
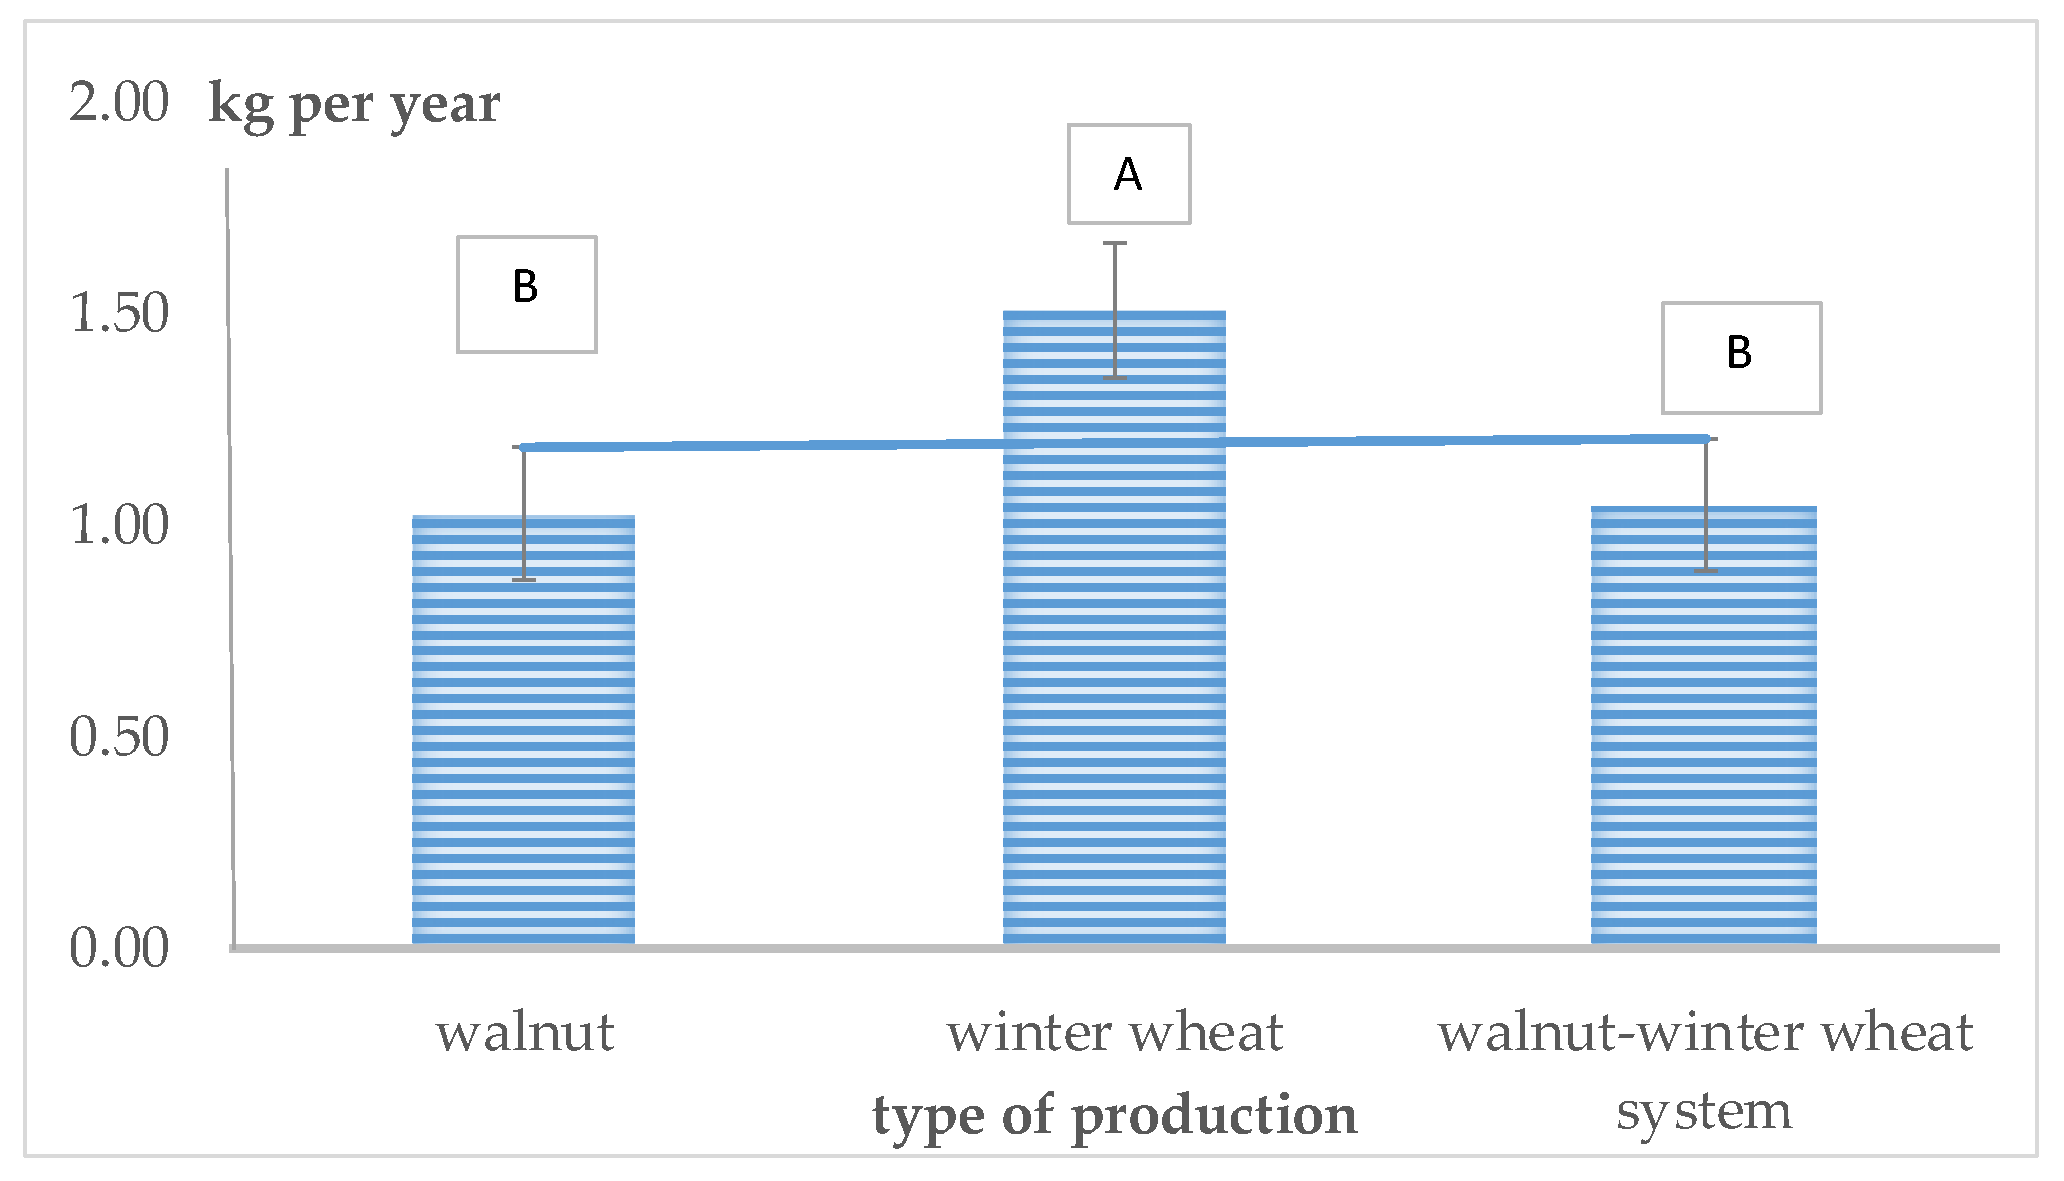
35], the exponential escalation of NOx emissions is directly correlated with the nitrogen fertilization rate. The authors have suggested that, for a nitrogen fertilization range of 50–150 kg in wheat, the emission of NO
2 was measured at 0.57 kg per hectare per year—significantly lower than the values observed in our study. Namely, in our research, the differences between the model-predicted and the actually measured nitrogen oxide emission values were very similar, and the influence of the different production systems on the nitrogen oxide emissions was confirmed. In both cases, the highest emission rate was recorded from growing wheat in an open field, which was about 1.50 kg ha NOx per year (
Table 1,
Figure 4). The recorded results are probably a consequence of the ecological agricultural production in which the source of nitrogen is organic fertilizers, as we stated in the equation in the methodology. However, the importance of nitrogen fertilization in modern sustainable agriculture cannot be overstated. This consideration encloses both ecological and economic implications [
36] in order to achieve both the production of sufficient high-quality food and the mitigation of ecological disturbances and impacts. Environmental preservation, economic viability, efficiency, food safety, and quality are recognized as being essential for sustainable and viable agricultural production [
37].
From this point of view, it is important to point out that, in our research, no statistically significant difference was found between NOx emissions in the walnut orchard compared to the intercropping system, therefore, the reason for the introduction of the intercropping system in agricultural production can be found in other advantages. Namely, it is essential to note that intercropping significantly outperforms monocultures in terms of productivity per unit area. This disparity in productivity highlights the substantial advantages associated with intercropping farming practices. This increase in productivity aligns with the objectives outlined in both the Green Deal and the Common Agricultural Policy of the European Union (EU). Additionally, by combining permanent wood species with agricultural crops on the same parcel of land, there is in an influence on the temperature, humidity, insolation, and wind flow within the orchard (microclimate), which improves plant resistance to stress conditions, such as climatic extremes (drought and flooding) [
24].
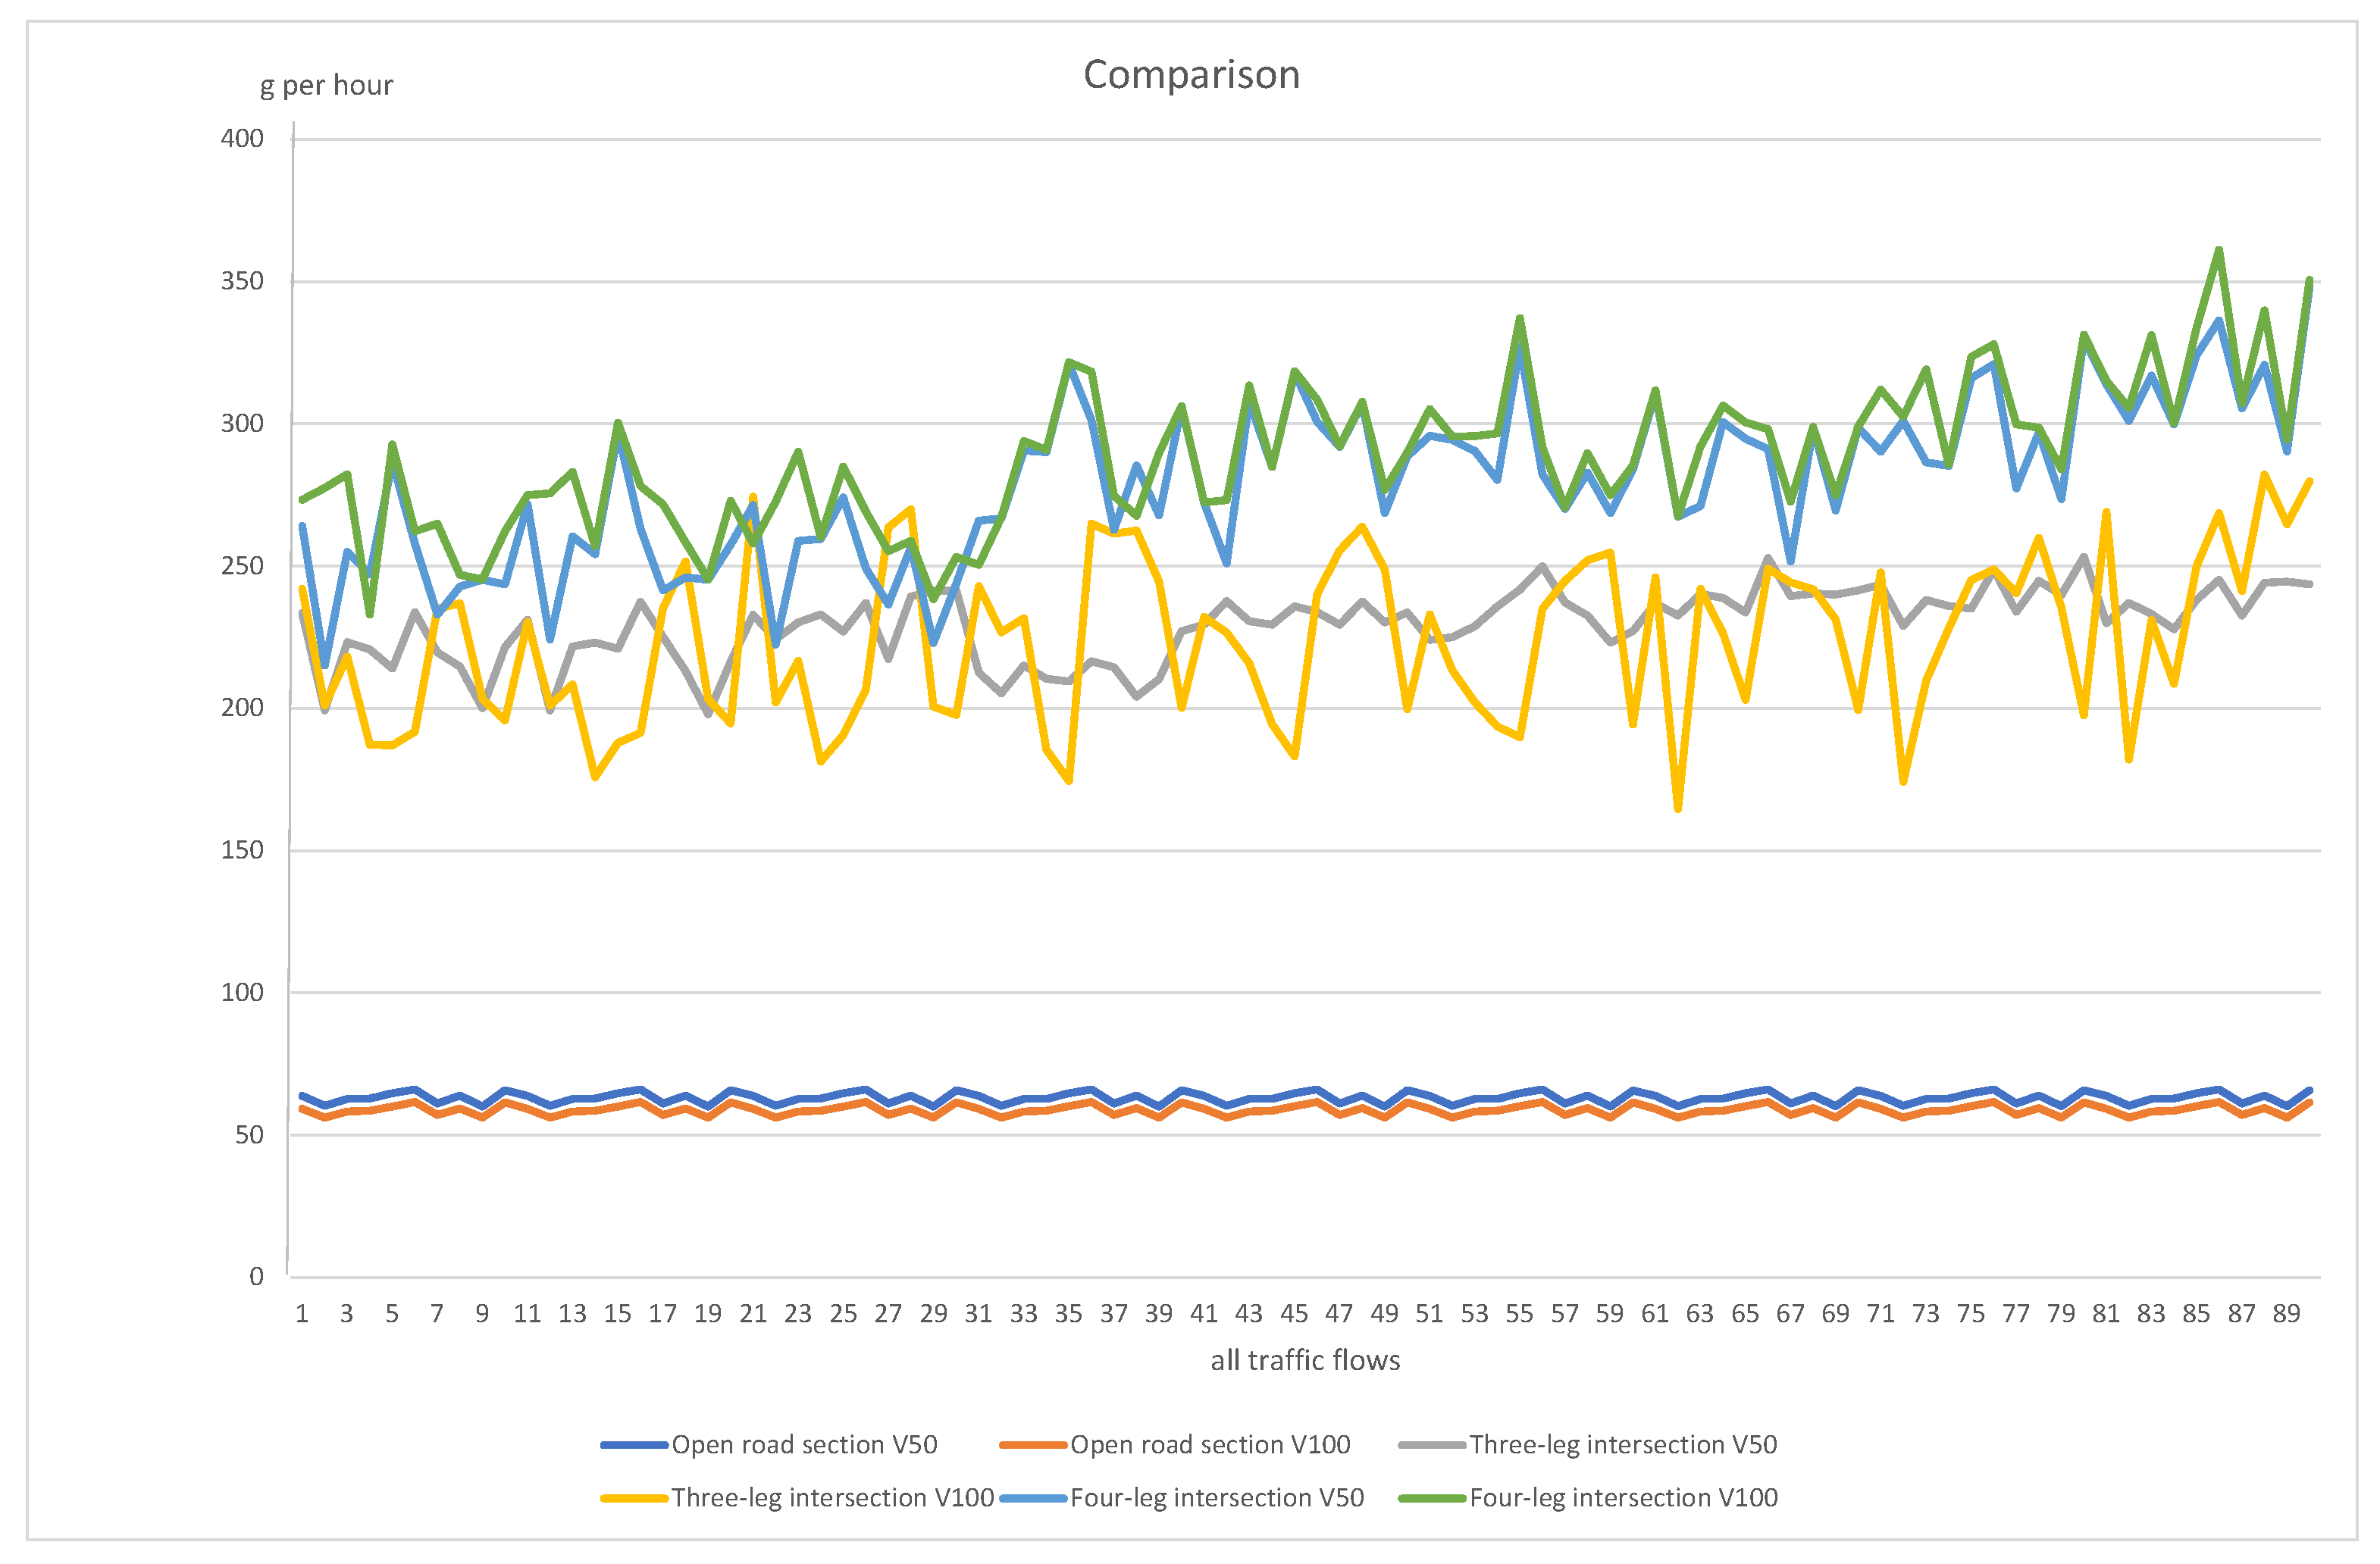
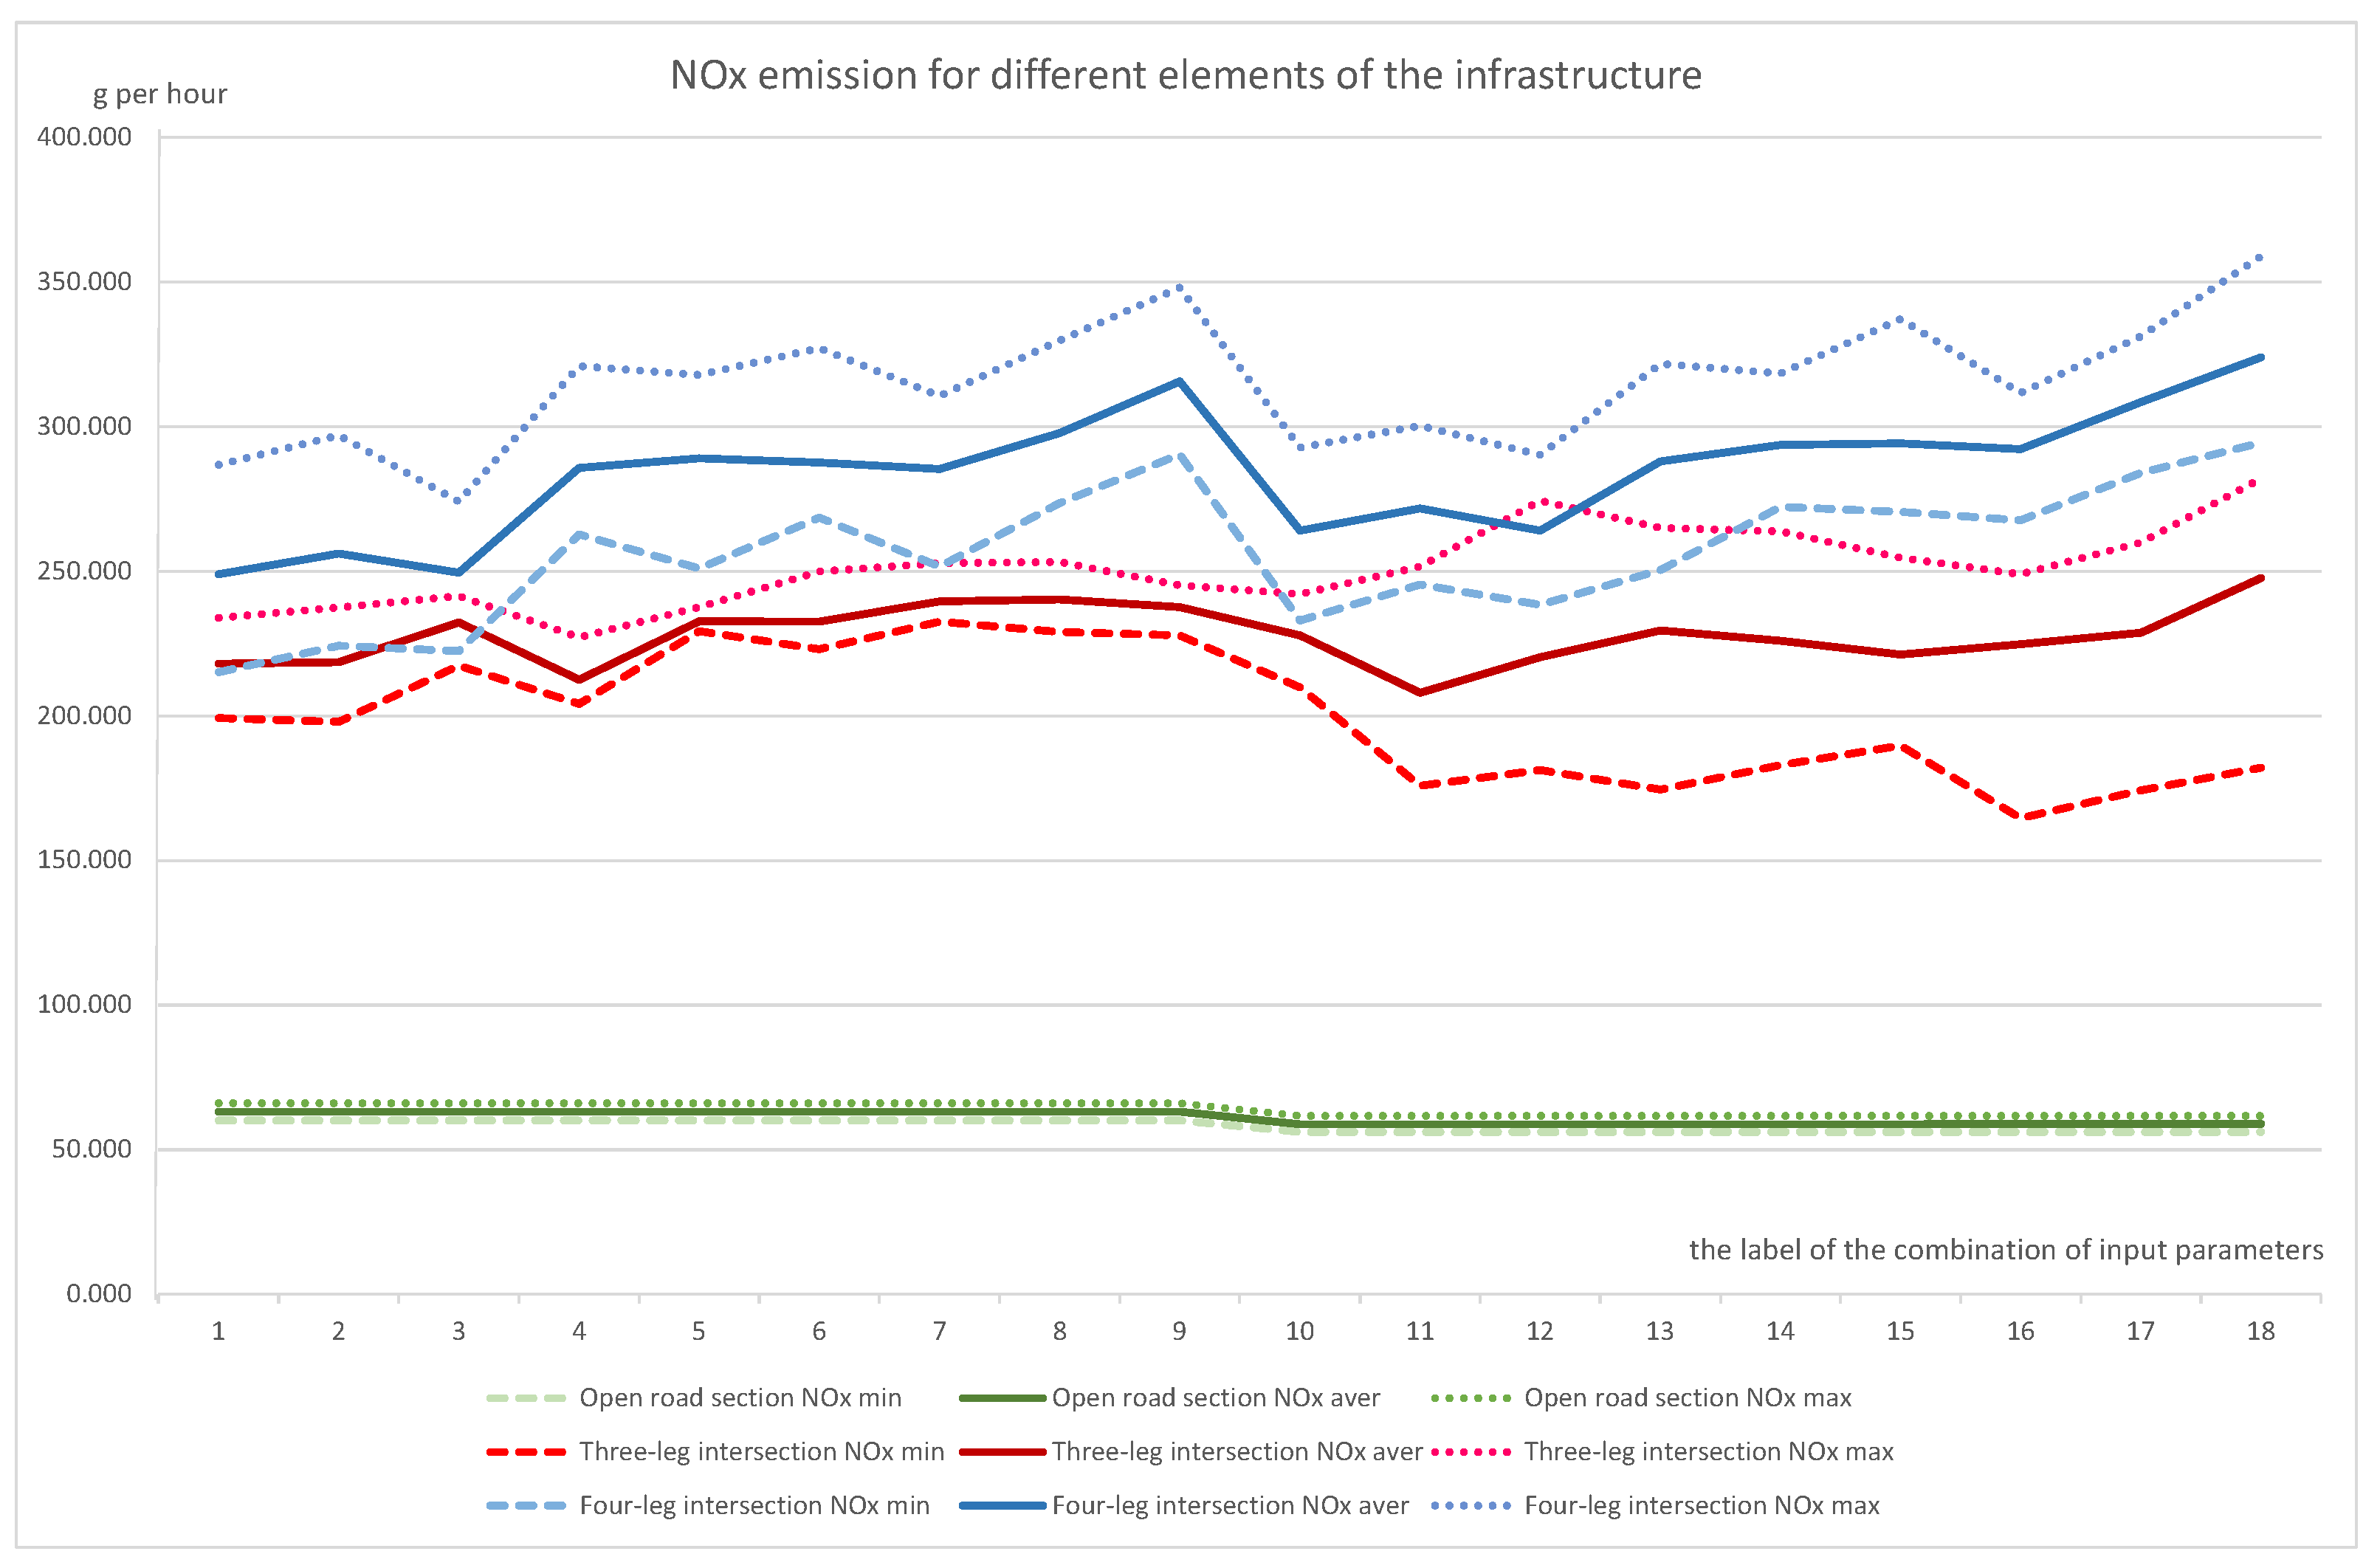
A theoretical analysis of the impact of different shares of freight and heavy goods vehicles in the traffic flow structure, different speeds, and different infrastructure solutions was made using microsimulations, the results of which are shown in
Figure 2 and
Figure 3. For the three-leg intersection, the difference between the best and worst NOx emission scenarios for the minimum, maximum, and average values was 29.3%, 19.5%, 16.0%, respectively. The worst-case scenario was for an incoming speed of 100 km/h, for a share of goods vehicles of 30% and a share of heavy goods vehicles of 20%, which was expected. The best scenarios were obtained for the share of heavy goods vehicles up to 5%.
For the four-leg intersection, the variability between the best and worst scenarios was the greatest. The difference between the best and worst NOx emission scenarios for the minimum, maximum, and average values was 27.0%, 23.6%, and 23.1%, respectively. The worst-case scenario was for an incoming speed of 100 km/h, for a share of goods vehicles of 30%, and a share of heavy goods vehicles of 20%.
The results showed that all of the worst-case scenarios for NOx emissions from traffic had a share of trucks of 30% and a share of heavy trucks in the total number of trucks of 20%, which was the expected result. The best scenario was obtained for a minimum share of freight vehicles of up to 10% and a minimum share of heavy goods vehicles of up to 5%, at an incoming speed of 50 km/h, which was the expected result.
By analyzing the results presented in this paper, it can be concluded that, for the same infrastructural solution, the share of freight and heavy goods vehicles in the structure of the traffic flow plays a significant role in NOx emissions, coinciding with the results of this study [
38], which shows that the traffic structure has a significant influence on NO
2/NOx emissions. Beevers et al., 2012 [
39] analyzed the difference in emission contributions between light diesel vehicles, heavy diesel vehicles, and petrol vehicles. It can be seen that the relative importance of light diesel vehicles for the total NOx emissions drives the difference in emission trends.
The study [
40] analyzes the impact of transport infrastructure and different transport strategies on air pollution, which shows the importance of analyzing different variant solutions of infrastructure in the context of air pollution, and the results are comparable to those of the analysis presented in this article.
Within the scope of this work, different speeds proved to be an important factor in the analysis of NOx emissions, as shown by the research conducted in China on actual measured data [
41], which shows the influence of the road category, speed, and acceleration on the emission of exhaust gases from traffic, coinciding with the results of this article.
The results of the theoretical analysis of the methodology based on modeling were compared with the results of the field research conducted in the real world and showed a good match. This comparison of results served to verify the methodology.
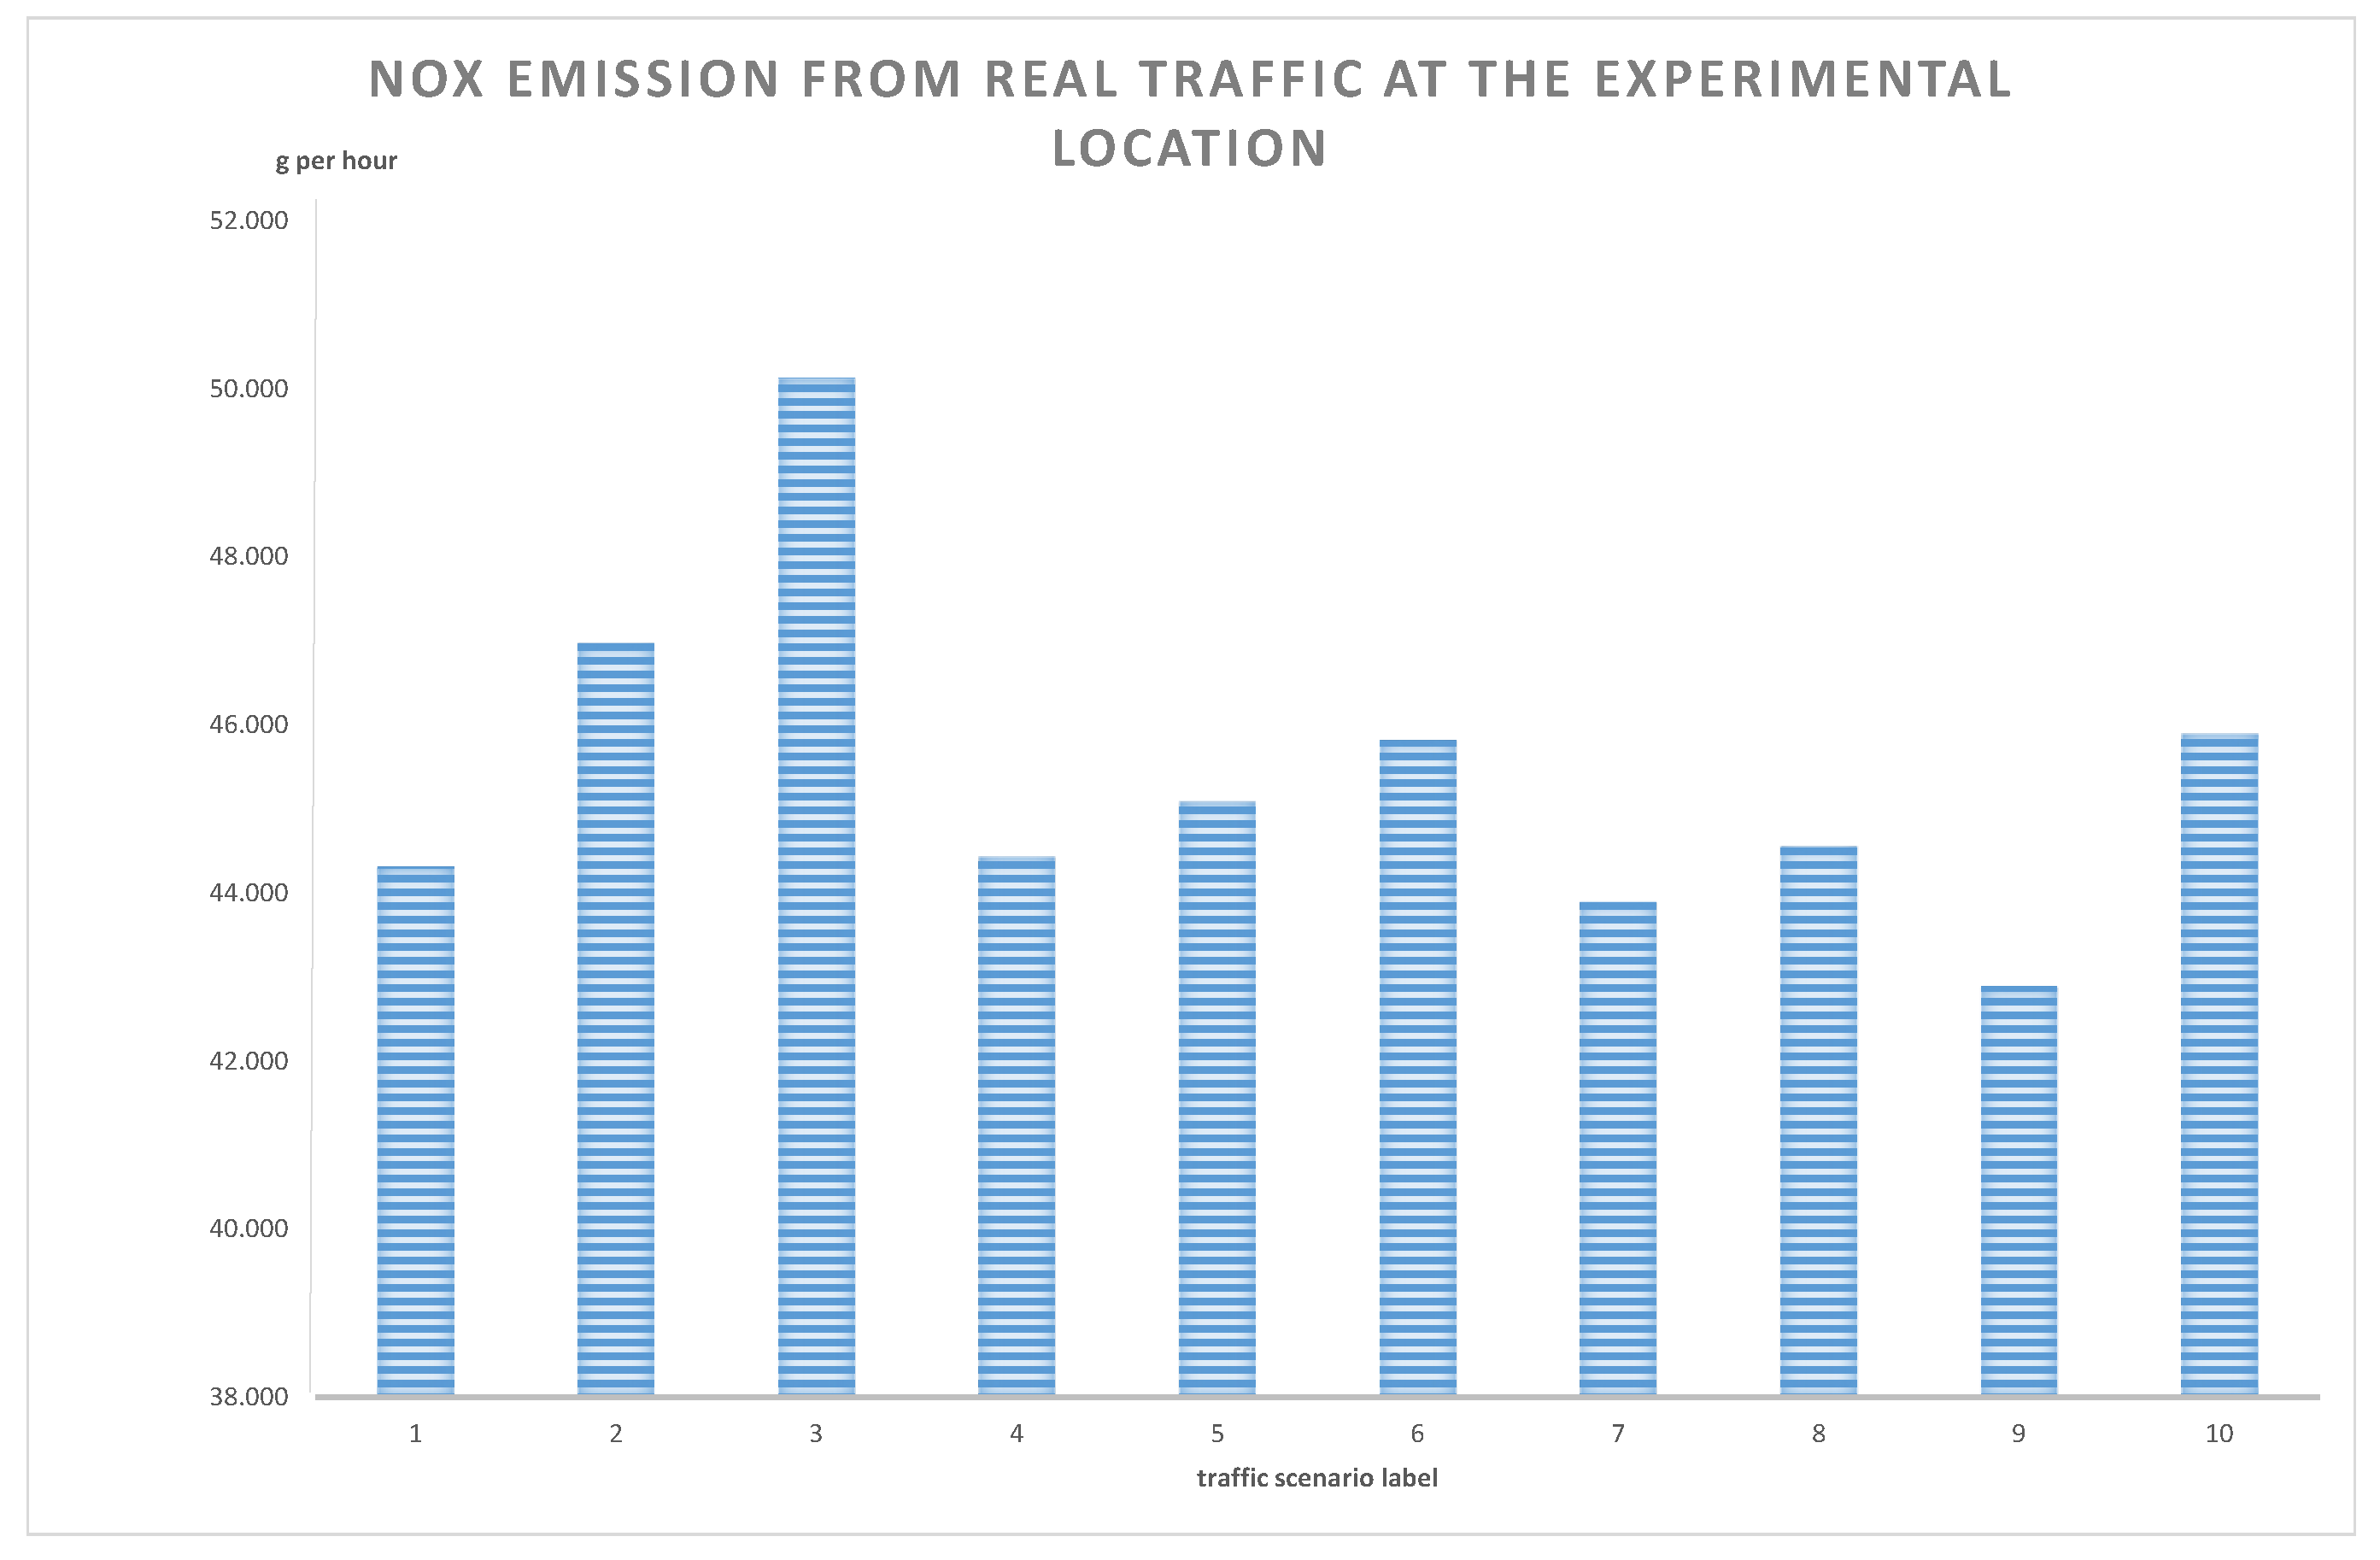
As part of the case study, an analysis of nitrogen oxide emissions was made for different vehicle arrival scenarios for the same traffic load. The analysis showed that there are differences (
Figure 5), but they are not statistically significant (
Table 4). This was the expected result, because it is about the same traffic load and the same traffic flow structure.
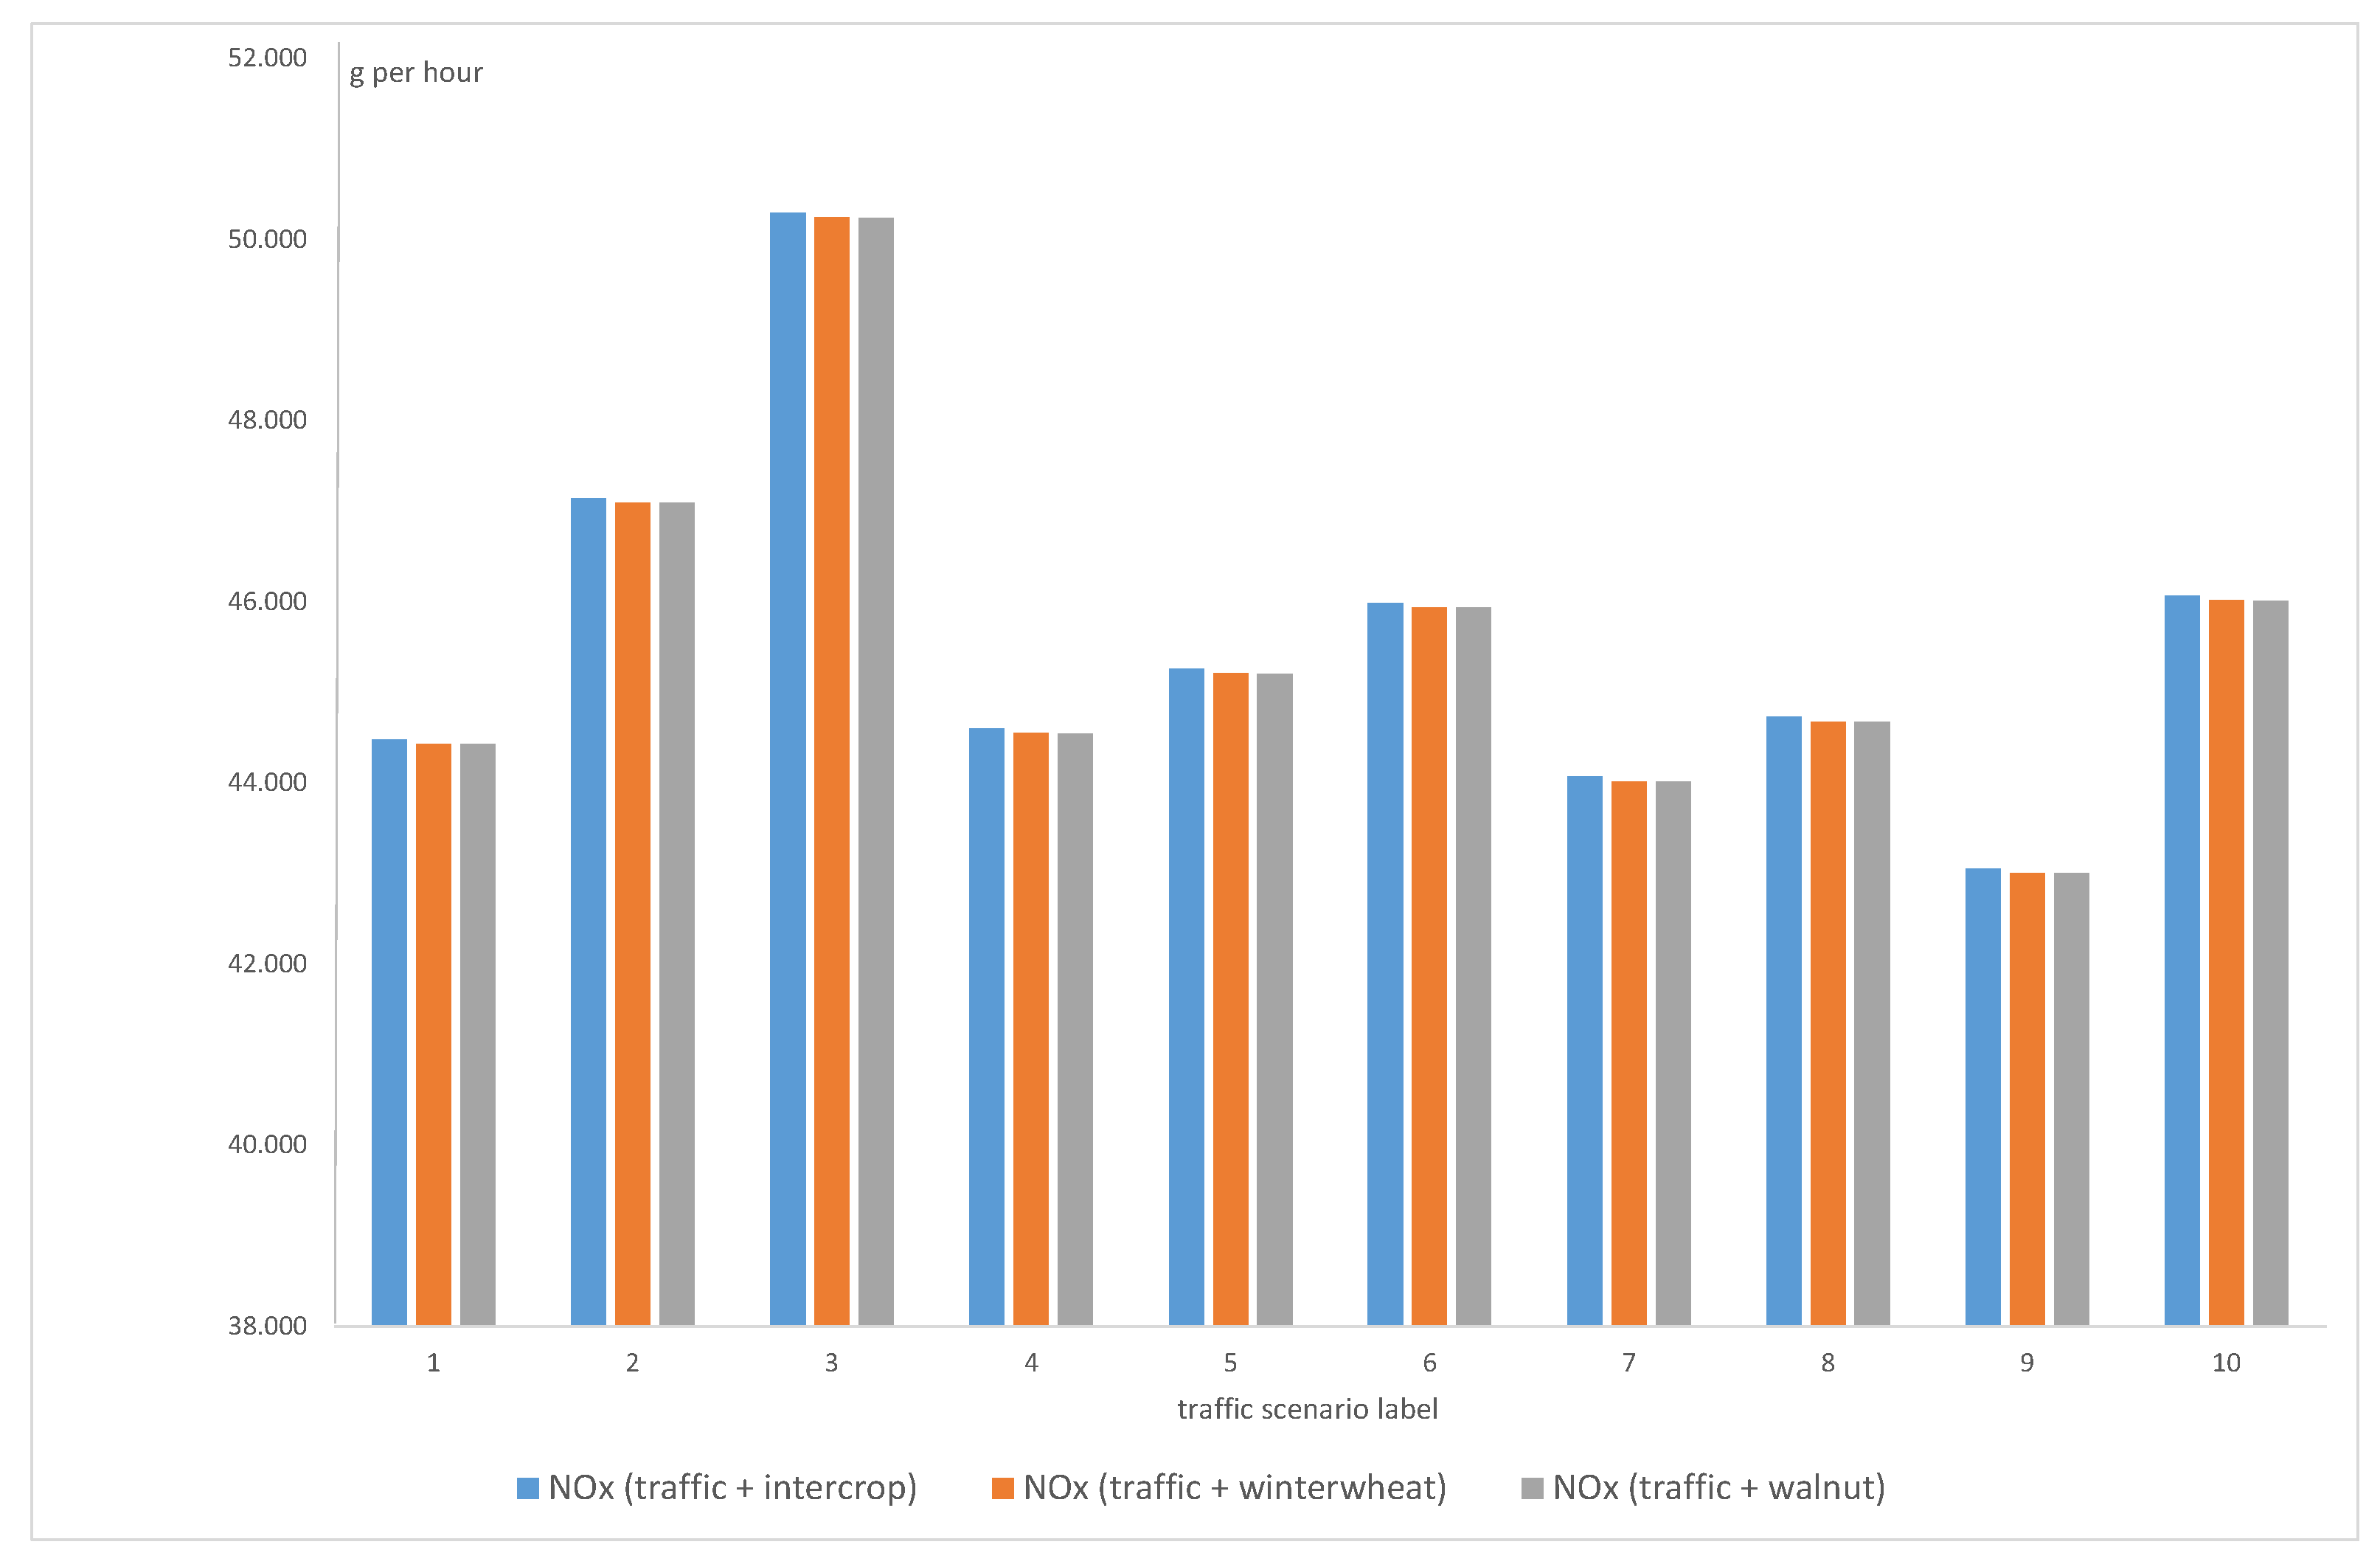
As we stated in the results (
Figure 6), the lowest NOx emissions were found in the walnut orchards and the counted traffic. These results were expected, because the joint impact is the combined impact of traffic and the type of agricultural production on NOx emissions. However, it is important to emphasize that the difference in NOx emissions between the types of agricultural production decreases under the influence of traffic, i.e., the difference in the impact of the type of agricultural production on NOx emissions becomes less significant. These are very important indicators for planning the management of NOx emissions from agricultural production in general. Namely, so far, the influence of fuel use and consumption in individual agricultural production systems has been observed, but not the influence of traffic itself on the changes in NOx emissions in agriculture, and the results of this research can be used to create more precise scenarios for reducing greenhouse gas emissions in general.
Key global agreements, such as the European Green Deal, the Paris Agreement, Common Agricultural Policy (CAP), and reports from the International Panel on Climate Change (IPCC), are integral to our approach. The benefits of intercropping farming, such as increased productivity and reduced GHG emissions, perfectly align with the guidelines outlined in these pivotal international and national policy documents. In emphasizing the importance of adopting new agricultural practices, the impact of traffic, and the share of freight and heavy goods vehicles in agricultural production, we position them as proactive and sustainable responses to the critical ecological and agricultural challenges highlighted in the CAP documents [
36].
5. Conclusions
The problem of air quality has become a global issue, therefore, different strategies to control air pollution are being investigated. Air pollution comes from different sources and is caused by different human activities, and this combined influence leads to the total emission load, so it should be analyzed that way. As part of this work, a methodology for analyzing the joint impact of agricultural production and traffic on the emission of nitrogen oxides was developed and tested.
The limitation of this research is the small number of data variations, therefore, the results should be viewed in that context. Longer monitoring periods of traffic load oscillations on a daily, monthly, and annual level would allow for a better insight into the actual NOx emission values. In this example, the traffic load of one peak hour was analyzed, which cannot give us a final picture, but gives a basic insight into the critical influences of traffic on the emission load, in this case NOx. Future research should include a larger and more variable database and statistical analysis of the influencing factors of the applied models.
Validation of the modeled impact should definitely be carried out on the data of the measured air pollution over a longer period of monitoring and in different field conditions and types of production (conventional, ecological, different amounts of fertilizer, different agrotechnical measures, etc.).
In our research, for the calculation of the NOx emissions, from the aspect of agricultural production, we took into account only the type of agricultural production and the yield, while the amount of nitrogen in all types of production was the same (100 kg ha−1). We decided on this approach in order to highlight the joint influence of traffic and agricultural production as precisely as possible, including as few different parameters as possible. Namely, considering that these included an ecological production of walnuts, winter wheat, and an intercropping system of wheat–walnuts, it is to be expected that, in conventional production, these differences will be significant. Likewise, the impact of agrotechnical measures was reduced to a minimum, i.e., the agrotechnical measures were the same in all of the systems; however, it is known that, by switching from conventional tillage to no-tillage, the emission of GHGs can be significantly reduced. The use of a no-tillage system has an effect on traffic less loaded with heavy vehicles, as well as a reduction in fuel consumption, and this should certainly be included in the modeling of future research on this issue.
The joint impact analysis methodology presented in this paper can be applied in the emission analysis of existing agricultural production areas and the existing associated transport network and traffic, as was carried out in this paper. This methodology has an even greater potential in choosing the best strategy for agricultural production, transport infrastructure, and traffic flow structure in limiting or reducing air pollution.


