Article

Quantifying the Impact and Importance of Natural, Economic, and Mining Activities on Environmental Quality Using the PIE-Engine Cloud Platform: A Case Study of Seven Typical Mining Cities in China

1
School of Earth Science, Chengdu University of Technology, Chengdu 610059, China
2
State Key Laboratory of Geohazard Prevention and Geoenvironment Protection, Chengdu University of Technology, Chengdu 610059, China
3
PIESAT Information Technology Co., Ltd., Beijing 100195, China
*
Author to whom correspondence should be addressed.
Sustainability 2024, 16(4), 1447; https://doi.org/10.3390/su16041447
Submission received: 1 January 2024 / Revised: 3 February 2024 / Accepted: 5 February 2024 / Published: 8 February 2024

Abstract

:
The environmental quality of a mining city has a direct impact on regional sustainable development and has become a key indicator for assessing the effectiveness of national environmental policies. However, against the backdrop of accelerated urbanization, increased demand for resource development, and the promotion of the concept of ecological civilization, mining cities are faced with the major challenge of balancing economic development and ecological environmental protection. This study aims to deeply investigate the spatial and temporal variations of environmental quality and its driving mechanisms of mineral resource-based cities. This study utilizes the wide coverage and multitemporal capabilities of MODIS optical and thermal infrared remote sensing data. It innovatively develops the remote sensing ecological index (RSEI) algorithm on the PIE-Engine cloud platform to quickly obtain the RSEI, which reflects the quality of the ecological environment. The spatial and temporal evolution characteristics of the environmental quality in seven typical mining cities in China from 2001 to 2022 were analyzed. Combined with the vector mine surface data, the spatial and temporal variability of the impacts of mining activities on the ecological environment were quantitatively separated and explored. In particular, the characteristics of mining cities were taken into account by creating buffer zones and zoning statistics to analyze the response relationship between RSEI and these factors, including the distance to the mining area and the percentage of the mining area. In addition, the drivers and impacts of RSEI in 2019 were analyzed through Pearson correlation coefficients pixel by pixel with 10 factors, including natural, economic, and mining. Regression modeling of RSEI in 2019 was performed using the random forest (RF) model, and these drivers were ranked in order of importance through random forest factor importance assessment. The results showed that (1) the ecological quality of mining cities changed significantly during the study period, and the negative impacts of mining activities on the ecological environment were significant. (2) The areas with low RSEI values were closely related to the mining areas and cities. (3) The RSEI in the mining areas of mining cities was generally lower than the average level of the cities. The RSEI gradually increased as the distance to the mine site increased. (4) The increase in the size of the mine area initially exacerbates the impact on the ecological environment, but the impact is weakened beyond a certain threshold. (5) The distance to the mining area is the most important factor affecting the quality of the ecological environment, followed by DEM, GDP, and precipitation. This study is of great importance for advancing sustainable development in mining cities and formulating sustainable strategies.

1. Introduction

The quality of the ecosystem is the result of the interaction between human activities and the natural environment [1], which is closely linked to harmonious regional development [2]. It can reflect the extent to which the sustainable development of human society affects the human living environment [3,4]. Urban land is expected to continue expanding in the coming decades [5], especially in rapidly urbanizing areas, and degradation of the natural environment is challenging [6]. In recent years, there has been continued large-scale development of mineral resources such as coal, iron ore, and rare earth ore [7]. It has provided important energy and material conditions for China’s rapid economic and social development [8,9]. However, the rise and prosperity of mining cities also pose significant challenges to ecosystems [10,11]. Mining, as the most human-disturbing of human activities [12], has caused great damage to the ecosystems of mining cities in particular. Mining causes surface movement and deformation, which in turn leads to groundwater reduction, surface subsidence, etc., ultimately leading to vegetation degradation and threatening the ecological environment. Therefore, timely, objective, and quantitative ecological environment evaluation of mining cities is of great significance for sustainable urban development and environmental protection [13,14].
Reasonable methods for evaluating the quality of the ecological environment are the basis for analyzing the benefits of the ecological environment [15]. Remote sensing has the advantages of a wide range of observations, long time-series monitoring, and speed [16,17]. It shows great potential and advantages in the field of eco-economic measurement [18]. Most of the previous studies were limited to the monitoring and evaluation of single remote sensing factors, such as the use of surface temperature to evaluate the urban heat island effect [19], the use of precipitation utilization rate of vegetation to evaluate regional desertification [20], and the use of the enhanced vegetation index to reflect the impact of drought on surface vegetation [21]. However, due to the complexity of ecosystems, changes in ecosystems are the result of a variety of factors [22]. It is difficult for a single indicator to comprehensively reflect the state of environmental quality [23,24]. Therefore, it is of great significance to explore the pattern of change in ecological factors and their synergistic relationship, with the aim of identifying a comprehensive indicator that can effectively integrate these factors to reflect the state of environmental quality more accurately [25]. Scholars have proposed various evaluation index systems for this purpose. For example, some studies have applied DS (Dempster Shafer) theory combined with decision-making models to ecological environment evaluation [26]. Some studies have coupled the pressure-state-response (PSR) model and the improved analytic hierarchy process with ranking and nonhierarchic comparison method (AHP-RANC) to construct a comprehensive evaluation system of environmental quality [27]. In addition, there are studies based on the driving-pressure-state-impact-response (DPSIR) model to assess the ecological condition of northern Iran [28].
However, these methods often suffer from problems such as subjectivity and do not fully and accurately reflect the true state of the regional ecological environment. The remote sensing ecological index (RSEI) is one of the most widely used indicators for evaluating the quality of the ecological environment [29]. It uses principal component analysis (PCA) to comprehensively couple four ecological indicators (greenness, humidity, heat, and dryness) to objectively assess environmental quality [30]. The four ecological indicators selected by RSEI are important factors that humans can intuitively perceive and are closely related to human survival [31], thus offering good representativeness [32]. The core of RSEI lies in PCA transformation. PCA transforms a set of possibly correlated variables into linearly uncorrelated principal components, effectively compressing the original variables while eliminating redundant information [33]. Consequently, the evaluation process of RSEI is free from the influence of human subjective factors, and possesses good scalability, visualization characteristics, and comparability across different time and space scales [34], making it capable of quantitatively depicting the quality of the city’s ecological environment and its changing trends [35]. When using RSEI, it is necessary to (1) construct RSEI using the first principal component (PC1); (2) use images from the growing season; and (3) apply a mask over water bodies [32]. The higher the value, the better the ecological quality of the region [36]. Researchers have widely applied RSEI in regional ecological quality assessment in different parts of the world, such as the Xiong’an New Area in China [37], the Three Gorges economic corridor in China [38], the Kolkata city group in India [39], the Samara region in Russia [40], and Freetown in Sierra Leone [41]. All of them have proven its validity and reliability in ecological quality assessment.
Traditionally, RSEI has been calculated by downloading remote sensing imagery and using desktop software such as ENVI 5.3 or ArcGIS 10.2 [42]. For assignments dealing with small regions or specified time periods, this approach is simple and convenient. However, for tasks covering large regions, such as urban agglomerations, countries, or the globe, or even timeframes spanning decades, this approach has significant limitations in terms of acquiring data and processing analyses [43], as well as facing a huge workload.
In recent years, with the rapid development and increasing maturity of cloud computing technology, remote sensing applications have gradually developed from the traditional desktop model to the cloud service pattern [44]. Nowadays, the remote sensing cloud computing approach can efficiently process and analyze large-scale geospatial data, providing unprecedented opportunities for the processing and analysis of massive, global-scale remote sensing data [45,46]. Among them, PIE-Engine is a spatiotemporal remote sensing cloud computing platform independently developed by PIESAT Information Technology Co., Ltd., Beijing, China to address the specific problems of remote sensing applications in China [47]. It provides localized and highly customized access to a rich set of data that is highly relevant to China’s research needs [44]. It also boasts robust computational performance. It is equipped to handle comprehensive workflow orchestration, flexible CPU and GPU resource scheduling, and distributed parallel computing for massive data remote sensing processing and real-time cloud computing capabilities [48]. Furthermore, PIE-Engine enhances data sharing convenience. It pioneers an “open, co-build, and share” model, allowing for the customized publication of SaaS application services, greatly facilitating data sharing and collaboration [48]. The robust performance and versatility of PIE-Engine have already been demonstrated in various fields of geology and remote sensing. Notable applications include the extraction of vegetation changes in the Yellow River Delta wetlands [49], the fine classification and mapping of wetlands [50], and the monitoring of the area of large inland lakes [51]. In addition, the remote sensing cloud computing platform helps researchers to easily access high-performance computing resources by providing a convenient environment for algorithm development and data interaction [52]. It is especially suitable for raster image operations, principal component transform analysis, and long-time series partition statistics. Therefore, the data resources provided by PIE-Engine are particularly suitable for projects with China as the study area [53].
Natural topography, climatic precipitation, urbanization, and economic development are often used as key indicators in the analysis of ecological drivers. It has been shown that elevation and slope are important factors influencing RSEI [54]. Natural factors such as vegetation, soils, and precipitation together dominate more than 40% of spatial variability in RSEI [55]. At the same time, previous studies have interpreted the coupling of ecological quality and urbanization from a remote sensing perspective and demonstrated a linear negative correlation between urbanization and ecological quality [56].
Among the various influencing factors, the level of economic development is regarded as a “catalyst” that affects the ecological environment [38]. In addition, scholars have conducted research using a variety of methods and models. For example, partial correlation analysis was used to study the response of RSEI to climate and anthropogenic factors [57]. A geographic detector was used to explore the influence of the digital elevation model (DEM), land use, and other factors on RSEI [58]. A geographically and temporally weighted regression (GTWR) model was used to analyze the mechanism of the influence of economic, anthropogenic, and other indicators on the ecological environment [59]. In addition, machine learning methods have been utilized in studies exploring the contribution and response relationships of different factors to RSEI [60]. In contrast to previous research, random forest is a machine-learning algorithm based on decision trees [61]. In the random forest algorithm, the generation of each tree relies on an independently sampled random vector that has the same distribution across all trees in the forest [62]. It is highly resistant to overfitting, noise anomalies, and multicollinearity between variables [63,64], and is particularly good at dealing with nonlinear relationships [65]. Consequently, random forest algorithms have been widely used in regression prediction problems [66] and feature classification [67] in the ecological field. In addition, the random forest model can effectively assess and rank the importance of each variable [68]. Therefore, it is also possible to further determine the degree of importance of each factor to the RSEI of mining cities, and this method has been applied in the study of ecological quality changes in mainland China [69]. However, it is important to note that random forest cannot directly determine the positive and negative correlations between drivers and RSEI. Therefore, it is necessary to use Pearson’s correlation analysis method to detect correlations between variables as a complement to random forest modeling [70].
There are two main problems faced at present. Firstly, traditional ecological environment evaluation methods are not suitable for ecological monitoring and assessment on a large scale. Although there have been studies using the GEE (Google Earth Engine) platform to construct RSEI [71], its coding process is complex and cumbersome. This pain point can be solved by using PIE-Engine, whose advantages in constructing RSEI models have not yet been widely promoted and deeply applied. Furthermore, there is a lack of comprehensive and integrated research on the changing conditions of ecological and environmental quality in mining cities. More in-depth studies are needed to clarify the relationship between mining activities and natural factors, environmental quality, and socioeconomic activities around mining areas. Therefore, this study took seven typical mining cities in China as examples. The environmental quality assessment framework of the PIE-Engine cloud platform was established. The environmental quality of mining cities from 2001 to 2022 was quantitatively evaluated through the cloud computing platform and its spatial distribution pattern and evolution were analyzed. It focused on analyzing the impacts of the mining area on the regional environmental quality. At the same time, it revealed the impact of mining activities, the natural environment, and socioeconomic and other drivers on the environmental quality of mining cities, and identified key drivers. This will provide a scientific basis for mining cities to assess sustainable development goals, thus realizing a win-win strategy for environmental governance and promoting sustainable development.

2. Materials and Methods

2.1. Study Area

The seven mining cities selected in this paper are mainly dominated by iron ore resources, which are distributed in North China, Northeast China, Central China, East China, Southwest China, and Hainan Province (Figure 1). (1) Panzhihua City has 7.18 billion tons of vanadium-titanium magnetite and other resources. The mines are mainly located in the East District, Yanbian County, and Miyi County in the north. (2) Tangshan City contains 6.2 billion tons of iron ore and is one of the three major iron ore concentration areas in China. The mines are mainly located in the northeastern areas of Qianxi, Qian’an, and Luanzhou. (3) Handan is a famous coal and high-grade iron ore-producing area in China, with an output of over 18 million tons and nearly 5 million tons, respectively. The mines are mainly located in Wu’an City, Fengfeng Mining District, and She County, which are on the west side of the Beijing-Guangzhou Railway. (4) Anshan City, with proven reserves of 10 billion tons, is China’s largest iron ore mining area. The Dagushan mine in Anshan City is the largest open-pit iron ore mine in Asia. (5) Ma’anshan City mines, the main mineral resources for iron ore, are mainly located east of the Yangtze River in Nanshan, Gushan, Huangmeishan, and other places. (6) Huangshi City has a long history of mining and metallurgy. The ores are mainly iron and copper symbiotic ores, and the iron minerals are mainly magnetite and hematite. The mining area is mainly located in the northwest of Daye City. (7) The reserves of Shilu iron ore in Changjiang Lizu Autonomous County account for 71% of the country’s iron-rich ore reserves.

2.2. Data Acquisition and Preprocessing

The data processing mode of this study is carried out by PIE-Engine combined with local computing. PIE-Engine is a remote sensing cloud computing platform similar to GEE, which provides multisource remote sensing satellite data, including China’s Resource series and Gaofen series data, as well as foreign Landsat and MODIS series data. In this study, administrative boundaries, land use, DEM, NDVI, and precipitation data were obtained on a cloud platform by processing data services provided by the cloud. The specific data products and their resolutions are detailed in Table 1. The MODIS standard products for the growing seasons before and after a total of three years were selected as the base data for RSEI calculations [72]. For example, 2022 MODIS imagery was synthesized by averaging June to September images for 2021, 2022, and 2023 to ensure that a sufficient number of valid pixels were acquired. MODIS surface reflectance products were subjected to pixel-by-pixel de-clouding and quality filtering prior to synthesis based on a bitwiseAnd() operation on the sur_refl_qc_500m band and sur_refl_state_500m band. refl_state_500m bands for the bitwiseAnd() operation. The final processed RSEI data has a resolution of 500 m.
Driving factor data such as DEM, nighttime light intensity, PM2.5 concentration, and meteorology were downloaded or processed through the PIE-Engine cloud platform. Slope was calculated by ArcGIS based on DEM. The distance to the mine site was calculated by Euclidean distance, setting the coastal zone as an obstruction line. Consistency of raster attributes such as raster extent, number of rows and columns, resolution, etc., needs to be ensured when processing other factors (e.g., distance to mine) produced with non-cloud platforms. The month-by-month data were summed up to synthesize the annual data. All driving rasters were projected to the “Asia_North_Albers_Equal_Area_Conic” coordinate system and standardized to a resolution of 1 km.

2.3. Methods

In this study, seven typical mining cities in China were selected as research objects. The PIE-Engine cloud platform was used to rapidly generate remote sensing ecological indices (RSEI) as a way to reflect the spatial and temporal changes in the environmental quality of mining cities. In addition, this study separated the RSEI of mining areas based on mine surface data and compared the differences between the RSEI of mining cities and mining areas. The relationship between the RSEI and the distance and area of mining areas was analyzed. Finally, the connection between each driving factor and RSEI was explored through correlation analysis, and the random forest model was used for RSEI simulation and factor importance analysis. The specific technical process is shown in Figure 2.

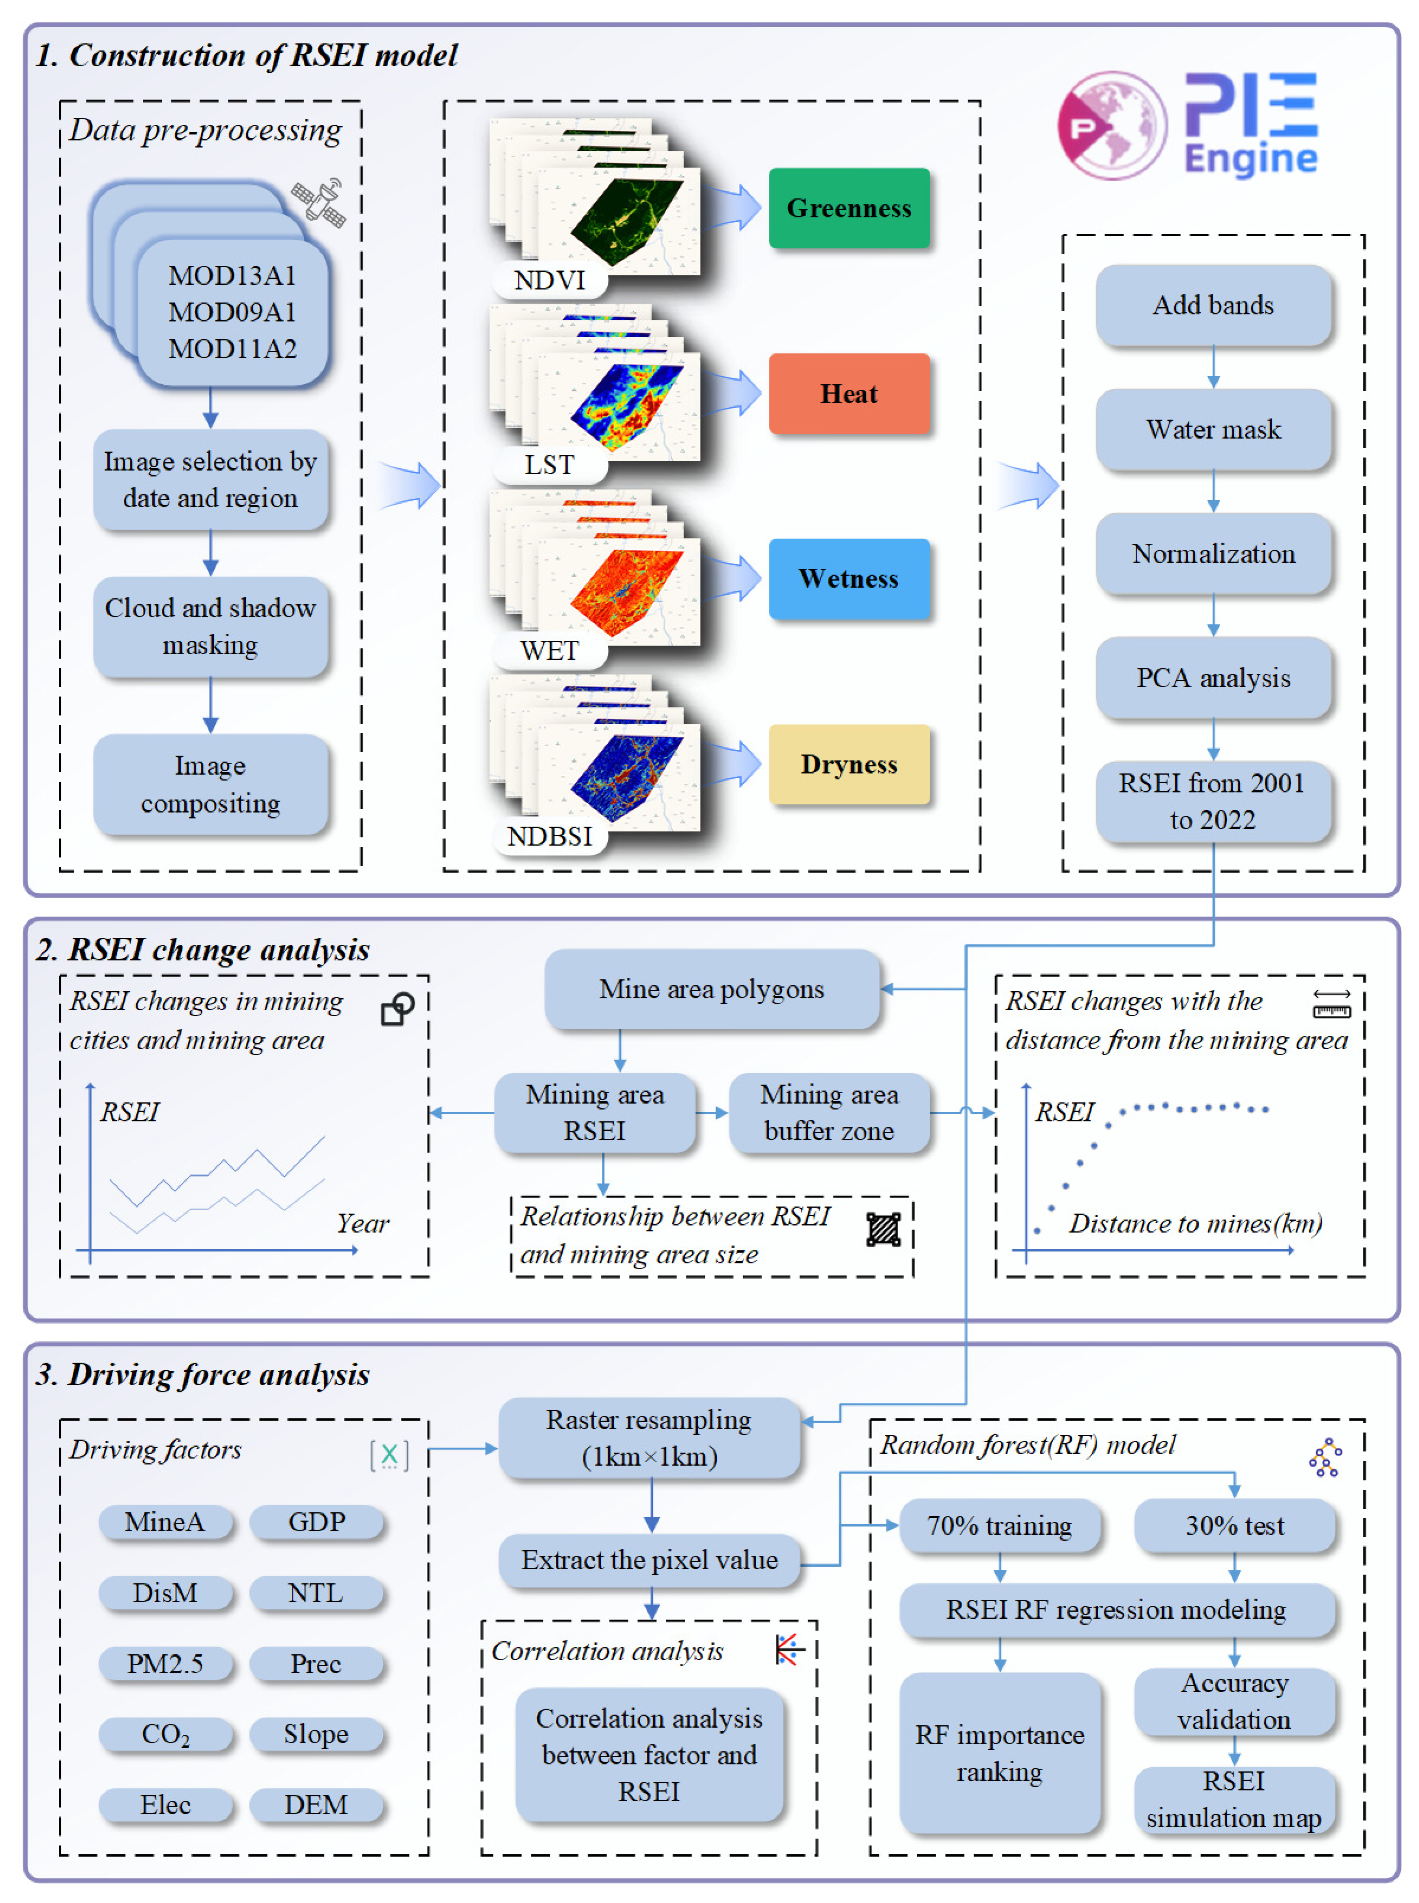
2.3.1. Construction of the Remote Sensing Ecological Index Evaluation Model

The remote sensing ecological index (RSEI) combines four evaluation indexes, the normalized vegetation index (NDVI), coma-cap transformed moisture component (Wet), land surface temperature (LST), and built-up and bare soil index (NDBSI), which represent greenness, humidity, heat, and dryness in the region, respectively. Since the scale of the individual indicators is not uniform, it is necessary to normalize the indicators [80]:
N I i = I i I m i n I m a x I m i n
where N I i is the normalized indicator value at image element I; I i is the initial value of the indicator at image element i; and I m i n , I m a x are the minimum and maximum values of the indicator.
Principal component analysis (PCA) was applied to centralize the information of each index to the first principal component to obtain the initial ecological remote sensing index R S E I 0 :
R S E I 0 = f N D V I , W e t , L S T , N D B S I
In order to facilitate the comparison of the indicators, Equation (1) was used to normalize R S E I 0 [81]. In order to facilitate the comparison of the indicators, the R S E I was normalized using Equation (1). The normalized R S E I is the constructed remote sensing ecological index. The RSEI is between 0 and 1, and the larger the value, the better the environmental quality in the study area [82].
In addition, the modified normalized difference water index (MNDWI) was used to mask water bodies in conjunction with the corresponding year’s land use data [83] to exclude water bodies from interfering with the inverted moisture component [84]. When processing the land use data, pixels with categories of water bodies and wetlands were excluded. The calculation formula of MNDWI is as follows:
M N D W I = ρ g r e e n ρ m i r / ρ g r e e n + ρ m i r
where ρ g r e e n ,   ρ m i r denote the green and mid-infrared bands corresponding to MOD09A1 images, respectively.

2.3.2. Pearson Correlation Analysis

Pearson’s correlation coefficient was used to analyze the correlations between the 10 drivers and RSEI on a pixel-by-pixel analysis, revealing the degree of interaction and association between each driving factor and RSEI. The formula is as follows:
r = i = 1 n r s e i i r s e i ¯ x i x ¯ i = 1 n r s e i i r s e i ¯ 2 i = 1 n x i x ¯ 2
where r is the correlation coefficient between RSEI and driving factor x, r s e i ¯ is the average of all RSEI pixels, x ¯ is the average of all pixels of driving factor x, and n is the total number of the pixels. The larger the absolute value of the correlation coefficient r , the stronger the correlation between the driving factor x and RSEI [85]. A plus or minus sign in front of r indicates a positive or negative correlation between the two.

2.3.3. Random Forest Regression Model

Random forest models are integrated learning methods consisting of numerous decision trees [86]. Models are trained by independent random sampling from the training dataset using the bootstrap method to form multiple independent subsets [87,88]. Each subset is used to generate a decision tree independently, and each tree makes predictions independently. The final prediction of the model is based on the average vote of all the decision trees [89]. In this study, the random forest regression method was used to predict the distribution of the remote sensing ecological index (RSEI) for each mining city. The inputs to the model include the raster data of the 10 drivers for each mining city in 2019 as the independent variables, and the RSEI raster data of the corresponding city as the dependent variable. The pixel values of these rasters were extracted by the Extract Multi Values to Points tool, and the blank values were eliminated to construct the random forest model samples. In this study, each image element of the raster was extracted to ensure sufficient model training and validation samples. The main tuning parameters in the model training process include the number of trees (ntree) and the number of features selected at each split (mtry). After testing and parameter tuning, the number of trees was set to 1000 and the number of features considered during splitting was set to 3. The training process of the random forest model was carried out in the R 4.2.3 environment using the randomForest package. After the training was completed, the trained randomForest model for each city was applied to the overall RSEI spatial distribution prediction for that city, and the residual maps were drawn.

2.3.4. Accuracy Verification of Random Forest Models

The accuracy of the model is assessed by the coefficient of determination (), calculated as follows:
R 2 = 1 S r e s S t o t
where S r e s is the sum of squares of the difference between the simulated and actual values of RSEI, which is the residual sum of squares. S t o t is the total sum of squares.
In addition, the root mean square error (RMSE) and mean absolute error (MAE) of the model are calculated by the following equations, respectively:
R M S E = 1 n i = 1 n R S E I i R S E I ^ i 2
M A E = 1 n i = 1 n R S E I i R S E I ^ i
where n denotes the number of pixels in the validation set, and R S E I i and R S E I ^ i are the actual RSEI values and model-simulated RSEI values, respectively.

3. Results

3.1. Analysis of Spatiotemporal Variation of the RSEI Long Time Series in Mining Cities

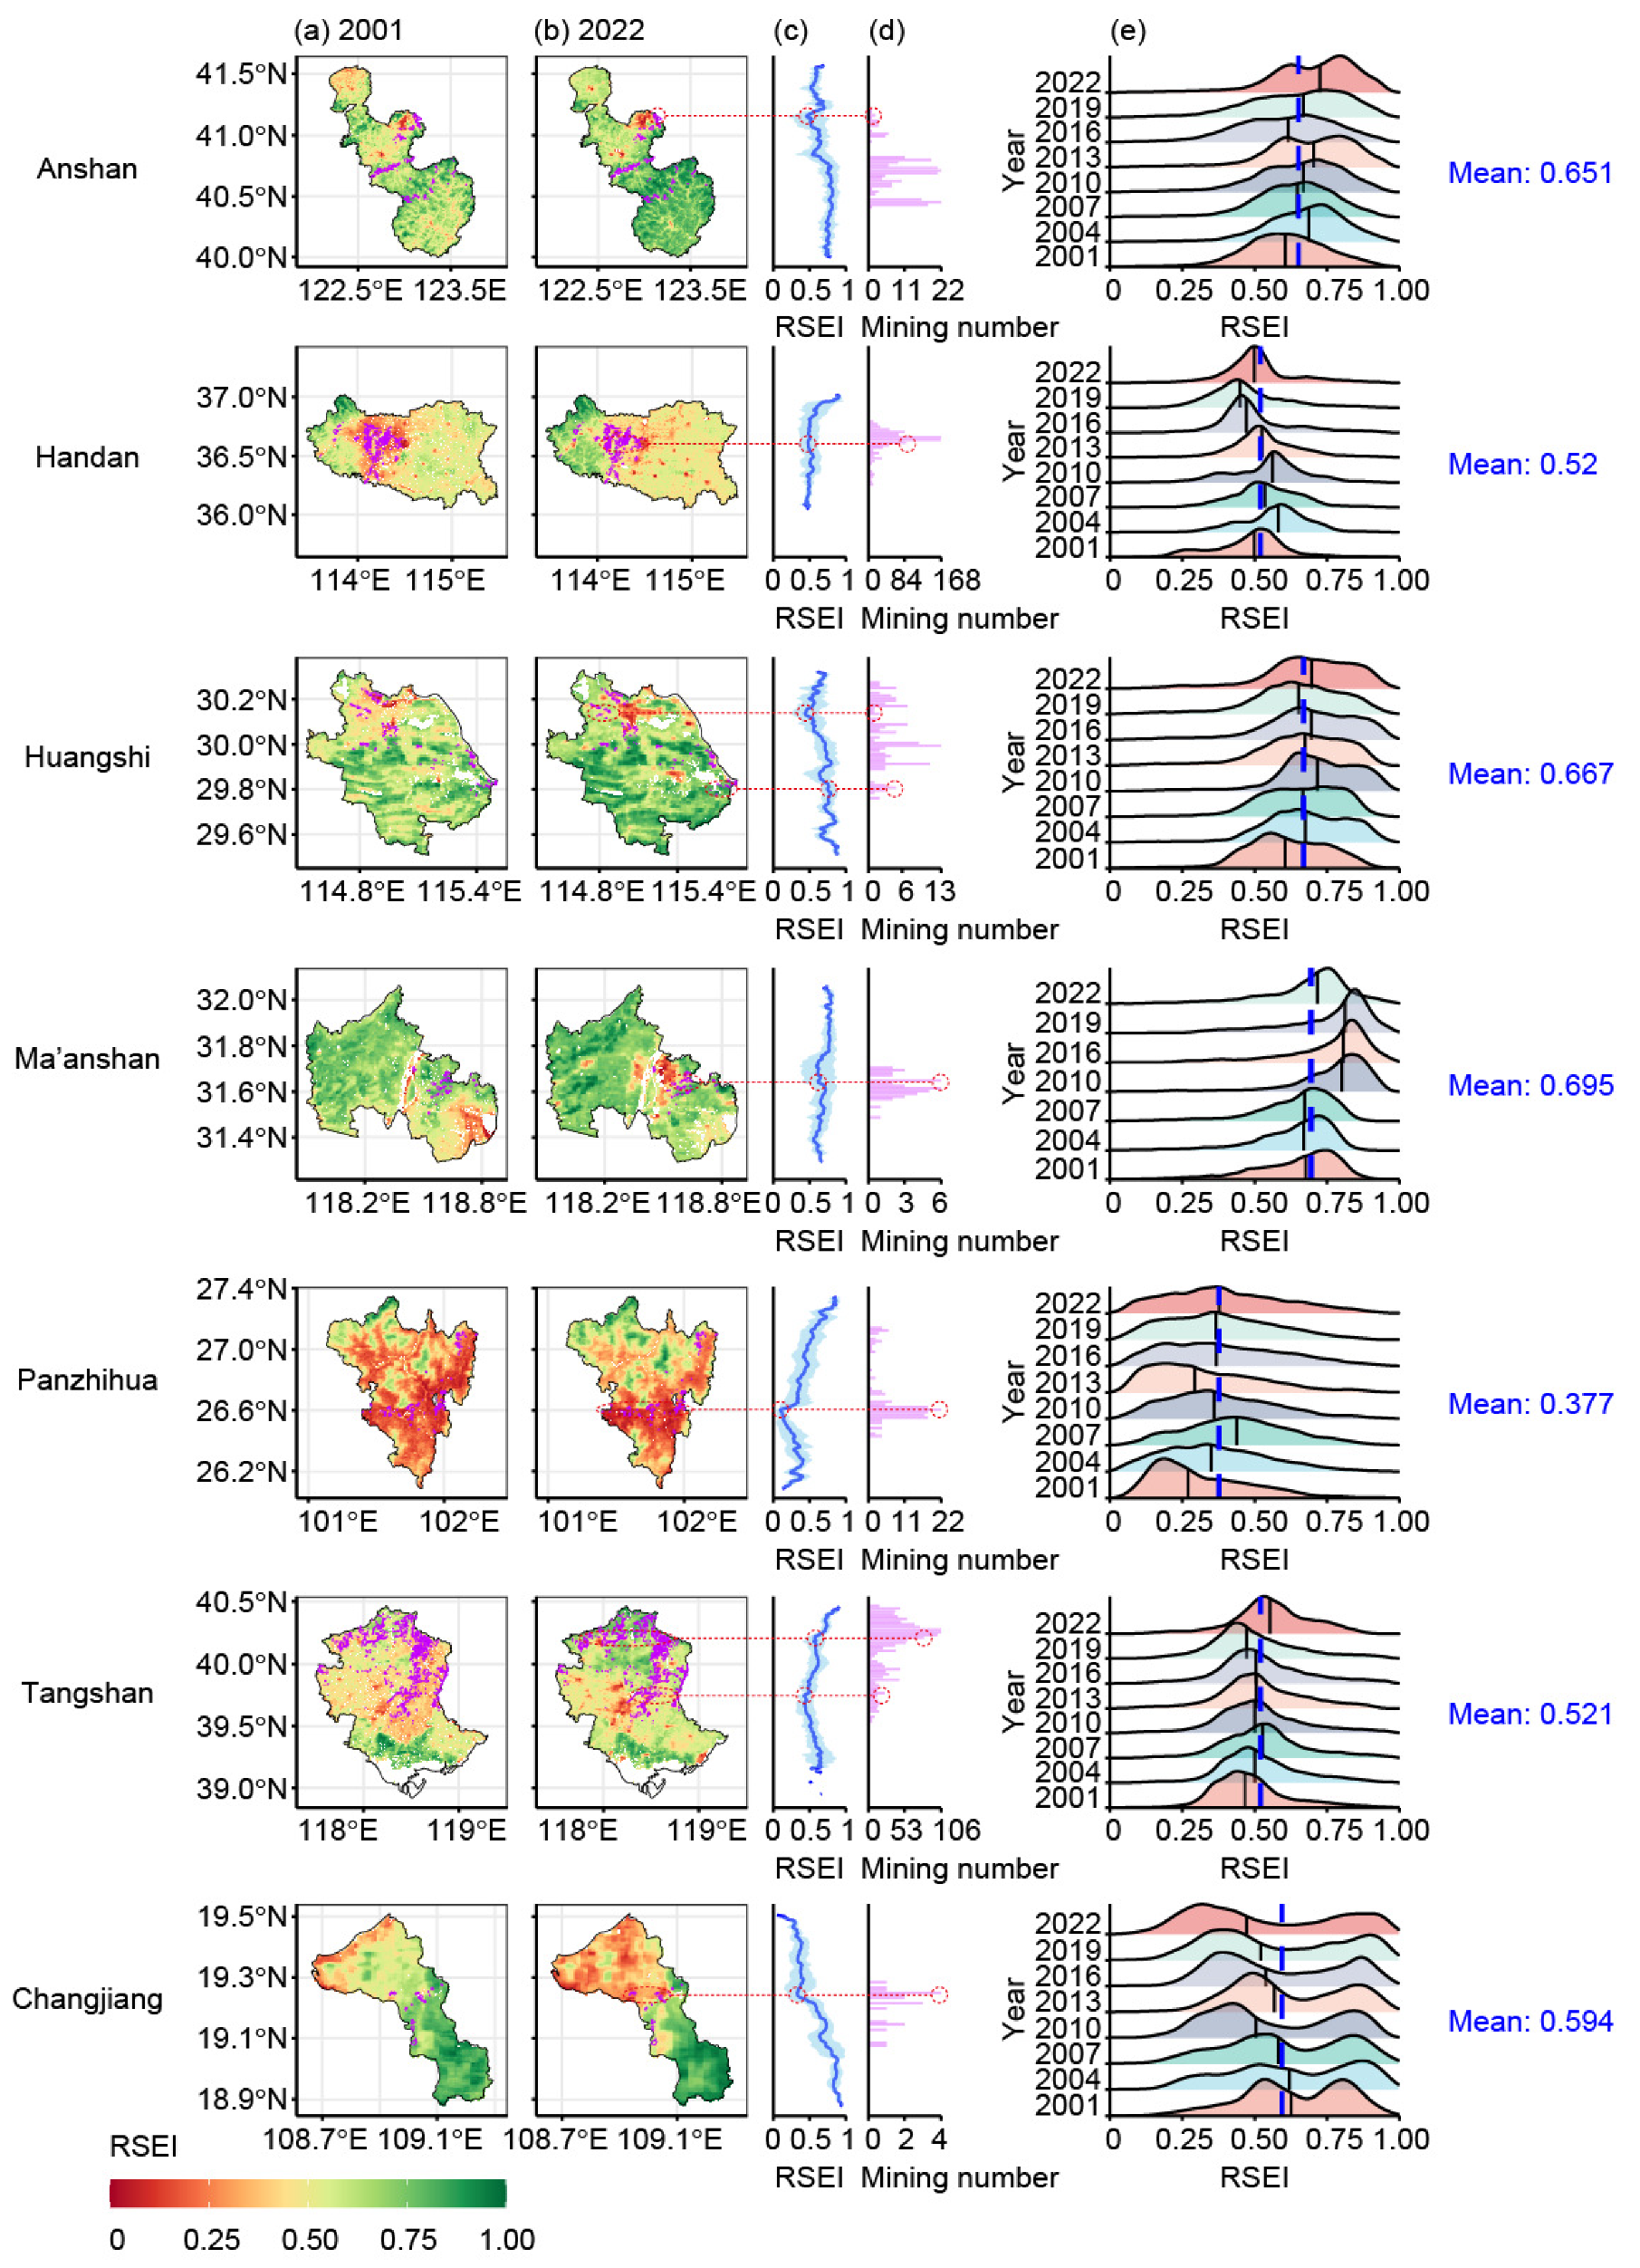
3.1.1. Changes in the Spatial Pattern of RSEI in Mining Cities

From 2001 to 2022, the remote sensing ecological index (RSEI) of mining cities changed significantly (Figure 3a). In general, with the increase of urbanization and the expansion of mining cities, the RSEI of the urban core area of mining cities in 2022 decreased significantly compared with that in 2001, which is manifested by the deepening and widening of the red area (low-value area) in the figure. For instance, this can be seen in Lishan District, Tiexi District, and Tiedong District in northeast Anshan City and Haicheng City in the middle of the city; Daye City in north Huangshan City; Huashan District and Yushan District in north-central Ma’anshan City; and the central and western coastal areas of Changjiang Lizu Autonomous County. The decline in RSEI is particularly significant in these areas, reflecting the significant deterioration of ecological quality in the urban areas over the past 20 years.
On the contrary, urban mountain forests with high vegetation cover have a better ecological quality, i.e., the green areas in the figure (high RSEI areas). These areas have grown significantly in size since 2001, and the “green” part of the area has deepened. For example, this can be seen in Xiuyan Manchu Autonomous County in the south of Anshan City; She County in the southwest of Handan City; the forest farms in the central and south-central part of Huangshi City and the mountainous areas around the Qingshan Reservoir; and Taihu Mountain National Forest Park, Baifu’an, Xita, and Handongshan forest farms in the western part of Ma’anshan City. Changes in the latitudinal distribution of RSEI in mining cities (Figure 3b) and the latitudinal distribution of the number of mining sites (Figure 3c) show some correlation in some cities. For example, the city of Anshan shows an RSEI trough at 41° N latitude, where there are mines and cities distributed, which together lead to a decrease in the mean RSEI value. In the central part of Panzhihua City at 26.6° N latitude, dense urban areas and high-density mining sites combine to cause the lowest RSEI mean value in the region. In the range of 19.2 to 19.3° N in the central part of Changjiang Lizu Autonomous County, the number of mining sites is high and the mean value of RSEI is also lower.

3.1.2. The RSEI Pixel Distribution Characteristics and Mean Value Changes over the Years

The distribution results of RSEI pixels (Figure 3e) show that the overall distribution of RSEI pixels in mining cities shows a pattern of more in the middle and less at both ends. Most of the cities, such as Handan, Ma’anshan, Panzhihua, and Tangshan, show a single peak distribution with only one peak of more concentrated RSEI pixels. Anshan City, Huangshi City, and Changjiang Lizu Autonomous County show a bimodal distribution, with two peaks widening over time, indicating that the RSEI pixel values are moving in two opposite directions and the difference is gradually increasing. Specifically, areas with lower environmental quality have experienced a continued decline, while regions with better environmental quality show improvement. This divergence is prominently depicted in the widening gap between the two peaks. Overall, Ma’anshan City has the highest multiyear average value of RSEI (0.695), showing that its environmental quality is the best among mining cities. Panzhihua City, which is a traditional mineral resource city, has the lowest mean RSEI value (0.377), reflecting its poor environmental quality.

3.2. Analysis of Changes in the Spatial and Temporal Difference Characteristics of RSEI in Mining Areas and Mining Cities

3.2.1. Differences in Spatial Patterns of RSEI

In order to deeply explore the spatial and temporal distribution characteristics of the environmental quality in the mining areas of mining cities, this study divided the RSEI values of mining cities in 2022 into 10 classes at 0.1 intervals and focused on observing the typical mining areas (Figure 4a). By overlaying the analysis with the vector boundary data of mining areas, it can be seen that the RSEI can well characterize the morphological range of mining areas. There is a significant difference between the RSEI values of mining and non-mining areas, with the RSEI values of mining areas being lower than those of the surrounding green areas with higher vegetation cover. It is slightly higher than those of impervious surface areas such as towns and residential areas. By extracting the RSEI pixels in mining areas from 2001 to 2022 and comparing them with the citywide RSEI pixel density (Figure 4b), it is observed that the peak RSEI density in mining areas of most mining cities is generally lower than the citywide peak, especially in Anshan City, Handan City, Huangshi City, and Panzhihua City, where this result is most obvious. In contrast, the differences between the peak RSEI pixel densities in the mining areas and the city as a whole in Ma’anshan City, Tangshan City, and Changjiang Lizu Autonomous County are not significant.

3.2.2. Differences in Temporal Changes in RSEI

The mean values of the RSEI image pixels and their differences between the mining areas and the city as a whole were further analyzed (Figure 4c). It can be seen that the mean values of RSEI in the mining areas of Anshan, Handan, Huangshi, Panzhihua, and Tangshan are always lower than the citywide mean. The temporal trends of the peaks and troughs of the two can basically match, and there is significant consistency between the changes in the mine area and the citywide mean value.
Specifically, the difference between the mine area and the citywide RSEI mean in Anshan City has gradually increased since 2001, reaching a peak in 2013. The rapid growth of the mean RSEI value in the mining area of Handan City and the decrease of the difference year-by-year reflect the improvement of its ecological quality. In Huangshi City, the variability of the two is more stable, with the difference always stabilizing at around 0.10. The mean RSEI value in the mining area of Ma’anshan City was once higher than the citywide average until 2013, after which it began to decline, with the largest difference in 2022. Panzhihua City’s citywide RSEI mean is on an upward trend, but the difference between the mine and citywide means is widening each year. The difference between the two is narrowing in Tangshan City, and the RSEI in the mining area is trending beyond the citywide average. Changjiang Lizu Autonomous County has the smallest difference between the mine area and the citywide RSEI mean, and after 2010, the mine area mean is always lower than the citywide mean.

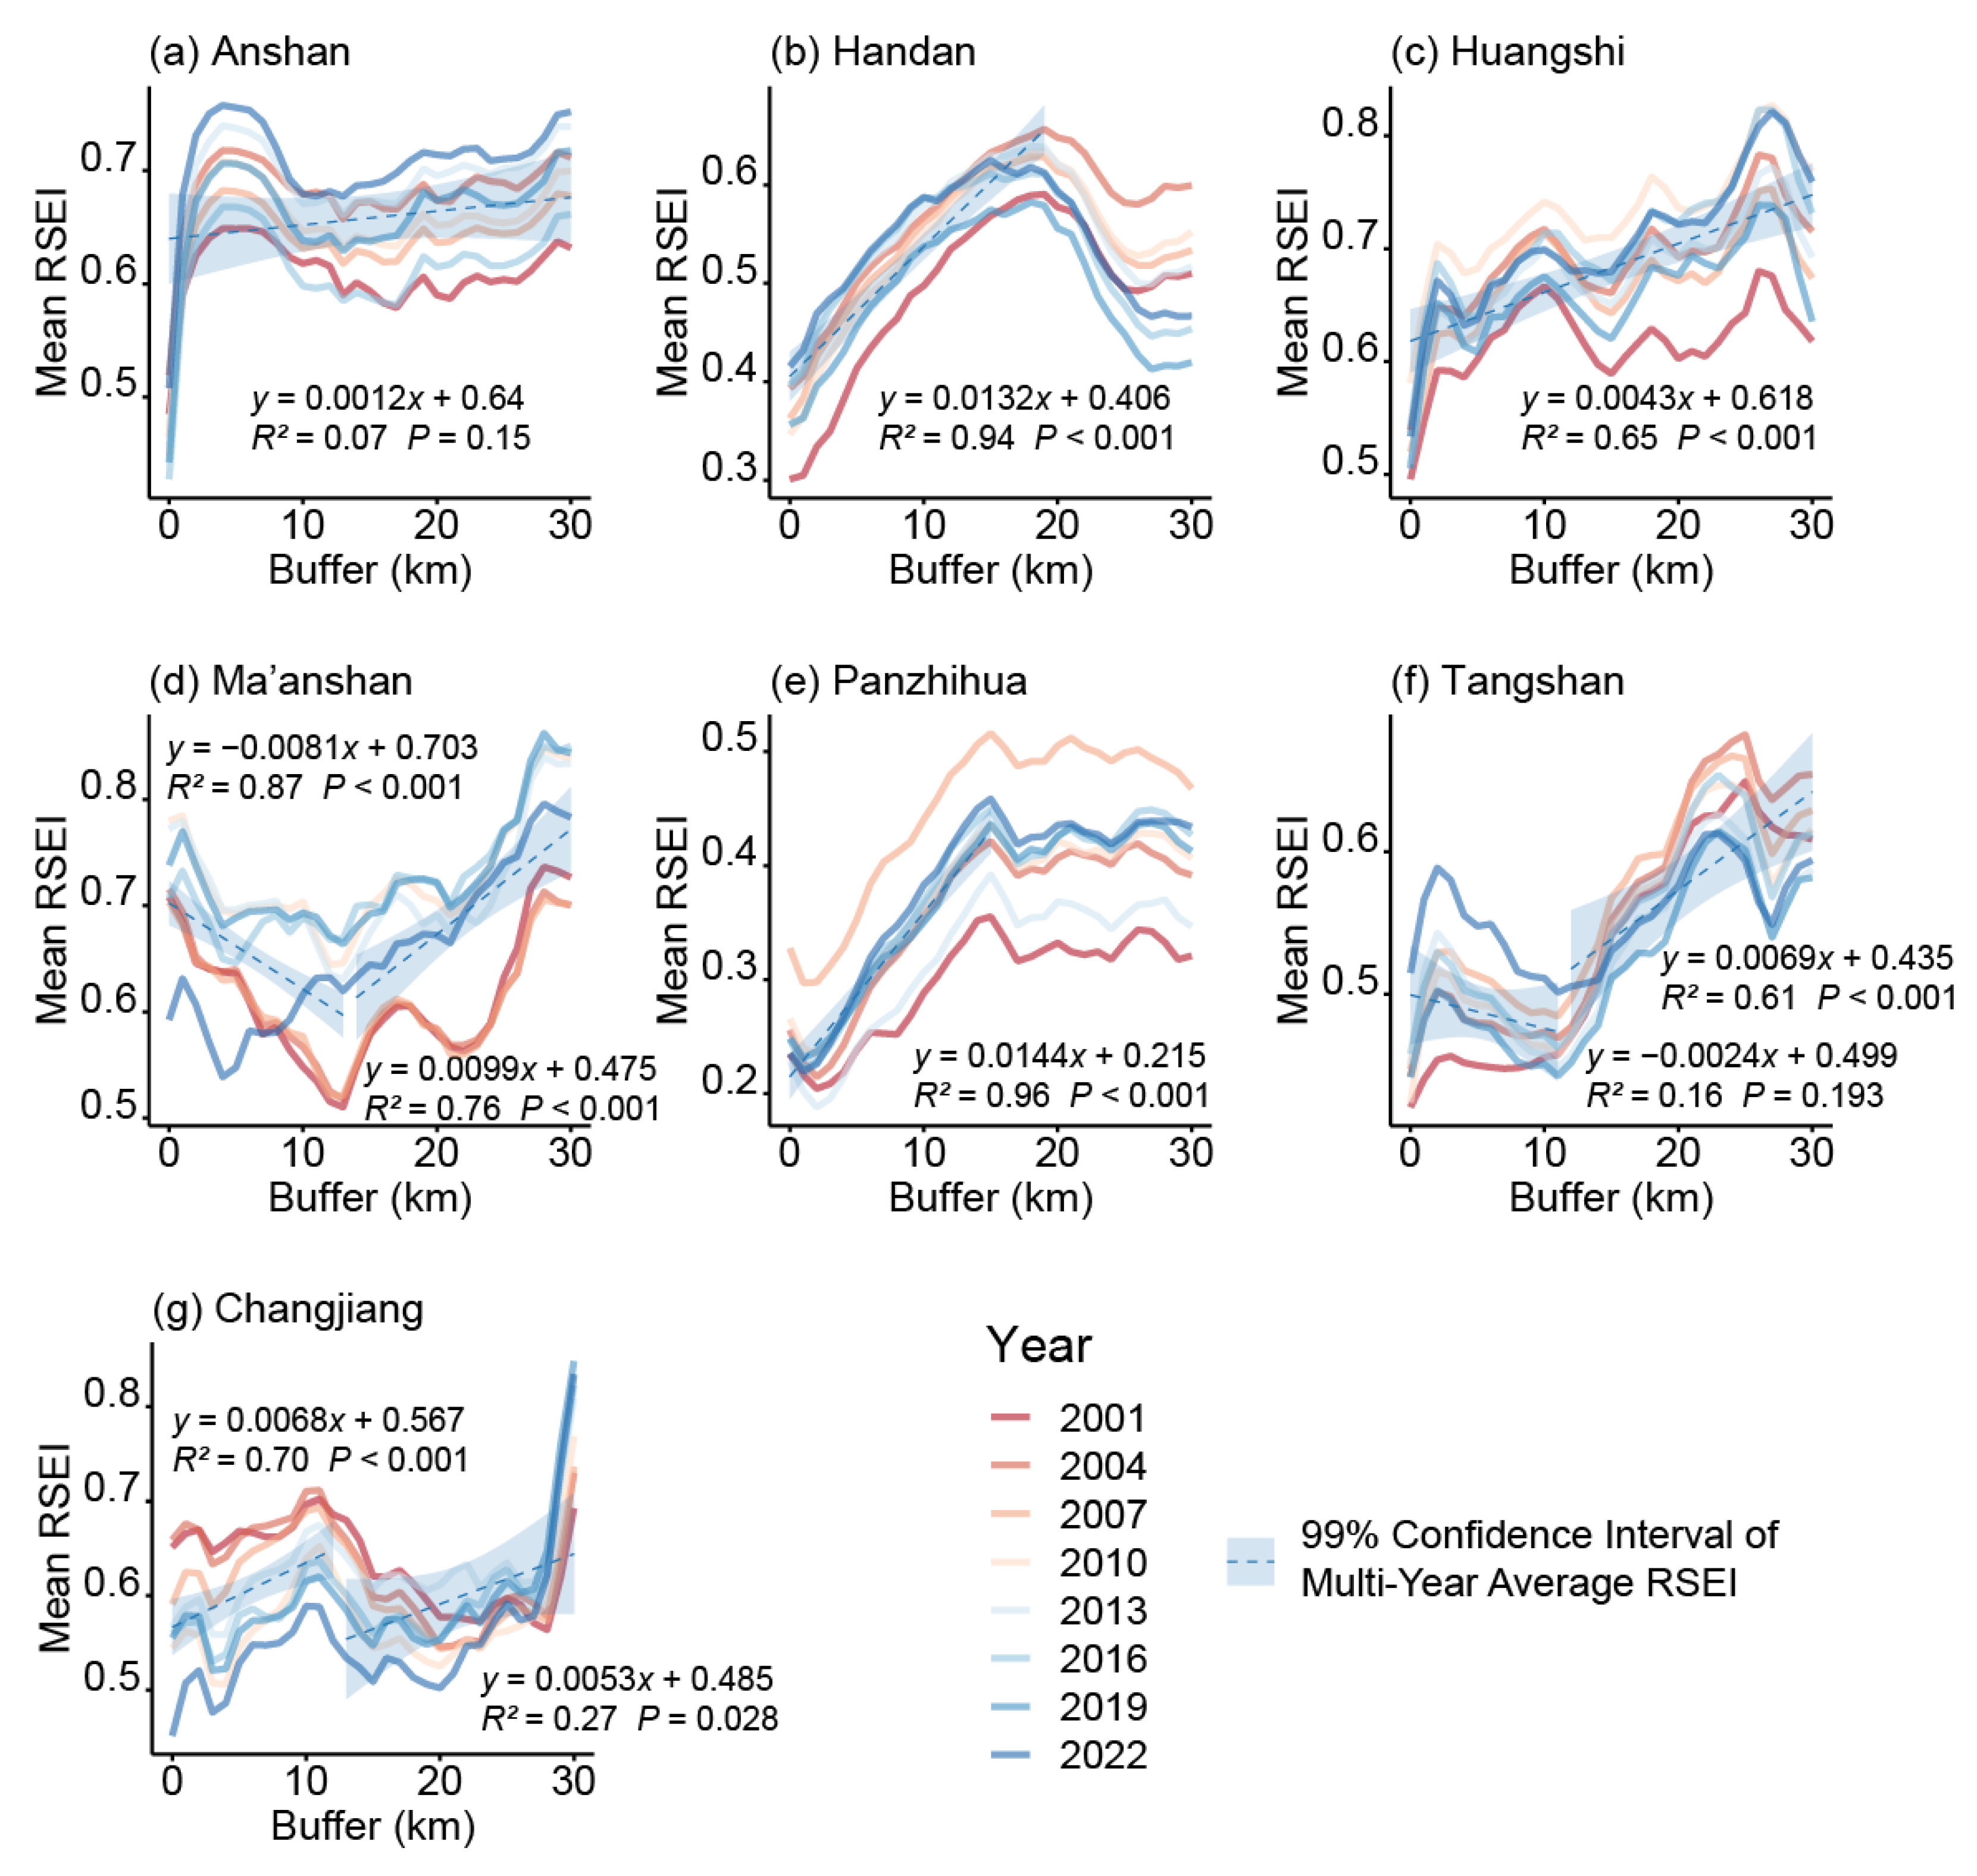
3.3. Analysis of the Gradient Change in RSEI along the Distance from the Mine Site

According to the mine vector boundaries, buffer gradients at 1 km intervals were created in ArcGIS to explore the variation in the mean values of the RSEI (Figure 5). The process of zonal statistics of the year-by-year mean values of the RSEI and fitting the trend to the multiyear mean values was done in R 4.2.3, where the mean value of all image pixels within the mine was computed when the distance was 0. The average value of all image elements within the mine was calculated when the distance was 0.
For most of the mining cities studied in this paper, there is a significant process of incremental increase (improvement) in the mean RSEI value as the distance to the mine increases. The speed of the increment is different in different cities, and there are differences in the critical distance at which the increment stops or stabilizes and decreases. Anshan has the most significant incremental trend of RSEI mean, reaching the peak of RSEI at a buffer distance of 4 km from the mine, after which it declines slightly and then fluctuates upward. In Handan, the RSEI increases with distance to the mine and reaches its maximum value at 18 km. In Huangshi City, the RSEI shows a fluctuating upward trend with the increase of distance to the mine, and reaches the peak at 27 km, at which time the mean value of RSEI is 0.774. In Ma’anshan City, the RSEI shows a decreasing and then increasing trend with the increase of distance, with a trough at 13 km, and after that, the RSEI rises rapidly. Panzhihua City RSEI has been in an increasing trend in the first 15 km, after which the RSEI bands around 0.41. Tangshan City overall decreases first and then rises, and the 11 km distance to the mine is the transition point of decline to rise. Changjiang Lizu Autonomous County is in a wave upward trend in the first 11 km.

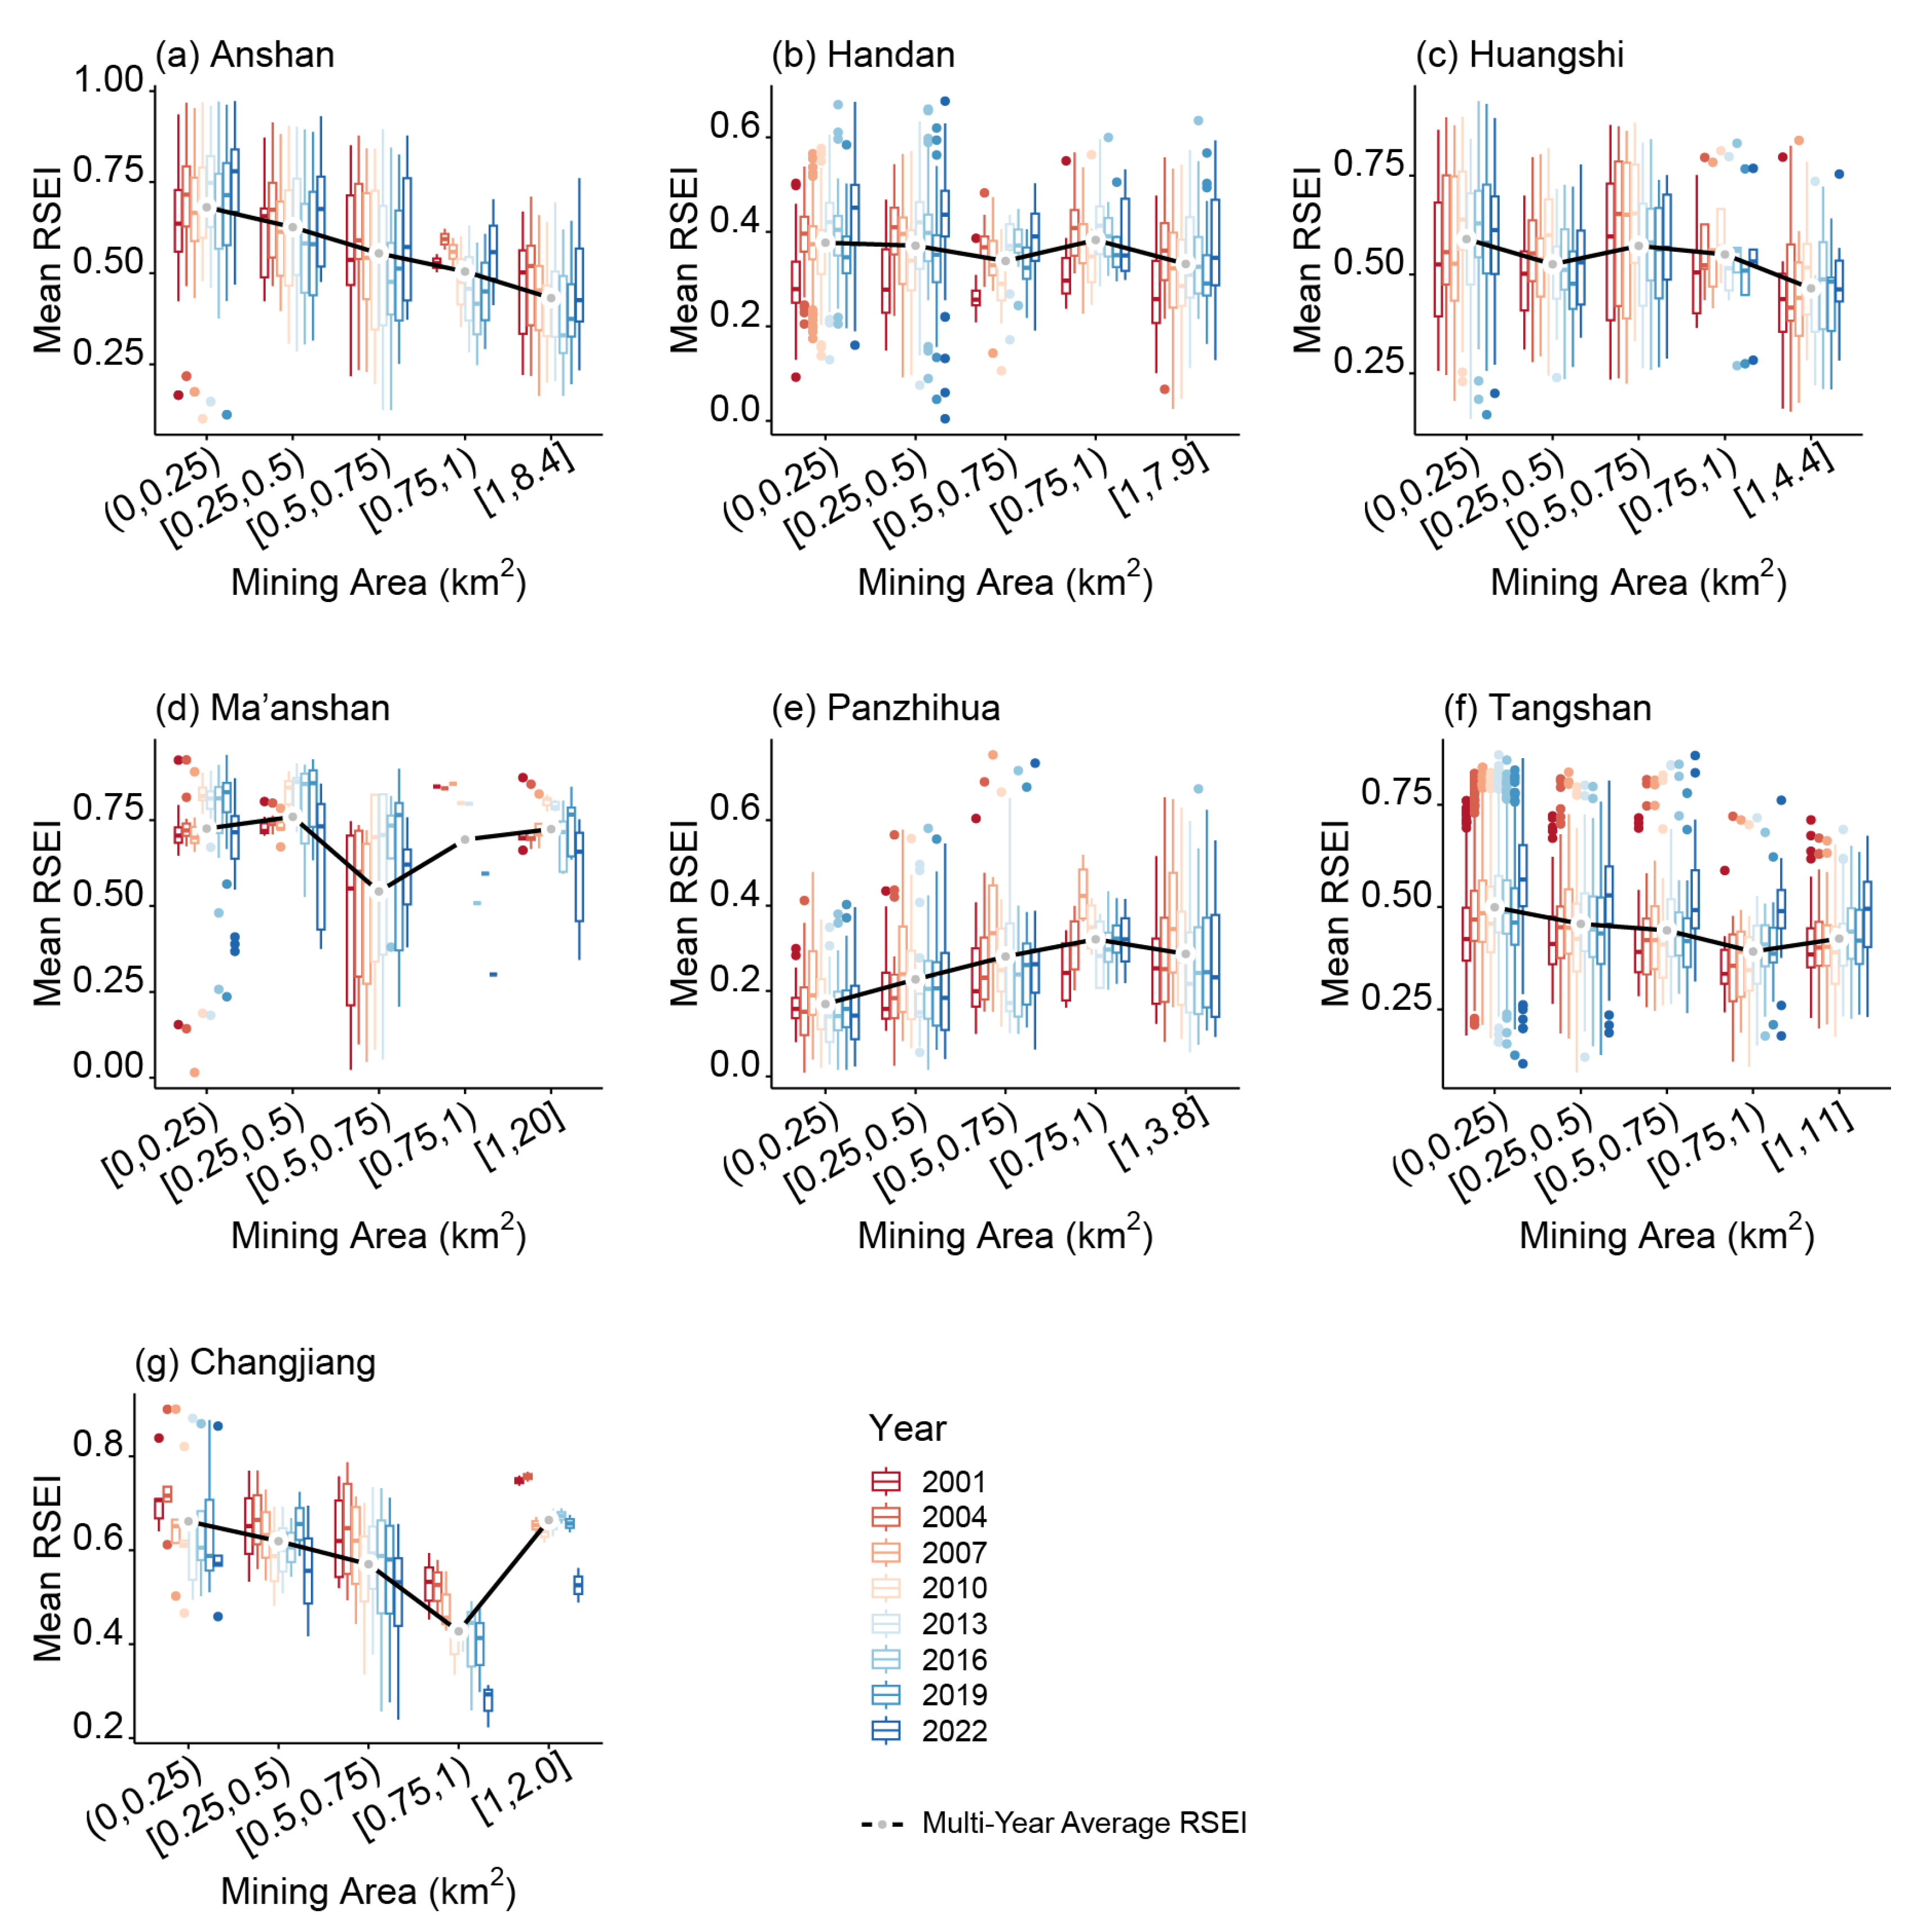
3.4. Analysis of the Relationship between RSEI and Mine Area

The area of each mining area was calculated in ArcGIS, and the RSEI mean value of each mining area was extracted for analysis (Figure 6). Mining areas were divided into different area intervals for statistical purposes: <0.25 km2, 0.25~0.5 km2, 0.5~0.75 km2, 0.75~1 km2, and ≧1 km2. The RSEI values of the mining areas in Anshan City were negatively correlated with the area of the mines, and the trend was the most significant among the seven mining cities. The mean value of RSEI was as high as 0.681 for mine areas smaller than 0.25 km², and decreased to 0.432 for mine areas larger than 1 km². The RSEI values of Huangshi and Tangshan also showed a decreasing trend with the increase of the mine area, although the trend was more moderate. The relationship between the RSEI value and the mine area in Handan is not obvious, and the mean value fluctuates between 0.332 and 0.382. The RSEI of Ma’anshan City and Changjiang Lizu Autonomous County showed a decreasing and then increasing trend with increasing mine area, with Ma’anshan City having the lowest RSEI, in the interval of 0.5 to 0.75 km², and Changjiang Lizu Autonomous County having the lowest RSEI, in the interval of 0.75 to 1 km². Unlike other cities, the RSEI of mining areas in Panzhihua City first increased and then decreased with the increase in area.

3.5. Analysis of Driving Factors of RSEI in Mining Cities

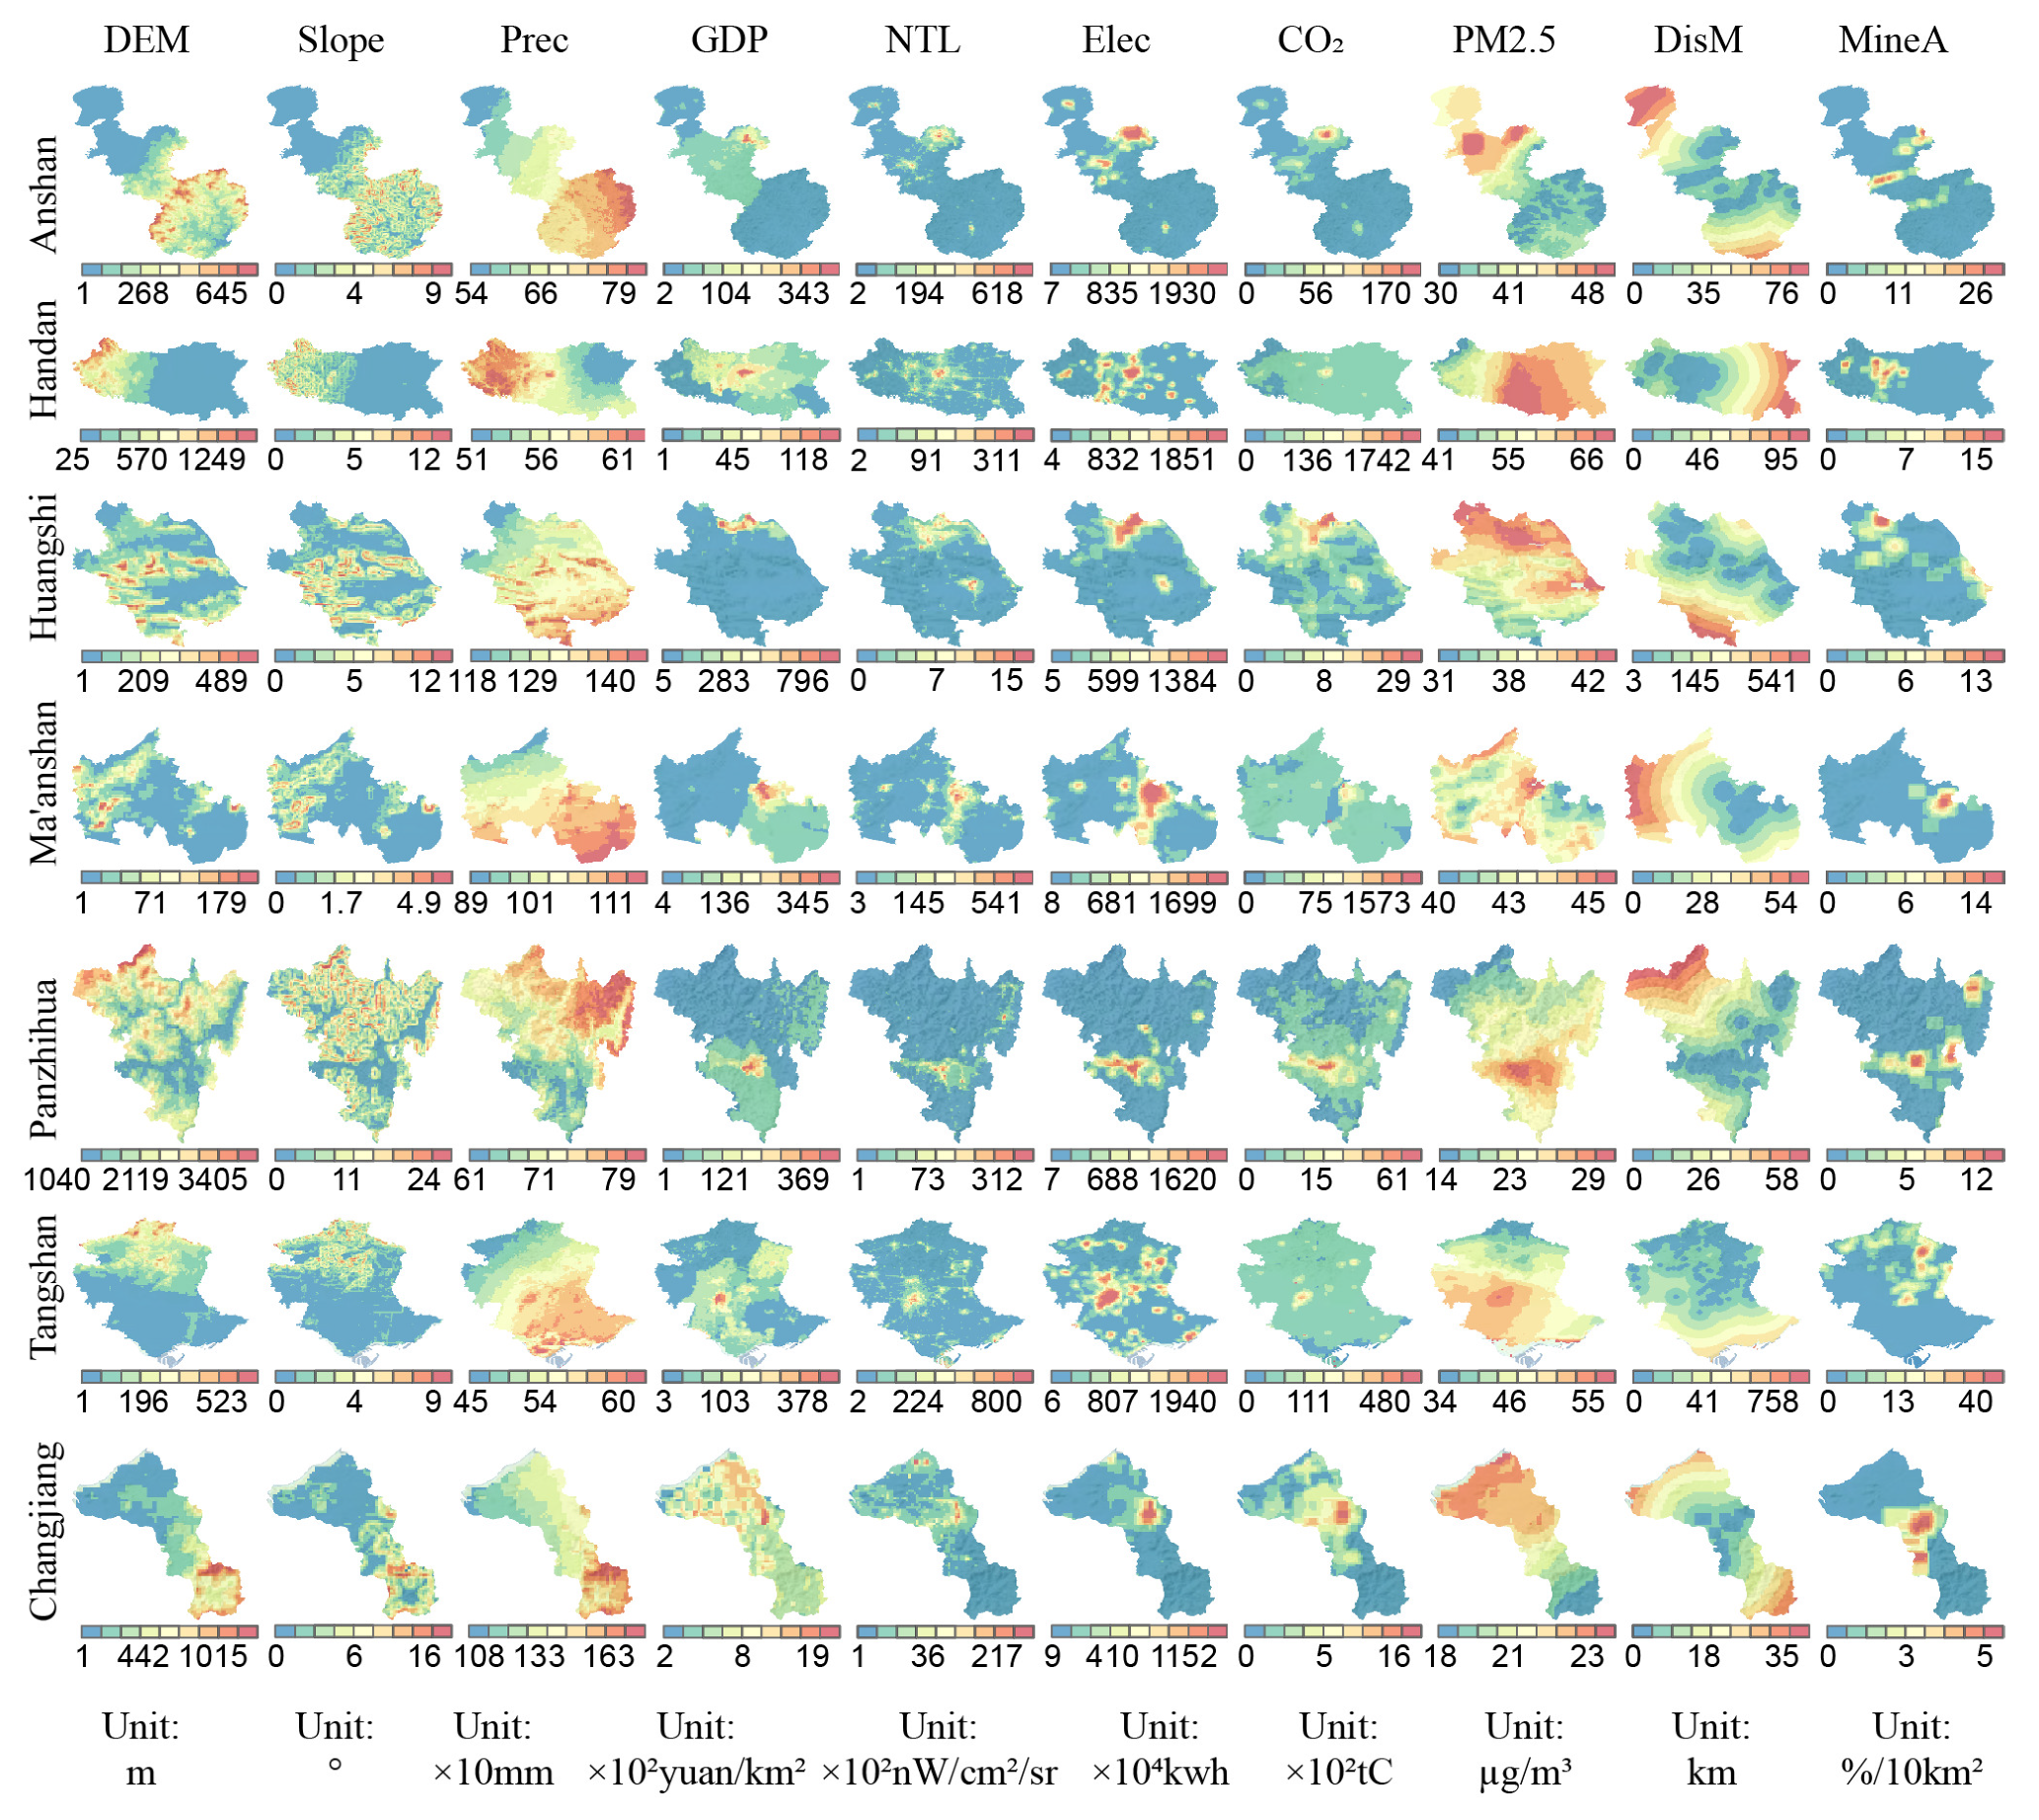
3.5.1. Driving Factors and Processing

Ten potential drivers, including mining factors, were selected for the study (Figure A1, in Appendix A), including natural environment (DEM, slope, precipitation) and socioeconomic factors (GDP, night lighting, electricity consumption). In addition, important environmental data such as CO2 emissions and PM2.5 concentrations, which are commonly used by the government to monitor mining areas, were also considered. At the same time, the distance to the mine and the percentage of the mining area analyzed in the previous section were taken into account to fully analyze the influence of these mining factors on the ecological quality of mining cities. Since the area of the mining area is small compared with the total area of the city, this study adopts the focus statistics tool in ArcGIS to set up a 10 km × 10 km analysis window. It was converted to calculate the percentage of mining area within each 100 km2 and used as a potential driving variable affecting the quality of the environment. In addition, to unify the analysis, the RSEI data were resampled to 1 km resolution by bilinear interpolation and pixel-aligned with the driving factors data.

3.5.2. Correlation of RSEI with Factors

The results of the image-by-image correlation analysis between RSEI and each driver are shown in Figure 7a. RSEI showed a negative correlation with the percentage of mine area (MineA), indicating that the environmental quality is poorer in areas with a larger percentage of mine area. In most cities, RSEI is positively correlated with the distance from the mine area (DisM), indicating that the closer the city is to the mine area, the worse the environmental quality. Conversely, the further the city, the better the ecological quality. This is consistent with the results of the previous analysis. In addition, RSEI is negatively correlated with PM2.5 content (PM2.5) in the majority of mining cities, while it shows a weak positive correlation in Changjiang Lizu Autonomous County and Ma’anshan City (R < 0.20). RSEI is always negatively correlated with carbon dioxide emission (CO2). RSEI is negatively correlated with electricity consumption, reflecting the socioeconomic activities of human beings (Elec), and the intensity of nighttime lighting (NTL) and Gross Domestic Product (GDP) were also generally negatively correlated, but the correlation between RSEI and GDP in Changjiang Lizu Autonomous County was weakly positive (R = 0.11). The correlation between RSEI and annual precipitation varied from city to city; for instance, the correlation between RSEI and annual precipitation in Anshan City and Panzhihua City was significantly positive (R > 0.55), whereas the correlation between RSEI and annual precipitation in Ma’anshan City was negative (R = −0.32). For elevation (DEM) and slope (Slope), RSEI was positively correlated with both (R ≥ 0.20). The higher the elevation and the greater the slope, the better the quality of the environment.

3.5.3. Results of Random Forest Regression Model

The model explained more than 80% of the data variability in all mining cities (shown as % Var, and explained in Figure 7g), indicating its high accuracy and reliability in simulating RSEI. The simulation results from the validation set were analyzed by plotting scatter plots of modeled RSEI versus observed RSEI, and calculating R², RMSE, and MAE to assess the effectiveness of the model (Figure 7c). The results show that the model fits relatively well in all cities, with R² values exceeding 0.80. The model simulates smaller errors, with RMSE and MAE values below 0.1. In particular, the model in Changjiang Lizu Autonomous County fits the best, with an R² of 0.947, implying that the model is able to account for 94.7% of the variability in the data. Handan has the smallest prediction error among all mining cities, with an RMSE of 0.038 and an MAE of 0.028, the highest simulation accuracy. However, the model also suffers from a small amount of bias. As seen against the 1:1 line, the model is slightly overestimated in the low RSEI area and underestimated in the high RSEI area (RSEI > 0.60).
Applying the trained model to the RSEI simulation of the whole city (Figure 7d) and comparing it with the original RSEI (Figure 7e) shows that the model is able to characterize the RSEI of different areas more accurately, and accurately identify the high and low-value areas of the RSEI. The residuals between the simulation results and the original values were further calculated (Figure 7f). The results show that the underestimation of the RSEI of some image elements can be seen in the high RSEI value areas with higher vegetation cover. However, the distribution of residuals generally shows randomness without obvious systematic bias, indicating that the model fit is reliable. The random forest model constructed through these 10 influencing factors has validity and applicability in the simulation of RSEI in mining cities.

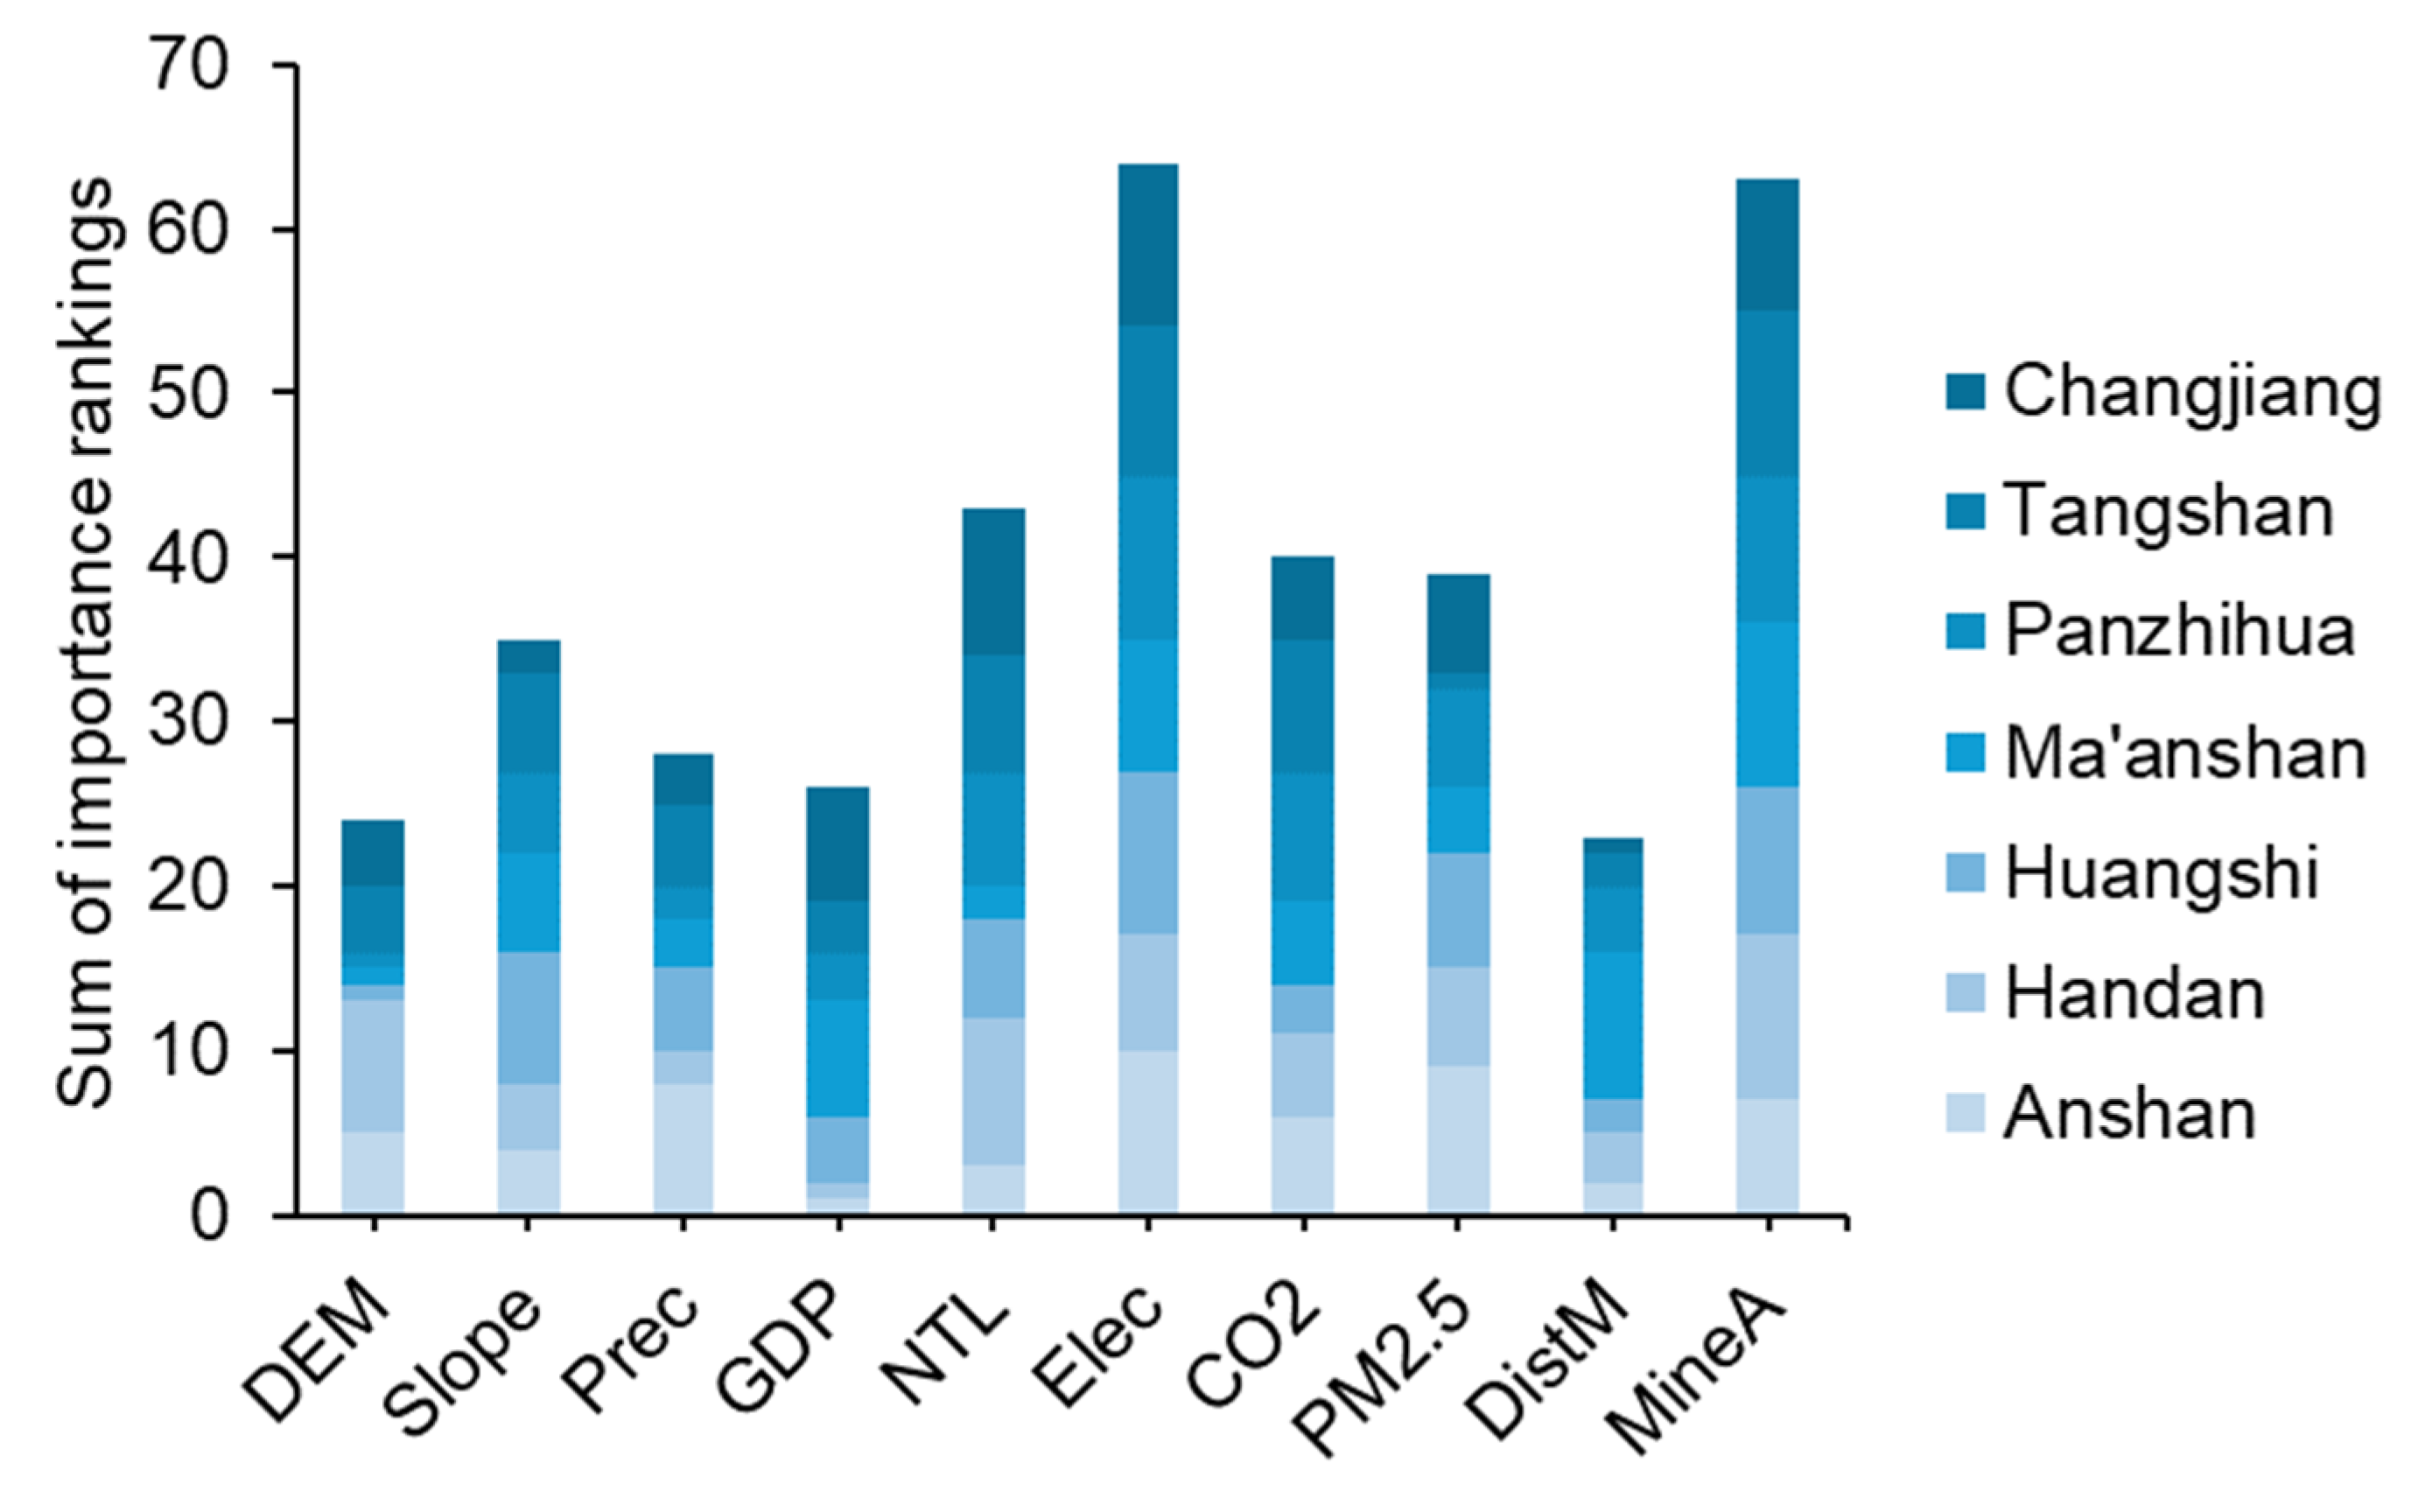
3.5.4. The Importance of the Driving Factors

The relative importance of the 10 key factors to RSEI was assessed by plotting their percent reduction in simulation error (% IncMSE) (Figure 7g). In Anshan City, the most significant factor affecting RSEI was GDP, with an IncMSE of 94.17%, followed by distance to the mine (79.53%), nighttime light intensity (77.66%), slope (77.49%), and terrain height (DEM, 70.89%). In Handan, the factor that most influenced RSEI was also GDP, with an IncMSE of 130%, followed by precipitation (95.47%), distance to the mine (88.61%), and slope (70.11%). In Huangshi, Ma’anshan, and Panzhihua, DEM was the most critical factor influencing RSEI, with IncMSEs of 115.36%, 79.64%, and 108.68%, respectively. In Tangshan City, PM2.5 had the most significant effect on RSEI, with an IncMSE of 167.15%, followed closely by distance to the mine (161.14%), GDP (129.59%), DEM (119.04%), and precipitation (118.36%). The major factors affecting RSEI in Changjiang Lizu Autonomous County were, in order, distance to the mine (48.71%), slope (46.24%), precipitation (43.21%), and DEM (39.37%).

4. Discussion

4.1. Applicability of the RSEI Model Applied to the Assessment of Ecological Quality in Mining Cities

RSEI shows good applicability not only in the small-scale ecological quality assessment of mining areas [90,91], but also in coastal zones [92] and urban agglomerations [72]. It suggests that RSEI is suitable for both local-scale fine analysis and large-scale comprehensive studies. In this study, RSEI was applied to assess the ecological quality of mining cities, focusing on the specific situation within the mining area as well as examining the impacts of mining activities on the entire mining city from a macro perspective.
In terms of the comprehensive assessment of mining cities, this study utilized the PIE-Engine cloud platform to quantitatively analyze the 2001–2022 RSEIs of seven typical mining cities. The main features of the four key environmental indicators were effectively integrated through the principal component transformation method [93] (Table A1). Zooming in on the local details (Figure 4a), for example, the low RSEI area of Handan is highly consistent with its “1237” new town pattern (a specific urban planning structure in Handan consisting of one central city area, two subcentral areas, three regional subcenters, and seven county centers). It correctly reflects the rapid development of the city’s subcenters and regional subcenters and their impact on the ecological environment. This is consistent with the multicenter urban-rural development pattern of Handan, which verifies that RSEI can accurately capture the urban ecological spatial structure. In addition, the superposition of RSEI with the vector boundaries of the mining area shows that RSEI can well characterize the boundary extent of the mine area, and coincides with the results of the remote sensing images. The trend of environmental quality in Panzhihua City in this study is basically consistent with the conclusion that the environment of Panzhihua City has been improving from 2001 to 2020 in Dai et al. [94]. These show that RSEI has high applicability and objective accuracy as an indicator for assessing the environmental quality of mining cities.

4.2. Advantages of Cloud Computing Platforms and Comparison with GEE Platforms

In this study, the remote sensing ecological index (RSEI) and the rasters of driving factors were generated using the PIE-Engine cloud computing platform, and the data were derived from the cloud platform. Desktop-based remote sensing typically involves downloading and preprocessing a large volume of geospatial data, which is a time-consuming and computationally intensive process [43]. In contrast, cloud computing platforms directly utilize data and algorithms stored on servers, eliminating the need for cumbersome data downloading and preprocessing steps [95], thereby significantly enhancing efficiency. Especially in batch processing and long-term data analysis, cloud platforms offer replicability, scalability, and efficient resource utilization [52,96,97], which substantially reduce the time required for long-term RSEI mapping. Meanwhile, remote sensing cloud computing platforms make it easier for researchers to publish their research results for decision-makers and even the public [98].
Compared with Google Earth Engine (GEE), PIE-Engine features a built-in principal component analysis (PCA) capability, enabling users to quickly perform principal component transformations. In contrast, we found that implementing PCA on GEE usually requires manually writing complex code or referencing external libraries. Furthermore, compared with the GEE platform, PIE-Engine, as a Chinese-developed remote sensing cloud computing platform, integrates a vast array of high-resolution data, such as Gaofen satellite series data, which is not available on the GEE platform. Therefore, PIE-Engine is particularly suitable for research focused on the Chinese region, which is also the reason for our choice of this platform. Consequently, this study suggests that scholars in related research can consider using the PIE-Engine platform when performing this part of the work.

4.3. Impact of Mining Activities on the Quality of the Ecological Environment in Mining Cities

For mining cities, mining activity is an important human activity. Its impact on the ecological environment is often overlooked [99]. However, it not only causes serious damage to the ecological environment, but even accelerates its deterioration process [100]. Therefore, mining, as the most dominant industry in mining cities, is considered in this study as deserving to be taken into account when assessing the environment and the economy of mining cities. Existing studies have shown that mining activities have significant negative effects on the ecological environment [101]. Even around closed mining areas, ecological disturbances due to construction development still exist [102]. Although studies have been conducted to reveal the environmental impacts of open-pit mining [91], there is still a lack of comprehensive understanding of the extent of disturbance in mining areas, the variability of ecological impacts of mines of different sizes, and the extent of ecological impacts of mining activities compared with natural and economic and social activities.
To deal with this problem, this study innovatively explores and analyzes in depth the interactions between RSEI and mining activities in terms of two dimensions: distance to the mine and mine area. It shows that mining activities are significantly destructive to the ecological environment of mining cities, similar to urbanization (Figure 4a). Further analysis shows that the closer the area is to the mining area, the more destruction to the ecological environment (Figure 5). The impact of mines on the ecological environment shows significant changes along the distance gradient. For example, in Tangshan City, although the disturbance of the surrounding environment by the mining area is relatively small and weaker than that in other cities, a significant upward trend occurs within a 3 km range. Pixel-by-pixel correlation analysis (Figure 7b) further confirms that the positive correlation between RSEI and distance is strong (R > 0.45) in mining cities such as Panzhihua and Ma’anshan. These results suggest that the ecological problems caused by mining activities are not limited to the mining area itself, but extend to the surrounding area, and their negative effects diminish with increasing distance. This is consistent with the findings of Niu et al. [103] and Song et al. [104]. With the promotion of the concept of sustainable development, ecological restoration of mining areas is imperative [105]. When managing the ecological environment of mining cities, special attention should also be paid to the ecological condition of the areas closer to the mining area. This finding offers significant implications for mining policy formulation. Firstly, policies should prioritize areas near mines, possibly implementing stricter environmental protection measures for these regions. Secondly, this finding may prompt urban planners and policymakers to reconsider the layout of mining activities, such as limiting or adjusting mining operations close to cities to mitigate negative impacts on the surrounding environment, thereby promoting sustainable development in mining cities.
This study also found that the size of the mining area affects its RSEI. In most mining cities, RSEI is negatively correlated with the size of the mining area (Figure 6). This may be due to the fact that, in the early stage of mining, the size of the mining area is small, the construction of supporting facilities is incomplete, and the land occupation of mining buildings and construction waste affects the ecological environment to a lesser extent [106]. However, with the increase of mining volume, the size of the mining area expands accordingly [107], which may lead to the reduction of surface runoff, or it may even completely disappear and transfer to the underground, exacerbating the deterioration of the ecological environment [108]. However, the relationship varies from city to city. For example, the situation in Panzhihua City is different from that in other cities. In addition, the ecological quality of large mines may sometimes be better than that of small mines (Figure 6). This may be related to stricter management by large mining companies and close monitoring by the government. According to the notice issued by the Ministry of Natural Resources of China on “Further Strengthening the Construction of Green Mines,” it is required that, by the end of 2028, all large mines and 80% of medium-sized mines in China should meet the requirements of green mine standards. As for small mines, localities are encouraged to enhance their management in accordance with green mine standards, considering their specific conditions.
In conclusion, changes in the scale of mining areas are crucial for ecological management. In addition to paying attention to the ecological environment in the vicinity of mining areas, we should be alert to the fact that small mines are increasing their mining efforts to generate more profit and stay open, causing the size of the mining area to expand and thus exacerbating damage to the environment.

4.4. Key Driving Factors for RSEI in Mining Cities

There is significant spatial heterogeneity in the ecological quality of the region [109]. To explain this situation, it is crucial to identify its key driving factors and clarify the interactions between these factors and the environment. It is also key to developing and implementing ecological policies for targeted mining cities. In this study, during the construction of the random forest model, the RSEI value of each pixel in the study area and its corresponding driving factor value were extracted. Of the pixels, 70% were used for random forest model construction, and 30% for model validation [70]. The importance of a factor was assessed by calculating the degree of decrease in the average accuracy of the model (% IncMSER). The greater the decrease in accuracy, the greater the importance of the factor in explaining the RSEI [110]. Finally, by ranking the % IncMSER values of the factors from highest to lowest (Figure 7g), the importance of each factor to the ecological quality of mining cities can be clarified, with larger values indicating higher importance of the factor. Further, this study obtained a comprehensive ranking of the importance of the factors by ranking the importance of each factor in different cities (Figure 7g) and calculating the comprehensive ranking (Figure 8). The smaller the value of the overall ranking (the shorter the bar), the higher the combined importance of the factors across the cities. Combining the data from the seven mining cities, the order of importance is distance to mine > DEM > GDP > Precipitation > Slope > PM2.5 concentration > CO2 emissions > Nighttime light intensity > Percentage of mine area > Electricity consumption.
This study indicates that the distance to the mine is the most critical factor for ecological quality in mining cities and is a promoting sensitivity factor for RSEI. Elevation was second only to the distance to the mine and ranked first in importance in all three mining cities. Slope ranked fifth, possibly due to the fact that there are fewer anthropogenic activities in high-elevation and steep areas [111], which cause relatively less damage to the ecological environment. This is in line with the high–high aggregation characteristics of RSEI in high-elevation areas in Xiong et al.’s study [14]. On the contrary, human activities are more frequent in plain areas with flat topography [112], together with ground subsidence caused by mining activities [113], vegetation degradation [114], and obstruction of plant growth by abandoned mine tailings [115], leading to lower RSEI values. Therefore, elevation and slope are also promoting sensitivity factors for RSEI.
GDP, as an inhibitory sensitivity factor, ranked third in influencing RSEI and showed a negative correlation with RSEI (Figure 7b). This reflects the negative correlation between economic growth and ecological degradation. Mineral resources form the basis of national economic growth [116], and in cities where mining is the main economic contributor, extraction and utilization of economic growth and the destruction of the ecological environment form a “double-edged sword” effect [117]. How can these cities best manage this double-edged sword? The role of mining policies becomes crucial. Considering the negative correlation between GDP and RSEI, the economic growth driven by mining can lead to ecological harm if not managed carefully. Therefore, the balance between mining economic development policies and environmental protection policies is particularly critical in mining cities. The importance of CO2 and PM2.5 ranks after slope. The increase of greenhouse gas content in the atmosphere is the main cause of global warming [118]. In particular, the mining industry consumes large amounts of energy and produces large carbon emissions during extraction and processing [119], which places a significant ecological burden on the region. Furthermore, deforestation caused by mining activities indirectly leads to the loss of vegetation and contributes to CO2 emissions [120]. These are the reasons for the negative correlation between CO2 emissions and RSEI in mining cities. PM2.5 concentration is one of the main reasons for haze pollution, which directly affects urban air quality [121]. In addition, PM2.5 is a major pollutant in the air of open-pit mining [122], which is an important indicator widely used by local governments to monitor the compliance of mining production. Previous studies have shown that Huangshi City has experienced frequent haze in recent years due to coal-based metal smelting [123]. The RSEIs of Panzhihua City, Handan City, and Anshan City all showed a strong negative correlation with PM2.5. Therefore, CO2 and PM2.5 are inhibitory retardation factors for RSEI.
Nighttime light intensity, percentage of the mine area, and electricity consumption were less important relative to the other factors. Nighttime light intensity usually reflects the degree of urbanization [124], and the negative correlation with RSEI indicates lower ecological quality in urban areas. Although electricity is the most important source of energy consumption in the mining industry [125], electricity consumption and mining area are both weakly correlated with the RSEI, reflecting their relatively limited impact on the ecological environment. In summary, these factors are weak inhibitory factors of RSEI.

4.5. Limitations and Prospects

This study also has some limitations. First, due to data time constraints, this study focuses mainly on 2019 in its driver analysis and random forest simulation, and fails to cover drivers in the early 21st century. A timespan of more than 20 years may trigger significant changes in the drivers of mining cities. The dynamics of the drivers need to be studied in greater depth in order to better understand the dynamic development of mining city ecosystems and thus optimize policy formulation and renewal. Second, this study analyzed the relationship between mine distance and RSEI by taking a macroscopic view of all mine sites in mining cities as a whole [126]. However, in addition to the mine, the impacts of surrounding mines and cities also need to be considered, especially when the distance between the mine and the city reaches a certain range [127]. Their combined effects may complicate the situation, which deserves further exploration. Third, this research utilizes MODIS data for annual-scale quantitative analysis of RSEI changes. The frequent revisit cycle of MODIS data, offering more cloud-free images, lays the groundwork for future studies with higher temporal resolution. Further refinement of the temporal scale, such as seasonal and monthly environmental monitoring studies of mining cities, will be our focus moving forward.
In mining cities, mining serves as the pillar industry of the city’s economy, while the ecological environment is related to the healthy development of the city. To balance the relationship between the two and promote the joint development of mines and the economy, the guidance and direction of relevant policies are of great importance. Human activities do not only have negative impacts on ecosystems [128]. Positive ecological impacts are also possible with proactive measures [72]. Therefore, this study improves the ecological environment evaluation system of mining cities. It is proposed that, in the evaluation of the environmental quality of mining cities, it is reasonable to consider the influencing factors of their own characteristics in order to obtain a reasonable driving relationship. It is of great significance for comprehensively assessing the ecological environment status of mining cities and formulating locally adapted ecological management and environmental protection strategies.
In addition, the methodology of this study has some generalization value. The evaluation methodology based on the PIE-Engine cloud platform can be applied to other mining cities in China and even globally. Meanwhile, for other types of cities in China, such as forest resource cities, harbor cities, heavy industry cities, etc., relevant industrial factors can also be appropriately introduced when conducting ecological environment assessment.
In conclusion, the ecological quality evaluation system of mining cities in this study has a wider application value for decision-makers than previous ecological quality studies. In the future, this study will continue to improve the evaluation indexes and carry out more research on spatial and temporal scales.

5. Conclusions

In this study, a remote sensing ecological index (RSEI) was rapidly constructed with the help of the PIE-Engine cloud platform to assess the environmental quality of seven typical mining cities in China from 2001 to 2022. By comprehensively analyzing multiple factors, such as nature, economy, and mining, the spatial and temporal evolution of the ecological environment and its driving forces in these cities were explored. The results of the study showed that (1) there were significant changes in the quality of the ecological environment in the mining cities during the study period, with mining activities being the main factor contributing to the deterioration of the ecological environment. (2) The areas with low RSEI values are closely related to the distribution of mining areas and cities, showing the destructive effect of mining on the ecological environment. (3) The RSEI of mining areas in most mining cities is lower than the average value of cities. As the distance from the mining area increases, the RSEI gradually rises, reflecting the gradual weakening (or destructive) of the impact of mining on the ecological environment. (4) The increase in the mine area exacerbated the deterioration of the ecological environment, but the degree of its influence was weakened after reaching a certain threshold. (5) The distance from the mining area was the most critical factor affecting the quality of the ecological environment. The combined importance of the drivers was ranked as follows: distance to mine > DEM > GDP > precipitation > slope > PM2.5 concentration > CO2 emissions > nighttime light intensity > percentage of the mine area > electricity consumption.
This study proposes a methodological framework based on the PIE-Engine platform for efficiently assessing the ecological quality of mining cities, and innovatively considers drivers in the context of urban industries in the evaluation process. The study suggests that factors related to mining activities should be included in similar assessments of mining cities to obtain more comprehensive assessment results. The insights gained from this study and the discussions can help guide the formulation of strategies and policies to ensure the sustainable development of mining cities.

Author Contributions

Conceptualization, X.D. and D.L.; methodology, J.Z.; software, J.Z.; validation, W.L. (Wenyu Li) and J.X.; resources, X.D. and D.L.; writing—original draft preparation, J.Z. and W.L. (Wenyu Li); writing—review and editing, W.L. (Wenyu Li) and J.X.; visualization, J.Z.; supervision, X.D.; project administration, X.D.; funding acquisition, X.D. and W.L. (Weile Li). All authors have read and agreed to the published version of the manuscript.

Funding

This research was funded by the Key Research and Development Program of Sichuan Province (Grant No. 2023YFS0435), the State Key Laboratory of Geohazard Prevention and Geoenvironment Protection Independent Research Project (Grant No. SKLGP2022Z007), the National Natural Science Foundation of China (Grant No. 42271405), the Chengdu University of Technology Graduate Quality Engineering Project (Grant No. 2023YKC201), the Ministry of Education’s Department of Higher Education Project (Grant No. 220802313174310, No. 22073776112419), the Sichuan Provincial Department of Education Project (Grant No. YLKC01430), and the Sichuan Province Key Research Base in Humanities and Social Sciences in Higher Education Project (Grant No. JYXX21-003).

Institutional Review Board Statement

Not applicable.

Informed Consent Statement

Not applicable.

Data Availability Statement

The data presented in this study are available on request from the corresponding author.

Conflicts of Interest

D.L. was employed by PIESAT Information Technology Co., Ltd. The remaining authors declare that the research was conducted in the absence of any commercial or financial relationships that could be construed as a potential conflict of interest.

Appendix A

Figure A1. Driving Factors. Note: DEM, Slope, Prec, GDP, NTL, Elec, CO2, PM2.5, DisM, MineA are elevation, slope, annual precipitation, GDP, nighttime light intensity, electricity consumption, CO2 emissions, PM2.5 content, distance to the mine, and percentage of the mine area within 100 km2.
Sustainability 16 01447 g0a1
Table A1. The first principal component in PCA analysis of 2001–2022.
Mining CityIndex2001200420072010201320162019
AnshanNDVI0.5100.5660.5610.5950.6410.5430.530
WET0.2720.1830.1310.1140.0230.2310.140
NDBSI−0.619−0.624−0.610−0.623−0.601−0.620−0.619
LST−0.532−0.507−0.544−0.495−0.476−0.517−0.562
Contribution (%)62.44465.93866.90770.01773.71572.66971.917
HandanNDVI0.5890.6030.5920.5600.5960.5120.502
WET0.0710.0120.0340.0630.1010.2290.226
NDBSI−0.498−0.571−0.568−0.617−0.472−0.468−0.496
LST−0.633−0.557−0.571−0.549−0.641−0.683−0.671
Contribution (%)56.01255.62356.48955.67460.35061.23561.852
HuangshiNDVI0.4510.5530.4110.5700.4950.4990.522
WET0.2200.1260.214−0.0150.1220.0750.122
NDBSI−0.587−0.614−0.605−0.665−0.654−0.654−0.620
LST−0.636−0.549−0.648−0.482−0.559−0.564−0.572
Contribution (%)56.01255.62356.48955.67460.35061.23561.852
Ma’anshanNDVI0.0790.212−0.1700.6950.6500.6110.656
WET−0.735−0.8120.777−0.682−0.241−0.175−0.349
NDBSI0.4810.372−0.430−0.212−0.521−0.619−0.590
LST0.4710.396−0.428−0.086−0.498−0.462−0.316
Contribution (%)62.29556.17948.25051.02347.68352.30050.155
PanzhihuaNDVI0.6360.4860.3270.3660.5690.3700.357
WET0.104−0.175−0.244−0.166−0.063−0.175−0.266
NDBSI−0.0300.2900.4910.3590.2710.5060.485
LST0.7640.8050.7690.8420.7740.7600.753
Contribution (%)50.87251.30157.60053.51650.09858.15057.755
TangshanNDVI0.2650.3790.3910.4500.4600.4360.399
WET0.3800.3530.4120.3120.2640.3700.298
NDBSI−0.545−0.545−0.337−0.404−0.494−0.450−0.374
LST−0.699−0.659−0.751−0.733−0.690−0.686−0.783
Contribution (%)70.95767.09166.18770.51269.40270.16173.519
CangjiangNDVI0.3580.3570.2680.2620.1790.2440.273
WET0.3710.3580.3220.3920.2720.3920.390
NDBSI−0.555−0.648−0.657−0.655−0.640−0.644−0.639
LST−0.653−0.570−0.627−0.590−0.696−0.611−0.604
Contribution (%)77.13786.83184.22686.64381.28787.12485.311

References

  1. Sowinska-Swierkosz, B. Application of surrogate measures of ecological quality assessment: The introduction of the Indicator of Ecological Landscape Quality (IELQ). Ecol. Indic. 2017, 73, 224–234. [Google Scholar] [CrossRef]
  2. Wang, C.; Zhao, H. The assessment of urban ecological environment in watershed scale. Procedia Environ. Sci. 2016, 36, 169–175. [Google Scholar] [CrossRef]
  3. Su, J.; Yan, C.; Lei, Y.; Wang, Y.; Zhao, P. Long time series dynamic monitoring of eco-environmental quality in Shaanxi Province. Acta Ecol. Sin. 2023, 43, 554–568. [Google Scholar]
  4. Zhong, C.; Guo, H.; Swan, I.; Gao, P.; Yao, Q.; Li, H. Evaluating trends, profits, and risks of global cities in recent urban expansion for advancing sustainable development. Habitat Int. 2023, 138, 102869. [Google Scholar] [CrossRef]
  5. Gao, J.; O’Neill, B.C. Mapping global urban land for the 21st century with data-driven simulations and Shared Socioeconomic Pathways. Nat. Commun. 2020, 11, 2302. [Google Scholar] [CrossRef]
  6. Fan, Y.; Fang, C.; Zhang, Q. Coupling coordinated development between social economy and ecological environment in Chinese provincial capital cities-assessment and policy implications. J. Clean. Prod. 2019, 229, 289–298. [Google Scholar] [CrossRef]
  7. Zhang, C.; Li, J.; Lei, S.; Yang, J.; Yang, N. Progress and prospect of the quantitative remote sensing for monitoring the eco-environment in mining area. Met. Mine 2022, 51, 1–27. [Google Scholar] [CrossRef]
  8. Yang, J.; Wei, H.; Quan, Z.; Xu, R.; Wang, Z.; He, H. A global meta-analysis of coal mining studies provides insights into the hydrologic cycle at watershed scale. J. Hydrol. 2023, 617, 129023. [Google Scholar] [CrossRef]
  9. Xu, H.; Nakajima, K. Did China’s coal mine regulation positively affect economic growth? Resour. Policy 2016, 50, 160–168. [Google Scholar] [CrossRef]
  10. Ma, L.; Tian, H.; Kang, L. Eco-environmental impact and spatial control of mineral resources exploitation in the Yellow River Basin. Resour. Sci. 2020, 42, 137–149. [Google Scholar] [CrossRef]
  11. Dai, X.; Feng, H.; Xiao, L.; Zhou, J.; Wang, Z.; Zhang, J.; Fu, T.; Shan, Y.; Yang, X.; Ye, Y.; et al. Ecological vulnerability assessment of a China’s representative mining city based on hyperspectral remote sensing. Ecol. Indic. 2022, 145, 109663. [Google Scholar] [CrossRef]
  12. Sun, P.; Xiu, C.; Wang, Z. Assessment of mining-city’s ecological fragility on changes based on the PSE mode. Econ. Geogr. 2010, 30, 1354–1359. [Google Scholar] [CrossRef]
  13. Zhang, H.; Liu, Y.; Li, X.; Feng, R.; Gong, Y.; Jiang, Y.; Guan, X.; Li, S. Combing remote sensing information entropy and machine learning for ecological environment assessment of Hefei-Nanjing-Hangzhou region, China. J. Environ. Manag. 2023, 325, 116533. [Google Scholar] [CrossRef]
  14. Xiong, Y.; Xu, W.; Lu, N.; Huang, S.; Wu, C.; Wang, L.; Dai, F.; Kou, W. Assessment of spatial–temporal changes of ecological environment quality based on RSEI and GEE: A case study in Erhai Lake Basin, Yunnan province, China. Ecol. Indic. 2021, 125, 107518. [Google Scholar] [CrossRef]
  15. Shan, W.; Jin, X.; Ren, J.; Wang, Y.; Xu, Z.; Fan, Y.; Gu, Z.; Hong, C.; Lin, J.; Zhou, Y. Ecological environment quality assessment based on remote sensing data for land consolidation. J. Clean. Prod. 2019, 239, 118126. [Google Scholar] [CrossRef]
  16. Wu, S.; Xin, G.; Lei, J.; Zhou, N.; Guo, Z.; Shang, B. Ecological environment quality evaluation of the Sahel region in Africa based on remote sensing ecological index. J. Arid Land 2022, 14, 14–33. [Google Scholar] [CrossRef]
  17. Nong, L.; Wang, J. Dynamic monitoring of ecological environment quality in Kunming based on RSEI model. Chin. J. Ecol. 2020, 39, 2042–2050. [Google Scholar]
  18. Lu, Y.; Li, M.; Khan, F. Eco-Economic Environment Coupling Based on Urban RSEI Theory. Mob. Inf. Syst. 2021, 2021, 1600126. [Google Scholar] [CrossRef]
  19. Deng, X.; Gao, F.; Liao, S.; Liu, Y.; Chen, W. Spatiotemporal evolution patterns of urban heat island and its relationship with urbanization in Guangdong-Hong Kong-Macao greater bay area of China from 2000 to 2020. Ecol. Indic. 2023, 146, 109817. [Google Scholar] [CrossRef]
  20. Yin, H.; Li, Z.; Wang, Y.; Cai, F. Assessment of desertification using time series analysis of hyper-temporal vegetation indicator in inner Mongolia. Acta Geogr. Sin. 2011, 66, 653–661. [Google Scholar]
  21. Zhao, W.; Li, Z. Impact of drought on the vegetation state using MODIS/EVI time-series data. Prog. Geogr. 2007, 26, 40–47. [Google Scholar]
  22. Ji, X.; Yan, Y.; Guo, W.; Teng, Y.; Zhao, C. Ecological environment assessment of Shanxi Province and planned mining area based on coupling Remote Sensing Ecological Index (RSEI) model. Coal Geol. Explor. 2023, 51, 103–112. [Google Scholar]
  23. Yuan, B.; Fu, L.; Zou, Y.; Zhang, S.; Chen, X.; Li, F.; Deng, Z.; Xie, Y. Spatiotemporal change detection of ecological quality and the associated affecting factors in Dongting Lake Basin, based on RSEI. J. Clean. Prod. 2021, 302, 126995. [Google Scholar] [CrossRef]
  24. Yue, H.; Liu, Y.; Li, Y.; Lu, Y. Eco-environmental quality assessment in China’s 35 major cities based on Remote Sensing Ecological Index. IEEE Access 2019, 7, 51295–51311. [Google Scholar] [CrossRef]
  25. Wen, X.; Ming, Y.; Gao, Y.; Hu, X. Dynamic monitoring and analysis of ecological quality of Pingtan comprehensive experimental zone, a new type of sea island city, based on RSEI. Sustainability 2020, 12, 21. [Google Scholar] [CrossRef]
  26. Yang, L.; Wang, N.; Xie, J.; Jing, X. Index optimization of eco-environment evaluation in irrigation district based on multi-source information fusion decision. Trans. Chin. Soc. Agric. Eng. 2015, 31, 225–231. [Google Scholar]
  27. Gao, W.; Zou, Y.; Yang, X.; Xiao, T.; Liu, X.; Liu, S. Evaluation of ecological environment of hunan province during the 13th five-Year plan based on AHP-RANC. Environ. Monit. China 2023, 39, 9–18. [Google Scholar]
  28. Sobhani, P.; Esmaeilzadeh, H.; Wolf, I.D.; Deljouei, A.; Marcu, M.V.; Sadeghi, S.M.M. Evaluating the ecological security of ecotourism in protected area based on the DPSIR model. Ecol. Indic. 2023, 155, 110957. [Google Scholar] [CrossRef]
  29. Yang, X.; Meng, F.; Fu, P.; Wang, Y.; Liu, Y. Time-frequency optimization of RSEI: A case study of Yangtze River Basin. Ecol. Indic. 2022, 141, 109080. [Google Scholar] [CrossRef]
  30. Xu, H. A remote sensing index for assessment of regional ecological changes. China Environ. Sci. 2013, 33, 889–897. [Google Scholar]
  31. Xu, H.; Li, C.; Lin, M. Should RSEI use PCA or kPCA? Geomat. Inf. Sci. Wuhan Univ. 2023, 48, 506–513. [Google Scholar] [CrossRef]
  32. Xu, H.; Deng, W. Rationality analysis of MRSEI and its difference with RSEI. Remote Sens. Technol. Appl. 2022, 37, 1–7. [Google Scholar]
  33. Zhang, W.; Du, P.; Guo, S.; Lin, C.; Zheng, H.; Fu, P. Enhanced remote sensing ecological index and ecological environment evaluation in arid area. Natl. Remote Sens. Bull. 2023, 27, 299–317. [Google Scholar] [CrossRef]
  34. Kamran, M.; Yamamoto, K. Evolution and use of remote sensing in ecological vulnerability assessment: A review. Ecol. Indic. 2023, 148, 110099. [Google Scholar] [CrossRef]
  35. Xu, H. A remote sensing urban ecological index and its application. Acta Ecol. Sin. 2013, 33, 7853–7862. [Google Scholar]
  36. Xu, H.; Wang, Y.; Guan, H.; Shi, T.; Hu, X. Detecting ecological changes with a remote sensing based ecological index (RSEI) produced time series and change vector analysis. Remote Sens. 2019, 11, 2345. [Google Scholar] [CrossRef]
  37. Xu, H.; Wang, M.; Shi, T.; Guan, H.; Fang, C.; Lin, Z. Prediction of ecological effects of potential population and impervious surface increases using a remote sensing based ecological index (RSEI). Ecol. Indic. 2018, 93, 730–740. [Google Scholar] [CrossRef]
  38. An, M.; Xie, P.; He, W.; Wang, B.; Huang, J.; Khanal, R. Spatiotemporal change of ecologic environment quality and human interaction factors in three gorges ecologic economic corridor, based on RSEI. Ecol. Indic. 2022, 141, 109090. [Google Scholar] [CrossRef]
  39. Maity, S.; Das, S.; Pattanayak, J.M.; Bera, B.; Shit, P.K. Assessment of ecological environment quality in Kolkata urban agglomeration, India. Urban Ecosyst. 2022, 25, 1137–1154. [Google Scholar] [CrossRef]
  40. Boori, M.S.; Choudhary, K.; Paringer, R.; Kupriyanov, A. Spatiotemporal ecological vulnerability analysis with statistical correlation based on satellite remote sensing in Samara, Russia. J. Environ. Manag. 2021, 285, 112138. [Google Scholar] [CrossRef] [PubMed]
  41. Kamara, D.; Yang, Z.; Yusuf Alhaji, L. Ecological Geospatial Monitoring and Assessment of Surface Water Environment Using Remote Sensing Ecological Index Model (RSEI) in Freetown, Sierra Leone, from 2010 to 2018. Glob. Sci. J. 2020, 8, 328–348. [Google Scholar]
  42. Wang, L.; Jiao, L.; Lai, F.; Zhang, N. Evaluation of ecological changes based on a remote sensing ecological index in a Manas Lake wetland, Xinjiang. Acta Ecol. Sin. 2019, 39, 2963–2972. [Google Scholar]
  43. Zeng, J.; Dai, X.; Xu, J.; Li, W.; Liu, D. Remote sensing monitoring of vegetation NPP spatiotemporal dynamics based on the PIE-Engine cloud computing platform and CASA model: A case study of Daofu county. Water Resour. Hydropower Eng. 2024, 1–16. Available online: http://kns.cnki.net/kcms/detail/10.1746.TV.20231205.0931.002.html (accessed on 4 February 2024).
  44. Wang, C.; Liu, Y.; Guo, L.; Guo, W.; Liao, F.; Zhu, H. A Smart Agricultural Service Platform for Crop Planting, Monitoring and Management—PIE-Engine Landscape. In Proceedings of the 2021 9th International Conference on Agro-Geoinformatics (Agro-Geoinformatics), Shenzhen, China, 26–29 July 2021; pp. 1–6. [Google Scholar]
  45. Shelestov, A.; Lavreniuk, M.; Kussul, N.; Novikov, A.; Skakun, S. Exploring Google Earth Engine platform for big data processing: Classification of multi-temporal satellite imagery for crop mapping. Front. Earth Sci. 2017, 5, 17. [Google Scholar] [CrossRef]
  46. Shafizadeh-Moghadam, H.; Khazaei, M.; Alavipanah, S.K.; Weng, Q. Google Earth Engine for large-scale land use and land cover mapping: An object-based classification approach using spectral, textural and topographical factors. GIScience Remote Sens. 2021, 58, 914–928. [Google Scholar] [CrossRef]
  47. Cheng, W.; Qian, X.; Li, S.; Ma, H.; Liu, D.; Liu, F.; Liang, J.; Hu, J. Research and application of PIE-Engine Studio for spatiotemporal remote sensing cloud computing platform. J. Remote Sens. 2022, 26, 335–347. [Google Scholar] [CrossRef]
  48. Zhu, L.; Wang, Y. PIE-Engine Spatiotemporal Remote Sensing Cloud Service Platform. In PIE Remote Sensing Cloud Service and Practice; Science Press: Beijing, China, 2023; pp. 7–8. [Google Scholar]
  49. Chang, D.; Wang, Z.; Ning, X.; Li, Z.; Zhang, L.; Liu, X. Vegetation changes in Yellow River Delta wetlands from 2018 to 2020 using PIE-Engine and short time series Sentinel-2 images. Front. Mar. Sci. 2022, 9, 977950. [Google Scholar] [CrossRef]
  50. Liu, H.; Liao, T.; Wang, Y.; Qian, X.; Liu, X.; Li, C.; Li, S.; Guan, Z.; Zhu, L.; Zhou, X.; et al. Fine-grained wetland classification for national wetland reserves using multi-source remote sensing data and Pixel Information Expert Engine (PIE-Engine). GIScience Remote Sens. 2023, 60, 2286746. [Google Scholar] [CrossRef]
  51. Liu, W.; Dai, X.; Wang, M.; Lan, Y.; Qu, G.; Shan, Y.; Ren, J.; Li, W.; Liang, S.; Wang, Y.; et al. Area changes and influencing factors of large inland lakes in recent 20 years: A case study of Sichuan province, China. Water 2022, 14, 2816. [Google Scholar] [CrossRef]
  52. Gorelick, N.; Hancher, M.; Dixon, M.; Ilyushchenko, S.; Thau, D.; Moore, R. Google Earth Engine: Planetary-scale geospatial analysis for everyone. Remote Sens. Environ. 2017, 202, 18–27. [Google Scholar] [CrossRef]
  53. Liu, Y.; Wang, C.; Guo, L.; Guo, W.; Zhu, H.; Li, C. Fast and High-accuracy Cotton Planting Distribution Identification from Sentinel-2 Images based on PIE-Engine Studio. In Proceedings of the 2021 International Conference on Electronic Information Technology and Smart Agriculture (ICEITSA), Huaihua, China, 10–12 December 2021; pp. 556–560. [Google Scholar]
  54. Yang, H.; Yu, J.; Xu, W.; Wu, Y.; Lei, X.; Ye, J.; Geng, J.; Ding, Z. Long-time series ecological environment quality monitoring and cause analysis in the Dianchi Lake Basin, China. Ecol. Indic. 2023, 148, 110084. [Google Scholar] [CrossRef]
  55. Lv, Y.; Xiu, L.; Yao, X.; Yu, Z.; Huang, X. Spatiotemporal evolution and driving factors analysis of the eco-quality in the Lanxi urban agglomeration. Ecol. Indic. 2023, 156, 111114. [Google Scholar] [CrossRef]
  56. Xu, D.; Yang, F.; Yu, L.; Zhou, Y.; Li, H.; Ma, J.; Huang, J.; Wei, J.; Xu, Y.; Zhang, C.; et al. Quantization of the coupling mechanism between eco-environmental quality and urbanization from multisource remote sensing data. J. Clean. Prod. 2021, 321, 128948. [Google Scholar] [CrossRef]
  57. Zhang, S.; Fan, Y.; Yan, L.; Xiao, X.; Li, H. Temporal and spatial variation and driving forces of eco-environmental quality in Shaanxi province in recent 20 years based on long time series MODIS data. J. Soil Water Conserv. 2023, 37, 111–119. [Google Scholar]
  58. Cai, Z.; Zhang, Z.; Zhao, F.; Guo, X.; Zhao, J.; Xu, Y.; Liu, X. Assessment of eco-environmental quality changes and spatial heterogeneity in the Yellow River Delta based on the remote sensing ecological index and geo-detector model. Ecol. Inf. 2023, 77, 102203. [Google Scholar] [CrossRef]
  59. Tang, L.; Liang, G.; Gu, G.; Xu, J.; Duan, L.; Zhang, X.; Yang, X.; Lu, R. Study on the spatial-temporal evolution characteristics, patterns, and driving mechanisms of ecological environment of the Ecological Security Barriers on China’s Land Borders. Environ. Impact Assess. Rev. 2023, 103, 107267. [Google Scholar] [CrossRef]
  60. Zhang, X.; Jia, W.; He, J. Spatial and temporal variation of ecological quality in northeastern China and analysis of influencing factors. J. Clean. Prod. 2023, 423, 138650. [Google Scholar] [CrossRef]
  61. Phung, V.L.H.; Oka, K.; Hijioka, Y.; Ueda, K.; Sahani, M.; Wan Mahiyuddin, W.R. Environmental variable importance for under-five mortality in Malaysia: A random forest approach. Sci. Total Environ. 2022, 845, 157312. [Google Scholar] [CrossRef]
  62. Breiman, L. Random Forests. Mach. Learn. 2001, 45, 5–32. [Google Scholar] [CrossRef]
  63. Siqueira, R.G.; Moquedace, C.M.; Fernandes-Filho, E.I.; Schaefer, C.E.G.R.; Francelino, M.R.; Sacramento, I.F.; Michel, R.F.M. Modelling and prediction of major soil chemical properties with Random Forest: Machine learning as tool to understand soil-environment relationships in Antarctica. CATENA 2024, 235, 107677. [Google Scholar] [CrossRef]
  64. Giri, S.; Kang, Y.; MacDonald, K.; Tippett, M.; Qiu, Z.; Lathrop, R.G.; Obropta, C.C. Revealing the sources of arsenic in private well water using Random Forest Classification and Regression. Sci. Total Environ. 2023, 857, 159360. [Google Scholar] [CrossRef]
  65. Zhu, D.; Song, D.; Zhu, B.; Zhao, J.; Li, Y.; Zhang, C.; Zhu, D.; Yu, C.; Han, T. Understanding complex interactions between neighborhood environment and personal perception in affecting walking behavior of older adults: A random forest approach combined with human-machine adversarial framework. Cities 2024, 146, 104737. [Google Scholar] [CrossRef]
  66. Zhou, T.; Hou, Y.; Yang, Z.; Laffitte, B.; Luo, K.; Luo, X.; Liao, D.; Tang, X. Reducing spatial resolution increased net primary productivity prediction of terrestrial ecosystems: A Random Forest approach. Sci. Total Environ. 2023, 897, 165134. [Google Scholar] [CrossRef] [PubMed]
  67. Bessinger, M.; Luck-Vogel, M.; Skowno, A.; Conrad, F. Landsat-8 based coastal ecosystem mapping in South Africa using random forest classification in Google Earth Engine. S. Afr. J. Bot. 2022, 150, 928–939. [Google Scholar] [CrossRef]
  68. Delavaux, C.S.; Crowther, T.W.; Zohner, C.M.; Robmann, N.M.; Lauber, T.; van den Hoogen, J.; Kuebbing, S.; Liang, J.; de-Miguel, S.; Nabuurs, G.-J.; et al. Author Correction: Native diversity buffers against severity of non-native tree invasions. Nature 2023, 622, E2. [Google Scholar] [CrossRef] [PubMed]
  69. Li, Y.; Tian, H.; Zhang, J.; Lu, S.; Xie, Z.; Shen, W.; Zheng, Z.; Li, M.; Rong, P.; Qin, Y. Detection of spatiotemporal changes in ecological quality in the Chinese mainland: Trends and attributes. Sci. Total Environ. 2023, 884, 163791. [Google Scholar] [CrossRef] [PubMed]
  70. Wang, Y.; Chen, X.; Gao, M.; Dong, J. The use of random forest to identify climate and human interference on vegetation coverage changes in southwest China. Ecol. Indic. 2022, 144, 109463. [Google Scholar] [CrossRef]
  71. Zhang, Y.; She, J.; Long, X.; Zhang, M. Spatio-temporal evolution and driving factors of eco-environmental quality based on RSEI in Chang-Zhu-Tan metropolitan circle, central China. Ecol. Indic. 2022, 144, 109436. [Google Scholar] [CrossRef]
  72. Zhang, L.; Fang, C.; Zhao, R.; Zhu, C.; Guan, J. Spatial–temporal evolution and driving force analysis of eco-quality in urban agglomerations in China. Sci. Total Environ. 2023, 866, 161465. [Google Scholar] [CrossRef] [PubMed]
  73. Tang, L.; Werner, T.T. Author Correction: Global mining footprint mapped from high-resolution satellite imagery. Commun. Earth Environ. 2023, 4, 163. [Google Scholar] [CrossRef]
  74. Peng, S.; Ding, Y.; Liu, W.; Li, Z. 1 km monthly temperature and precipitation dataset for China from 1901 to 2017. Earth Syst. Sci. Data 2019, 11, 1931–1946. [Google Scholar] [CrossRef]
  75. Wang, C.; Wang, J. Kilometer Grid Dataset of China’s Historical Population Spatial Distribution (1990–2015); The National Tibetan Plateau Data Center (TPDC): Beijing, China, 2022. [Google Scholar]
  76. Chen, J.; Gao, M.; Cheng, S.; Hou, W.; Song, M.; Liu, X.; Liu, Y. Global 1 km × 1 km gridded revised real gross domestic product and electricity consumption during 1992–2019 based on calibrated nighttime light data. Sci. Data 2022, 9, 202. [Google Scholar] [CrossRef] [PubMed]
  77. Oda, T.; Maksyutov, S.; Andres, R.J. The The Open-source Data Inventory for Anthropogenic CO2, version 2016 (ODIAC2016): A global monthly fossil fuel CO2 gridded emissions data product for tracer transport simulations and surface flux inversions. Earth Syst. Sci. Data 2018, 10, 87–107. [Google Scholar] [CrossRef] [PubMed]
  78. Wei, J.; Li, Z.; Lyapustin, A.; Sun, L.; Peng, Y.; Xue, W.; Su, T.; Cribb, M. Reconstructing 1-km-resolution high-quality PM2.5 data records from 2000 to 2018 in China: Spatiotemporal variations and policy implications. Remote Sens. Environ. 2021, 252, 112136. [Google Scholar] [CrossRef]
  79. Wei, J.; Li, Z.; Cribb, M.; Huang, W.; Xue, W.; Sun, L.; Guo, J.; Peng, Y.; Li, J.; Lyapustin, A.; et al. Improved 1 km resolution PM2.5 estimates across China using enhanced space–time extremely randomized trees. Atmos. Chem. Phys. 2020, 20, 3273–3289. [Google Scholar] [CrossRef]
  80. Xu, H. Assessment of ecological change in soil loss area using remote sensing technology. Trans. Chin. Soc. Agric. Eng. 2013, 29, 91–97. [Google Scholar]
  81. Song, H.; Xue, L. Dynamic monitoring and analysis of ecological environment in Weinan City, Northwest China based on RSEI model. Chin. J. Appl. Ecol. 2016, 27, 3913–3919. [Google Scholar]
  82. Zhang, C.; Xu, H.; Zhang, H.; Tang, F.; Lin, Z. Fractional vegetation cover change and Its ecological effect assessment in a typical reddish soil region of southeastern China: Changting county, Fujian province. J. Nat. Resour. 2015, 30, 917–928. [Google Scholar]
  83. Yang, J.; Huang, X. The 30 m annual land cover dataset and its dynamics in China from 1990 to 2019. Earth Syst. Sci. Data 2021, 13, 3907–3925. [Google Scholar] [CrossRef]
  84. Chen, W.; Huang, H.; Tian, Y.; Du, Y. Monitoring and Assessment of the Eco-Environment Quality in the Sanjiangyuan Region based on Google Earth Engine. J. Geo-Inf. Sci. 2019, 21, 1382–1391. [Google Scholar]
  85. Zeng, J.; Xu, J.; Li, W.; Dai, X.; Zhou, J.; Shan, Y.; Zhang, J.; Li, W.; Lu, H.; Ye, Y.; et al. Evaluating Trade-Off and Synergies of Ecosystem Services Values of a Representative Resources-Based Urban Ecosystem: A Coupled Modeling Framework Applied to Panzhihua City, China. Remote Sens. 2022, 14, 5282. [Google Scholar] [CrossRef]
  86. Cai, H.; Wu, F.; Cheng, Z.; Li, B.; Wang, J. A large-scale empirical study on impacting factors of taxi charging station utilization. Transp. Res. Part D Transp. Environ. 2023, 118, 103687. [Google Scholar] [CrossRef]
  87. Zhao, B.; Deng, M.; Shi, Y. Inferring nonwork travel semantics and revealing the nonlinear relationships with the community built environment. Sustain. Cities Soc. 2023, 99, 104889. [Google Scholar] [CrossRef]
  88. Shafighfard, T.; Bagherzadeh, F.; Rizi, R.A.; Yoo, D.-Y. Data-driven compressive strength prediction of steel fiber reinforced concrete (SFRC) subjected to elevated temperatures using stacked machine learning algorithms. J. Mater. Res. Technol. 2022, 21, 3777–3794. [Google Scholar] [CrossRef]
  89. Kim, Y.; Kim, Y. Explainable heat-related mortality with random forest and SHapley Additive exPlanations (SHAP) models. Sustain. Cities Soc. 2022, 79, 103677. [Google Scholar] [CrossRef]
  90. Zhang, M.; Wang, J.; Zhang, Y.; Wang, J. Ecological response of land use change in a large opencast coal mine area of China. Resour. Policy 2023, 82, 103551. [Google Scholar] [CrossRef]
  91. Xiao, W.; Guo, J.; He, T.; Lei, K.; Deng, X. Assessing the ecological impacts of opencast coal mining in Qinghai-Tibet Plateau—A case study in Muli coal field, China. Ecol. Indic. 2023, 153, 110454. [Google Scholar] [CrossRef]
  92. Zaki, A.; Buchori, I.; Pangi, P.; Sejati, A.W.; Liu, Y. Google Earth Engine for improved spatial planning in agricultural and forested lands: A method for projecting future ecological quality. Remote Sens. Appl. Soc. Environ. 2023, 32, 101078. [Google Scholar] [CrossRef]
  93. Zheng, Z.; Wu, Z.; Chen, Y.; Yang, Z.; Francesco, M. Analyzing the ecological environment and urbanization characteristics of the Yangtze River Delta Urban Agglomeration based on Google Earth Engine. Acta Ecol. Sin. 2021, 41, 717–729. [Google Scholar]
  94. Dai, X.; Li, W.; Liu, Z.; Tong, C.; Li, C.; Zeng, J.; Ye, Y.; Li, W.; Shan, Y.; Zhou, J.; et al. Effects of Mining on Urban Environmental Change: A Case Study of Panzhihua. Remote Sens. 2022, 14, 6004. [Google Scholar] [CrossRef]
  95. Hao, B.; Han, X.; Ma, M.; Liu, Y.; Li, S. Research Progress on the Application of Google Earth Engine in Geoscience and Environmental Sciences. Remote Sens. Technol. Appl. 2018, 33, 600–611. [Google Scholar]
  96. Yancho, J.; Jones, T.; Gandhi, S.; Ferster, C.; Lin, A.; Glass, L. The Google Earth Engine Mangrove Mapping Methodology (GEEMMM). Remote Sens. 2020, 12, 3758. [Google Scholar] [CrossRef]
  97. Wu, Q.; Lane, C.R.; Li, X.; Zhao, K.; Zhou, Y.; Clinton, N.; DeVries, B.; Golden, H.E.; Lang, M.W. Integrating LiDAR data and multi-temporal aerial imagery to map wetland inundation dynamics using Google Earth Engine. Remote Sens. Environ. 2019, 228, 1–13. [Google Scholar] [CrossRef]
  98. Fu, D.; Xiao, H.; Su, F.; Zhou, C.; Dong, J.; Zeng, Y.; Yan, K.; Li, S.; Wu, J.; Wu, W.; et al. Remote sensing cloud computing platform development and Earth science application. J. Remote Sens. 2021, 25, 220–230. [Google Scholar] [CrossRef]
  99. Yu, T.; Abulizi, A.; Xu, Z.; Jiang, J.; Akbar, A.; Ou, B.; Xu, F. Evolution of environmental quality and its response to human disturbances of the urban agglomeration in the northern slope of the Tianshan Mountains. Ecol. Indic. 2023, 153, 110481. [Google Scholar] [CrossRef]
  100. Liu, Y.; Heng, W.; Yue, H. Quantifying the coal mining impact on the ecological environment of Gobi open-pit mines. Sci. Total Environ. 2023, 883, 163723. [Google Scholar] [CrossRef] [PubMed]
  101. Liu, Y.; Xu, P.; Bi, Y.; Yue, H.; Peng, S.; Han, Y.; Jiang, K. Quantitative analysis of coal mining disturbance on environment in Xinjiang Gobi Open-pit mining area. J. China Coal Soc. 2023, 48, 959–974. [Google Scholar]
  102. Li, Y.; Wang, L.; Cao, Q.; Yang, L.; Jiang, W. Revealing ecological restoration process and disturbances of mineral concentration areas based on multiscale and multisource data. Appl. Geogr. 2024, 162, 103155. [Google Scholar] [CrossRef]
  103. Niu, H.; Wang, J.; Jing, Z.; Liu, B. Identification and management of land use conflicts in mining cities: A case study of Shuozhou in China. Resour. Policy 2023, 81, 103301. [Google Scholar] [CrossRef]
  104. Song, W.; Gu, H.-H.; Song, W.; Li, F.-P.; Cheng, S.-P.; Zhang, Y.-X.; Ai, Y.-J. Environmental assessments in dense mining areas using remote sensing information over Qian’an and Qianxi regions China. Ecol. Indic. 2023, 146, 109814. [Google Scholar] [CrossRef]
  105. Liu, Y.; Liu, H.; Yan, C.; Feng, Z.; Zhou, S. Evaluation and dynamic monitoring of ecological environment quality in mining area based on improved CRSEI index model. Heliyon 2023, 9, e20787. [Google Scholar] [CrossRef]
  106. Li, J.; Peng, S.; Zhang, C.; Yang, F.; Sang, X. Quantitative remote sensing-based monitoring and evaluation of the ecological environment in mining areas:technology framework and application. J. Min. Sci. Technol. 2022, 7, 9–25. [Google Scholar]
  107. Zhao, X.; Lyu, X.; Qi, Q.; Wang, Y.; Liu, D.; Zhao, G. A Study on Dynamic Evolution of Ecological Environment of Fuxin Coal Mine. Earth Environ. 2015, 43, 547–551. [Google Scholar]
  108. Zhang, G.; Ju, J.; Xu, J. Influence of longwall mining on surface runoffs in gully terrain area. J. China Coal Soc. 2016, 41, 1219–1226. [Google Scholar]
  109. Chen, L.; Yang, H.; Huang, H.; Chang, M.; Wang, X.; Han, D.; Liu, S.; Xiao, Y.; Yao, D.; Xiang, X.; et al. How do natural and socio-economic factors influence the sustainable development of the ecological environment in the World Natural Heritage Sites? Evidence from the Jiuzhaigou, China. J. Clean. Prod. 2023, 428, 139238. [Google Scholar] [CrossRef]
  110. Leroux, L.; Begue, A.; Lo Seen, D.; Jolivot, A.; Kayitakire, F. Driving forces of recent vegetation changes in the Sahel: Lessons learned from regional and local level analyses. Remote Sens. Environ. 2017, 191, 38–54. [Google Scholar] [CrossRef]
  111. Wang, Q.; Yao, Y.; Zhao, L.; Yang, C.-H.; Zhao, Y.-C.; Zhang, Q.-P. Enhancing resilience against geological hazards and soil erosion through sustainable vegetation management: A case study in Shaanxi Province. J. Clean. Prod. 2023, 423, 138687. [Google Scholar] [CrossRef]
  112. Zhao, A.; Liu, X.; Pei, T.; Wang, J.; Zhang, A.; Song, C. Spatiotemporal evolution of impervious surface percentage and its impact on vegetation in Beijing-Tianjin-Hebei region. Geogr. Res. 2021, 40, 1582–1595. [Google Scholar]
  113. Yao, W.; Wang, E.; Liu, X.; Zhou, R. Fracture distribution in overburden strata induced by underground mining. Deep Undergr. Sci. Eng. 2022, 1, 58–64. [Google Scholar] [CrossRef]
  114. Qi, H.; Wang, J.; Zhao, T.; Hu, P.; Li, F.; Wang, J.; Zhang, Y.; Yan, L. CFD Simulation of Wind Field Characteristics in Mining Areas: A Case Study of the Xinxing Coal Mine in Wuhai City, Inner Mongolia, China. J. Resour. Ecol. 2023, 14, 706–716. [Google Scholar]
  115. Cubley, E.S.; Richer, E.E.; Baker, D.W.; Lamson, C.G.; Hardee, T.L.; Bledsoe, B.P.; Kulchawik, P.L. Restoration of riparian vegetation on a mountain river degraded by historical mining and grazing. River Res. Appl. 2021, 38, 80–93. [Google Scholar] [CrossRef]
  116. Zhang, J.; Zhang, J.; Wu, C.; Zhang, Y.; Guo, M.; Li, H.; Wang, R. Comprehensive quantitative evaluation of the future mining: A comparison of socio-economic benefits and eco-environmental impacts. Ore Geol. Rev. 2023, 162, 105727. [Google Scholar] [CrossRef]
  117. Li, X.; Ma, L.; Ruman, A.M.; Iqbal, N.; Strielkowski, W. Impact of natural resource mining on sustainable economic development: The role of education and green innovation in China. Geosci. Front. 2023, 101703, in press. [Google Scholar] [CrossRef]
  118. Ali, I.; Sun, H.; Tariq, G.; Ali, H.; Baz, K.; Mahmood, H.; Khan, I.; Yao, J. Asymmetric impact of coal and gas on carbon dioxide emission in six Asian countries: Using asymmetric and non-linear approach. J. Clean. Prod. 2022, 367, 132934. [Google Scholar] [CrossRef]
  119. Zhang, Y.; Zeng, S.; Wu, Q.; Fu, J.; Li, T. A study on the impact of the carbon emissions trading policy on the mining industry based on Porter hypothesis. Resour. Policy 2023, 87, 104349. [Google Scholar] [CrossRef]
  120. Islam, K.; Vilaysouk, X.; Murakami, S. Integrating remote sensing and life cycle assessment to quantify the environmental impacts of copper-silver-gold mining: A case study from Laos. Resour. Conserv. Recycl. 2020, 154, 104630. [Google Scholar] [CrossRef]
  121. An, M.; Xie, P.; He, W.; Wang, B.; Huang, J.; Khanal, R. Local and tele-coupling development between carbon emission and ecologic environment quality. J. Clean. Prod. 2023, 394, 136409. [Google Scholar] [CrossRef]
  122. Lu, X.; Zhou, W.; Qi, C.; Luo, H.; Zhang, D.; Pham, B.T. Prediction into the future: A novel intelligent approach for PM2.5 forecasting in the ambient air of open-pit mining. Atmos. Pollut. Res. 2021, 12, 101084. [Google Scholar] [CrossRef]
  123. Mao, Y.; Hu, T.; Shi, M.; Cheng, C.; Liu, W.; Zhang, J.; Qi, S.; Xing, X. PM2.5-bound PAHs during a winter haze episode in a typical mining city, central China: Characteristics, influencing parameters, and sources. Atmos. Pollut. Res. 2020, 11, 131–140. [Google Scholar] [CrossRef]
  124. Zhang, X.; Fan, H.; Liu, F.; Lv, T.; Sun, L.; Li, Z.; Shang, W.; Xu, G. Coupling coordination between the ecological environment and urbanization in the middle reaches of the Yangtze River urban agglomeration. Urban Clim. 2023, 52, 101698. [Google Scholar] [CrossRef]
  125. Wei, L.; Feng, X.; Liu, P.; Wang, N. Impact of intelligence on the carbon emissions of energy consumption in the mining industry based on the expanded STIRPAT model. Ore Geol. Rev. 2023, 159, 105504. [Google Scholar] [CrossRef]
  126. Li, J.; Peng, C.; Zhang, C.; Li, Q.; Zhang, K.; Liu, J.; Ma, X. General statistical rules of vegetation disturbance range by open-pit mining based on a large sample: A case study of Shendong coal base. J. China Coal Soc. 2023, 48, 975–985. [Google Scholar]
  127. Liu, Y.; Zhou, W.; Yan, K.; Guan, Y.; Wang, J. Identification of the disturbed range of coal mining activities: A new land surface phenology perspective. Ecol. Indic. 2022, 143, 109375. [Google Scholar] [CrossRef]
  128. Zhao, T.; Pan, J.; Bi, F. Can human activities enhance the trade-off intensity of ecosystem services in arid inland river basins? Taking the Taolai River asin as an example. Sci. Total Environ. 2023, 861, 160662. [Google Scholar] [CrossRef]
Figure 1. Location of the study area.
Sustainability 16 01447 g001
Figure 2. Flowchart.
Sustainability 16 01447 g002
Figure 3. Spatial and temporal changes in RSEI in mining cities, 2001–2022. Note: (a,b) represent the spatial distribution of RSEI in 2001 and 2022, respectively, where greener colors indicate better environmental quality and redder colors indicate worse quality; (c) The line charts reflect the mean RSEI values for each latitude, with the light blue shadow representing the standard deviation of RSEI; (d) The bar chart shows the number of mining areas corresponding to each latitude; (e) The density plots illustrate the pixel distribution of RSEI from 2001 to 2022, with different colors distinguishing the years.
Sustainability 16 01447 g003
Figure 4. Ecological quality of mining areas in mining cities from 2001 to 2022. Note: From left to right, the figures depict the geographical location of mining areas, (a) magnified image of selected mining areas, and the corresponding distribution of RSEI; (b) The density plot show the distribution of RSEI pixels in mining cities and areas; (c) Green and red colors represent the average RSEI values of mining cities and areas from 2001 to 2022, respectively, while blue represents the absolute difference between the two. The larger the blue dot, the greater the difference in the average RSEI values between the two.
Sustainability 16 01447 g004
Figure 5. The relationship between RSEI and the distance to the mine from 2001 to 2022.
Sustainability 16 01447 g005
Figure 6. The relationship between RSEI and mine area size from 2001 to 2022. Note: Scattered dots of different colors indicate outliers for the corresponding year.
Sustainability 16 01447 g006
Figure 7. Correlation of drivers with RSEI and random forest regression results. Note: DEM, Slope, Prec, GDP, NTL, Elec, CO2, PM2.5, DisM, and MineA are elevation, slope, annual precipitation, GDP, nighttime light intensity, electricity consumption, CO2 emissions, PM2.5 content, distance to the mine, and percentage of the mine area within 100 km2. In reference to (b), AS: Anshan, HD: Handan, HS: Huangshi, MAS: Ma’anshan, PZH: Panzhihua, TS: Tangshan, and CJ: Changjiang.
Sustainability 16 01447 g007
Figure 8. Importance ranking of drivers. Note: The smaller the value, the more important the factor. DEM, Slope, Prec, GDP, NTL, Elec, CO2, PM2.5, DisM, and MineA are elevation, slope, annual precipitation, GDP, nighttime light intensity, electricity consumption, CO2 emissions, PM2.5 content, distance to the mine, and percentage of the mine area within 100 km2.
Sustainability 16 01447 g008
Table 1. Data products offered by PIE-Engine.
DataResolutionIndicatorData Sources
Terra vegetation indices MOD13A1.0060.5 km × 0.5 km,
16 days
NDVINASA (https://www.earthdata.nasa.gov/, accessed on 22 November 2023)
Terra surface reflectance MOD09A1.0060.5 km × 0.5 km,
8 days
Wetness
NDBSI
NASA (https://www.earthdata.nasa.gov/, accessed on 22 November 2023)
Terra land surface temperature and emissivity MOD11A2.0061 km × 1 km,
8 days
LSTNASA (https://www.earthdata.nasa.gov/, accessed on 22 November 2023)
Administrative boundaries of municipal divisions in ChinaVector dataAdministrative boundaries of the study areaNational Catalogue Service for Geographic Information (https://www.webmap.cn/, accessed on 15 November 2023)
Database of global-scale mining sitesVector dataMine area polygons
Distance to the mine
Area of the mine
Percentage of the mine area
Tang et al. [73]
Elevation—global version 11 km × 1 kmDEM, slopeGeospatial Information Authority of Japan (https://globalmaps.github.io/el.html, accessed on 4 December 2023)
1-km monthly precipitation dataset for China [74]1 km × 1 kmAnnual precipitationNational Tibetan Plateau Data Center (https://data.tpdc.ac.cn/home, accessed on 4 December 2023)
China’s population in km grid dataset [75]1 km × 1 kmGDPResource and Environment Science and Data Center (https://www.resdc.cn/DOI/DOI.aspx?DOIID=33, accessed on 4 December 2023)
VIIRS stray light corrected nighttime day: Night band composites version 1750 m × 750 mNighttime light intensityEarth Observation Group (https://eogdata.mines.edu/products/vnl/, accessed on 4 December 2023)
Global gridded electricity consumption data1 km × 1 kmElectricity consumptionChen et al. [76]
ODIAC fossil fuel CO2 emissions dataset [77]1 km × 1 kmCO2 emissionsCenter for Global Environmental Research, National Institute for Environmental Studies (https://db.cger.nies.go.jp/dataset/ODIAC/, accessed on 4 December 2023)
1 km ground-level PM2.5 dataset for China [78,79]1 km × 1 kmPM2.5 contentNational Tibetan Plateau Data Center
(https://data.tpdc.ac.cn/home, accessed on 4 December 2023)
Disclaimer/Publisher’s Note: The statements, opinions and data contained in all publications are solely those of the individual author(s) and contributor(s) and not of MDPI and/or the editor(s). MDPI and/or the editor(s) disclaim responsibility for any injury to people or property resulting from any ideas, methods, instructions or products referred to in the content.

