Article

The Emission Characteristics of Greenhouse Gases from Animal Husbandry in Shandong Province Based on Life Cycle Assessment

1
Institute of Animal Science and Veterinary Medicine, Shandong Academy of Agricultural Sciences, Jinan 250100, China
2
College of Resource and Environmental Science, Jilin Agricultural University, Changchun 130118, China
*
Author to whom correspondence should be addressed.
Sustainability 2024, 16(4), 1375; https://doi.org/10.3390/su16041375
Submission received: 18 December 2023 / Revised: 18 January 2024 / Accepted: 24 January 2024 / Published: 6 February 2024

Abstract

:
Life cycle assessment was used to study the following six major stages of animal husbandry: feed grain planting, feed grain transportation and processing, livestock and poultry breeding, livestock and poultry gastrointestinal fermentation, manure management, and livestock and poultry product slaughter and processing. The greenhouse gas emissions from animal husbandry in Shandong Province were quantified for the entire 20-year period spanning from 2002 to 2021. This study also analyzed the emission patterns and characteristics associated with this life cycle assessment. The results show that over the past 20 years, the greenhouse gas emissions from animal husbandry in Shandong Province increased continuously, the greenhouse gas emission intensity decreased continuously, and both of these trends tended to be stable. From a life cycle standpoint, the primary sources of greenhouse gas emissions were gastrointestinal fermentation and the management of livestock and poultry manure. In terms of the structure of livestock and poultry breeding, poultry was the primary source of greenhouse gas emissions. The emission characteristics of the greenhouse gases produced by animal husbandry varied among different cities in Shandong Province. The main source of greenhouse gas discharged due to animal husbandry in Zibo and Binzhou was Ecattle; in Dongying, it was Esheep; and in the remaining cities, it was mainly Epoultry.

1. Introduction

Agricultural production is recognized as a substantial source of anthropogenic greenhouse gas emissions. It is responsible for approximately 23% of total global anthropogenic greenhouse gas emissions, with CH4 accounting for 44%, N2O for 81%, and CO2 for 13% [1]. According to the statistics of the World Resources Institute (WRI) and the Food and Agriculture Organization of the United Nations (FAO), the carbon emissions of animal husbandry account for approximately 15% of total global emissions [2]. Livestock and poultry excreta, feed production, fertilizer production, and conventional agricultural production practices were the main sources of animal husbandry carbon emissions. Animal husbandry in Shandong Province, which is a major province for livestock and poultry breeding, has developed rapidly with the continuous development of the economy and an increase in market demand. Shandong Province produces the most meat, poultry, and eggs in the country. It has established four national animal husbandry parks, leading to the construction of large-scale industrial clusters, and more than 5000 standardized animal husbandry demonstration farms. According to data from the “Shandong Statistical Yearbook”, animal husbandry in Shandong Province mainly includes pigs, cattle, sheep, and poultry. From 2008 to 2020, the number of pigs in Shandong Province decreased by 14.60%, the number of cattle decreased by 39.83%, and the number of sheep decreased by 19.60%. However, the number of poultry animals grew, with a growth rate of 65.26% [3].
In 2021, the total output value of animal husbandry in Shandong Province reached CNY 290.424 billion and accounted for 25.3% of China’s total agricultural output value [3]. However, due to the improved economic benefits of animal husbandry, the resulting pollution continuously impacted the environment. In 2022, “Central Document No. 1” stressed the need to promote the green development of agriculture and rural areas while minimizing the environmental pollution caused by the livestock and poultry industry, taking into account both the environmental benefits and ensuring the expansion of the livestock and poultry industries [4]. Therefore, “The 14th Five-Years Plan for National Economic and Social Development and the Outline of the Long-term Goals for 2035 in Shandong Province” clearly states that it is necessary to scientifically prevent and control the environmental pollution caused by livestock and poultry breeding, turn waste into treasure, and realize the transformation of the harmless treatment of livestock manure into resource utilization according to the principles of “source reduction, process control and end use” in order to improve the quality of rural human settlements [5]. “The 14th Five-Years Plan for Prevention and Control of Livestock and Poultry Breeding Pollution in Shandong Province” requires improvements in the mechanisms for utilizing livestock and poultry manure, strengthening of the supervision of pollution prevention and control during livestock and poultry breeding processes, and the laying of a solid foundation for building a model of rural revitalization [6]. Therefore, it is of important theoretical and practical significance to study the greenhouse gas emissions produced by animal husbandry in Shandong Province.
Life cycle assessment (LCA) is widely used for the quantitative evaluation of industrial products [7,8]. LCA was introduced in the field of agriculture to conduct research for agricultural products and farmland management measures [9,10]. Ji used LCA to evaluate the carbon emissions from cattle manure treatment processes [11]. Cheng’s work, which integrated literature, data analysis, and model simulations, was based on LCA, and calculated and compared the differences in nitrogen and greenhouse gas emissions from ruminants and monogastric animals during feed production and livestock breeding. This work further proposed an optimized livestock structure according to the natural resource conditions of various countries and explored the contribution of livestock and poultry management to land resources and food security [12]. Wang used LCA to study and evaluate the greenhouse gas emissions of regional planting and breeding cycles [13]. Zhou used LCA to divide the life cycles of livestock and poultry production into six stages, using 1 kg of meat, eggs, and milk as functional units. This study focused on four types of environmental impacts: global warming, acidification, water eutrophication, and photochemical oxide formation [14]. Ying comprehensively evaluated a large-scale breeding model of livestock and poultry using LCA and summarized the advantages of this model by analyzing the amount of environmental pollution it produces [15]. Arca et al. used LCA to conclude that the amount of greenhouse gas emissions from an extensive animal husbandry system was higher than that from an intensive animal husbandry system due to the low productivity of the extensive animal husbandry system [16]. Mostert et al. used LCA to estimate the greenhouse gas emissions of each process in a broiler production chain [17].
However, most existing studies on greenhouse gas emissions produced from animal husbandry have focused on the assessment of livestock, poultry products, and farms, and there are few studies evaluating the amount of the greenhouse gas emissions produced throughout the whole life cycle of animal husbandry. This study comprehensively considered the direct production steps and the upstream and downstream industrial chain steps of animal husbandry and calculated and analyzed the total amounts and emission characteristics of the greenhouse gases produced throughout the whole life cycle of animal husbandry in Shandong Province, providing a reference to inform the formulation of policies aimed at reducing greenhouse gas emissions from animal husbandry.

2. Materials and Methods

2.1. Data Sources

The basic data were taken from the “Shandong Statistical Yearbook” from 2002 to 2021 [3], “China Rural Statistical Yearbook” in 2021 [18], “Compilation of China Agricultural Product Cost-benefit Data” in 2022 [19], “IPCC Guidelines for China Greenhouse Gas Inventories” in 2006 [20], and some related studies [21,22,23]. Utilizing LCA, the total amount of greenhouse gas emissions produced by animal husbandry in Shandong Province between 2002 and 2021, as well as that produced in different regions of Shandong Province in 2021, was calculated using the relevant data. Moreover, the greenhouse gas emission characteristics of animal husbandry in Shandong Province were analyzed.

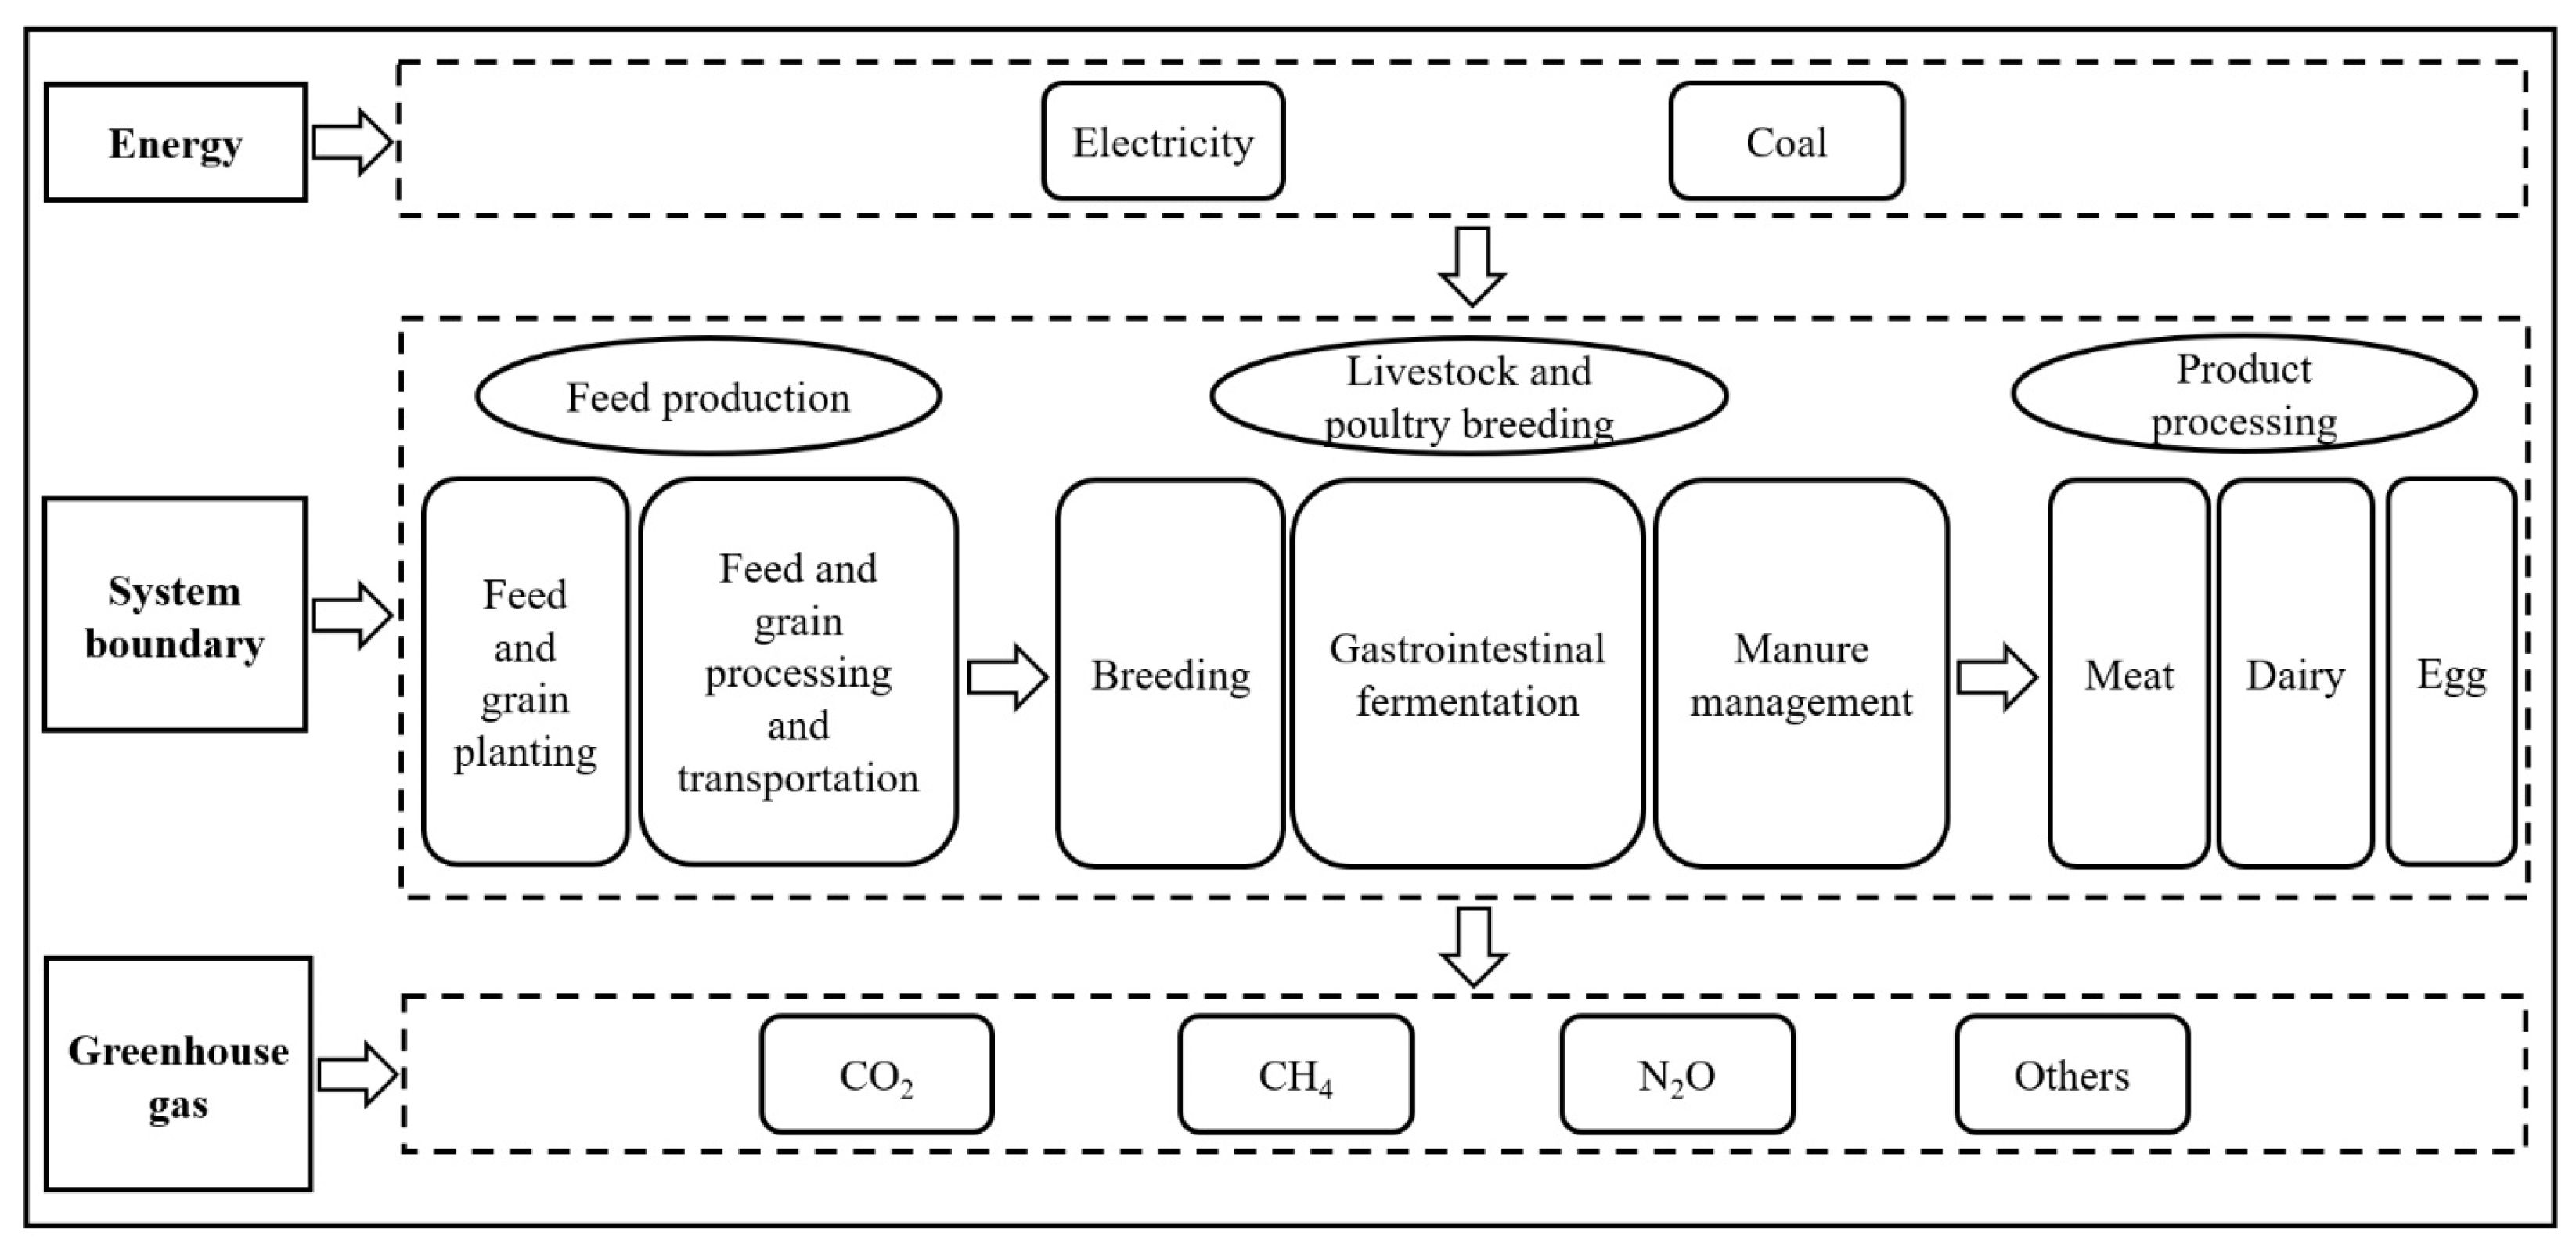
2.2. Research Methods

Life cycle assessment (LCA) was first proposed by the International Society of Environmental Toxicology and Chemistry (SETAC) in 1990, and it began with the Resource and Environmental Condition Analysis (REPA) in the United States in the late 1960s [24]. LCA involves a quantitative calculation technique, which is the best method for the quantitative analysis of environmental impact and the key to the development of low-carbon environmental protection economy, and it has gained widespread application across diverse fields [25]. As an environmental management tool that can quantify environmental information, LCA has played an important role in developing low-carbon economies, reducing greenhouse gas emissions, and mitigating climate change.
In this study, the life cycle assessment was divided into four steps. Firstly, the goal was to determine the emission characteristics of greenhouse gas emissions from animal husbandry in Shandong Province. The scope of this study is shown in Figure 1; we selected six major stages in animal husbandry, including feed grain planting, feed grain transportation and processing, livestock and poultry breeding, livestock and poultry gastrointestinal fermentation, manure management, and livestock and poultry product slaughter and processing, and calculated the total amount of greenhouse gas emissions produced by animal husbandry in Shandong Province from direct (livestock and poultry breeding) and indirect (feed production and livestock products) sources [26]. Secondly, in the inventory analysis process, the formulas for calculating greenhouse gas production, the emission coefficient, and related basic data were analyzed and confirmed. Then, in the environmental impact assessment stage, various environmental data regarding the life cycle of livestock and poultry breeding were classified and indexed before re-evaluation. Finally, we analyzed the results, conducted a discussion, examined the limitations, made recommendations, and reported the results of the life cycle interpretation in the interpretation stage.

2.3. Calculation of Greenhouse Gas Emission Amount in Animal Husbandry

2.3.1. Average Annual Feeding Amount

During the breeding process, the reproduction and production of livestock and poultry cause changes in livestock and poultry stock. According to the growth cycle, year-end stock, and annual output of different kinds of livestock and poultry, the average annual feeding amount for different kinds of livestock and poultry was estimated accurately. The formula for this is as follows [23]:
APP i = H e r d s e n d ,   i f :   D a y s 365   d D a y s l i v e · NAPA i 365 ,   i f :   D a y s < 365   d ,
In the formula, APPi is the average annual feeding amount of livestock and poultry; Herdsend is the year-end stock of livestock and poultry; NAPAi is the annual output of livestock and poultry; and Dayslive is the average feeding cycle of livestock and poultry.

2.3.2. Calculation of Greenhouse Gas Emission Amount

The greenhouse gases produced in animal husbandry mainly include carbon dioxide, methane, and nitrous oxide. The amount of greenhouse gas emissions produced during the whole life cycle of animal husbandry can be divided into three processes: feed production, livestock and poultry breeding, and livestock production, including feed grain planting, feed grain transportation and processing, livestock and poultry breeding, livestock and poultry gastrointestinal fermentation, manure management and livestock, and poultry product slaughter and processing. The calculation formula for greenhouse gas emission amount in each stage is shown in Table 1.

2.3.3. Greenhouse Gas Emission Coefficient

With reference to the “Compilation of China Agricultural Product Cost-benefit Data” in 2022 [19], “Notice on Adjusting the Electricity Price of North China Power Grid” in 2011 [28], “Emission Factor of China Regional Power Grid Baseline for Emission Reduction Projects” in 2019 [29], “Notice on Implementing the Development and Reform Price [2022] No. 303 Document to Improve the Price Formation Mechanism of the Coal Market” [30], “China Energy Statistics Yearbook” in 2008 [31], “China Rural Statistical Yearbook” in 2021 [18], and some relevant studies [21,22,23,27], the greenhouse gas emission coefficients of animal husbandry in Shandong Province were determined. The specific coefficients are shown in Table 2.

2.4. Calculation of Greenhouse Gas Emission Intensity in Animal Husbandry

Greenhouse gas emission intensity refers to the greenhouse gas generated by unit of production value. The calculation of greenhouse gas emission intensity can reduce the error of greenhouse gas emission in comparative analysis caused by an economic gap, and it is an important index for evaluating greenhouse gas emission production [32]. The formula is as follows:
Greenhouse gas emission intensity = total greenhouse gas emission amount of animal husbandry/total output value of animal husbandry

2.5. Statistical Analysis

Excel 2019 (Microsoft, Albuquerque, NM, USA) was used for data processing, Origin 2021 (OriginLab, Northampton, MA, USA) was used to draw the line chart and histogram, and Personalbio Genes Cloud (Personalbio, Shanghai, China) was used to draw the pie chart and histogram.

3. Results

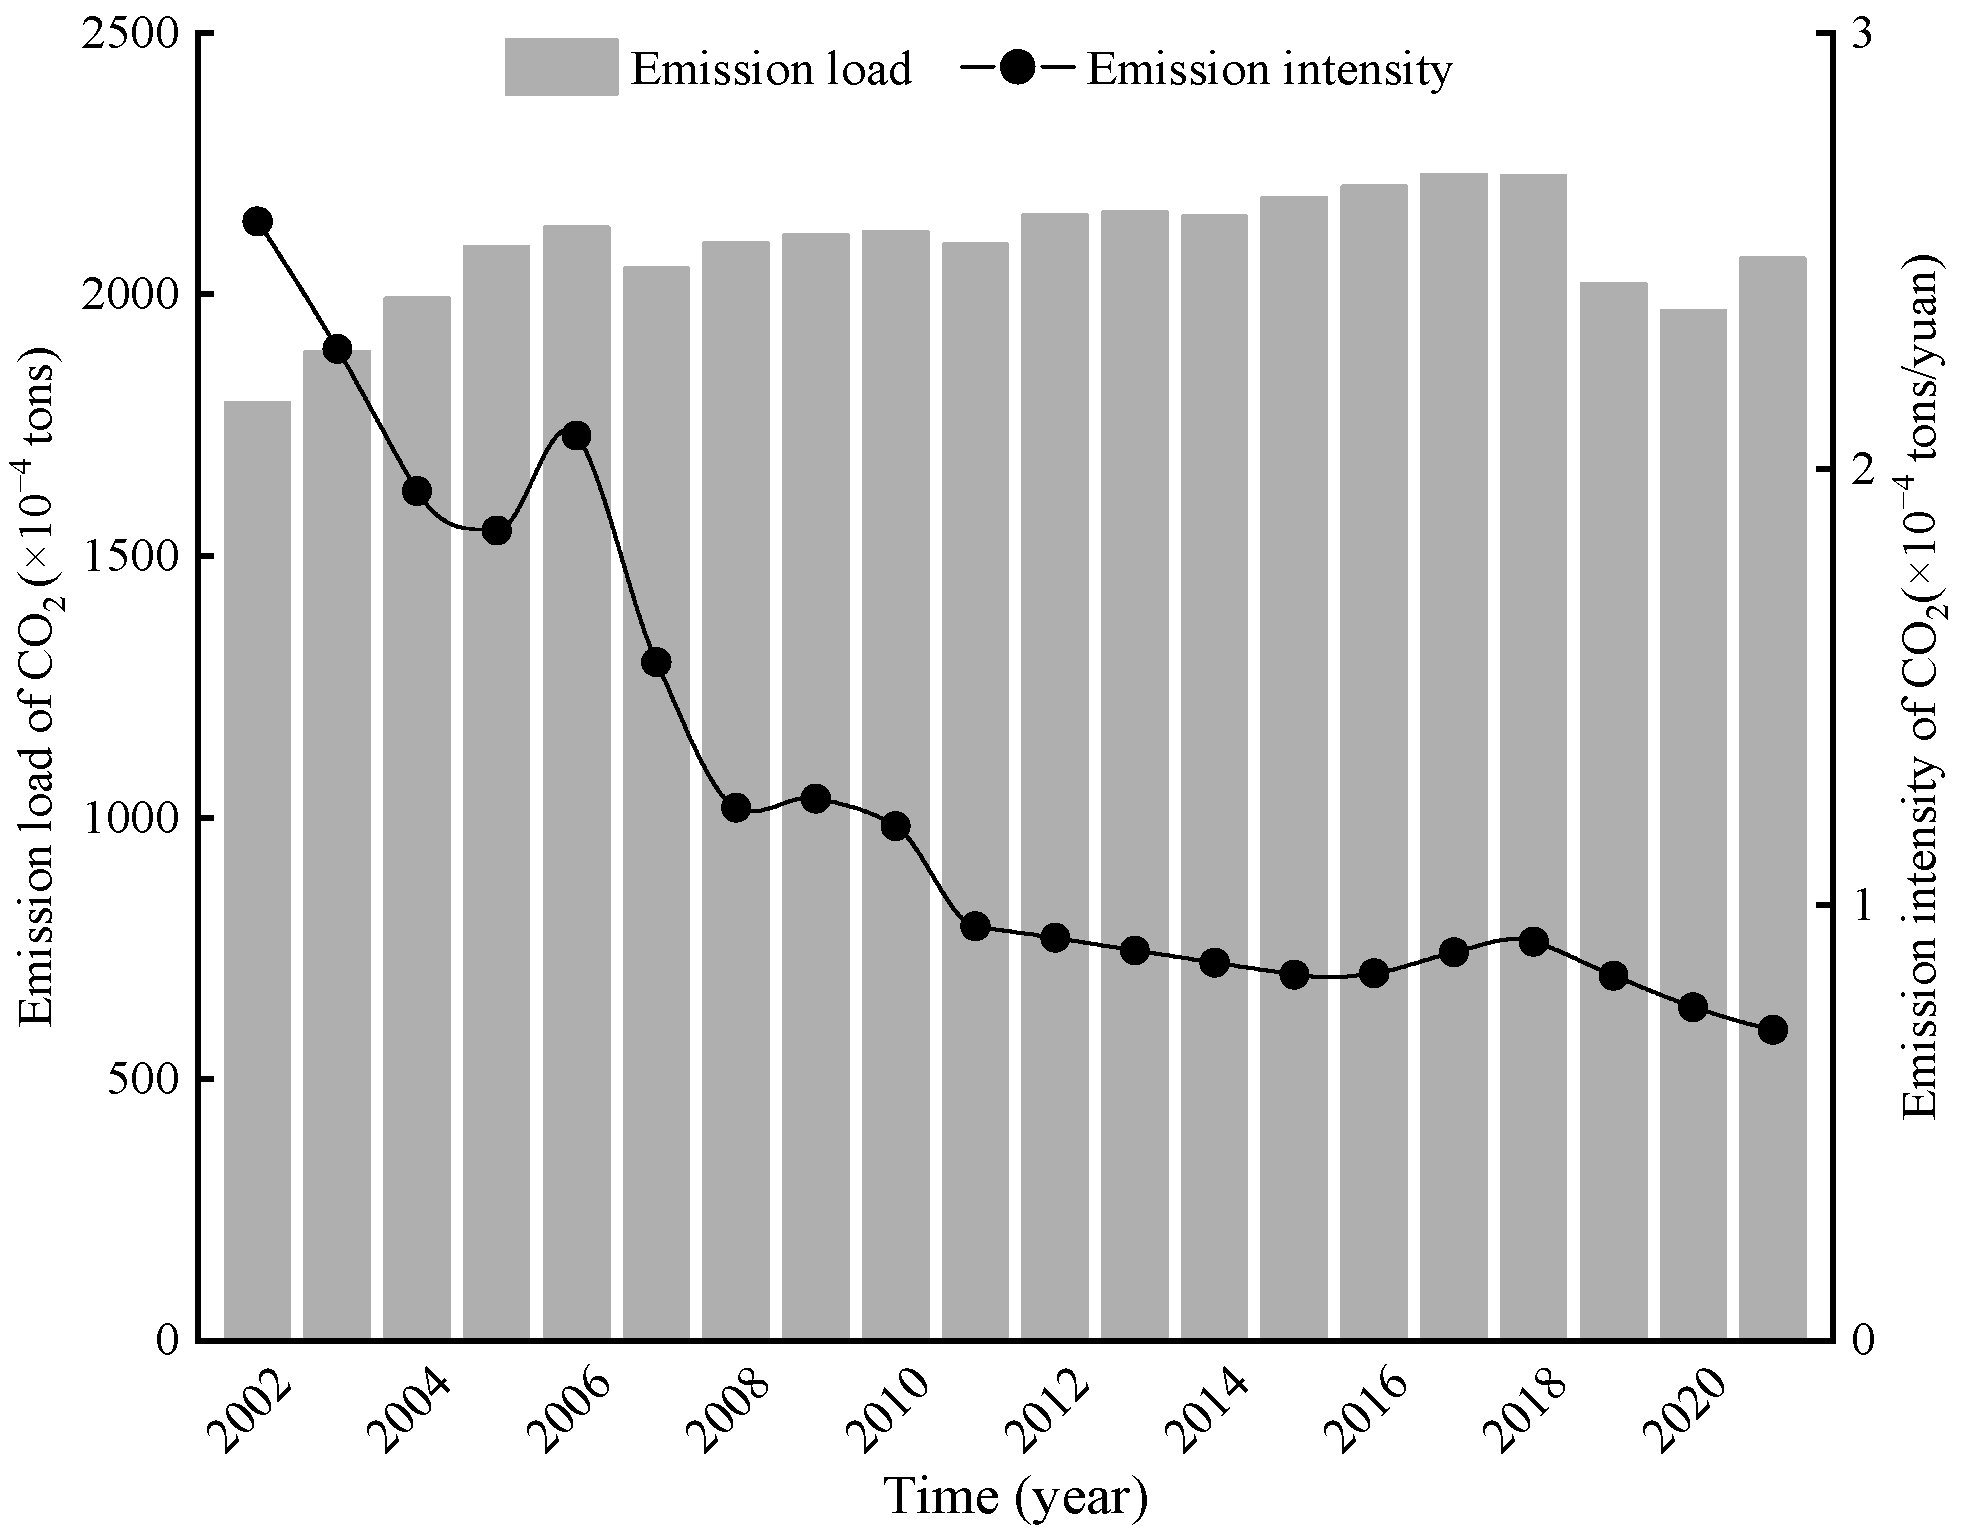
3.1. Variation in Greenhouse Gas Emission Amount and Emission Intensity

The total amount of greenhouse gas emissions of animal husbandry in Shandong Province from 2002 to 2021 and each stage of the life cycle are shown in Table 3. In the past 20 years, the total greenhouse gas emissions of animal husbandry in Shandong Province fluctuated within 1792.99 × 104 to 2228.4 × 104 tons. EGT and ECD were the main greenhouse gas emission stages and had the same trend as ET, both of which were higher than 5 × 10⁴ tons and had average annual growth rates of −0.71% and 1.20%, respectively. Additionally, the average annual growth rates of EME, EFE, EGP, and ESP were 2.45%, 3.01%, 3.01%, and 1.79%, respectively.
The changes in greenhouse gas emission intensity of animal husbandry in Shandong Province are shown in Figure 2. From 2002 to 2021, it showed a downward trend, fluctuating between 0.71 × 10⁻⁴ and 2.57 × 10⁻⁴ tons/CNY. In the past 20 years, the average annual rate of decrease was −3.61%. The decrease rate varied significantly in the first 9 years, with a decrease rate of −6.00%, and became relatively stable in the last 11 years, with a decrease rate of −2.27%.

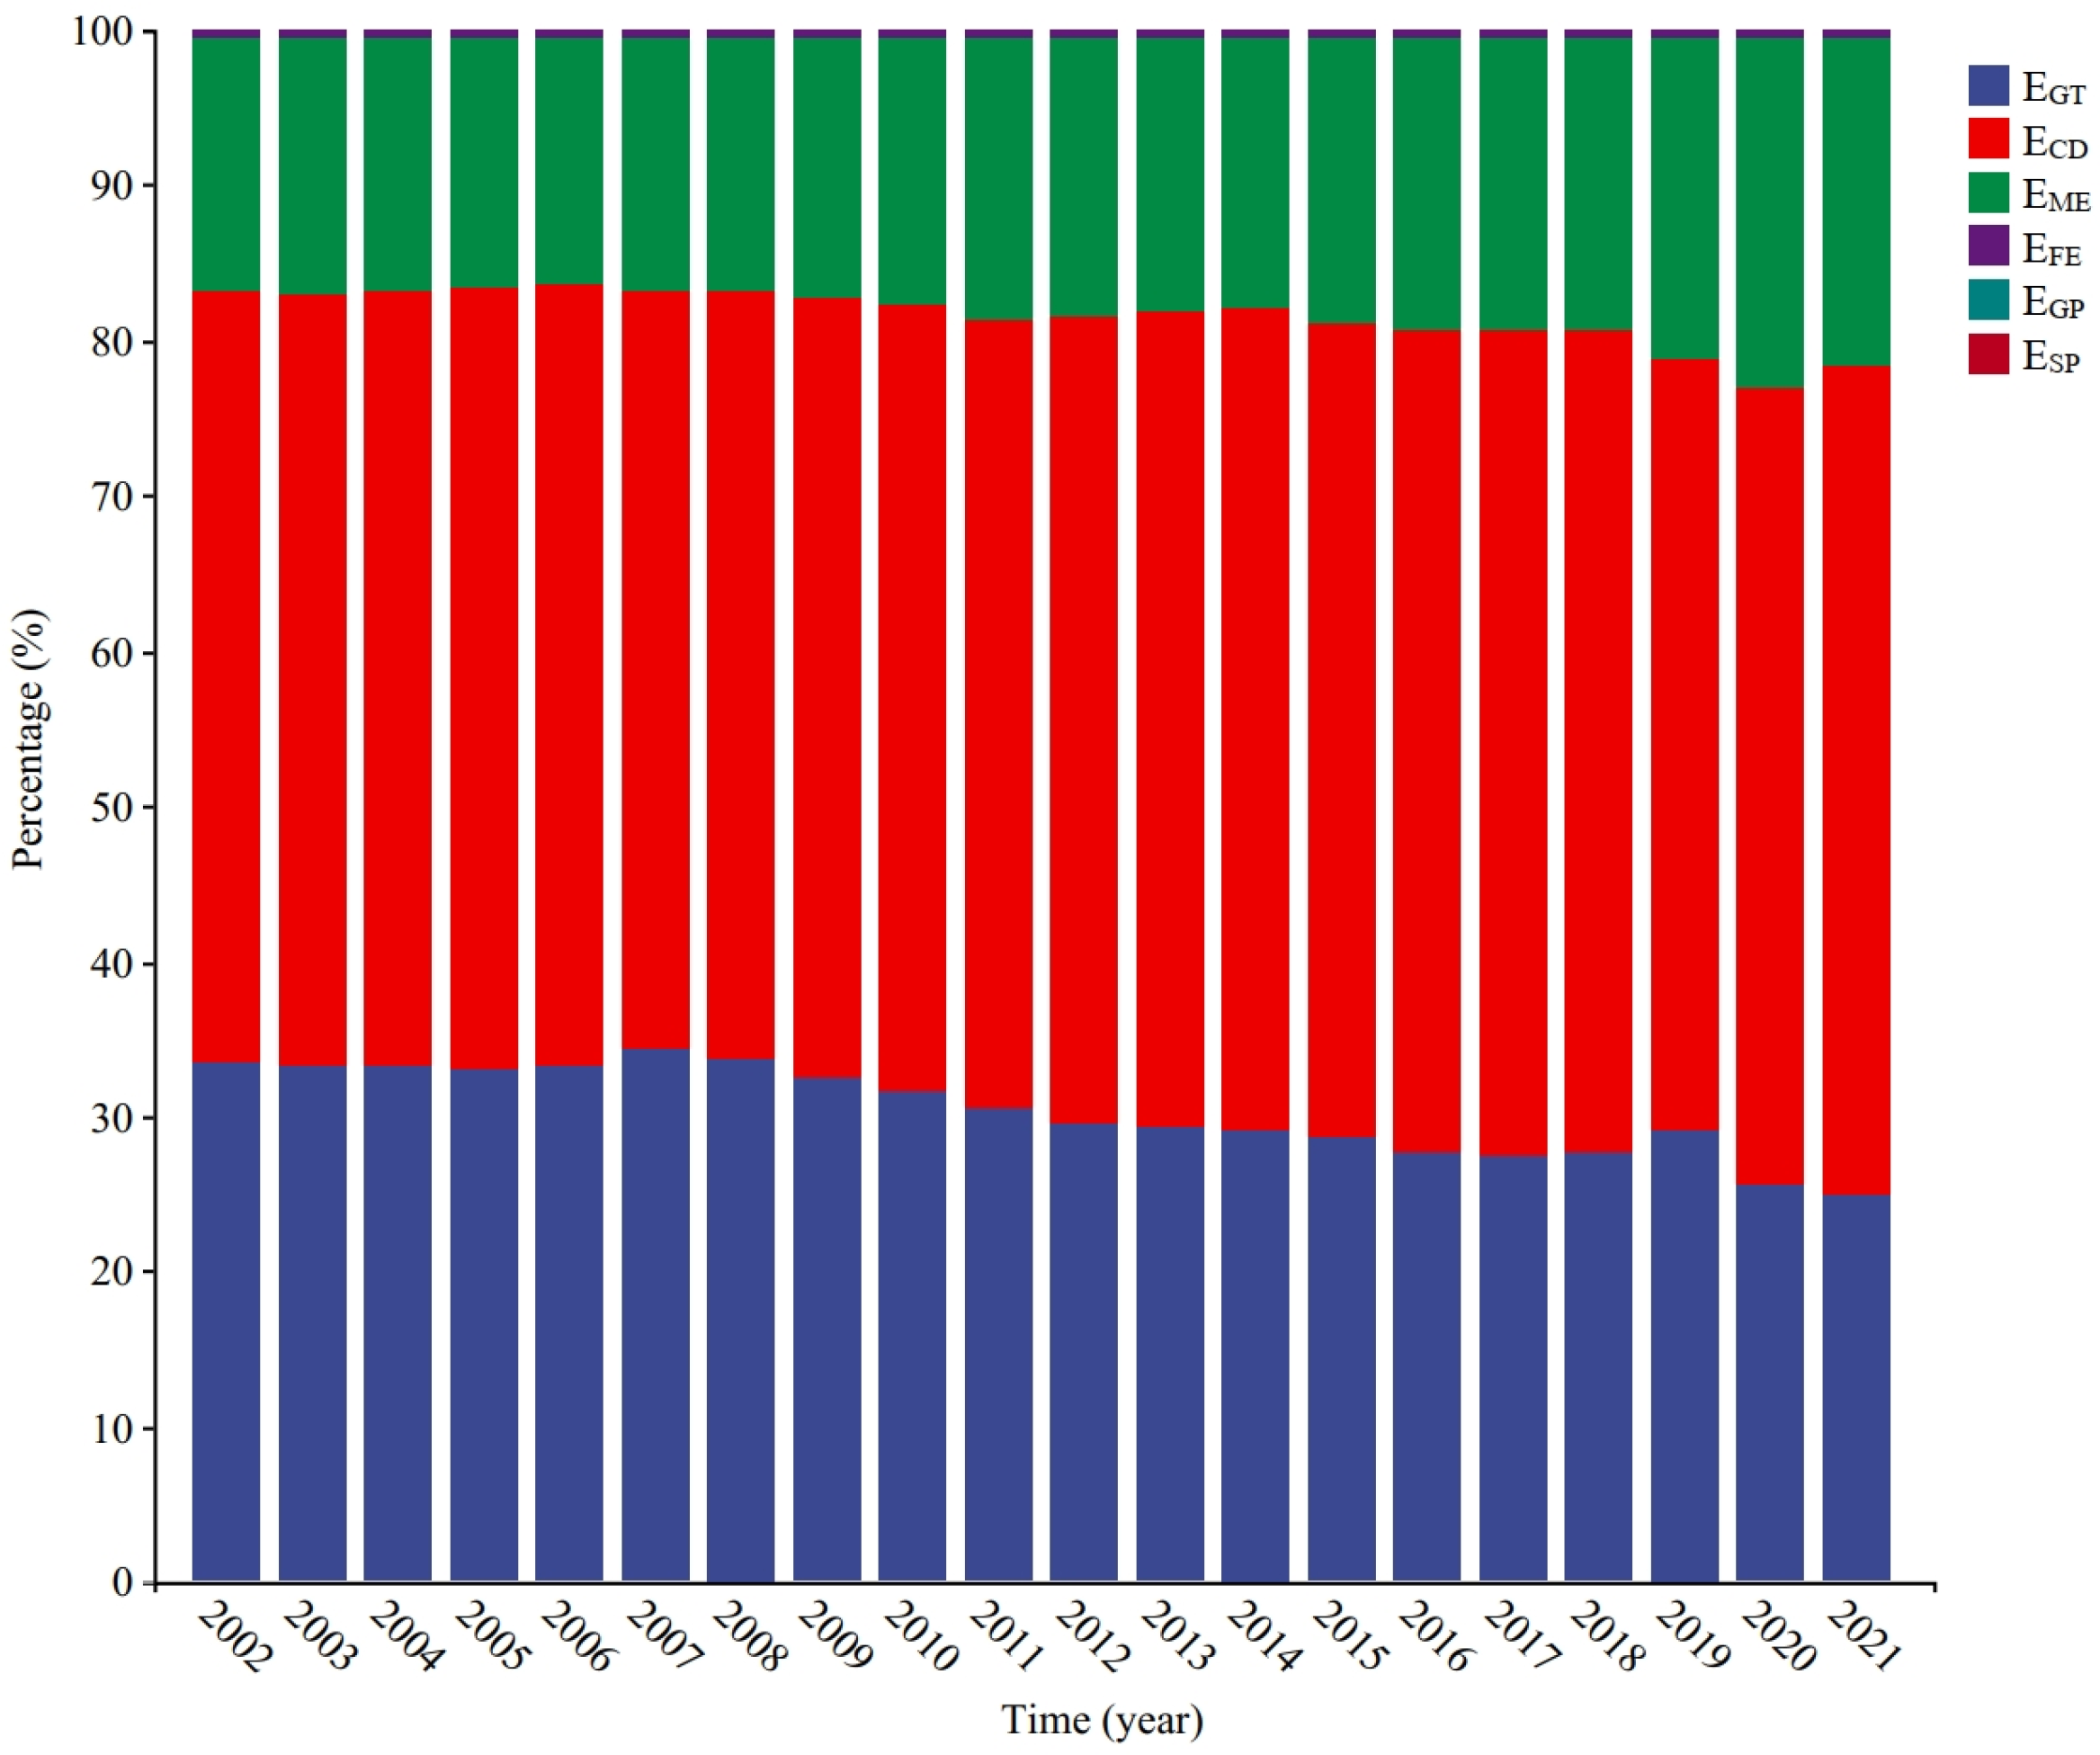
3.2. Variation in Greenhouse Gas Emission Structure

The ratio of the total amount of greenhouse gas emissions in each stage of animal husbandry in Shandong Province to the total greenhouse gas emissions of the entire animal husbandry life cycle is shown in Figure 3. For each stage in the animal husbandry life cycle, the total amount of emissions produced, from high to low, was ECD > EGT > EME > EFE > ESP > EGP, where ECD is the highest, ranging from 890.40 × 10⁴ to 1183.30 × 104 tons, and EGP is the lowest, ranging from 0.25 × 10⁴ to 0.41 × 10⁴ tons (Table 3). At each stage of the animal husbandry life cycle, the proportion of EGT showed a downward trend, the proportions of ECD, EME, and EFE showed an upward trend, and the proportions of EGP and ESP were relatively stable. In the past 20 years, the average proportions of greenhouse gas emissions for each category were 30.42% (EGT), 51.17% (ECD), 17.96% (EME), 0.36% (EFE), 0.02% (EGP), and 0.08% (ESP), respectively.
A comparison of the greenhouse gas emission proportions in different livestock and poultry life cycles in Shandong Province and the total greenhouse gas emission amounts of animal husbandry is shown in Figure 4. This study mainly analyzed the greenhouse gas emission amounts of four major categories of livestock and poultry, namely pig, cattle, sheep, and poultry. From 2002 to 2021, the order of greenhouse gas emissions in different livestock and poultry life cycles in Shandong Province, from high to low, was Epoultry > Ecattle > Epig > Esheep, with average total amounts of annual greenhouse gas emissions of 633.67 × 10⁴, 632.96 × 10⁴, 465.08 × 10⁴, and 355.19 × 10⁴ tons, respectively. It was found that the proportion of Ecattle and Esheep showed a downward trend, the proportion of Epoultry showed an upward trend, and the proportion of Epig fluctuated greatly. In the past 20 years, the average greenhouse gas emission proportions of different livestock and poultry life cycles were 22.21% (Epig), 30.38% (Ecattle), 17.08% (Esheep), and 30.34% (Epoultry), respectively. In 2021, the proportions of greenhouse gas emissions from different livestock and poultry life cycles were 22.66% (Epig), 24.02% (Ecattle), 15.16% (Esheep), and 38.15% (Epoultry), respectively. Poultry was the main source of greenhouse gas emissions in animal husbandry.

3.3. Regional Characteristics of Greenhouse Gas Emissions

3.3.1. Characteristics of Greenhouse Gas Emission Amount and Emission Intensity in Each City

The amount of greenhouse gas emissions and emission intensity of animal husbandry in Shandong Province in 2021 are shown in Figure 5. From the perspective of total emissions, the cities accounting for the largest amount of greenhouse gas emissions from the animal husbandry life cycle, from high to low, were Linyi, Heze, Dezhou, Weifang, Binzhou, Liaocheng, Jining, Yantai, Jinan, Qingdao, Dongying, Taian, Zibo, Rizhao, Zaozhuang, and Weihai, with emissions ranging from 45.05 × 10⁻⁴ to 244.91 × 10⁴ tons. From the perspective of emission intensity, from high to low, the cities accounting for the highest intensity were Binzhou, Heze, Liaocheng, Linyi, Dongying, Zibo, Dezhou, Weihai, Zaozhuang, Jinan, Yantai, Weifang, Qingdao, Rizhao, Jining, and Taian, with intensity ranging from 0.46 × 10⁻⁴ to 1.06 × 10⁻⁴ tons/CNY.

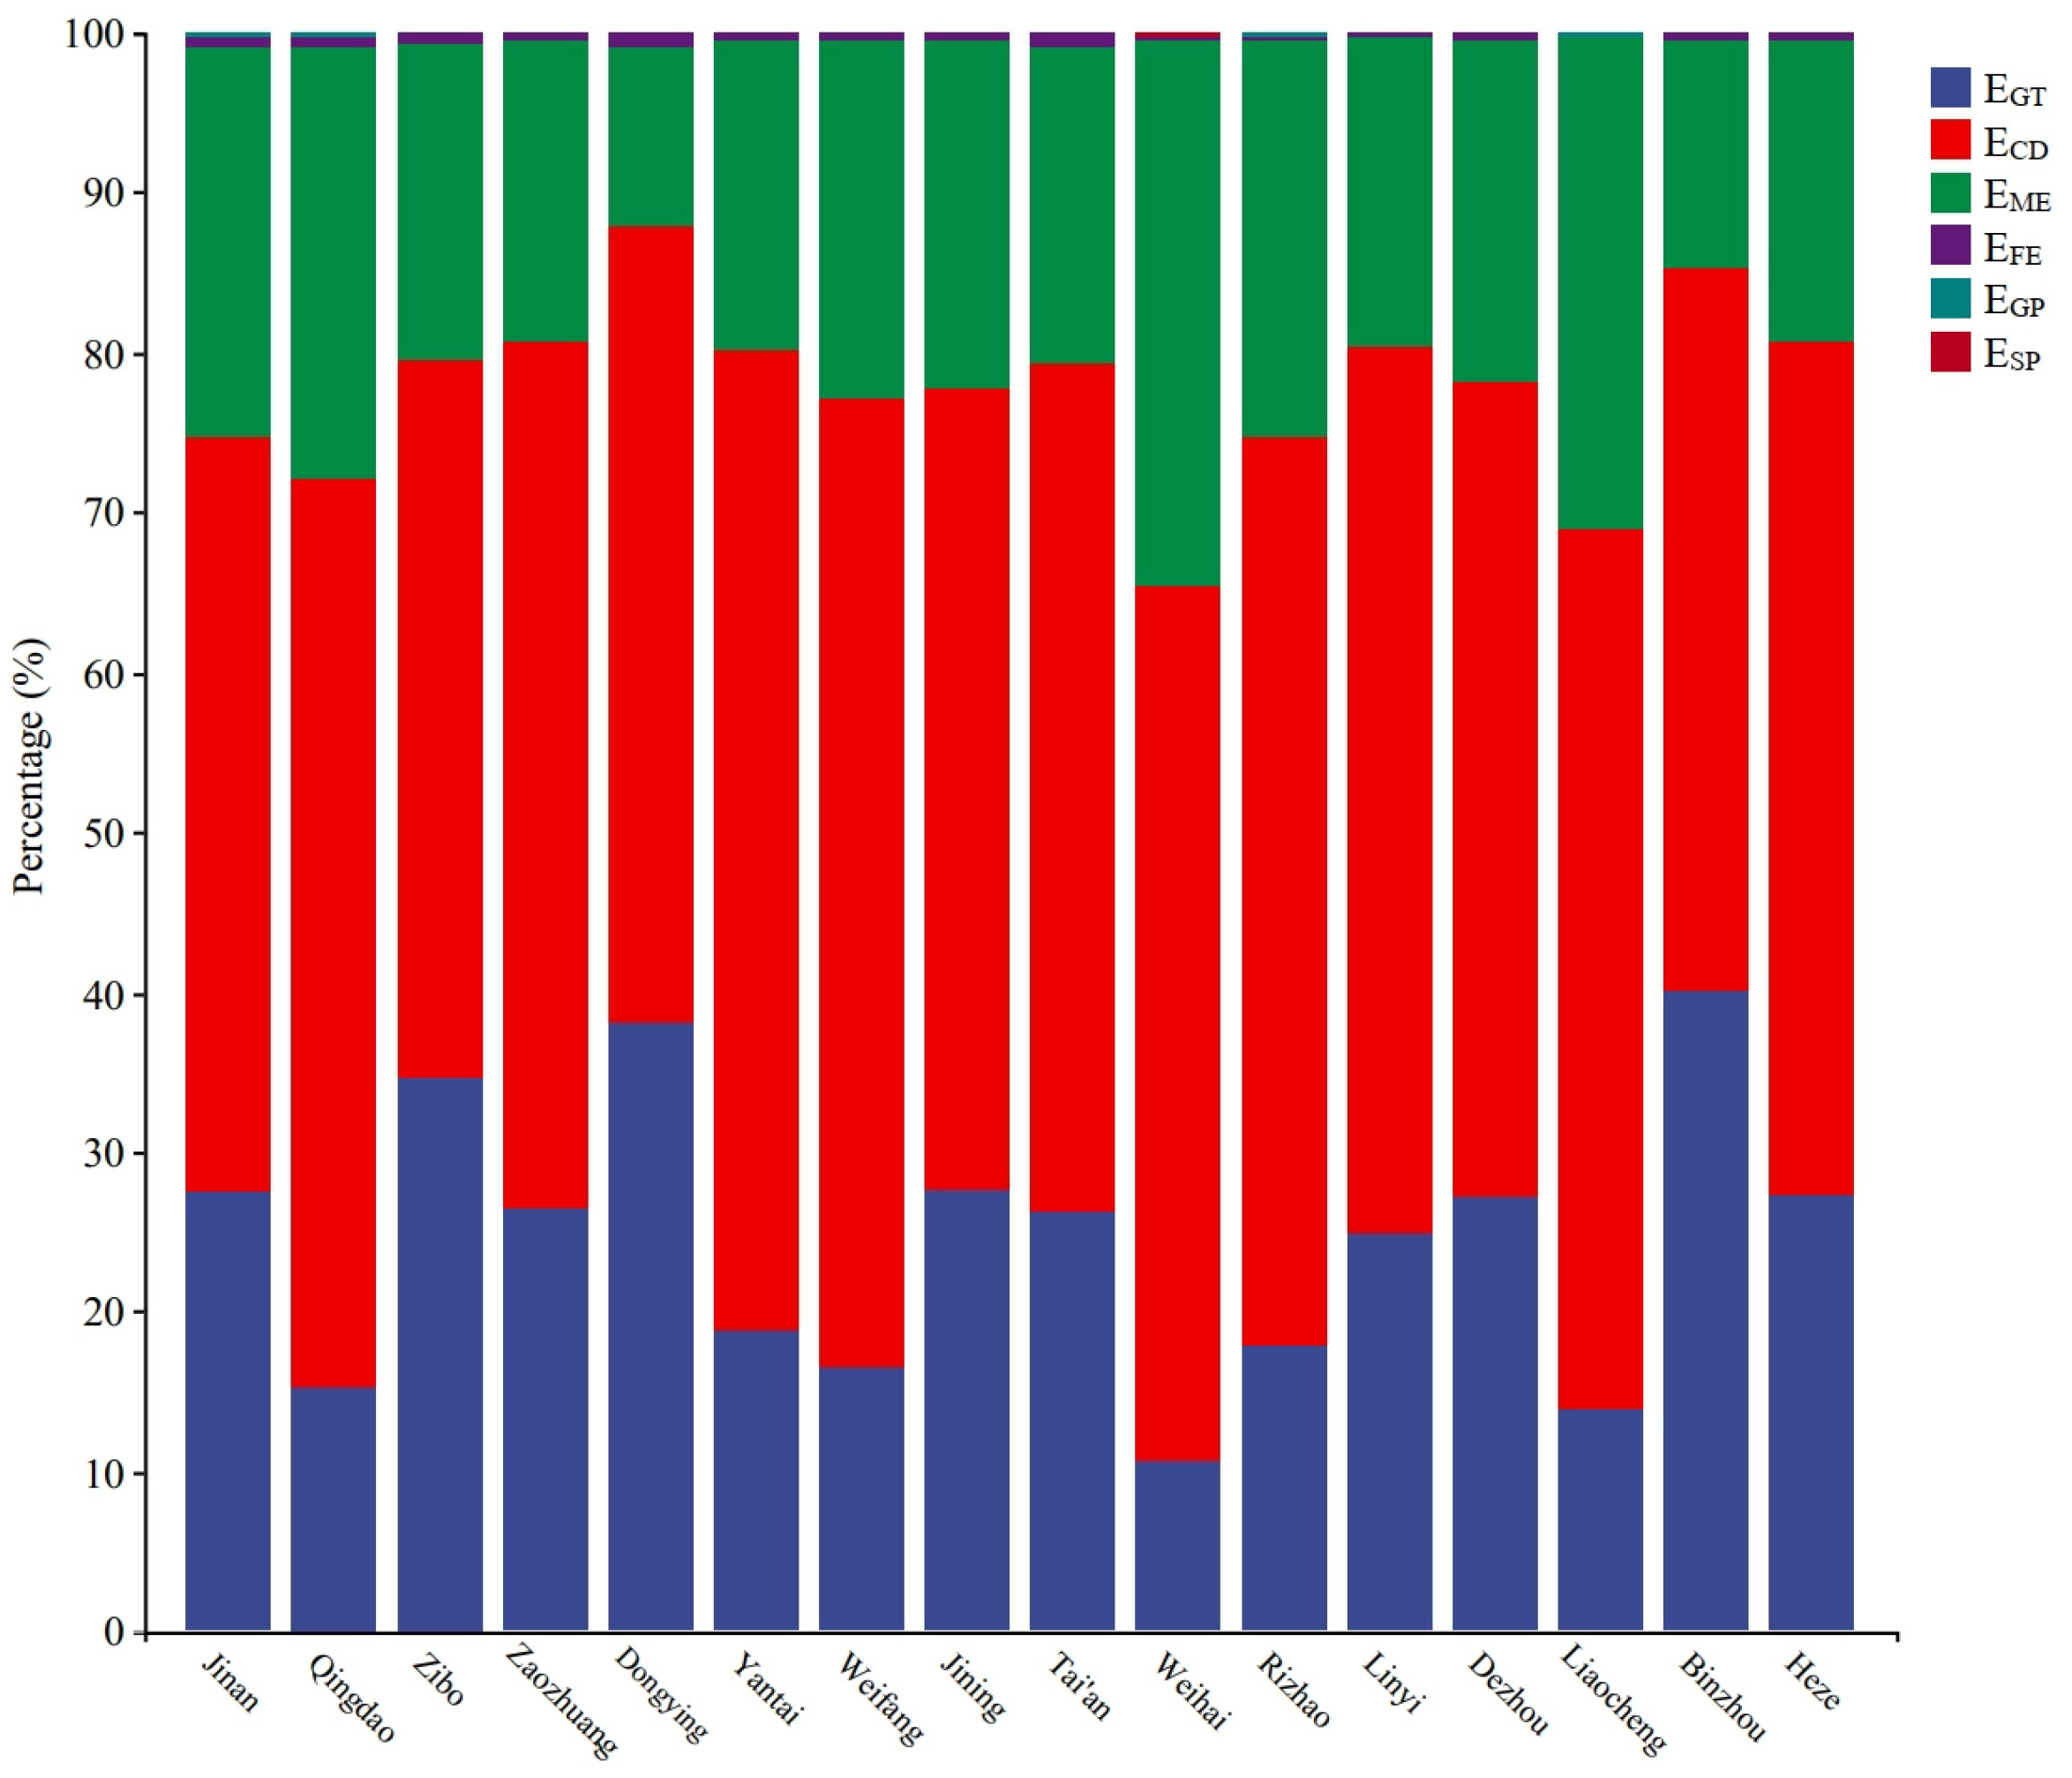
3.3.2. Structural Characteristics of Greenhouse Gas Emission in Each City

The proportion of greenhouse gas emissions in 2021 in each stage of the animal husbandry life cycle in each city of Shandong Province compared with the total greenhouse gas emission amounts of animal husbandry is shown in Figure 6. In terms of the greenhouse gas emission amounts in each stage of the animal husbandry life cycle, Qingdao, Yantai, Weifang, Weihai, Rizhao, and Liaocheng, from high to low, followed the order ECD > EME > EGT > EFE > ESP > EGP, while Jinan, Zibo, Zaozhuang, Dongying, Jining, Taian, Linyi, Dezhou, Binzhou, and Heze had the same order for greenhouse gas emission amounts in each stage of the animal husbandry life cycle as Shandong Province.
The proportion of greenhouse gas emissions in livestock and poultry life cycles in the total greenhouse gas emission amount of animal husbandry in each city of Shandong Province in 2021 is shown in Figure 7. Among the four major categories of livestock and poultry greenhouse gas emissions in each city, Zibo and Binzhou had the highest proportion of Ecattle, Dongying had the highest proportion of Esheep, and the remaining cities had the highest proportion of Epoultry. In addition, it is worth noting that the proportion of Ecattle in Binzhou was as high as 50.40%, and the proportion of Epoultry in Liaocheng, Weihai, and Qingdao was higher than 50%, at 60.63%, 59.74%, and 50.77%, respectively.

3.3.3. Regional Characteristics of Greenhouse Gas Emission

The regional characteristics of greenhouse gas emissions produced in the livestock and poultry life cycle in Shandong Province in 2021 are shown in Figure 8. The proportions of greenhouse gas emissions from pig breeding in Shandong Province were higher in Linyi, Heze, Weifang, and Dezhou, accounting for 12.07%, 11.55%, 11.20%, and 10.42%, respectively. Zibo had the lowest proportion, at just 1.57%. Binzhou, Dezhou, and Linyi had the highest greenhouse gas emission proportions of cattle breeding, accounting for 17.85%, 12.18%, and 10.89%, respectively. Weihai had the lowest proportion, at only 1.05%. Heze, Linyi, and Dongying had higher greenhouse gas emission proportions from sheep breeding, accounting for 17.69%, 13.13%, and 11.51%, respectively, whereas Weihai had the lowest proportion, at only 0.31%. Weifang, Liaocheng, and Linyi had higher greenhouse gas emission proportions from poultry breeding, accounting for 12.34%, 11.89%, and 11.77%, respectively, and Zaozhuang had the lowest proportion, at only 1.89%.

4. Discussion

4.1. Temporal Characteristics of Greenhouse Gas Emissions in Animal Husbandry in Shandong Province

The amount of greenhouse gas emissions produced in China has shown a sustained growth trend, accounting for 21.18% of the total global emissions [33]. The paper entitled “Opinions on the complete, accurate and comprehensive implementation of the new development concept in order to do well with regards to carbon peaking and carbon neutralization” published in 2021 [34] sets out the goal of “carbon peak in 2030 and carbon neutralization in 2060”. At present, the methods for calculating carbon emissions in animal husbandry mainly include the OECD method, IPCC coefficient method, quality balance method, input–output method, and LCA method. LCA can accurately assess the carbon footprint and environmental impact of products and services, and it is increasingly applied in animal husbandry [35]. Therefore, this paper selected LCA to study the greenhouse gas emission characteristics of animal husbandry in Shandong Province. In the past 20 years, the total amount of greenhouse gas emissions from livestock farming in Shandong Province ranged from 1792.99 × 104 to 2228.40 × 104 tons, with an average annual growth rate of 0.77%. The average annual growth rates of EGT, ECD, EME, EFE, EGP, and ESP were −0.71%, 1.20%, 2.45%, 3.01%, 3.01%, and 1.79%, respectively. Meng et al. used LCA to study the greenhouse gas emission characteristics of animal husbandry in China [23]. Their results showed that the average annual growth rates of ET, EGT, ECD, EME, EFE, EGP, and ESP from 1990 to 2011 were 2.22%, 0.47%, 1.89%, 5.10%, 5.45%, 5.67%, and 5.67%, respectively, which are higher than those found in this study. This shows that the average annual growth rate of greenhouse gas emissions from animal husbandry has decreased, and both the total emissions and individual emissions have gradually stabilized.
Skunca et al. conducted a life cycle assessment on the chicken meat production chain, covering five subsystems: “chicken farm”, “slaughterhouse”, “meat processing plant”, “retail”, and “household use”. They found that the global warming potential (GWP) of “chicken farms” ranged from 1.71 to 2.36 kg CO2 eq. The GWP was between 0.28 and 0.63 kg CO2 eq for a “slaughterhouse”, between 0.1 and 0.95 kg CO2 eq for a “meat processing plant”, between 0.26 and 1.26 kg CO2 eq for “retail”, and between 0.12 and 1.19 kg CO2 eq for “household use”. The GWP of a “chicken farm” was highest, and that of a “meat processing plant” was the lowest. These results are consistent with this study [36]. Li used LCA to study carbon emissions and influencing factors of the Xinjiang dairy industry, finding that gastrointestinal fermentation was the main source of greenhouse gases, which also confirmed the results of this study [32]. It is worth noting that Meng et al. also studied the amount of greenhouse gas emissions produced during the whole life cycle of animal husbandry in China’s provinces in 2011 [23]. The results showed that the amount of greenhouse gas emissions from animal husbandry in Shandong Province was 4004.05 × 104 tons, which is significantly higher than the 2096.39 × 104 tons found in this study. However, the amount of greenhouse gas emissions produced in Shandong Province calculated by Meng et al. included all livestock and poultry in animal husbandry, while this study only focused on the amount of greenhouse gas emissions produced by husbandry of the four major categories of livestock and poultry. Furthermore, the LCA was based on setting the boundaries and greenhouse gas emission coefficients of each stage. The greenhouse gas emission coefficients selected in this study were derived from 2021 and 2022 data, so there may be contradictory conclusions.
In addition, this study also focused on the changes in the greenhouse gas emission intensity of animal husbandry in Shandong Province from 2002 to 2021. The results show that the average annual growth rate was −3.61% in the past 20 years. This shows that with the continuous development of the aquaculture industry, the emission intensity of greenhouse gas has continued to decrease, and breeding technology has become more advanced. Further analysis found that the emission intensity of greenhouse gas changed significantly in the first 9 years and was relatively stable in the last 11 years, indicating that the greenhouse gas management system of animal husbandry has also been considerably improved.

4.2. Structural Characteristics of Greenhouse Gas Emissions in Animal Husbandry in Shandong Province

In this study, six major components of animal husbandry, including feed grain planting, feed grain transportation and processing, livestock and poultry breeding, livestock and poultry gastrointestinal fermentation, manure management and livestock, and poultry product slaughter and processing, were selected to calculate the greenhouse gas emissions produced during the whole life cycle of animal husbandry in Shandong Province. The emission amounts from high to low followed the order ECD > EGT > EME > EFE > ESP > EGP. Gastrointestinal fermentation and livestock and poultry manure management were the main sources of greenhouse gas emissions, accounting for 81.59% of the total emission amount. Previous studies on greenhouse gas emissions of animal husbandry were mostly limited to livestock gastrointestinal fermentation and livestock and poultry manure management. In each stage of the animal husbandry life cycle, the proportion of EGT showed a downward trend, the proportions of ECD, EME, and EFE showed an upward trend, and the proportion of EGP and ESP remained relatively stable. This is because the greenhouse gas produced by the rumen of ruminant livestock was the main source of EGT. With the development of animal husbandry, the proportion of cattle breeding has continuously decreased, which also led the proportion of Ecattle to decrease from 32.92% to 24.02%. In the past 20 years, the proportion of Ecattle and Esheep showed a downward trend, the proportion of Epoultry showed an upward trend, and the proportion of Epig fluctuated. In 2021, the proportions of greenhouse gas emissions in different livestock and poultry life cycles were 22.66% (Epig), 24.02% (Ecattle), 15.16% (Esheep), and 38.15% (Epoultry), respectively. The emissions of greenhouse gases from poultry became the main source of greenhouse gas emissions in animal husbandry. This is due to the increased proportion of poultry breeding in the livestock and poultry breeding industry.

4.3. Regional Characteristics of Greenhouse Gas Emissions in Animal Husbandry in Shandong Province

In 2021, the cities with the highest amounts of greenhouse gas emissions from animal husbandry in Shandong Province were Linyi and Heze, with 244.91 × 10⁴ and 215.41 × 10⁴ tons, respectively, accounting for more than 10% of all emissions. The cities with the highest greenhouse gas emission intensity were Binzhou and Heze, at 1.06 × 10⁻⁴ and 1.03 × 10⁻⁴ tons/CNY, respectively. The city with the lowest intensity was Taian, at only 0.46 × 10⁻⁴ tons/CNY. The greenhouse gas emission intensity of each city in Shandong Province was quite different, indicating that the management of greenhouse gas emissions and the development of animal husbandry differed significantly among cities. In 2021, ECD accounted for the largest share of greenhouse gas emissions in any stage of animal husbandry in Shandong Province, indicating that reducing greenhouse gas emissions during manure management is the most important goal at present, and the technology for the treatment of livestock and poultry manure in animal husbandry needs to be continuously improved. In addition, due to the differences in animal husbandry among the cities of Shandong Province, the greenhouse gas emission amounts across different livestock and poultry life cycles in different cities varied considerably. Zibo and Binzhou were dominated by Ecattle, Dongying was dominated by Esheep, and the remaining cities were dominated by Epoultry. Further analysis of the regional greenhouse gas emission characteristics of animal husbandry showed that Linyi, Heze, Weifang, and Dezhou had a higher greenhouse gas emission proportion from pig breeding; Binzhou, Dezhou, and Linyi had a higher greenhouse gas emission proportion from cattle breeding; Heze, Linyi, and Dongying had a higher greenhouse gas emission proportion from sheep breeding; and Weifang, Liaocheng, and Linyi had a higher greenhouse gas emission proportion from poultry breeding.
In summary, as a major province for animal husbandry, a detailed analysis of greenhouse gas emissions from animal husbandry in Shandong Province is important for the sustainable development and rapid economic development of this province. Therefore, through the calculation and analysis of greenhouse gas emissions from animal husbandry, we can reduce the greenhouse gas emissions from animal husbandry in Shandong Province and also provide a reference for the Shandong Provincial Government in formulating relevant carbon emission policies. Based on the research results, the following suggestions are proposed. Firstly, accelerate the construction of the animal husbandry industry system and realize its large-scale development; secondly, accelerate the progress of animal husbandry science and technology and promote low-carbon technology innovation; thirdly, improve the carbon footprint of animal husbandry and improve the policy system; and fourthly, scientifically treat livestock manure and implement rational development of animal husbandry biogas resources.

5. Conclusions

(1) From 2002 to 2021, the total amount of greenhouse gas emissions from animal husbandry in Shandong Province increased continuously, the intensity of greenhouse gas emissions decreased continuously, and both tended to be stable.
(2) From the perspective of life cycle structure, gastrointestinal fermentation and manure management were the main sources of greenhouse gas emissions; from the perspective of livestock and poultry breeding structure, poultry breeding was the main source of greenhouse gas emission.
(3) The greenhouse gas emission characteristics of animal husbandry among cities in Shandong Province differed. Zibo and Binzhou were dominated by Ecattle, Dongying was dominated by Esheep, and the remaining cities were dominated by Epoultry.

Author Contributions

Conceptualization, Z.L. (Zemin Li), Q.W. and X.L.; methodology, Z.L. (Zemin Li), Q.W. and X.L.; investigation, Z.L. (Zemin Li), R.Z. and Z.L. (Zhaojun Li); resources, Z.L. (Zhaojun Li); data curation, Z.L. (Zemin Li); writing—original draft preparation, Z.L. (Zemin Li); writing—review and editing, Z.L. (Zemin Li), Q.W., X.L., R.Z., C.L. and Z.L. (Zhaojun Li); supervision, R.Z., C.L. and Z.L. (Zhaojun Li); funding acquisition, Z.L. (Zhaojun Li). All authors have read and agreed to the published version of the manuscript.

Funding

This research was funded by the National Natural Science Foundation of China, under grant number 52370141.

Institutional Review Board Statement

Not applicable.

Informed Consent Statement

Not applicable.

Data Availability Statement

Data are available upon request.

Conflicts of Interest

The authors declare no conflicts of interest.

References

  1. He, Z.; Cao, H.; Qi, C.; Hu, Q.; Liang, J.; Li, Z. Straw management in paddy fields can reduce greenhouse gas emissions: A global meta-analysis. Field Crops Res. 2024, 306, 109218. [Google Scholar] [CrossRef]
  2. Gao, T. Yulin develops green animal husbandry to promote carbon reduction and efficiency improvement. Environ. Econ. 2022, 22, 57–59. [Google Scholar]
  3. Shandong Statistical Yearbook. 2002–2021. Available online: http://tjj.shandong.gov.cn/col/col6279/index.html (accessed on 12 April 2023).
  4. Central Document No.1. 2022. Available online: http://www.lswz.gov.cn/html/xinwen/2023-02/13/content_273655.shtml (accessed on 15 April 2023).
  5. The 14th Five-Years Plan for National Economic and Social Development and the Outline of the Long-term Goals for 2035 in Shandong Province. 2021. Available online: https://www.ndrc.gov.cn/fggz/fzzlgh/dffzgh/202105/t20210513_1279758.html (accessed on 2 May 2023).
  6. The 14th Five-Years Plan for Prevention and Control of Livestock and Poultry Breeding Pollution in Shandong Province. 2022. Available online: https://www.sdepi.org.cn/qydt/zcfg/1908.html (accessed on 3 May 2023).
  7. Charles, R.; Jolliet, O.; Gaillard, G.; Pellet, D. Environmental analysis of intensity level in wheat crop production using life cycle assessment. Agric. Ecosyst. Environ. 2006, 113, 216–225. [Google Scholar] [CrossRef]
  8. Zeng, D.; Cao, H.J.; Ma, C.M.; Hauschild, M.Z.; Dong, Y. A dynamic approach for life cycle global warming impact assessment of machine tool considering time effect. Int. J. Life Cycle Assess. 2021, 26, 1391–1402. [Google Scholar] [CrossRef]
  9. Brentrup, F.; Küsters, J.; Kuhlmann, H.; Lammel, J. Application of the Life Cycle Assessment methodology to agricultural production: An example of sugar beet production with different forms of nitrogen fertilisers. Eur. J. Agron. 2001, 14, 221–233. [Google Scholar] [CrossRef]
  10. Brentrup, F.; Küsters, J.; Kuhlmann, H.; Lammel, J. Environmental impact assessment of agricultural production systems using the life cycle assessment methodology: I. Theoretical concept of a LCA method tailored to crop production. Eur. J. Agron. 2004, 20, 247–264. [Google Scholar] [CrossRef]
  11. Ji, C. Two Large-Scale Farm Manure Disposal Systems’ Environmental Impact Assessment of Life Cycle—A Case Study of Large-Scale Cattle. Master’s Thesis, Nanjing Agricultural University, Nanjing, China, 2011. [Google Scholar]
  12. Cheng, L. Optimizing Livestock Management for Land Saving, Greenhouse gas Emission Reduction and Environment Protection. Master’s Thesis, Zhejiang University, Hangzhou, China, 2022. [Google Scholar]
  13. Wang, H. Assessment of Greenhouse Gas Emissions from Regional Planting and Breeding Cycles. Master’s Thesis, Beijing University of Civil Engineering and Architecture, Beijing, China, 2022. [Google Scholar]
  14. Zhou, J. Analysis on Environmental Impact of Livestock and Poultry Breeding Based on Life Cycle Assessment. Master’s Thesis, Qingdao University of Science & Technology, Qingdao, China, 2017. [Google Scholar]
  15. Ying, X. Study on Large-Scale Livestock and Poultry Breeding Model Based on Life Cycle Assessment. Master’s Thesis, Zhejiang Sci-Tech University, Hangzhou, China, 2016. [Google Scholar]
  16. Arca, P.; Vagnoni, E.; Duce, P.; Franca, A. How does soil carbon sequestration affect greenhouse gas emissions from a sheep farming system? Results of a life cycle assessment case study. Ital. J. Agron. 2021, 16. [Google Scholar] [CrossRef]
  17. Mostert, P.F.; Bos, A.P.; van Harn, J.; de Jong, I.C. The impact of changing toward higher welfare broiler production systems on greenhouse gas emissions: A Dutch case study using life cycle assessment. Poult. Sci. 2022, 101, 102151. [Google Scholar] [CrossRef] [PubMed]
  18. China Rural Statistical Yearbook. 2021. Available online: https://cnki.nbsti.net/CSYDMirror/trade/yearbook/Single/N2021120010?z=Z009 (accessed on 10 May 2023).
  19. Compilation of China Agricultural Product Cost-benefit Data. 2022. Available online: https://www.zgtjnj.org/naviBooklist-YZQGN-0.html (accessed on 10 May 2023).
  20. IPCC. IPCC Guidelines for National Greenhouse Gas Inventories; IPCC: Geneva, Switzerland, 2006. [Google Scholar]
  21. Hu, X.; Wang, J. Estimation of livestock greenhouse gases discharge in China. Trans. Chin. Soc. Agric. Eng. 2010, 26, 247–252. [Google Scholar]
  22. Li, T.; Xiong, H.; Wang, M. How Does China’s Dairy Industry Develop under “the Carbon Peaking and Carbon Neutrality Goal”: Study on Carbon Emission of Dairy Industry from the Perspective of Whole Industry Chain. Issues Agric. Econ. 2022, 43, 17–29. [Google Scholar]
  23. Meng, X.; Cheng, G.; Zhang, J.; Wang, Y.; Zhou, H. Analyze on the spatialtemporal characteristics of green house gas estimation of livestock’s by life cycle assessment in China. China Environ. Sci. 2014, 34, 2167–2176. [Google Scholar]
  24. Yang, J.; Wang, R. Retrospect and prospect of life cycle assessment. Chin. J. Environ. Eng. 1998, 6, 22–29. [Google Scholar]
  25. Gong, W. Discussion on the Application of Life Cycle Assessment Method and Environmental Product Declaration. China Concr. 2016, 10, 63–65. [Google Scholar]
  26. Wang, Z. Study on Temporal and Spatial Characteristics of Greenhouse gas Emission from Pig Breeding in Jiangxi Province and Its Influencing Factors. Master’s Thesis, Jiangxi University of Finance and Economics, Nanchang, China, 2017. [Google Scholar]
  27. Ma, Y.; Cao, D.; Luo, W.; Li, G.; Zhang, W.; Li, Y. Carbon Emission Accounting Methodology of Livestock and Poultry Breeding Industry in China Based on Life Cycle Theory. China Environ. Sci. 2023, 21, 1–2. [Google Scholar]
  28. Notice on Adjusting the Electricity Price of North China Power Grid. 2011. Available online: https://www.ndrc.gov.cn/xxgk/zcfb/tz/201112/t20111201_964839.html (accessed on 4 June 2023).
  29. Emission Factor of China Regional Power Grid Baseline for Emission Reduction Projects. 2019. Available online: https://www.mee.gov.cn/ywgz/ydqhbh/wsqtkz/202012/t20201229_815386.shtml (accessed on 5 June 2023).
  30. Notice on Implementing the Development and Reform Price [2022] No.303 Document to Improve the Price Formation Mechanism of the Coal Market. 2022. Available online: https://www.ndrc.gov.cn/xxgk/jd/jd/202202/t20220224_1317007.html (accessed on 5 June 2023).
  31. China Energy Statistics Yearbook. 2008. Available online: https://cnki.nbsti.net/CSYDMirror/Trade/yearbook/single/N2022060061?z=Z024 (accessed on 8 May 2023).
  32. Li, K. Carbon Emission and Influencing Factors of Xinjiang Dairy Industry Based on Life Cycle Assessment. Master’s Thesis, Tarim University, Xinjiang, China, 2023. [Google Scholar]
  33. Zervas, G.; Tsiplakou, E. An assessment of GHG emissions from small ruminants in comparison with GHG emissions from large ruminants and monogastric livestock. Atmos. Environ. 2012, 49, 13–23. [Google Scholar] [CrossRef]
  34. Opinions on the Complete, Accurate and Comprehensive Implementation of the New Development Concept to Do Well in Carbon Peaking and Carbon Neutralization. 2021. Available online: https://www.gov.cn/xinwen/2021-10/25/content_5644687.htm (accessed on 9 May 2023).
  35. Xi, Y.; Ye, X.; Du, J.; Kong, X.; Wang, L.; Zhu, F.; Han, T. Research progress on carbon emission accounting methods for livestock and poultry breeding industry. Jiangsu Agric. Sci. 2022, 50, 1–8. [Google Scholar]
  36. Skunca, D.; Tomasevic, I.; Nastasijevic, I.; Tomovic, V.; Djekic, I. Life cycle assessment of the chicken meat chain. J. Clean. Prod. 2018, 184, 440–450. [Google Scholar] [CrossRef]
Figure 1. The greenhouse gases produced throughout the animal husbandry system.
Sustainability 16 01375 g001
Figure 2. Changes in total amount of greenhouse gas emissions and emission intensity of animal husbandry in Shandong Province from 2002 to 2021.
Sustainability 16 01375 g002
Figure 3. Changes in greenhouse gas emission amounts and emission intensity of animal husbandry in Shandong Province from 2002 to 2021.
Sustainability 16 01375 g003
Figure 4. The proportion of greenhouse gas emissions in different livestock and poultry life cycles in Shandong Province compared with the total emission amounts.
Sustainability 16 01375 g004
Figure 5. Greenhouse gas emission amount and emission intensity of animal husbandry in cities of Shandong Province in 2021.
Sustainability 16 01375 g005
Figure 6. The proportion of greenhouse gas emissions in each stage of the life cycle of animal husbandry in each city of Shandong Province compared with the total emission amount of animal husbandry in each city in 2021.
Sustainability 16 01375 g006
Figure 7. The proportion of greenhouse gas emissions in livestock and poultry life cycles in the total emission amounts of animal husbandry in each city of Shandong Province in 2021.
Sustainability 16 01375 g007
Figure 8. Regional characteristics of greenhouse gas emissions throughout life cycle of pigs (a), cattle (b), sheep (c), and poultry (d) in Shandong Province in 2021.
Sustainability 16 01375 g008
Table 1. The calculation formula for greenhouse gas emission amount during the whole life cycle of animal husbandry [23,27].
Major StagesFormulaExplanation
Feed grain planting E FE = i = 1 n Q i · t i · q j · ef j 1 (2)Qi is the annual output of livestock and poultry products; ti is the grain consumption coefficient of unit livestock and poultry products; qj is the proportion of j-type grain in the formula of i-type livestock and poultry feed; efj1 is the CO2 equivalent emission coefficient of j-type grain.
Feed grain transportation and processing E GP = i = 1 n Q i · t i · q j · ef j 2 (3)Qi is the annual output of livestock and poultry products; ti is the grain consumption coefficient of unit livestock and poultry products; qj is the proportion of j-type grain in the formula of i-type livestock and poultry feed; efj2 is the CO2 equivalent emission coefficient of j-type grain.
Livestock and poultry breeding E ME = i = 1 n NAPA i · C ie P e · ef e + i = 1 n NAPA i · C ic P c · ef c (4)NAPAi is the annual production of livestock and poultry; Cie is the electricity expenditure per head of livestock and poultry; Pe is the unit price of electricity for livestock and poultry breeding; efe is the CO2 emission coefficient of power consumption; Cic is the expenditure on coal consumption per head of livestock and poultry; Pc is the unit price of coal for livestock and poultry breeding; efc is the CO2 emission coefficient of coal consumption.
Gastrointestinal fermentation E GT = i = 1 n APP i · ef i 1 · GWP CH 4 (5)APPi is the average feeding amount of livestock; efi1 is the CH4 emission coefficient of gastrointestinal fermentation; GWPCH4 is the global warming potential of CH4.
Manure management E CD = i = 1 n ( APP i · ef i 2 · GWP CH 4 + APP i · ef i 3 · GWP N 2 O ) (6)APPi is the average feeding amount of livestock and poultry; efi2 is the CH4 emission coefficient of the manure management system; efi3 is the N2O emission coefficient of the manure management system; GWPCH4 is the global warming potential of CH4; GWPN2O is the global warming potential value of N2O.
Product slaughter and processing E SP = i = 1 n Q i · MJ i e n · ef e (7)Qi is the annual output of livestock and poultry products; MJi is the energy consumption of slaughter and processing per unit of livestock and poultry products; en is the calorific value of one degree electricity; efe is the CO2 emission coefficient of power consumption.
Total emissions E T = E FE + E GP + E ME + E GT + E CD + E SP (8)ET is total emissions; EFE is feed grain planting; EGP is feed grain transportation and processing; EME is livestock and poultry breeding; EGT is gastrointestinal fermentation; ECD is manure management; ESP is product slaughter and processing.
Table 2. The greenhouse gas emission coefficients of animal husbandry in Shandong Province.
CoefficientPigCattle for BeefDairy CattleSheepPoultry for MeatPoultry for EggUnit
ti1.6038.0718.042.040.020.16t/t
efj1Corn: 1.50; wheat: 1.22; alfalfa: 0.27 t/t
efj2Corn: 0.0102; wheat: 0.0319; alfalfa: 0.002; soybean: 0.1013 t/t
Cie3.5110.30353.472.550.187.57CNY/head
Cic0.350.004.581.760.620.00CNY/head
Pe0.62CNY/(kW·h)
Pc655.00CNY/t
efe0.94t/(MW·h)
efc1.98t/t
efi11.0051.4068.0056.000.000.00kg/(head·a)
efi23.541.5016.000.160.020.02kg/(head·a)
efi30.531.371.000.330.020.02kg/(head·a)
GWPCH421.00/
GWPN2O310.00/
MJi3.764.371.1210.402.598.16MJ/kg
en3.60MJ/(kW·h)
Table 3. Total amount of greenhouse gas emissions of animal husbandry in Shandong Province from 2002 to 2021 (unit: ×104 tons).
TimeEGTECDEMEEFEEGPESPET
2002601.79890.40294.085.130.251.341792.99
2003630.50938.55313.985.920.281.431890.65
2004664.14994.87325.496.600.321.491992.89
2005690.941051.44339.977.140.341.552091.38
2006708.701072.70337.767.700.371.562128.80
2007705.611000.73335.377.170.341.442050.66
2008704.781038.91344.887.470.361.492097.89
2009687.361061.08355.827.570.361.532113.73
2010669.721075.50364.637.850.381.572119.65
2011637.791069.48379.098.040.391.612096.39
2012635.091118.66387.278.380.401.672151.47
2013631.101132.75382.888.220.391.662157.02
2014627.161136.57375.098.340.401.652149.21
2015623.361149.20401.588.310.401.732184.58
2016613.121165.21418.448.130.391.772207.06
2017613.851183.29421.317.730.371.842228.39
2018618.491176.57421.777.770.371.842226.81
2019586.621006.77417.587.440.361.692020.45
2020504.351009.84444.787.190.341.771968.27
2021516.561104.52438.148.220.391.822069.65
Disclaimer/Publisher’s Note: The statements, opinions and data contained in all publications are solely those of the individual author(s) and contributor(s) and not of MDPI and/or the editor(s). MDPI and/or the editor(s) disclaim responsibility for any injury to people or property resulting from any ideas, methods, instructions or products referred to in the content.

