Article

Impacts of COVID-19 and the Russian–Ukrainian Conflict on Food Supply Chain: A Case Study from Bread Supply Chain in Egypt

by
Noha A. Mostafa
1,2,
Abdelwahab A. Hussein
2,
Mohab Elsheeta
2 and
Giovanni Romagnoli
3,*
1
Industrial Engineering Department, Zagazig University, Zagazig 44519, Egypt
2
Mechanical Engineering Department, The British University in Egypt, El Sherouk City 11837, Egypt
3
Department of Engineering and Architecture, University of Parma, 43124 Parma, Italy
*
Author to whom correspondence should be addressed.
Sustainability 2024, 16(3), 994; https://doi.org/10.3390/su16030994
Submission received: 7 December 2023 / Revised: 17 January 2024 / Accepted: 19 January 2024 / Published: 24 January 2024

Abstract

:
The COVID-19 pandemic and the Russian–Ukrainian war have significantly impacted global supply chains, including the food supply chain, in numerous countries. As one of the leading wheat importers, Egypt has been adversely affected by the simultaneous occurrence of these two events. Baladi bread is an integral part of the daily diet in Egypt, so any disruption affecting its availability can have a severe impact on the country’s food security. This study aims to simulate the causes and effects of potential disruptions that could occur, such as increased transportation time, unavailability of sourcing, and surge in demand due to lockdowns and panic buying. The East Cairo region was chosen as a case study to model the Baladi bread supply chain. A discrete-event simulation model was developed using anyLogistix software (version 2.15.1) for this study. Five key performance indicators were selected to evaluate, analyze, and compare the outcomes of each scenario in terms of the performance and operation of the food supply chain: service level by product, lead time, demand backlog, average daily available inventory in the mills, and on-hand inventory of wheat in the silos. The results indicate that the supply chain has been significantly impacted by the disruptions caused by these two events, leading to decreased availability of Baladi bread, unmet demand, extended lead times, and high backlogs. By utilizing the research findings, proactive strategies can be developed to minimize the impact of such disruptions in the future and maximize food security and supply chain resilience.

1. Introduction

Modern supply chain networks consider sustainability as one of the primary focuses in managing supply chains [1]. The triple bottom line of sustainability that incorporates environmental, economic, and social performance indicators [2,3] is being highly impacted by recent and consecutive global supply chain disruptions that lead to major economic and social effects. In 2019, the world was hit by the COVID-19 pandemic, which spread worldwide, affecting the lives of millions of people across the globe [4]. Over history, several pandemics have broken out and resulted in high mortalities, and they have contributed to changing many aspects of civilization [5]. Many countries around the world implemented strategies to slow the virus’ spread, such as prohibiting the gathering of people, travel restrictions, shifting towards online education and working from home, and, finally, quarantine lockdowns [6,7]. However, lockdown, though one of the counter measures against the pandemic, cost countries many losses and led many people to lose their jobs, which increased unemployment levels [8]. Measures taken against the pandemic led to disruptions in the economic situation and the lives of people in many countries. The disruptions were not caused only by these lockdowns but were also due to the lockdowns in major countries such as China, which is considered a critical contributor in the global supply chain [9]. China is also known as the factory of the world; more than 50,000 companies around the world have at least one Tier 1 supplier in the region impacted by the pandemic in China, and at least five million companies have one or more Tier 2 suppliers in the same region [10]. The risk of such a pandemic, in terms of impact, was almost unforeseen for most of the companies; thus, supply chains were subject to major disruption in different industries [11]. COVID-19 took its toll on the economy as it affected many sectors; some of these sectors are agriculture and food, petroleum and oil, manufacturing, education, the financial industry, tourism and aviation, real estate and housing, the sport industry, and many others [12,13]. Food sector resilience is critical for ensuring the safety and security of the global food system [14] and COVID-19 caused big disruptions in this sector in terms of both production and demand; these consequences are due to the regulations imposed by many governments on logistics, workers, and facilities [15]. Although such regulations were imposed to contain the pandemic’s spread, they also caused a significant reduction in production rates and resulted in a decrease in household incomes. Moreover, they caused an increase in the global prices of essential food commodities such as rice, wheat, and corn, among others. Some of the developing countries located in Africa were more affected by the situation due to their fragile food security systems [16].
Making the situation more complex, The Russia–Ukraine war started in February 2022. Both countries are among the biggest suppliers of food and agricultural commodities, such as wheat, corn, and vegetable oils; moreover, Russia is a major supplier of fertilizers. All these causes led to a surge in international food prices and a rise in the import costs of food, which greatly affected countries with high reliance on food imports. It is estimated that the increase in the global import bill was 10%, and the agriculture import bill reached 48%, directly affecting the local cost of food [17]. Food prices were already above the normal values due to the COVID-19 pandemic, and the further increases due to the war caused a heavy burden in many countries [17,18].
The Middle East and North Africa (MENA) region concentrates considerable effort on agricultural development; however, it still depends on importing around 50% of its calories for consumption, and this condition increases its vulnerability to crises. Due to the lockdown and the restrictions on global transportation during COVID-19 time, many countries in the MENA region suffered from food crises. Also, instabilities in some of the countries in the region caused parts of the population to seek refuge in neighboring countries. Egypt is the world’s largest importer of wheat [19], and, thus, it is one of the countries that was most heavily exposed to the double impact of the pandemic and the Russian–Ukrainian war, alongside experiencing other economic issues that led to an increase in wheat prices of around 20% [20]. In addition, critical sectors such as tourism were impacted, leading to sizable losses of income and increased poverty [21]. The Egyptian government took many actions to secure the domestic food market, some of which involved importing sufficient quantities of commodities such as wheat, corn, and soybean, increasing the agricultural area for planting wheat, and investing in small and medium enterprises to reduce the unemployment [22]. Egypt is susceptible to such demand shocks due to its high imports of food and the prevalent poverty rate that makes it hard for people to adapt to the increase in prices [23].
Since the outbreak of the pandemic, many researchers have investigated its impact on different sectors, including supply chains. However, studies on such topics in the MENA region countries are still limited, mainly due to the scarcity and unavailability of data. Thus, this study seeks to investigate the impact of both COVID-19 and the Russian–Ukrainian war on the bread food supply chain in Egypt as it is the most strategic food in the country. In particular, the present work focuses on the Baladi bread, one of the most important food products in Egypt and, thus, one of the most strategic and critical food supply chains in the country. We note that, although regional differences within the Mediterranean area exist, food consumption is a distinctive feature of regional character, and the Mediterranean countries often count cereals as their basic ingredient, especially in the Southern Mediterranean countries and in the Balkan countries [24,25].
In this work, the following research questions are addressed:
RQ1: 
What are the impacts of disruptions on the agri-food sector and on the food supply chain?
RQ2: 
How can simulation be used to model disruption in the food supply chain?
The remainder of the paper is organized as follows: Section 2 gives a literature review of the previous works on disruptions in food supply chains. In Section 3, the problem is described, and the methodology of the simulation is given. Section 4 gives the results and analysis, and Section 5 gives discussion and implications. Finally, conclusions are given in Section 6.

2. Literature Review

2.1. Disruptions in Food Supply Chain

Disruptions in food supply chains have been a significant concern, especially during the COVID-19 pandemic. Many vulnerabilities in food supply chains were exposed due to several economic, political, and infrastructural factors [26]. The agri-food sector has faced negative impacts due to disruptions in demand, supply, transport, and the operability of nodes [27]. These disruptions have led to a focus on dealing with the consequences of the pandemic, potentially weakening the adoption of sustainable initiatives in the agricultural sector [28]. To mitigate the impacts of disruptions, it is crucial to enhance food supply chains with strategies such as multi-level processing to increase safety stocks [29]. Additionally, the resilience of food supply chains can be improved by developing orchestration capabilities and implementing effective supply, transportation, and logistics management [30]. Understanding the relationship between supply chain performance measures, supply chain resilience, and sustainable corporate performance is essential for mitigating disruptions and improving the overall performance of food supply chains.
The agriculture sector has faced huge problems since the beginning of the pandemic. Agriculture around the world still depends on human labor, especially for fruit and vegetable crops which require humans to perform tasks like planting and harvesting. In some countries, labor is not available locally and is brought from the nearby countries. For example, the United Kingdom faced a problem after the beginning of the pandemic in that most of its planted crops required around 90,000 working hands to be harvested or they would be wasted. The UK usually gets labor from Eastern European countries and due to the lockdown it was hard for them to move freely [31,32]. The lack of labor is not the only problem agriculture faces as it also struggles due to the lack of necessary fertilizers, which are mainly produced in China [33].
People felt fear for their own welfare and turned to panic buying and stockpiling large quantity of provisions that were required on a daily basis. Food products, especially those with long expiration dates, witnessed huge increases in sales, which resulted in many markets shelfs being emptied and raised concern among other group of citizens who could not afford forward buying. Some countries implemented some measures to prevent panic buying, such as extending the delivery time allowed for retailers during the night so they would be able to provides markets with the required stock. Moreover, some countries, such as the UK, provided free meals to families with low income, the elderly, and school children. Food stores also took measures to minimize this phenomenon by putting limitations on the amount a single shopper could buy and allocating fixed slots for the elderly to shop [34]. The same period witnessed a huge increase in online shopping, especially for food providers, in order to minimize human contact. Some of the online service providers used drones as a delivery method for fast reach and safety purposes [35].
In the United States, food supply chain workers, whose jobs involved production, processing, distribution, and delivery, were exempted from the lockdown decision as they were considered a critical type of labor. Safety precautions were implemented to ensure the safety of those workers, especially those involved in indoor jobs. However, other food service industries, such as restaurants, were considered unessential and the government decided to shut them down or reduce their working hours, which led to a rise in unemployment levels and made the customers who depended on the meals from food service industries prepare their own meals at home, decreasing the amount of money spent by them on dining out, which caused huge financial loses for this sector [35,36]. Despite the extreme safety measures in industrial facilities, cases of infection occurred in some meat packaging and food processing plants, which led to temporary closure causing a ripple effect in the food supply chain. Increased consumer demand led to empty shelves and lower supply led to higher prices of meat products. Some markets had a cap on the amount of beef and pork products that a single consumer could purchase. Food services were also impacted, with some restaurants discontinuing the sale of beef burgers [37,38,39].
Another vulnerability that was exposed in the food supply chain was the dependence on a few suppliers. By adopting advanced supply chain concepts such as lean sourcing and just-in-time (JIT) logistics, storage costs are minimized, but this also makes the supply chain more vulnerable to risks. The European Union utilizes a special algorithm for ordering fresh fruits and vegetables and having them delivered in around 24 h; such a system gave the supermarkets a tough time restocking their shelves and affected the exporters of fresh food, who were not able to deliver the products within their expiry times [40]. As a result, the COVID-19 pandemic forced the use of emergency response systems and impacted food supply chain contractual transactions. Simultaneously, it shifted the supply–demand balance, putting small producers and operators in a challenging position [41].

2.2. Simulating Food Supply Chain Disruptions

Many works were perused to analyze the disruptions in food supply chains and the proposed solutions to enhance the supply chain performance and shield against these disruptions. Esteso et al. [42] suggested a system dynamics model for fresh food supply chains to simulate the disruptions in planting, planning, and evaluating the robustness. Through analyzing the disruptions in demand, supply, transportation, and node-to-node operation, they managed to propose a methodology to enhance the robustness. They used known behavior replications and extreme conditions tests to assess the robustness of the model. The paper offers many proactive risk management strategies and their impact to improve supply chain robustness. Tonnang et al. [43] developed a framework that uses system dynamics to evaluate the impact of COVID-19 on food supply chain in Kenya and Rwanda. Such frameworks work by analyzing the interactions between the contagion, health, and food supply chain components, revealing the adverse effects of COVID-19 on food and nutritional security through applying a system thinking approach. The interactions between the variables in the model were mapped by using a causal loop diagram and stock and flow diagrams. It was concluded that applying protective measures for the COVID-19 pandemic such as lockdowns and closure of borders can have a negative effect on the food supply chain in the countries of study; it also caused labor shortages, increased unemployment rates, caused loss of income, and negatively impacting the availability, accessibility, and stability of food and nutrition security. The paper also emphasized the importance of establishing resilient food systems to mitigate food crises in the future. Huang et al. [44] simulated the effect of the COVID-19 pandemic on the lobster industry based in Nova Scotia. The simulation was made by using anyLogistix software to analyze the pandemic’s effect on the sustainability of such a food supply chain in terms of production–inventory dynamics, customers’ performance, and lead time performance. It was found that the pandemic created backlog problems and increased the lead time; the research concluded that the simulation methodology can be effective in exploring and predicting the effect of negative scenarios on the supply chain. Burgos and Ivanov [45] simulated the impact of the COVID-19 pandemic on the German-based food retail supply chain, and anyLogistix software was used to simulate the effect of actual scenarios that occurred during the pandemic period on the supply chain’s operation and performance dynamics. The simulation results indicated that the resilience of the supply chain during the pandemic depended on the pandemic’s intensity and was affected by three main factors: governmental measures, inventory ordering dynamics, and customers’ behavior. It was also noted that supply chain performance and operations were affected by the high increase in demand and supplier shut down, while the transportation effect was low. Singh et al. [46] developed a simulation model of the public distribution system (PDS) for the food supply chain in India. By focusing on two products, wheat, and rice, anyLogistix was used to simulate the disruption effect on the network during the COVID-19 period based on the effect of three scenarios. The expected lead time and revenue were used as key performance indicators to measure the disruption effect. It was found that introducing a backup warehouse to the system could have improved the revenue and the expected lead time during the COVID-19 period.

3. Case Study

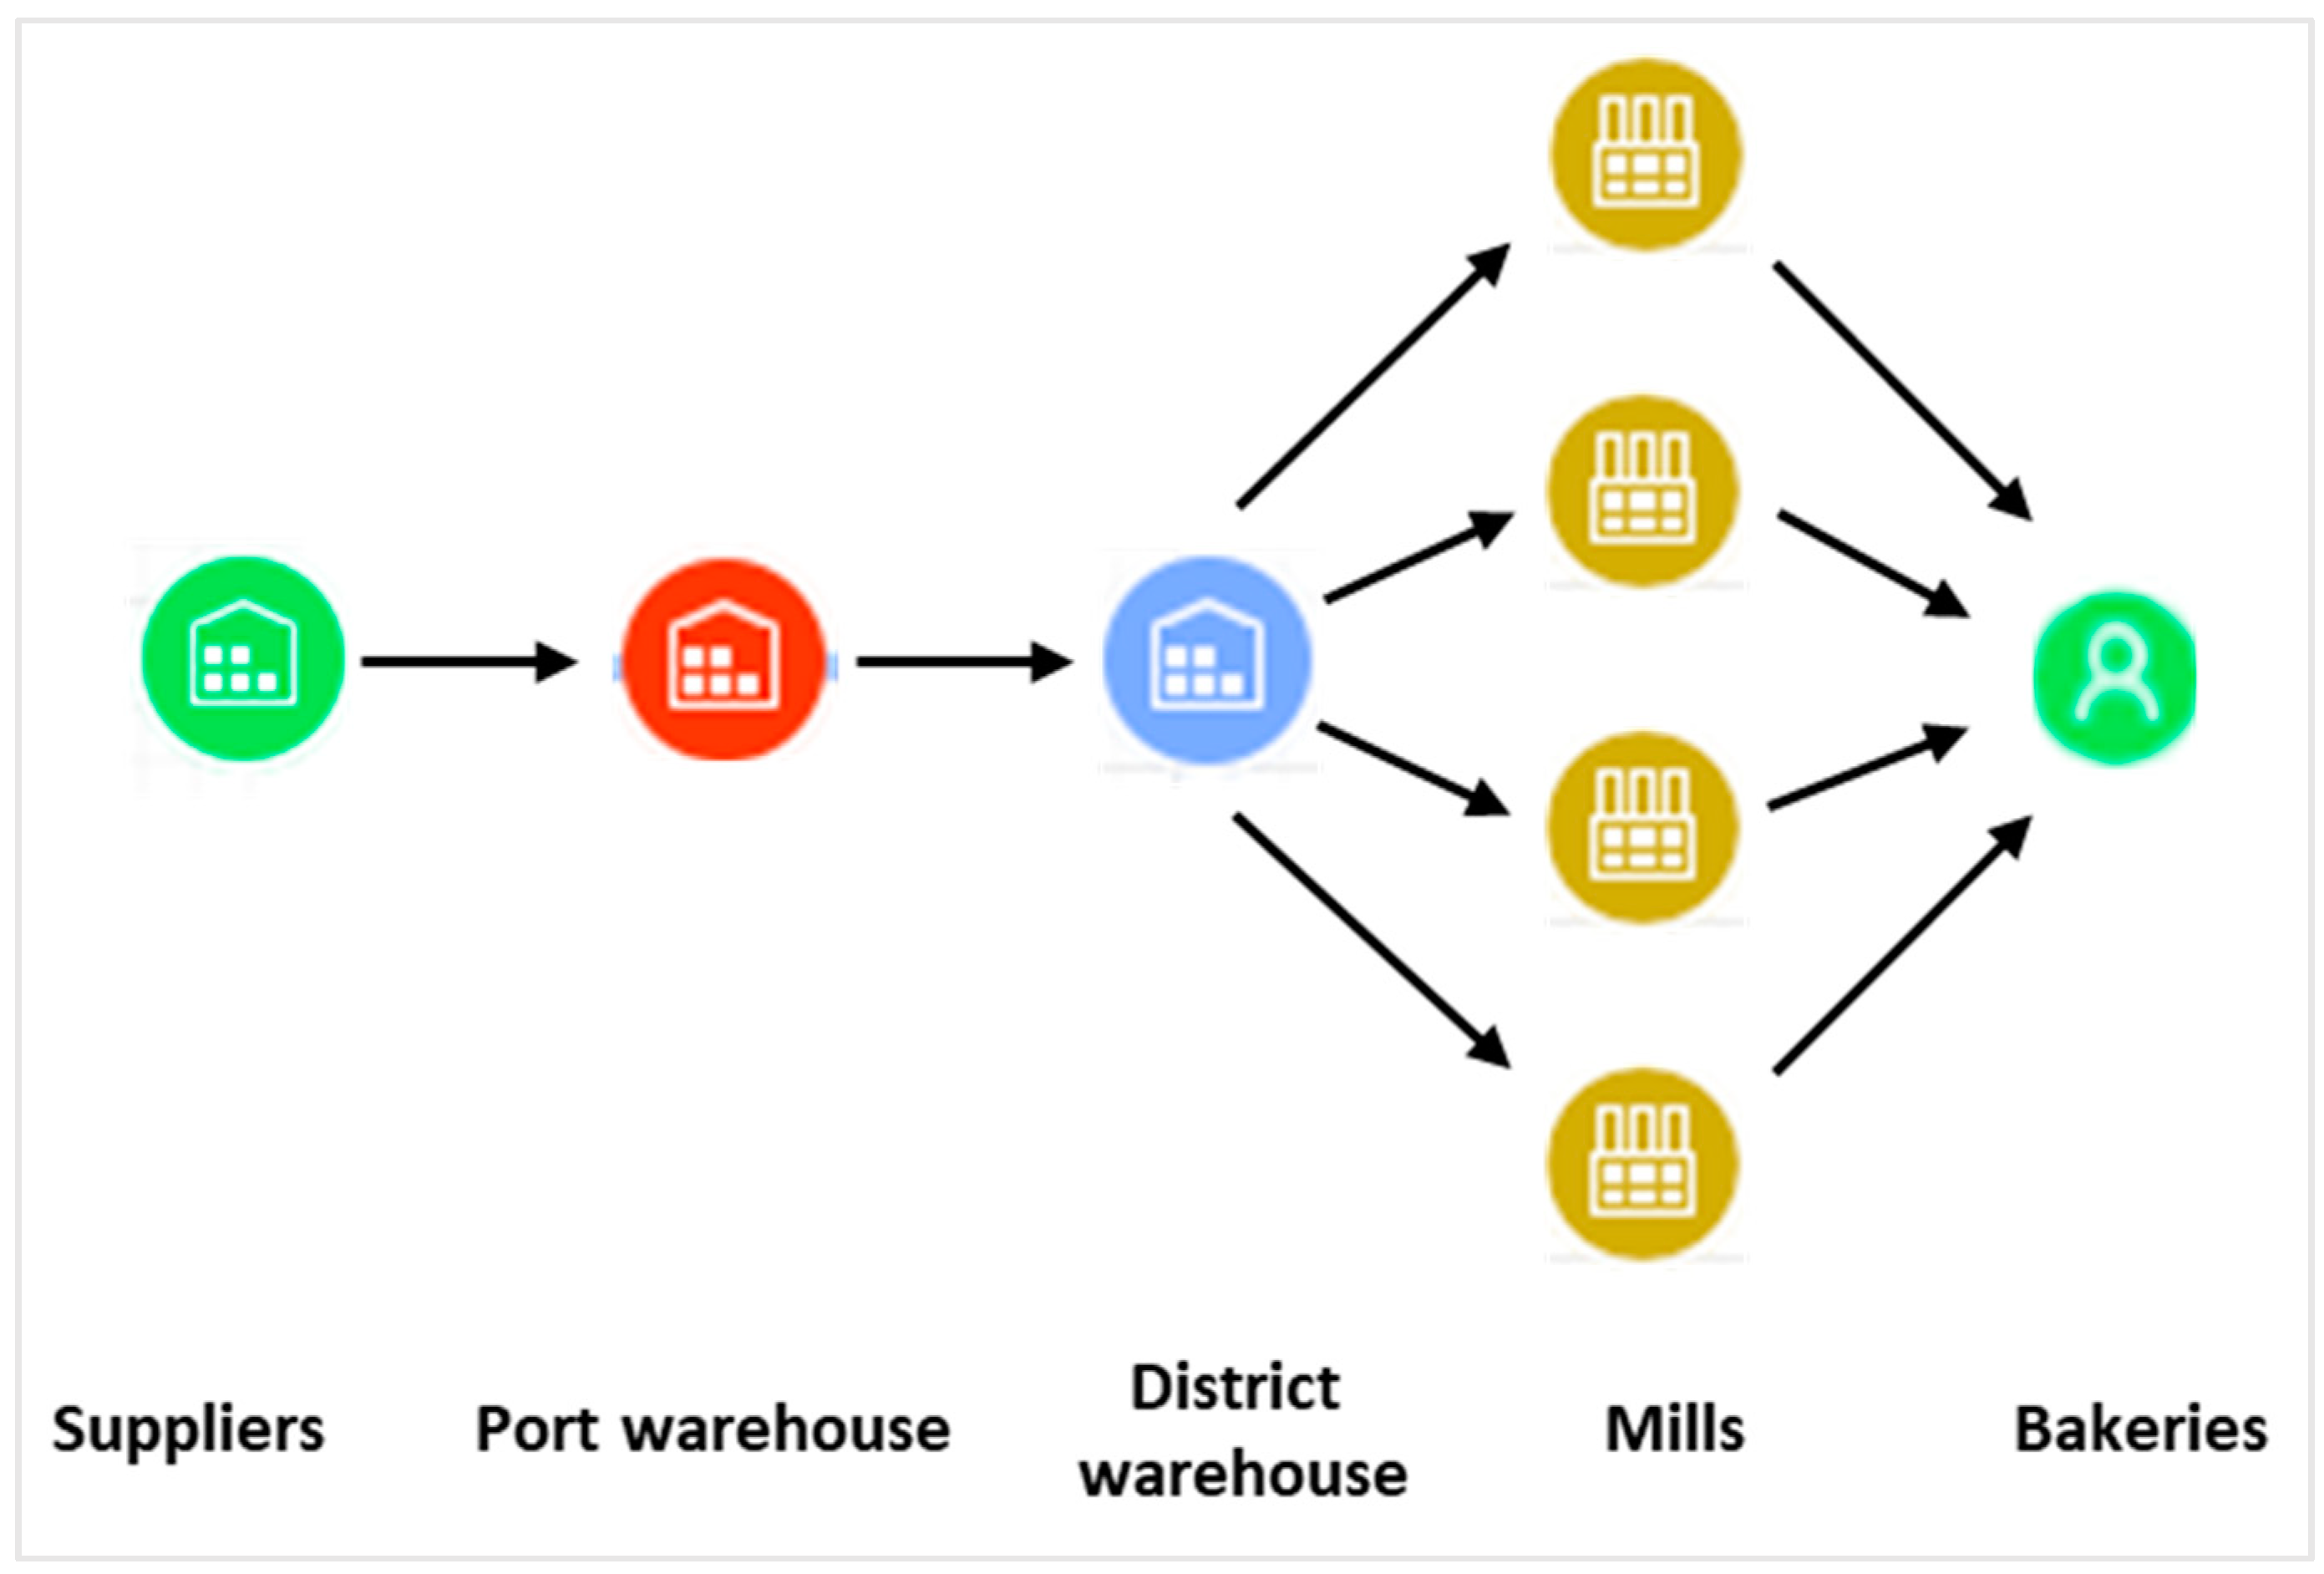
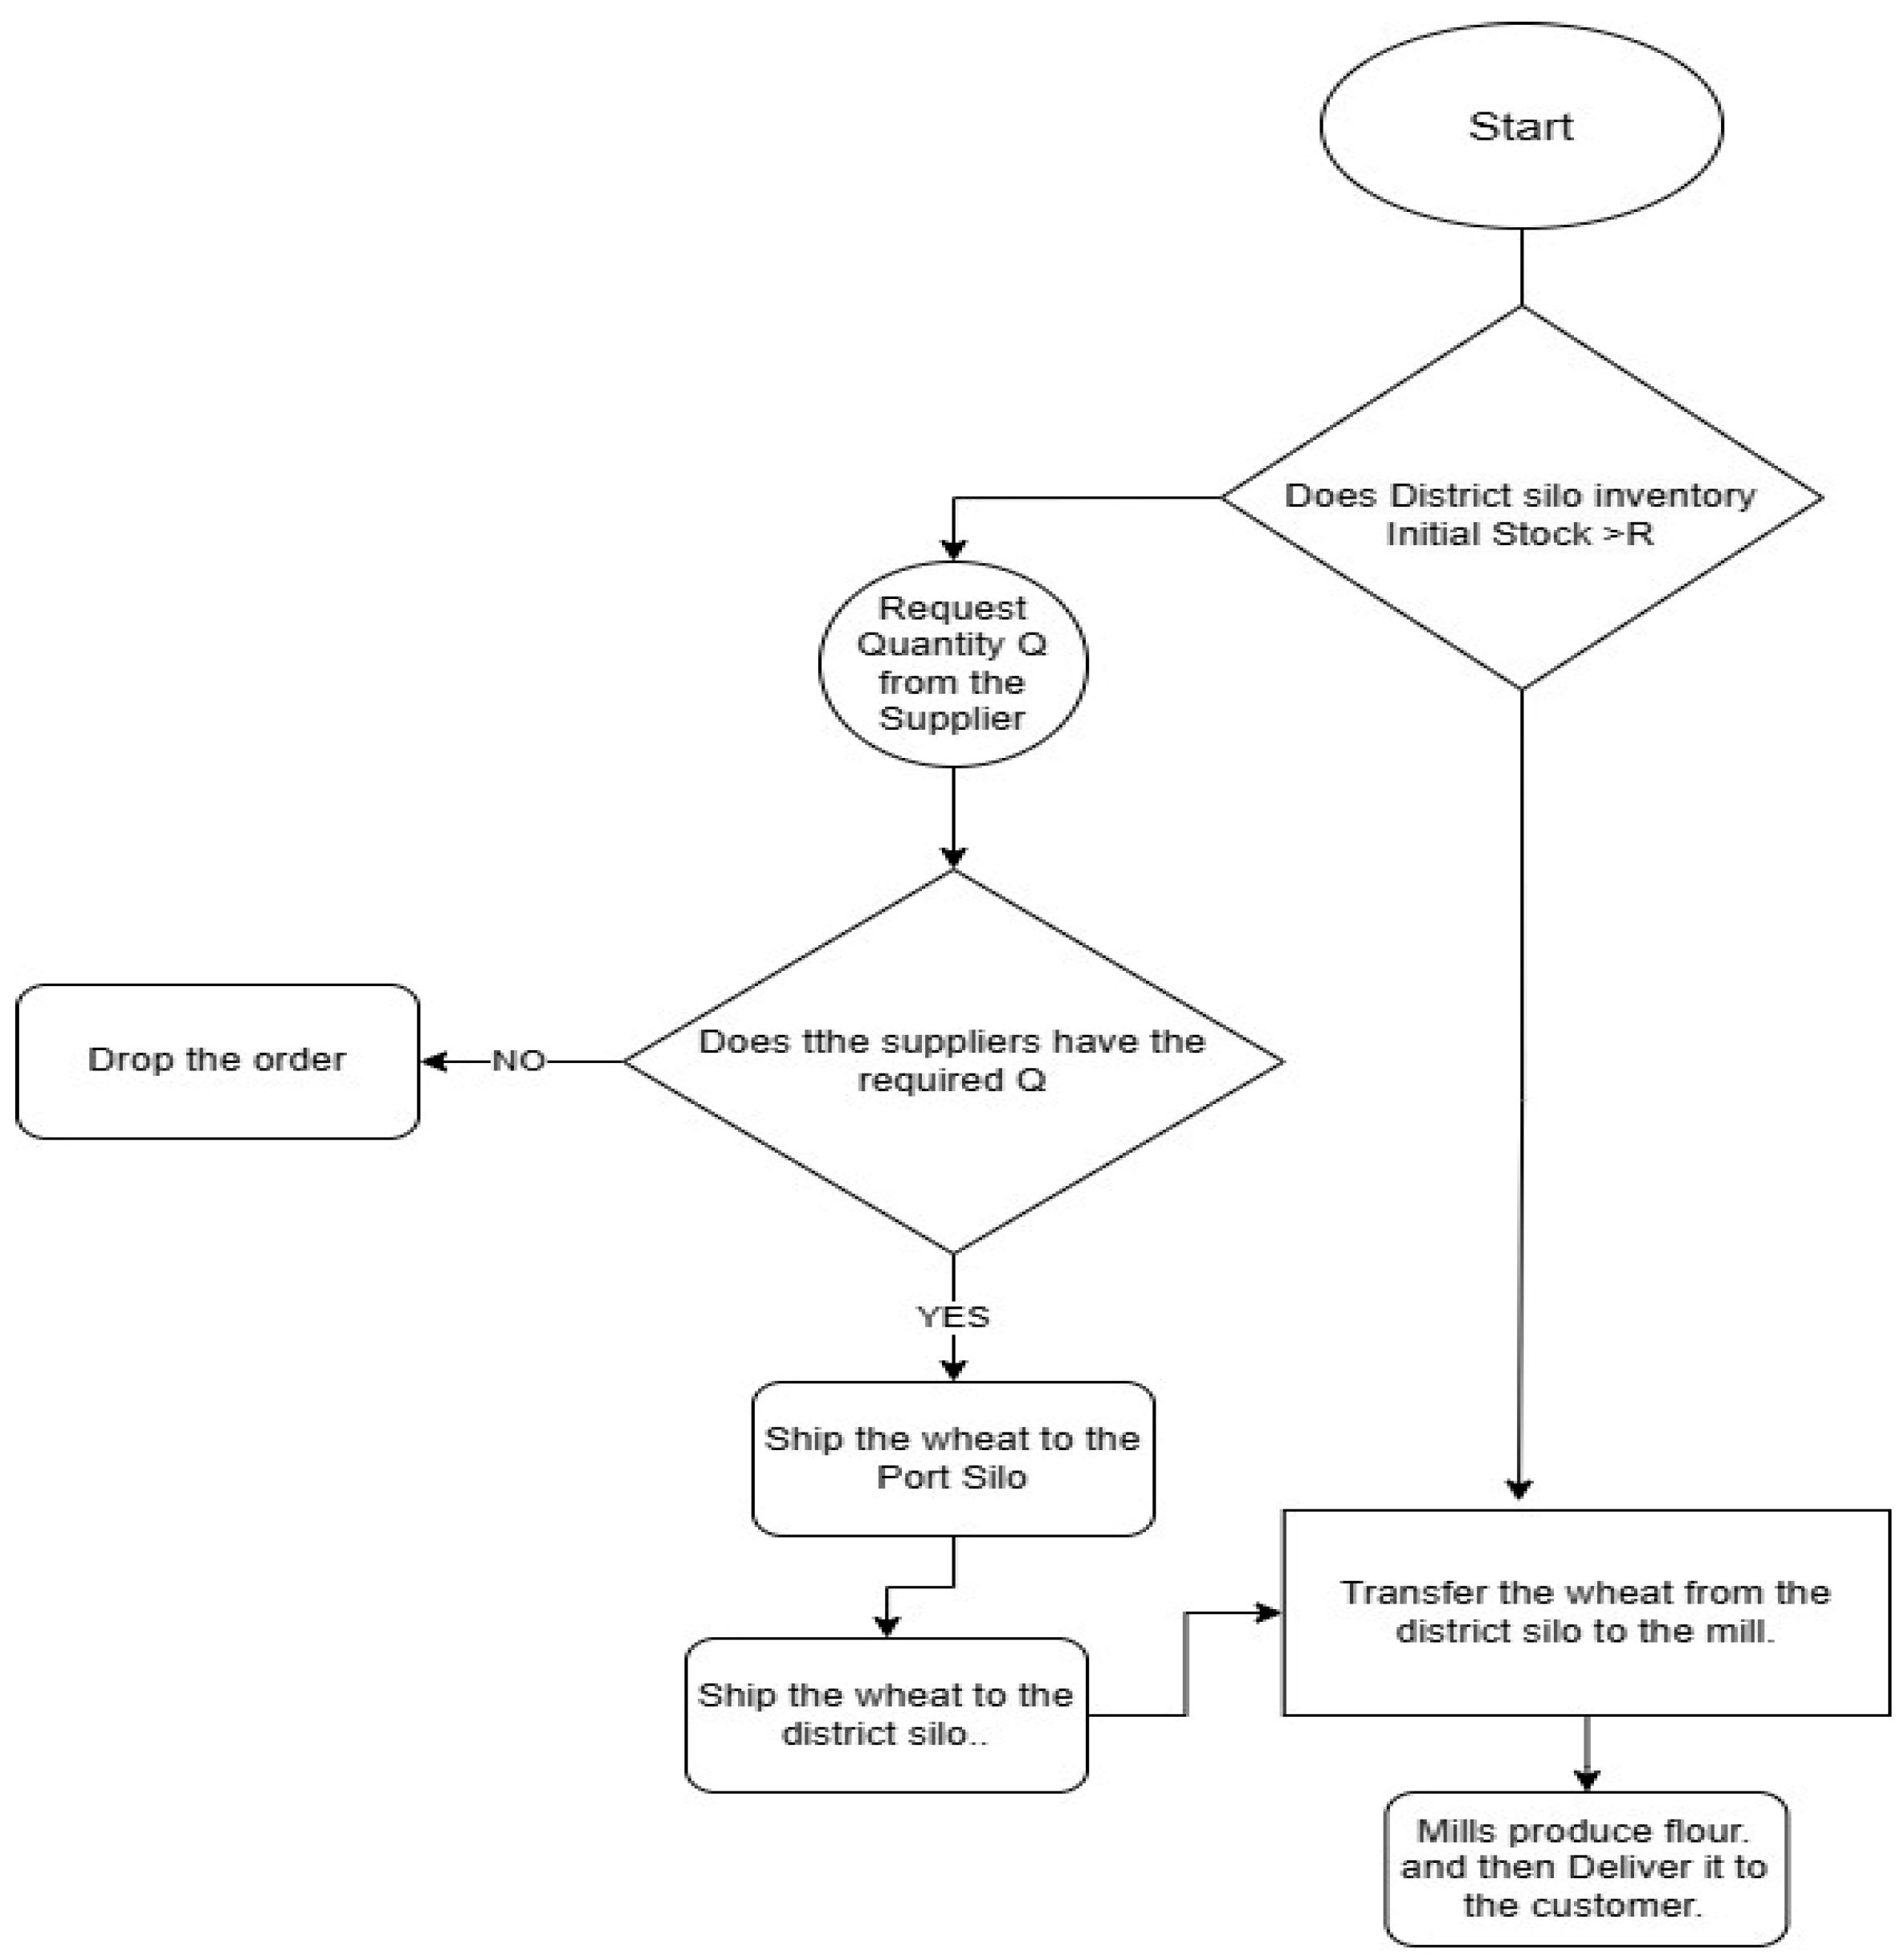
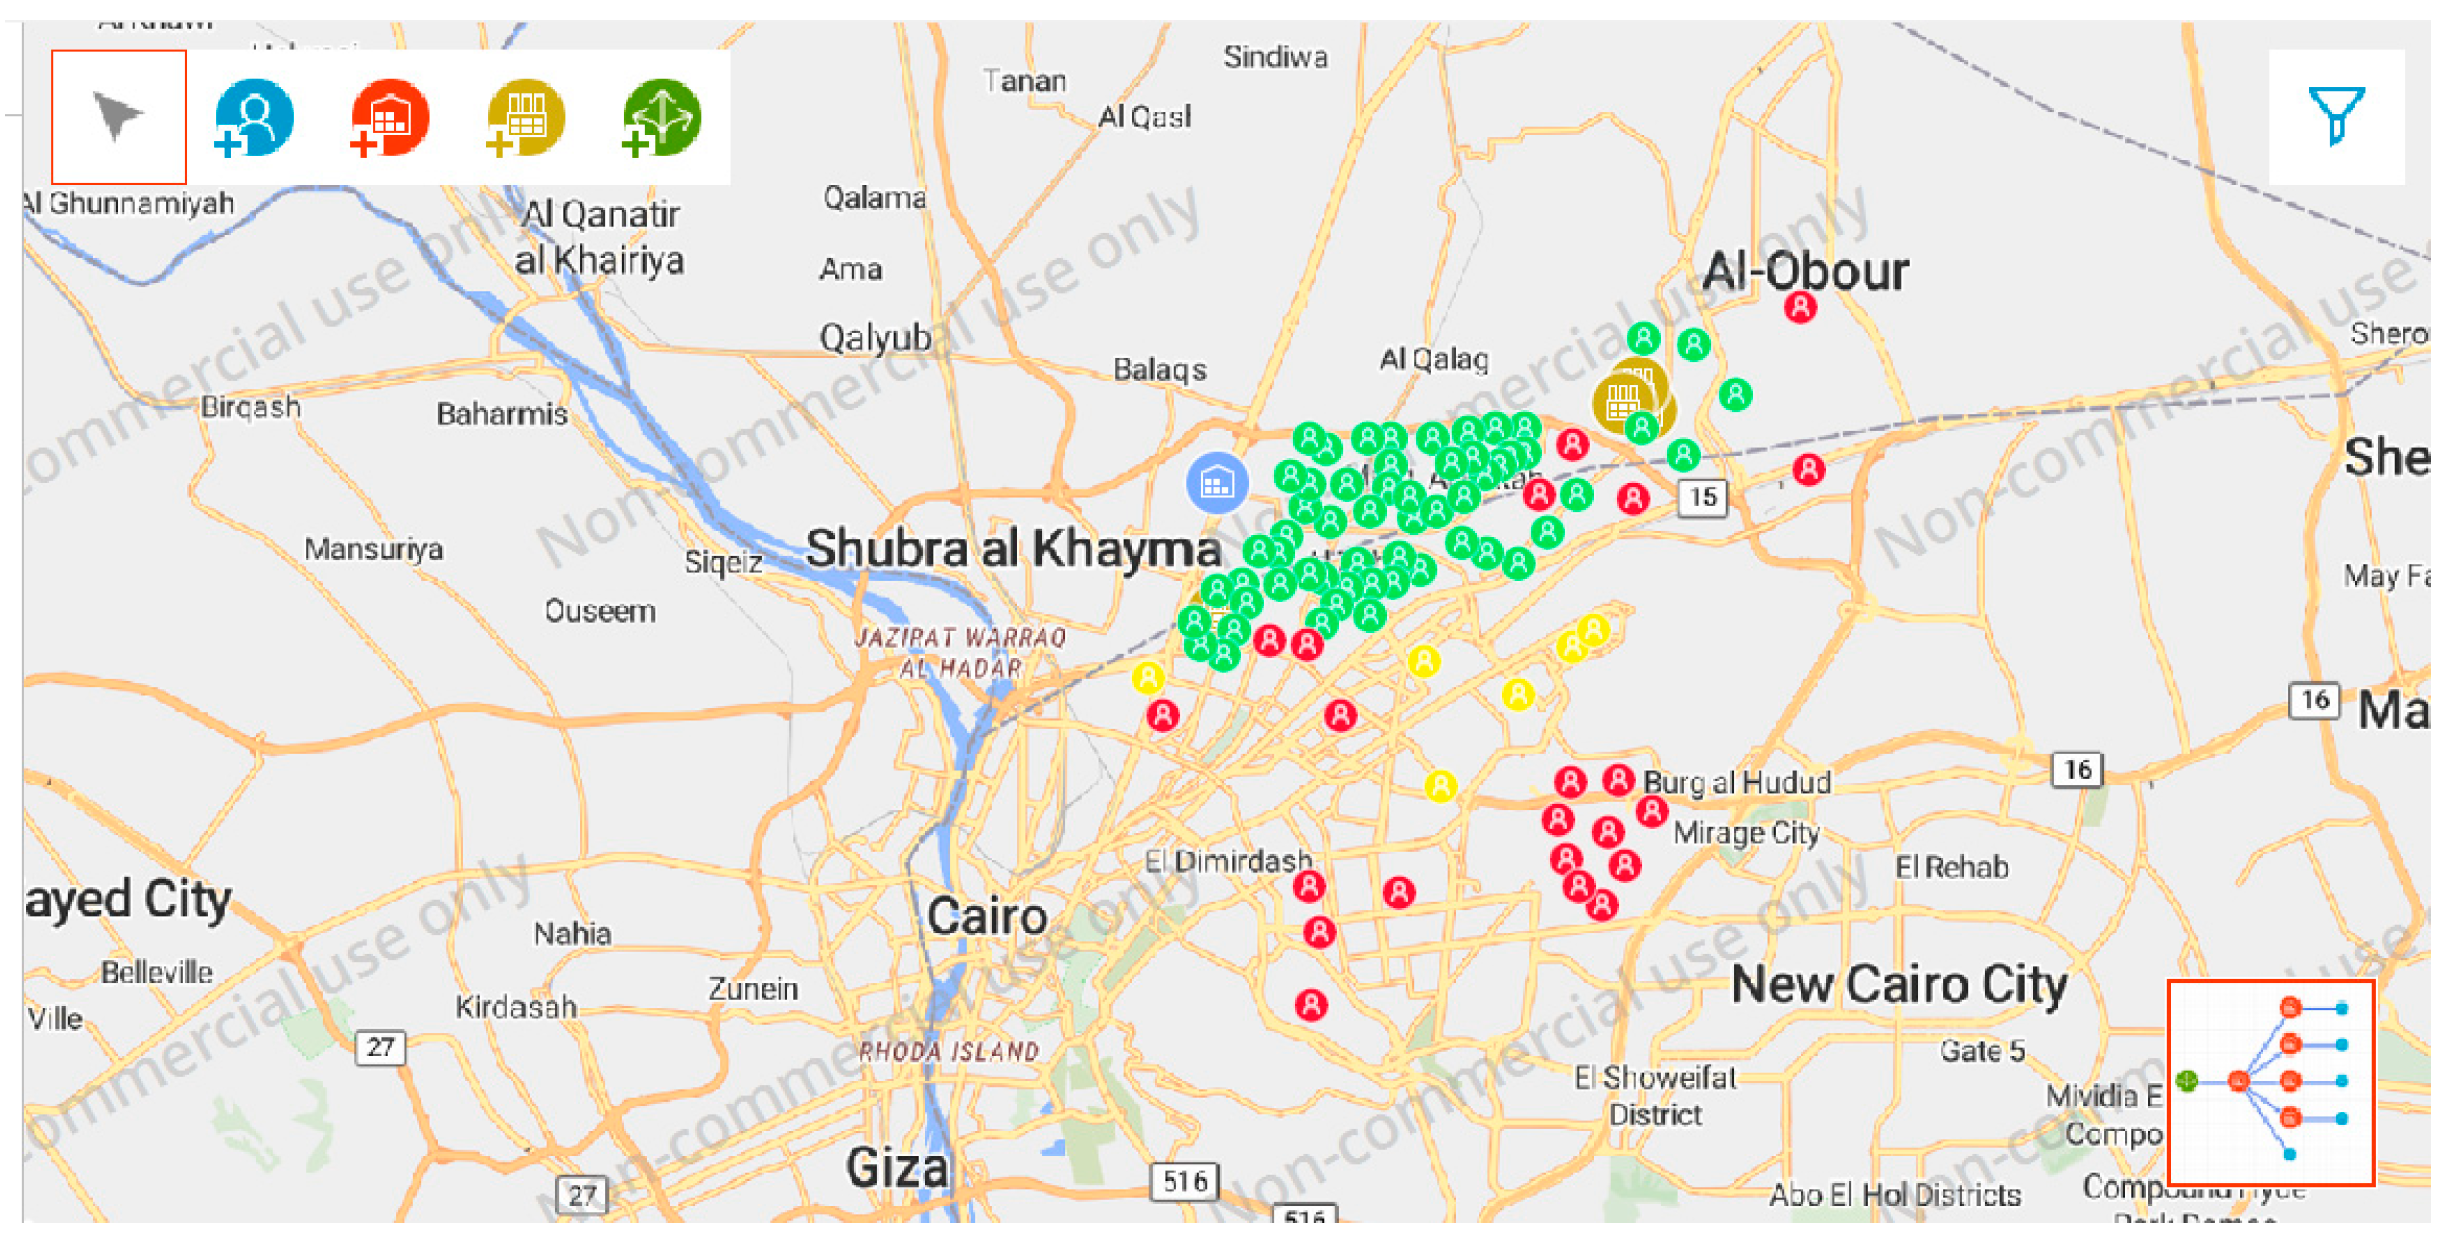
3.1. Problem Structure

The case study addressed in this work simulates one of the most crucial food supply chains in Egypt, which is the one for the Baladi bread. Baladi bread is the number one food for Egyptians. According to the Deputy Minister of Supply and Internal Trade, Egyptians consume on average between 250 million and 275 million loaves per day [47], which makes it a strategic and critical item. The Baladi bread supply chain in Egypt starts at the point of obtaining and inspecting the wheat, which is the main ingredient in making flour. Depending on whether the wheat is domestically available or imported from Russia and Ukraine, the sequence of the operation in the supply chain changes, but the wheat is eventually delivered to the domestic silos to be stored. After that, it is transported to milling factories to be processed into flour then delivered to the bakeries to be transformed into bread [48]. Bread food supply chain stages and the relevant logical operations are shown in Figure 1 and Figure 2, respectively.
Egypt imports 55% of its needs of wheat from many countries. The highest percentage of these suppliers (80%) are from Russia and Ukraine. This percentage presents 12.15 million tons of wheat [49], and the other 45%, that accounts for 8.45 million tons, is produced locally [50]; half of these percentages are used by the government in its bread subsidy program. The quantity of wheat produced domestically is a fixed value input for the local silos. The imported wheat was identified as a limited quantity provided by the suppliers when required according to the inventory policy. It is shipped from suppliers to port warehouses and then transported to the local silos.
Given the vast geographical area of Egypt and the limitations on data availability, it was not feasible to simulate the flour supply chain all over Egypt, hence, the East Cairo region was selected for the case study and modeling. By considering the supply percentages and the population of the East Cairo region, the demand for wheat in this region could be estimated. East Cairo consists of nine districts and has a population of around 3.9 million, which is considered to be 4% of the total population of Egypt [51]. The customers in this network are the bakeries that require flour on a daily basis to make the bread. The customers locations were identified on the map according to the information from the governmental site regarding Cairo [52]. However, due to the high number of bakeries in the East Cairo region, they were modeled as colored clusters of green, yellow, and red. Green represents group of ten bakeries, red represents group of five bakeries, and yellow represents a single bakery. The total number of customers represented on the map is 86 customers. The demand of the customers (bakeries) is set by the government to be between 10 and 20 tons daily [53], varying according to the population the bakery serves and the size of the bakeries. In this model, an average demand of 15 tons of flour is used for each bakery. The offshore suppliers deliver the wheat to Abu Qir port in Alexanderia silo using ships with an average speed of 13Kn and a carrying capacity of 50,000 tons [54,55], then the port silo delivers the wheat to a local silo (Mostorod silo) using trucks. Later, the wheat is delivered from the local silo to factories (mills) and then to the customers (bakeries) via truck, moving at an average speed of 60 km/h. The transportation policy used in the model for the truck system was less than truckload (LTL).

3.2. Simulation Model and Methodology

The anyLogistix software was created by the AnyLogic company (Oak Brook, IL, USA) and is used for supply chain design and modeling [56]; it is also used as an optimization and simulation toolkit to analyze different scenarios in the supply chain. The software can be used to compare different supply chain structures, such as traditional structures and vendor managed inventory (VMI) structures, to determine which is more effective in dealing with transportation disruptions [57]. Computer-based discrete event simulation, such as anyLogistix, is a valuable tool for studying and understanding supply chain disruptions, their causes, and the factors that influence them [58]. The software can also be used to forecast demand for products and determine the expected amount of each product for different cities [59]. Additionally, anyLogistix can be used to study the characteristics and properties of complex logistic systems, such as supply networks, and evaluate the performance of supply chains [60]. The model was created in anyLogistix software through defining the input parameters from location (suppliers, warehouses, factories, and customers), inventory policy, demand, sourcing, shipment control polices, and disruption events. Table 1 shows the control policies used in this simulation.
To model the disruptions caused by the COVID-19 pandemic and the Russian–Ukrainian war on the Baladi bread supply chain, three scenarios were created to simulate the events that might have occurred during these periods.

3.2.1. Scenario 1 (Initial State–Normal Conditions)

  • Transportation time from source to port warehouse is 15 days.
  • Transportation time from factories to customers is 15 min according to geographic location.

3.2.2. Scenario 2 (COVID-19)

  • Transportation time from source to port warehouse increased by 40% [61].
  • Transportation time from factories to their customers is 30 min according to geographic location. This was mainly due to the multiple health checkpoints on the roads as a prevention technique against the pandemic.
  • Pandemic highest peaks occurred between May and the end of July 2020. During this time the country went into a state of lock down.
  • The lockdown was lifted in August 2020, and the demand increased by 50% due to fear and panic buying.
Figure 3 gives the description of Scenario 2.

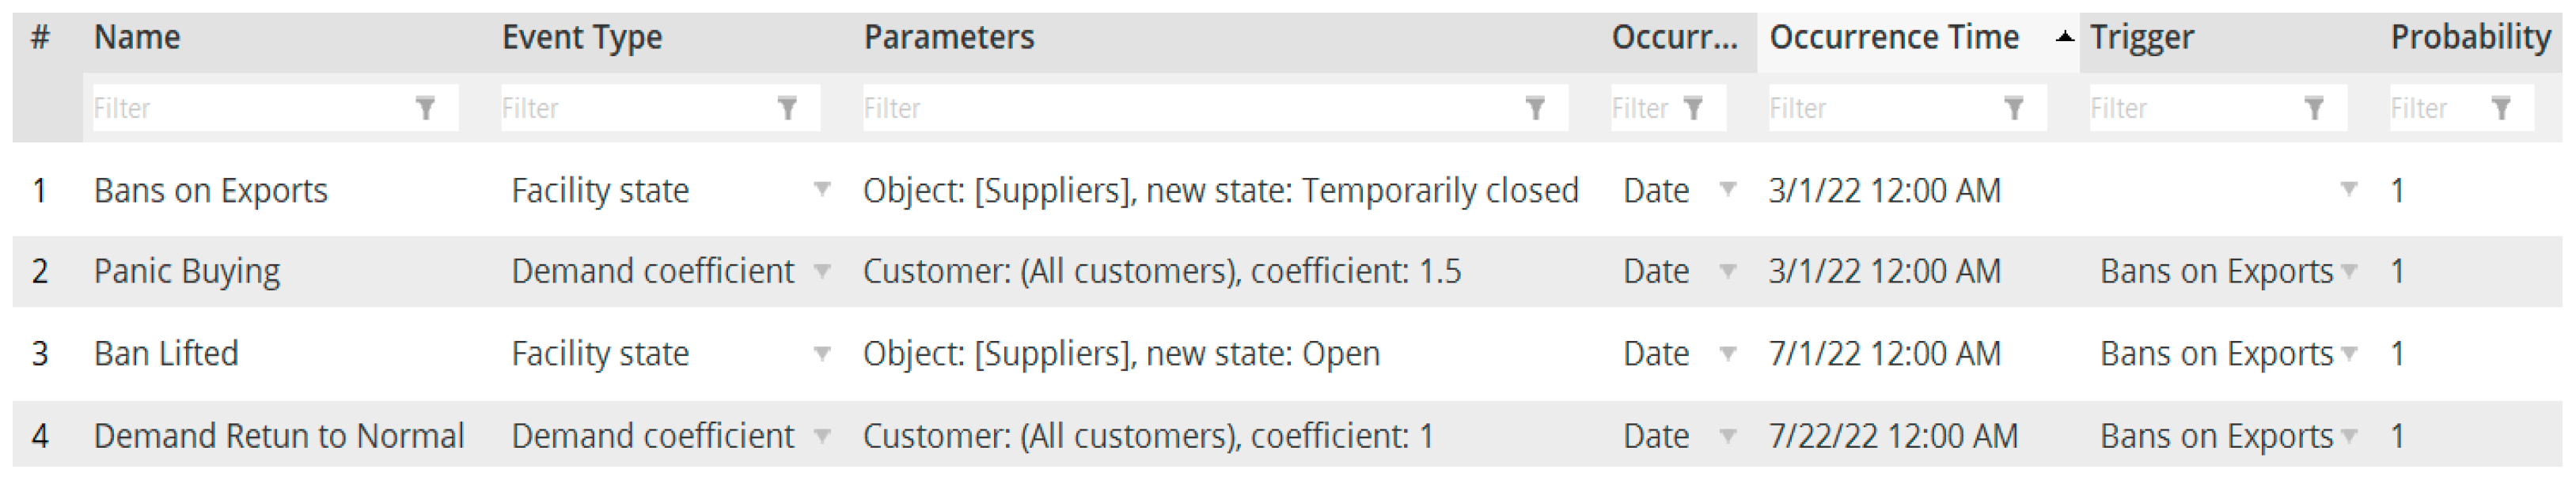
3.2.3. Scenario 3 (The Russian–Ukrainian War)

The sources have been disrupted since the start of the war in February 2022 until July as Russia restricted its wheat exports from March to June 2022 and Ukraine was not available for exporting until July 2022. The ban was lifted in July when both parties signed a deal to allow wheat transportation. The demand increased by 50% during the absence of suppliers. Gradually, the supply chain started to return to normal regarding the demand and the imports. Figure 4 gives the description of Scenario 3.

4. Results and Analysis

This section discusses the simulation results and analysis of the experimental data. Figure 5 shows the location of Egypt and the studied region (East Cairo). Figure 6 shows the Baladi bread supply chain network, indicating the locations of suppliers, silos, mills, and customers. The simulation scenarios test the impact that different events between 2020 and 2022, due to the COVID-19 outbreak and the Russian–Ukrainian war, have had on the Baladi bread supply chain in Egypt. This research mainly focuses on upstream disruption and its effect on the downstream. Some key performance indicators (KPIs) were selected to assess, analyze, and compare the outputs of each scenario on the performance and operation of the food supply chain; these KPIs include customer performance indicators such as service level by product, which is the ratio of products delivered on time to the overall number of products shipped to the customer from stock on hand. If products are delivered within the pre-defined time windows and the lead time, it is considered on-time delivery. Other KPIs are the delivery time for the ordered products as indicated by the lead time demand backlog that indicates the accumulation of unfulfilled demand, operational indicators such as average daily available inventory in the mills, and on-hand inventory of wheat in the silos.

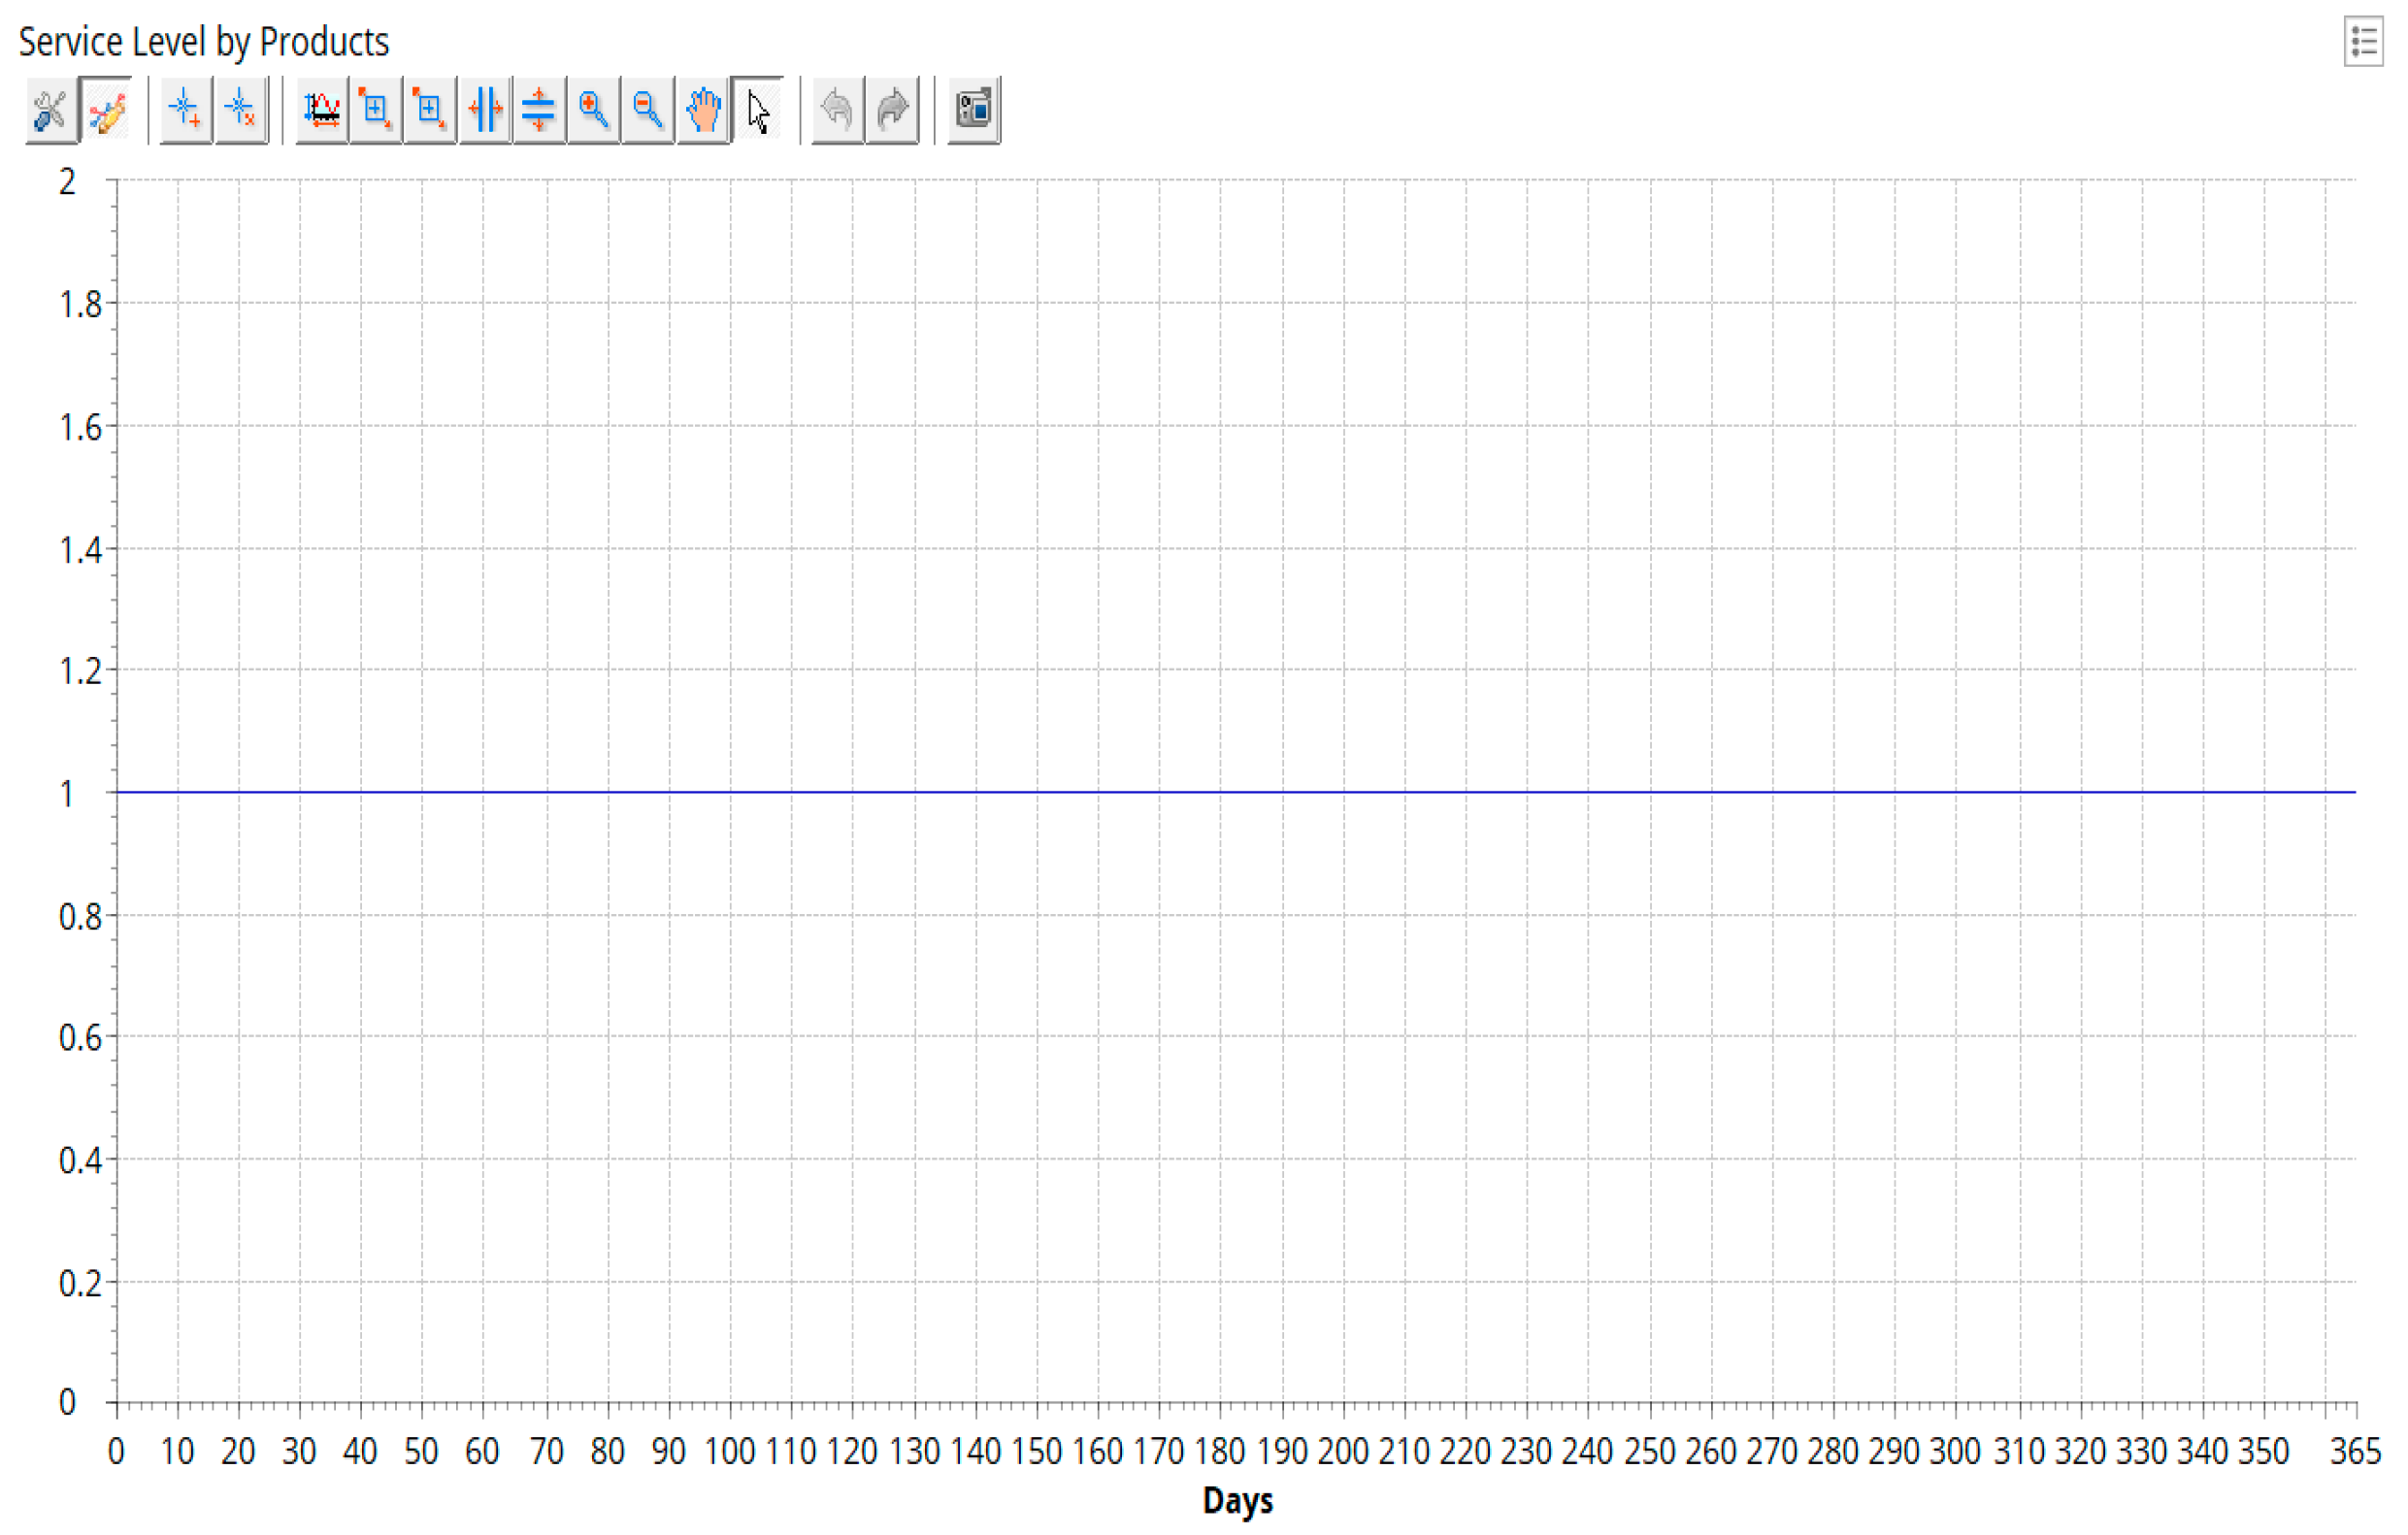
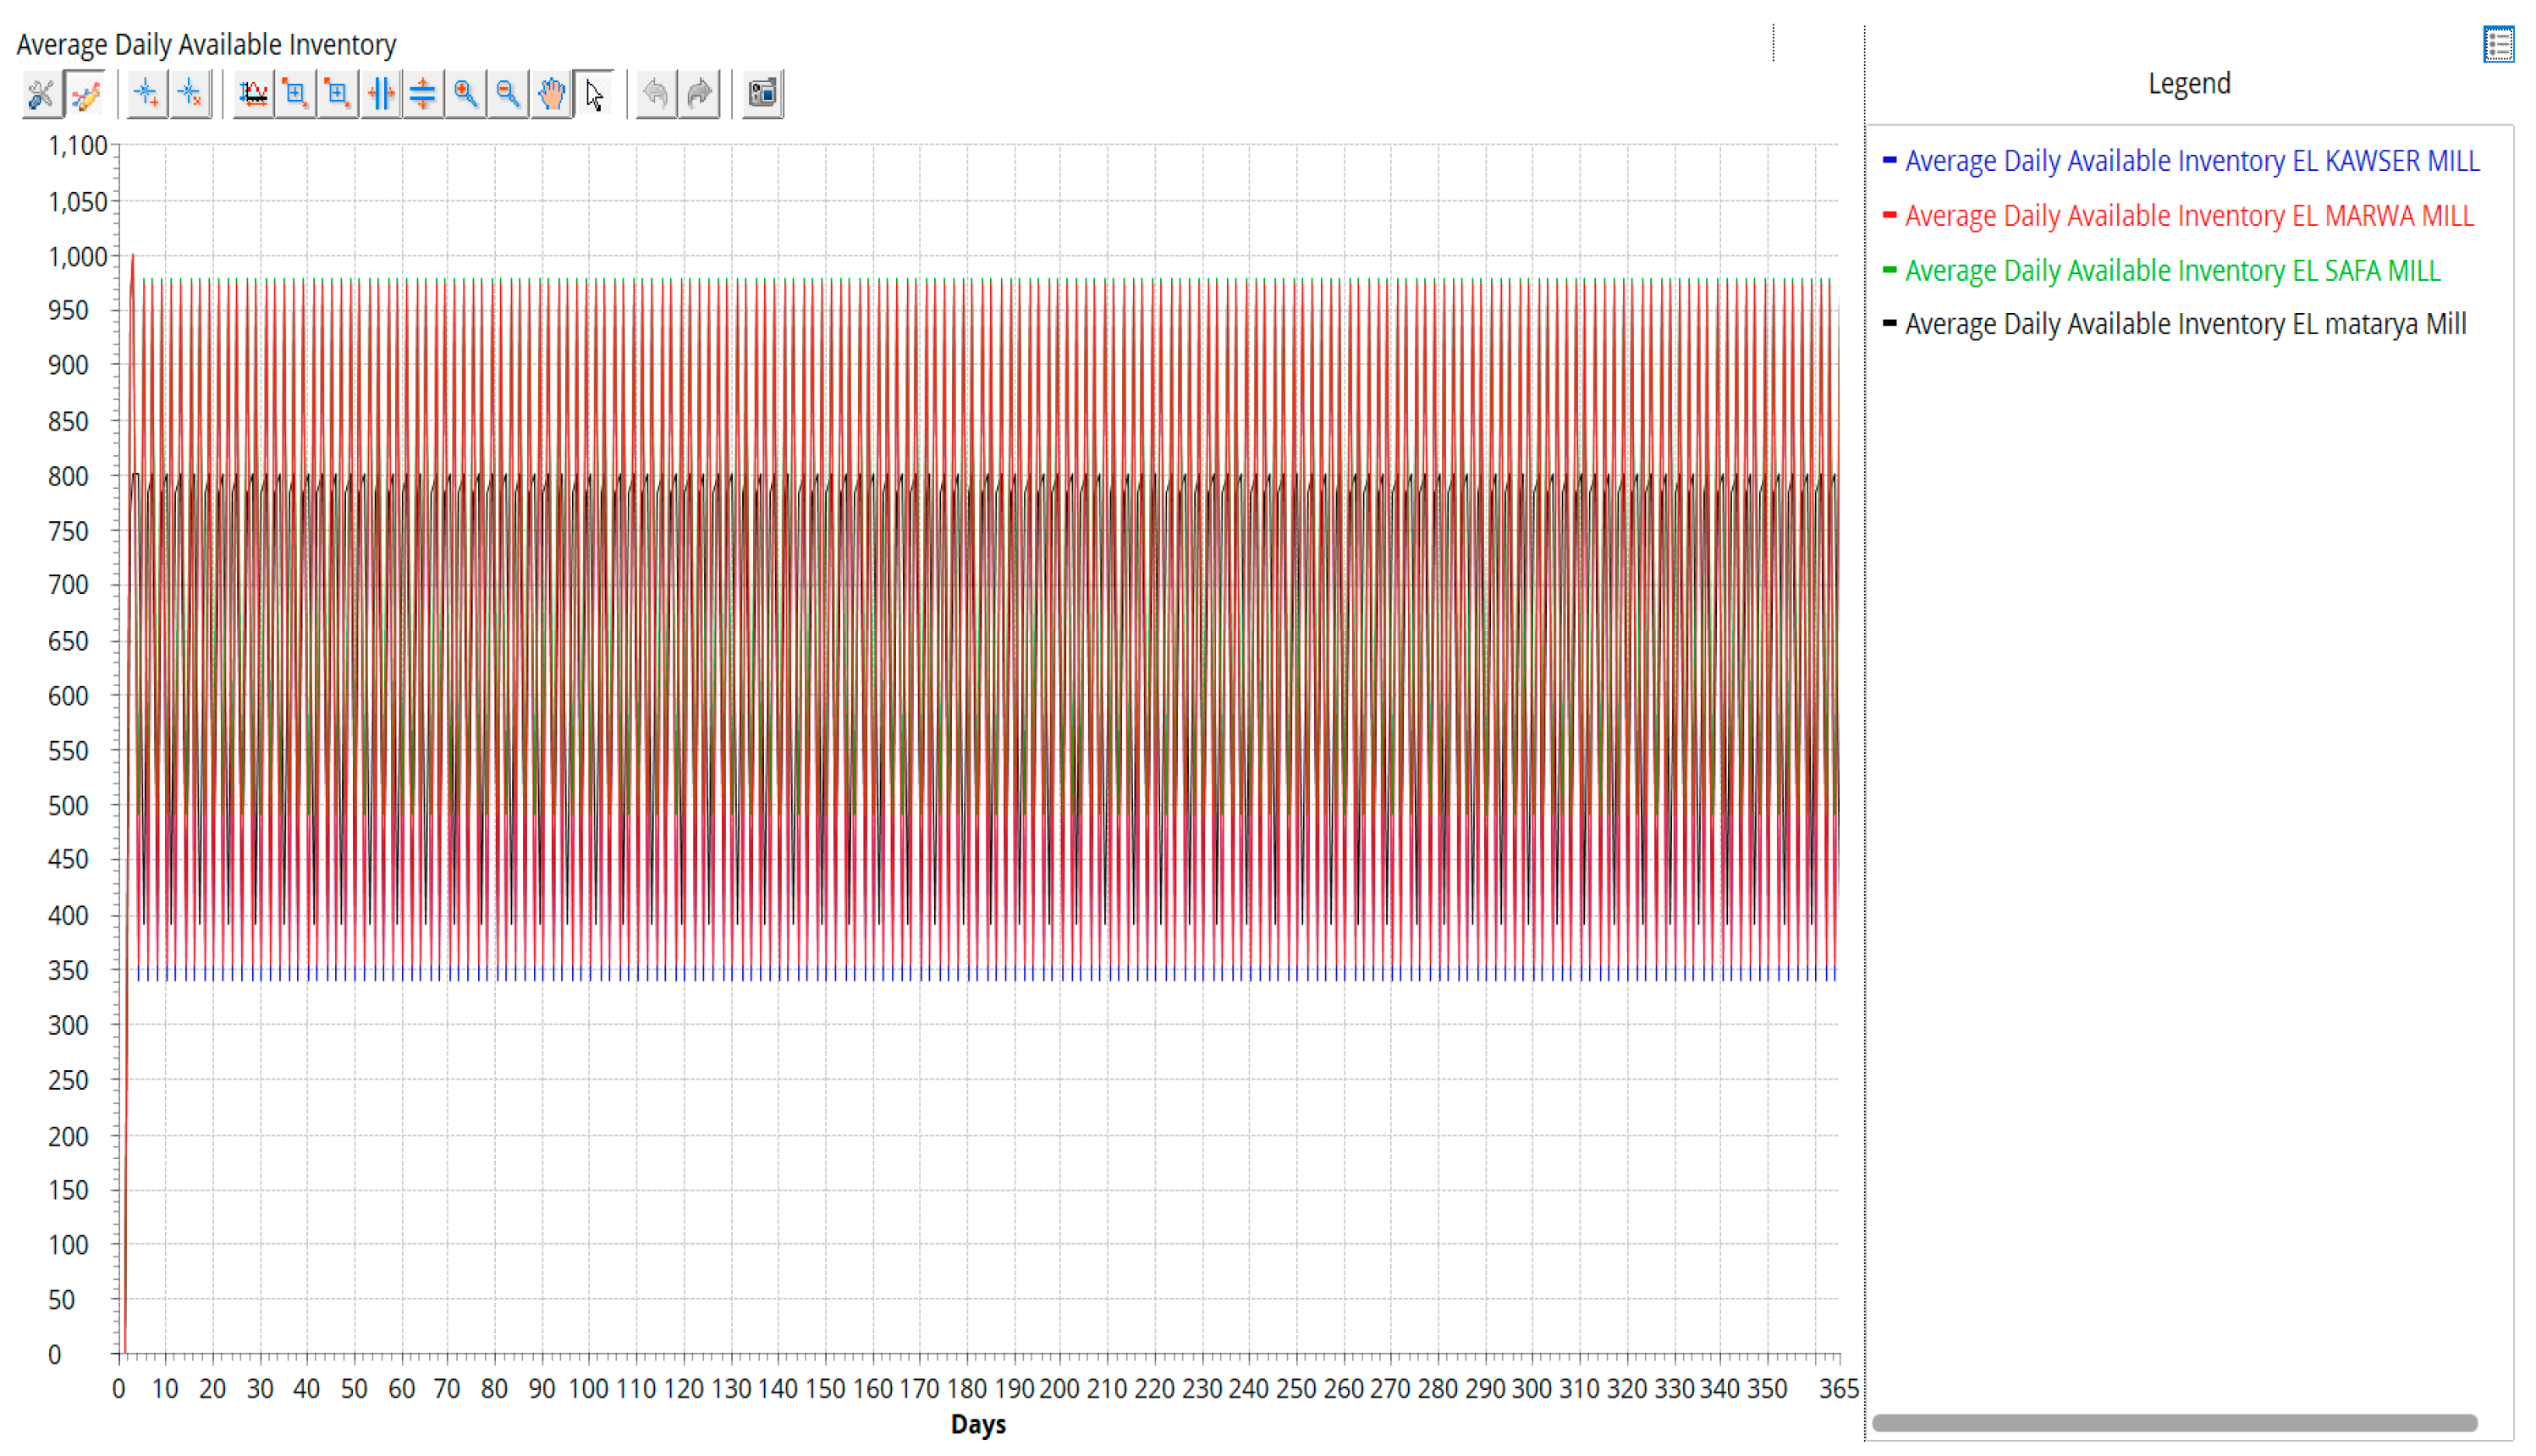
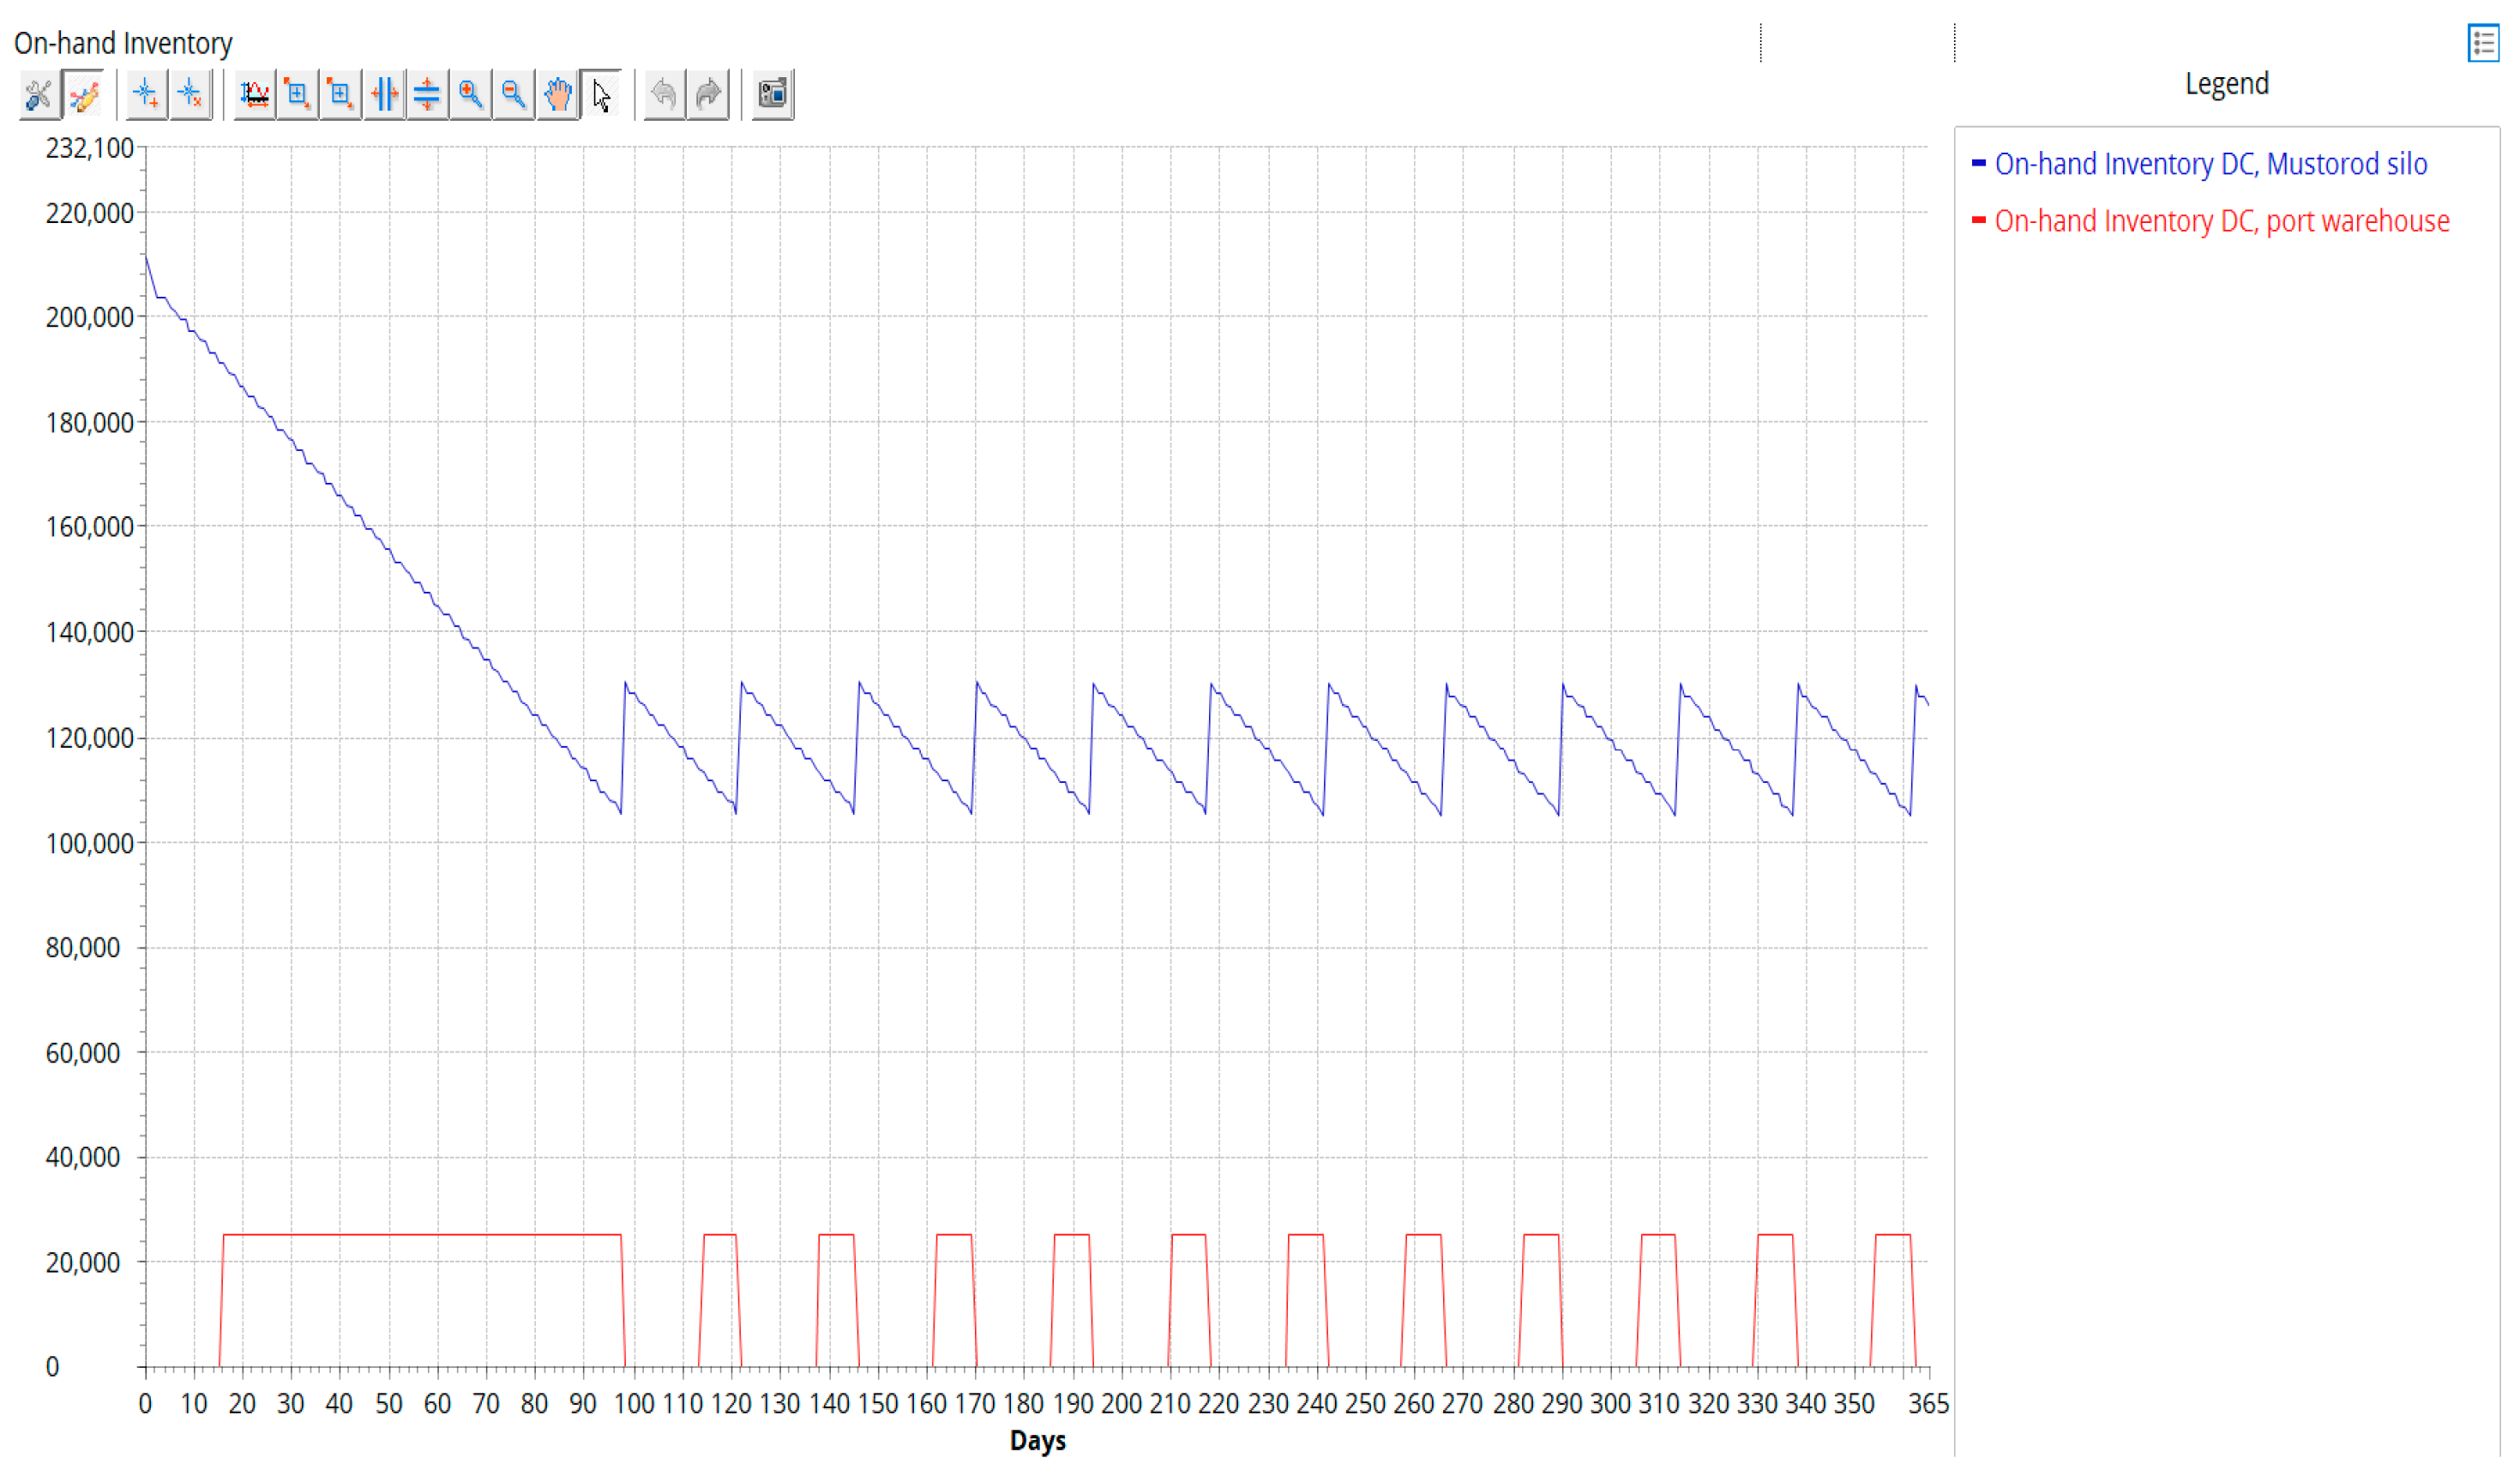
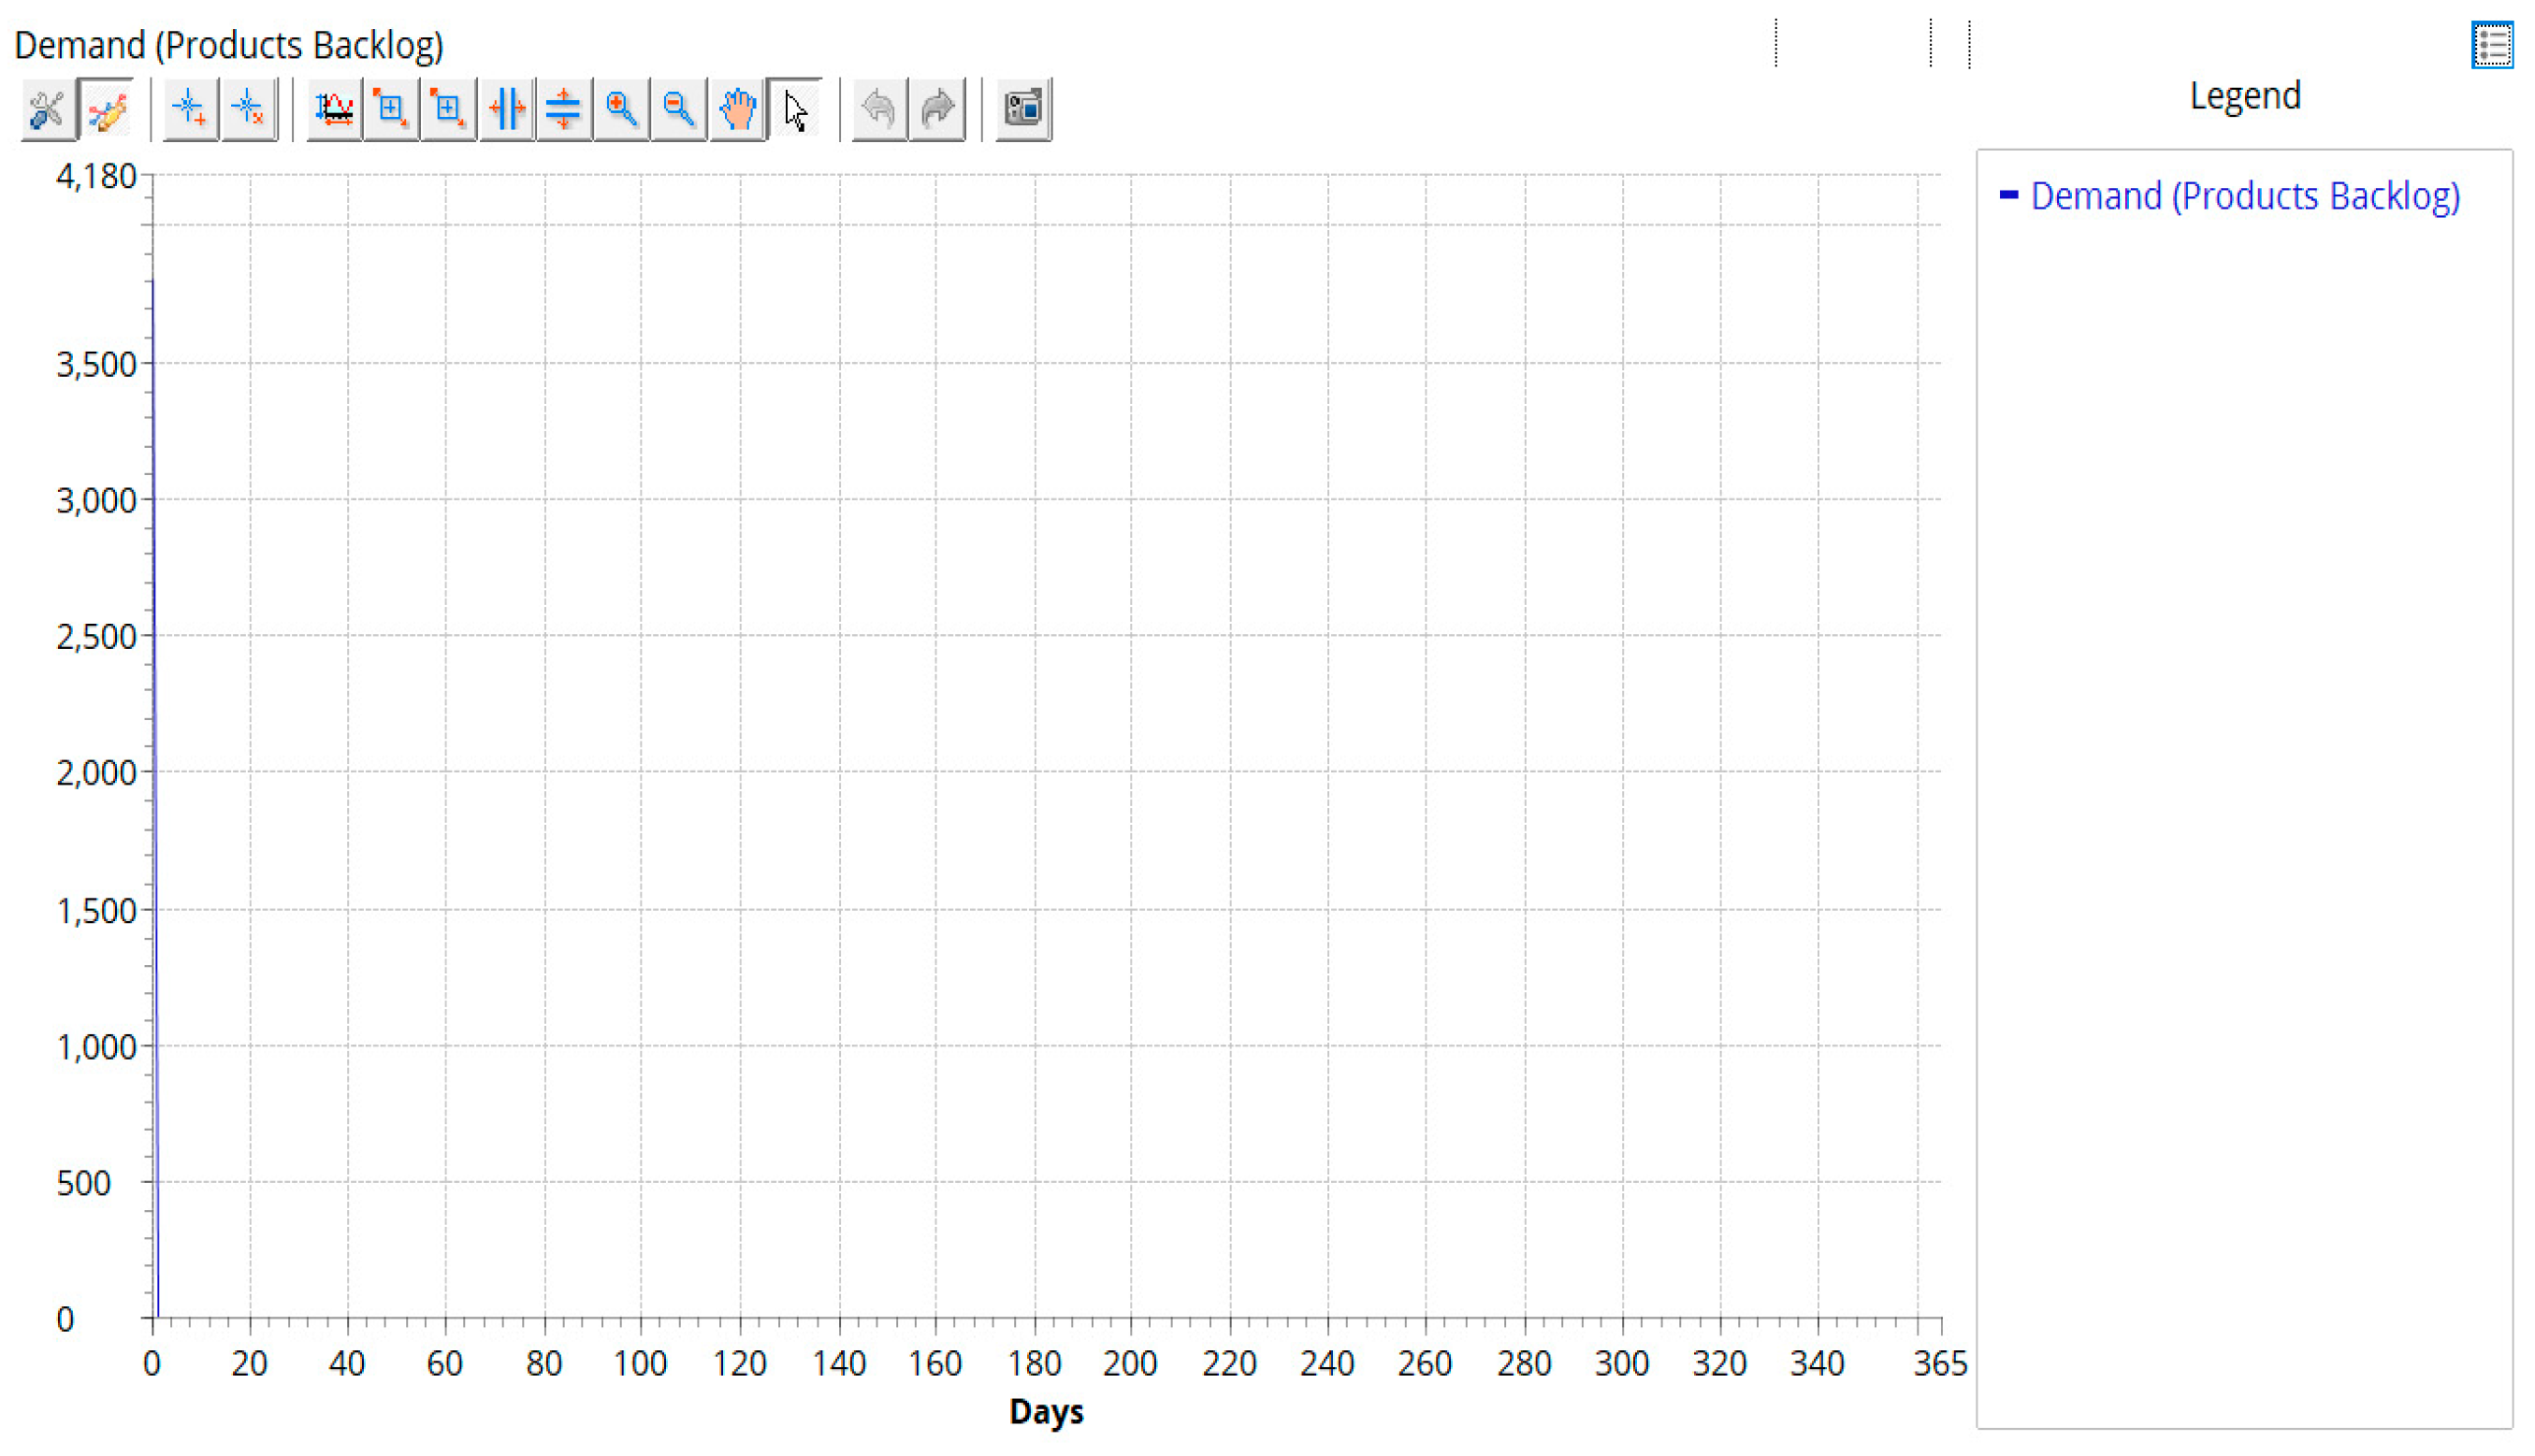
4.1. Scenario 1 (Initial State–Normal Conditions)

This scenario describes the supply chain of Baladi bread in Egypt before the COVID-19 pandemic. In this scenario, real-life data was used to simulate and extract the results related to the SC performance. Figure 7, Figure 8, Figure 9 and Figure 10 present the simulation results for this scenario. From Figure 7, the service level by product shows that all orders were received on time without significant delays. The average lead time for delivery of the products is 0.56 days. Figure 8 shows the inventory levels of available inventory of wheat in all the mills; (s, S) inventory policy is used. When wheat level reaches the minimum re-order point (s), an order is placed from the local material silo to get the inventory level back up to a pre-specified point (S). This policy is effective especially in situations with fluctuating demand as it avoids excessive levels of inventory and avoids stockout [62]. The results show that the available daily inventory for each mill is within the specified (s, S) range and no pattern is observed, indicating adequate stock availability. Moreover, the inventory does not reach zero at any day within the year, which ensures that the mills satisfy the demand of the bakeries with no stockouts. The on-hand inventory shown in Figure 9 indicates no disruptions. When the domestic supply of wheat reaches a certain point of 130,000 ton, the silos request a refill from the supplier, and when it reaches the port warehouse then it is delivered to the district warehouse. Product backlog is shown in Figure 10; the product backlog is zero except for a peak in the first two days due to the simulation warm up. This peak can be eliminated naturally by introducing a safety stock of flour for the first two days. Overall, the results presented indicate that all orders are delivered on time, and the demand is satisfied.

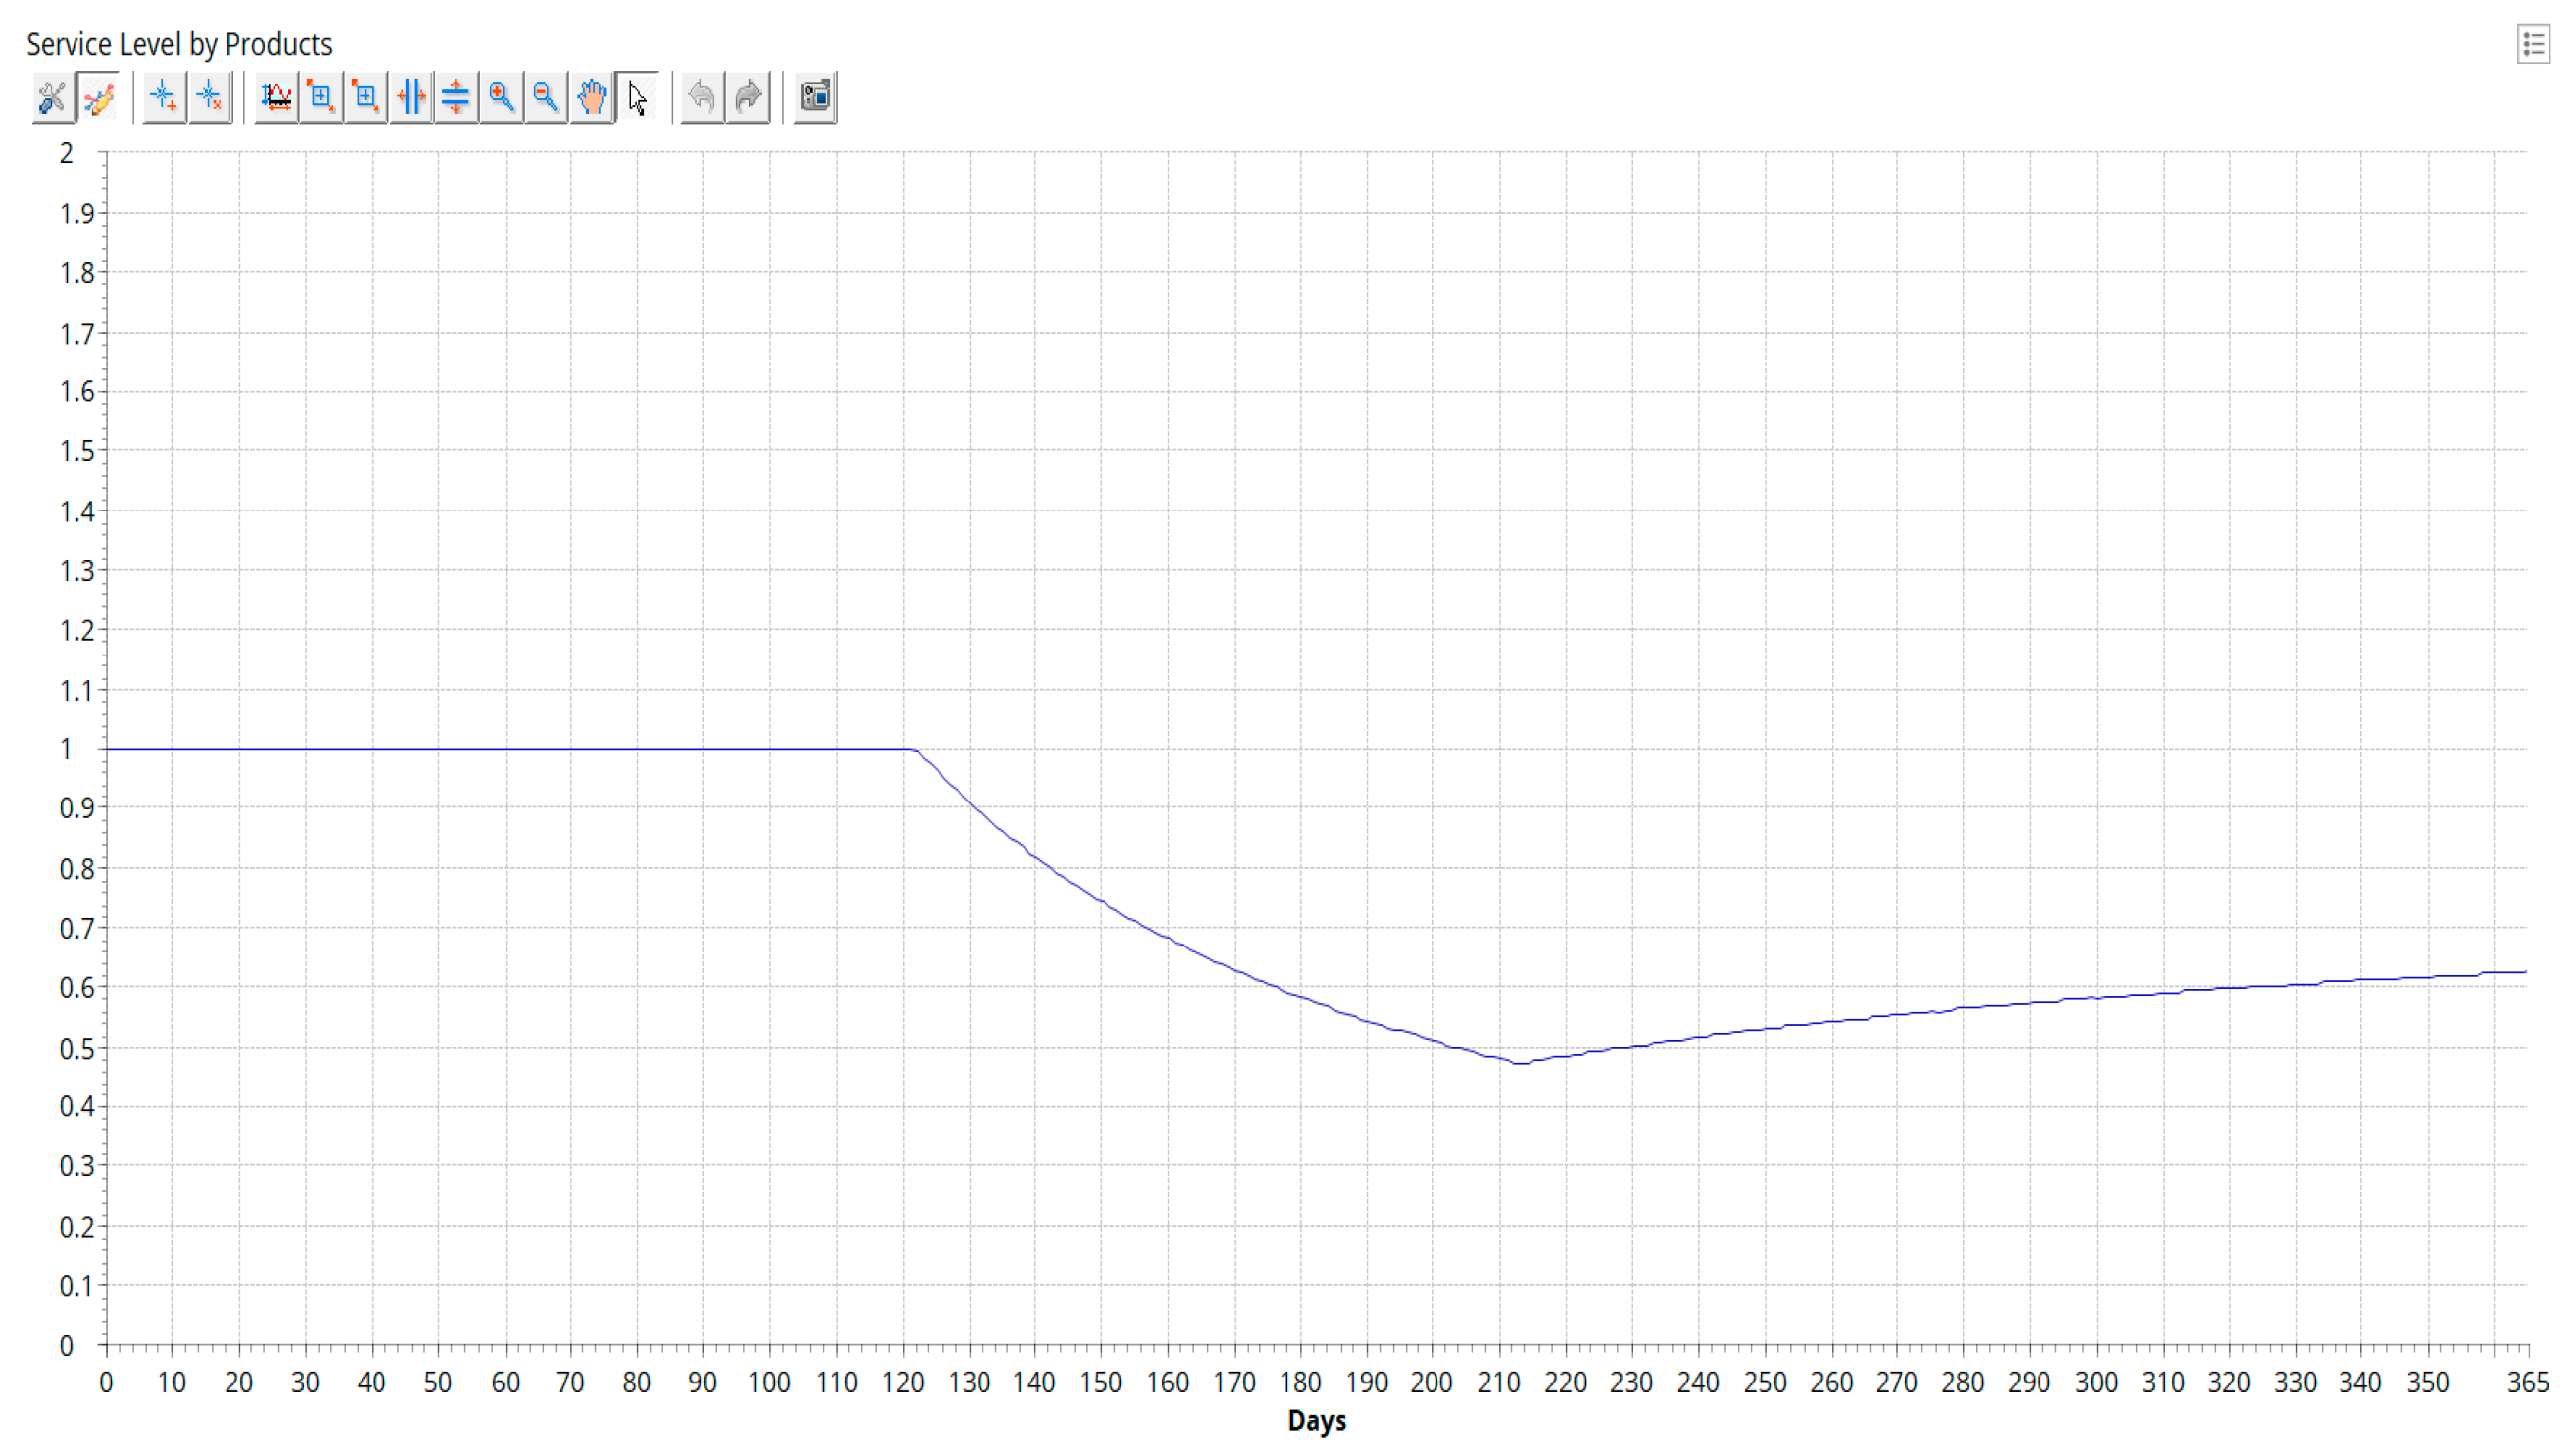
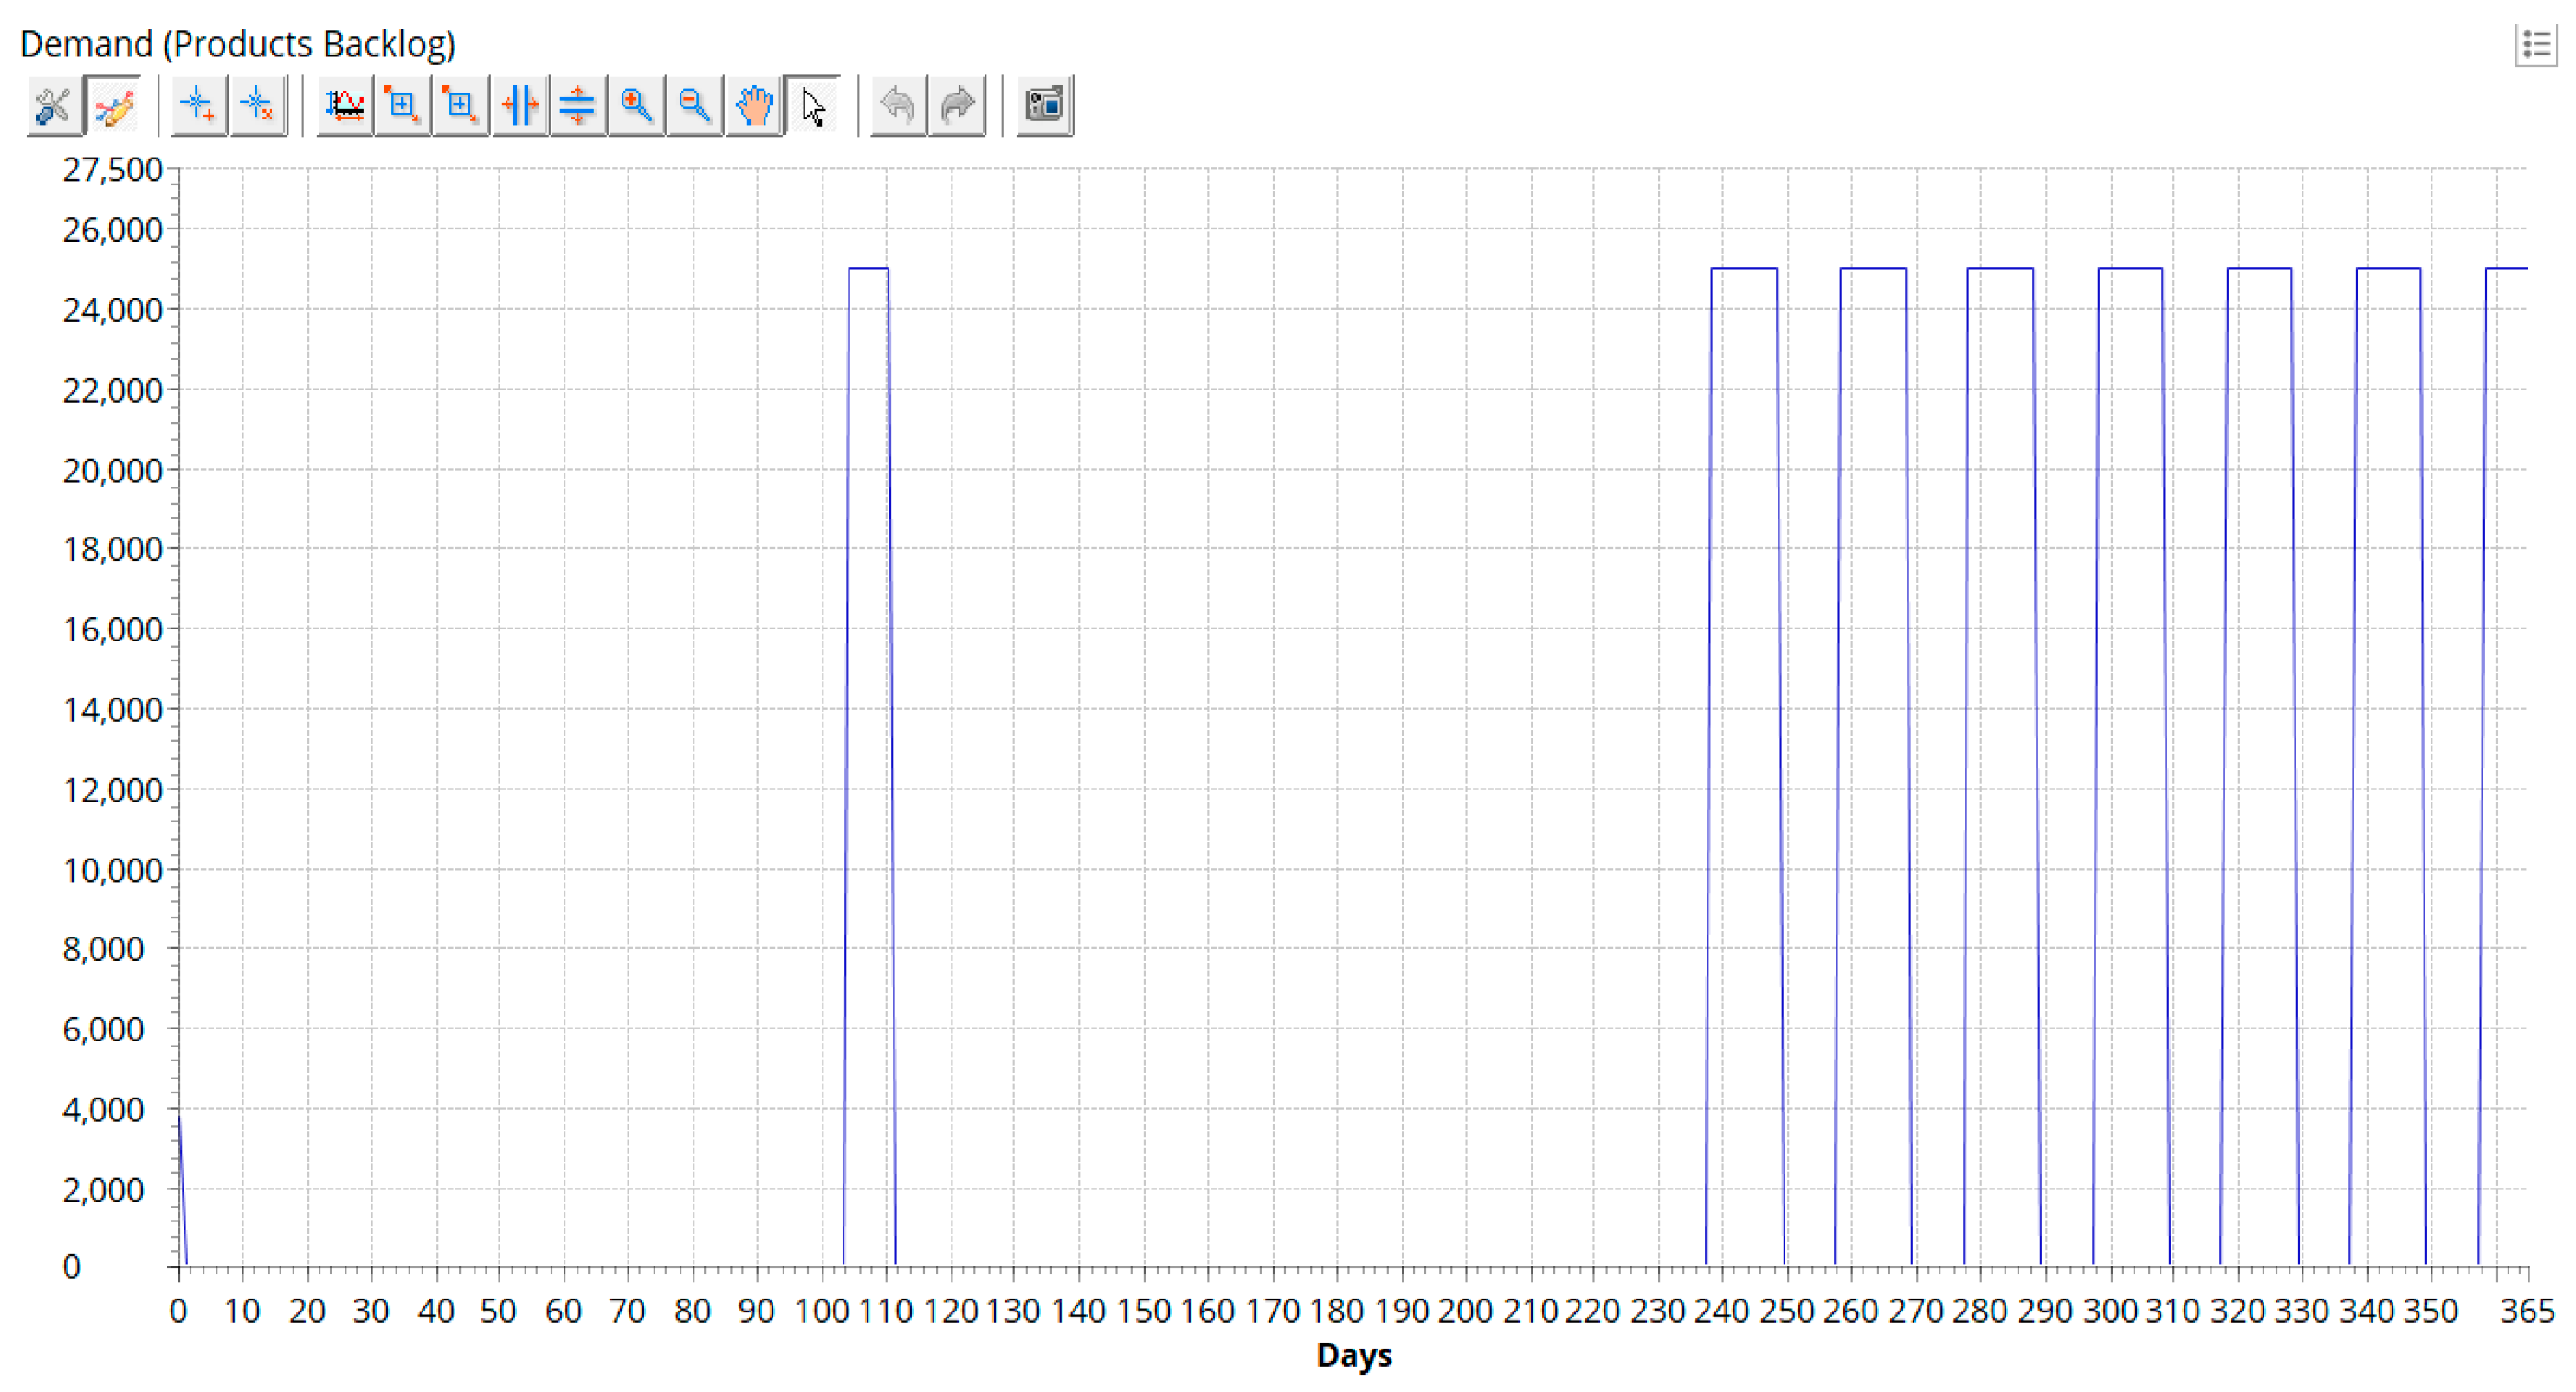
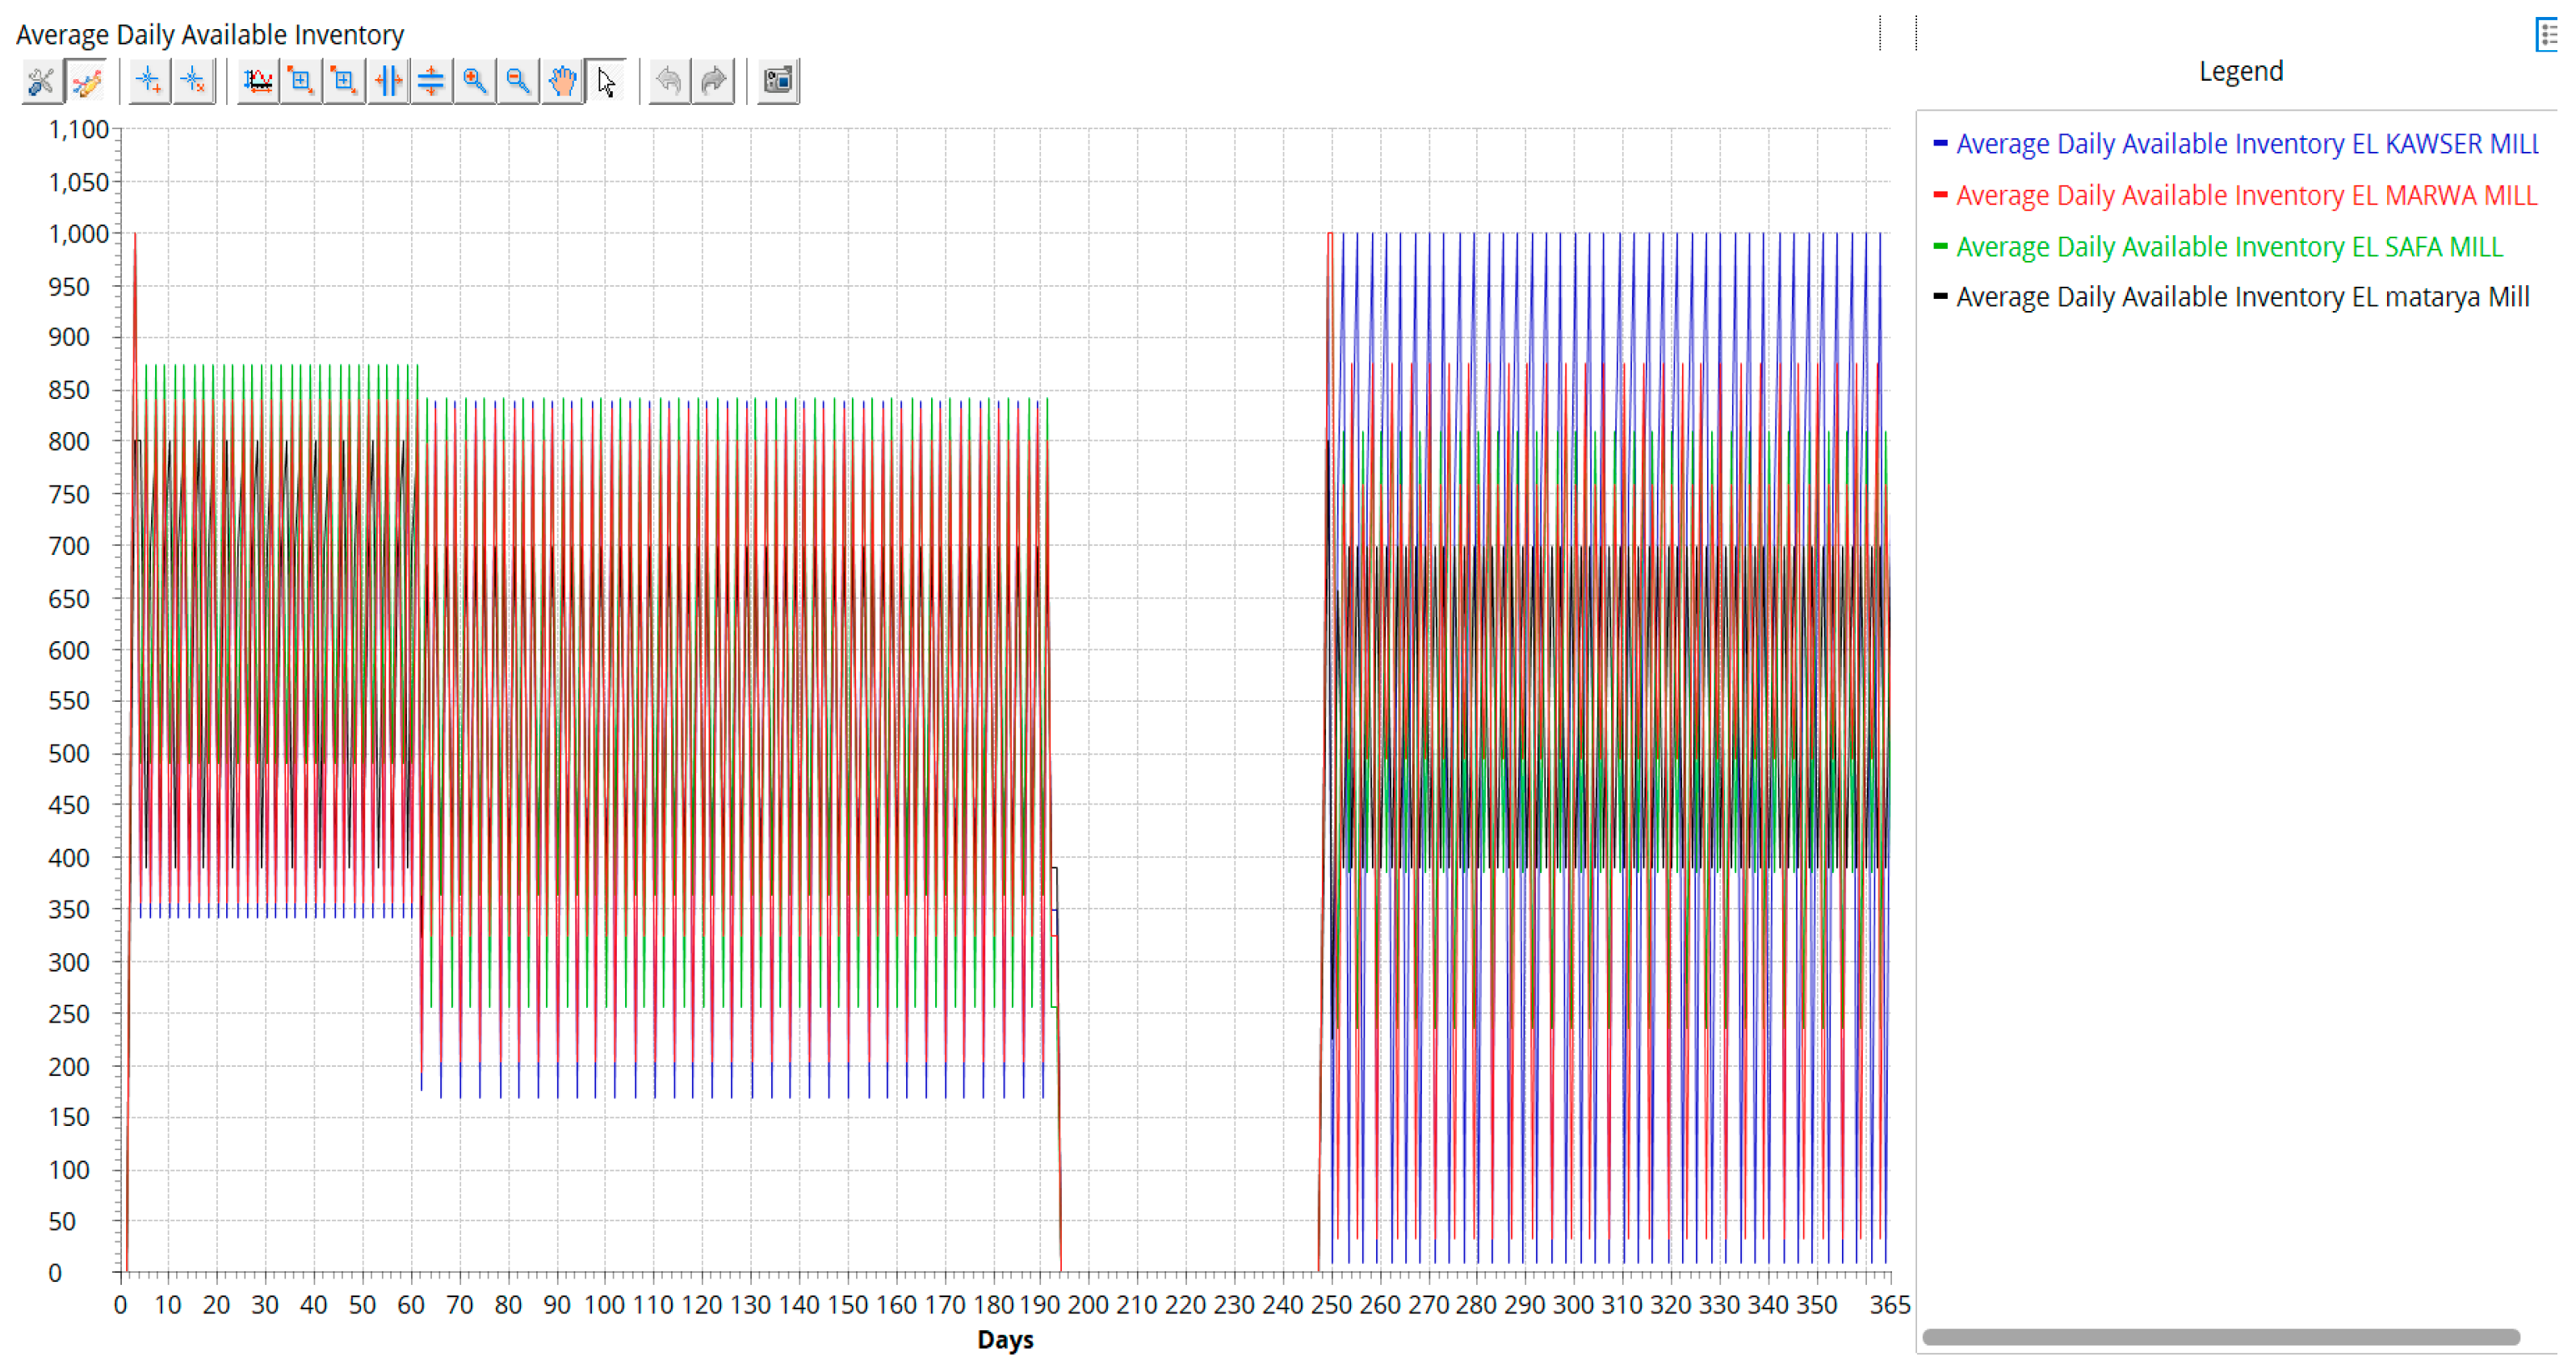
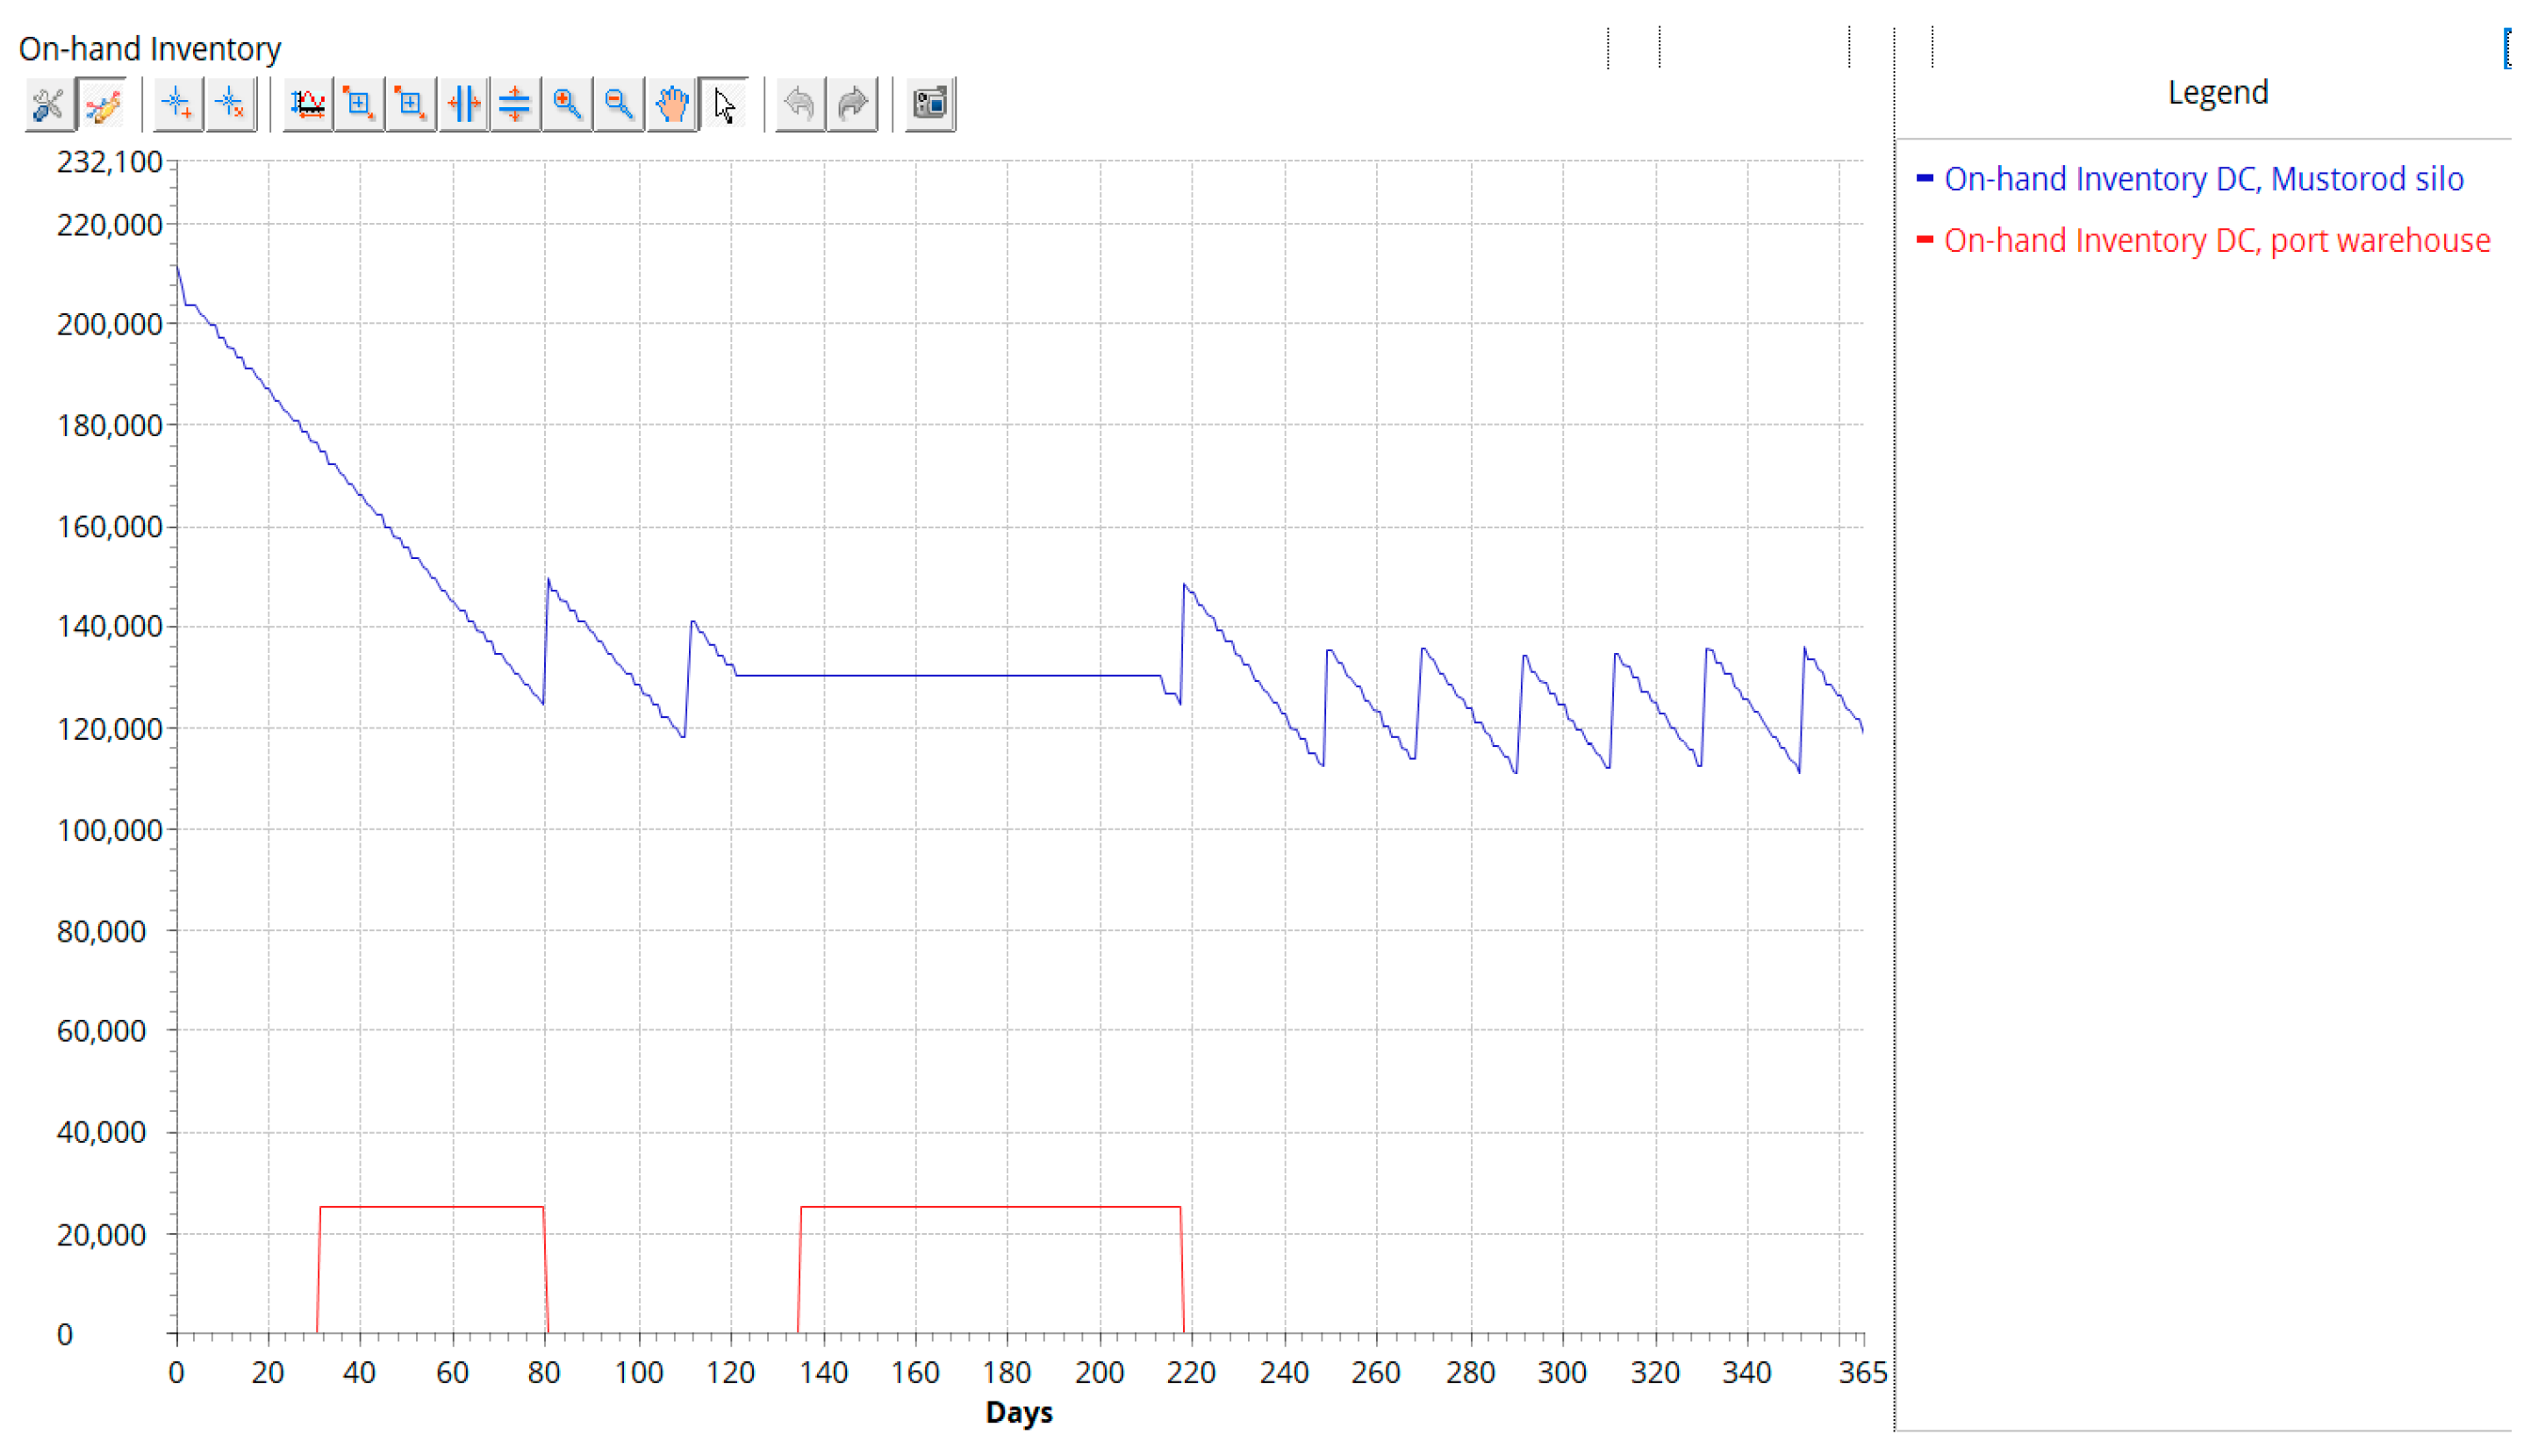
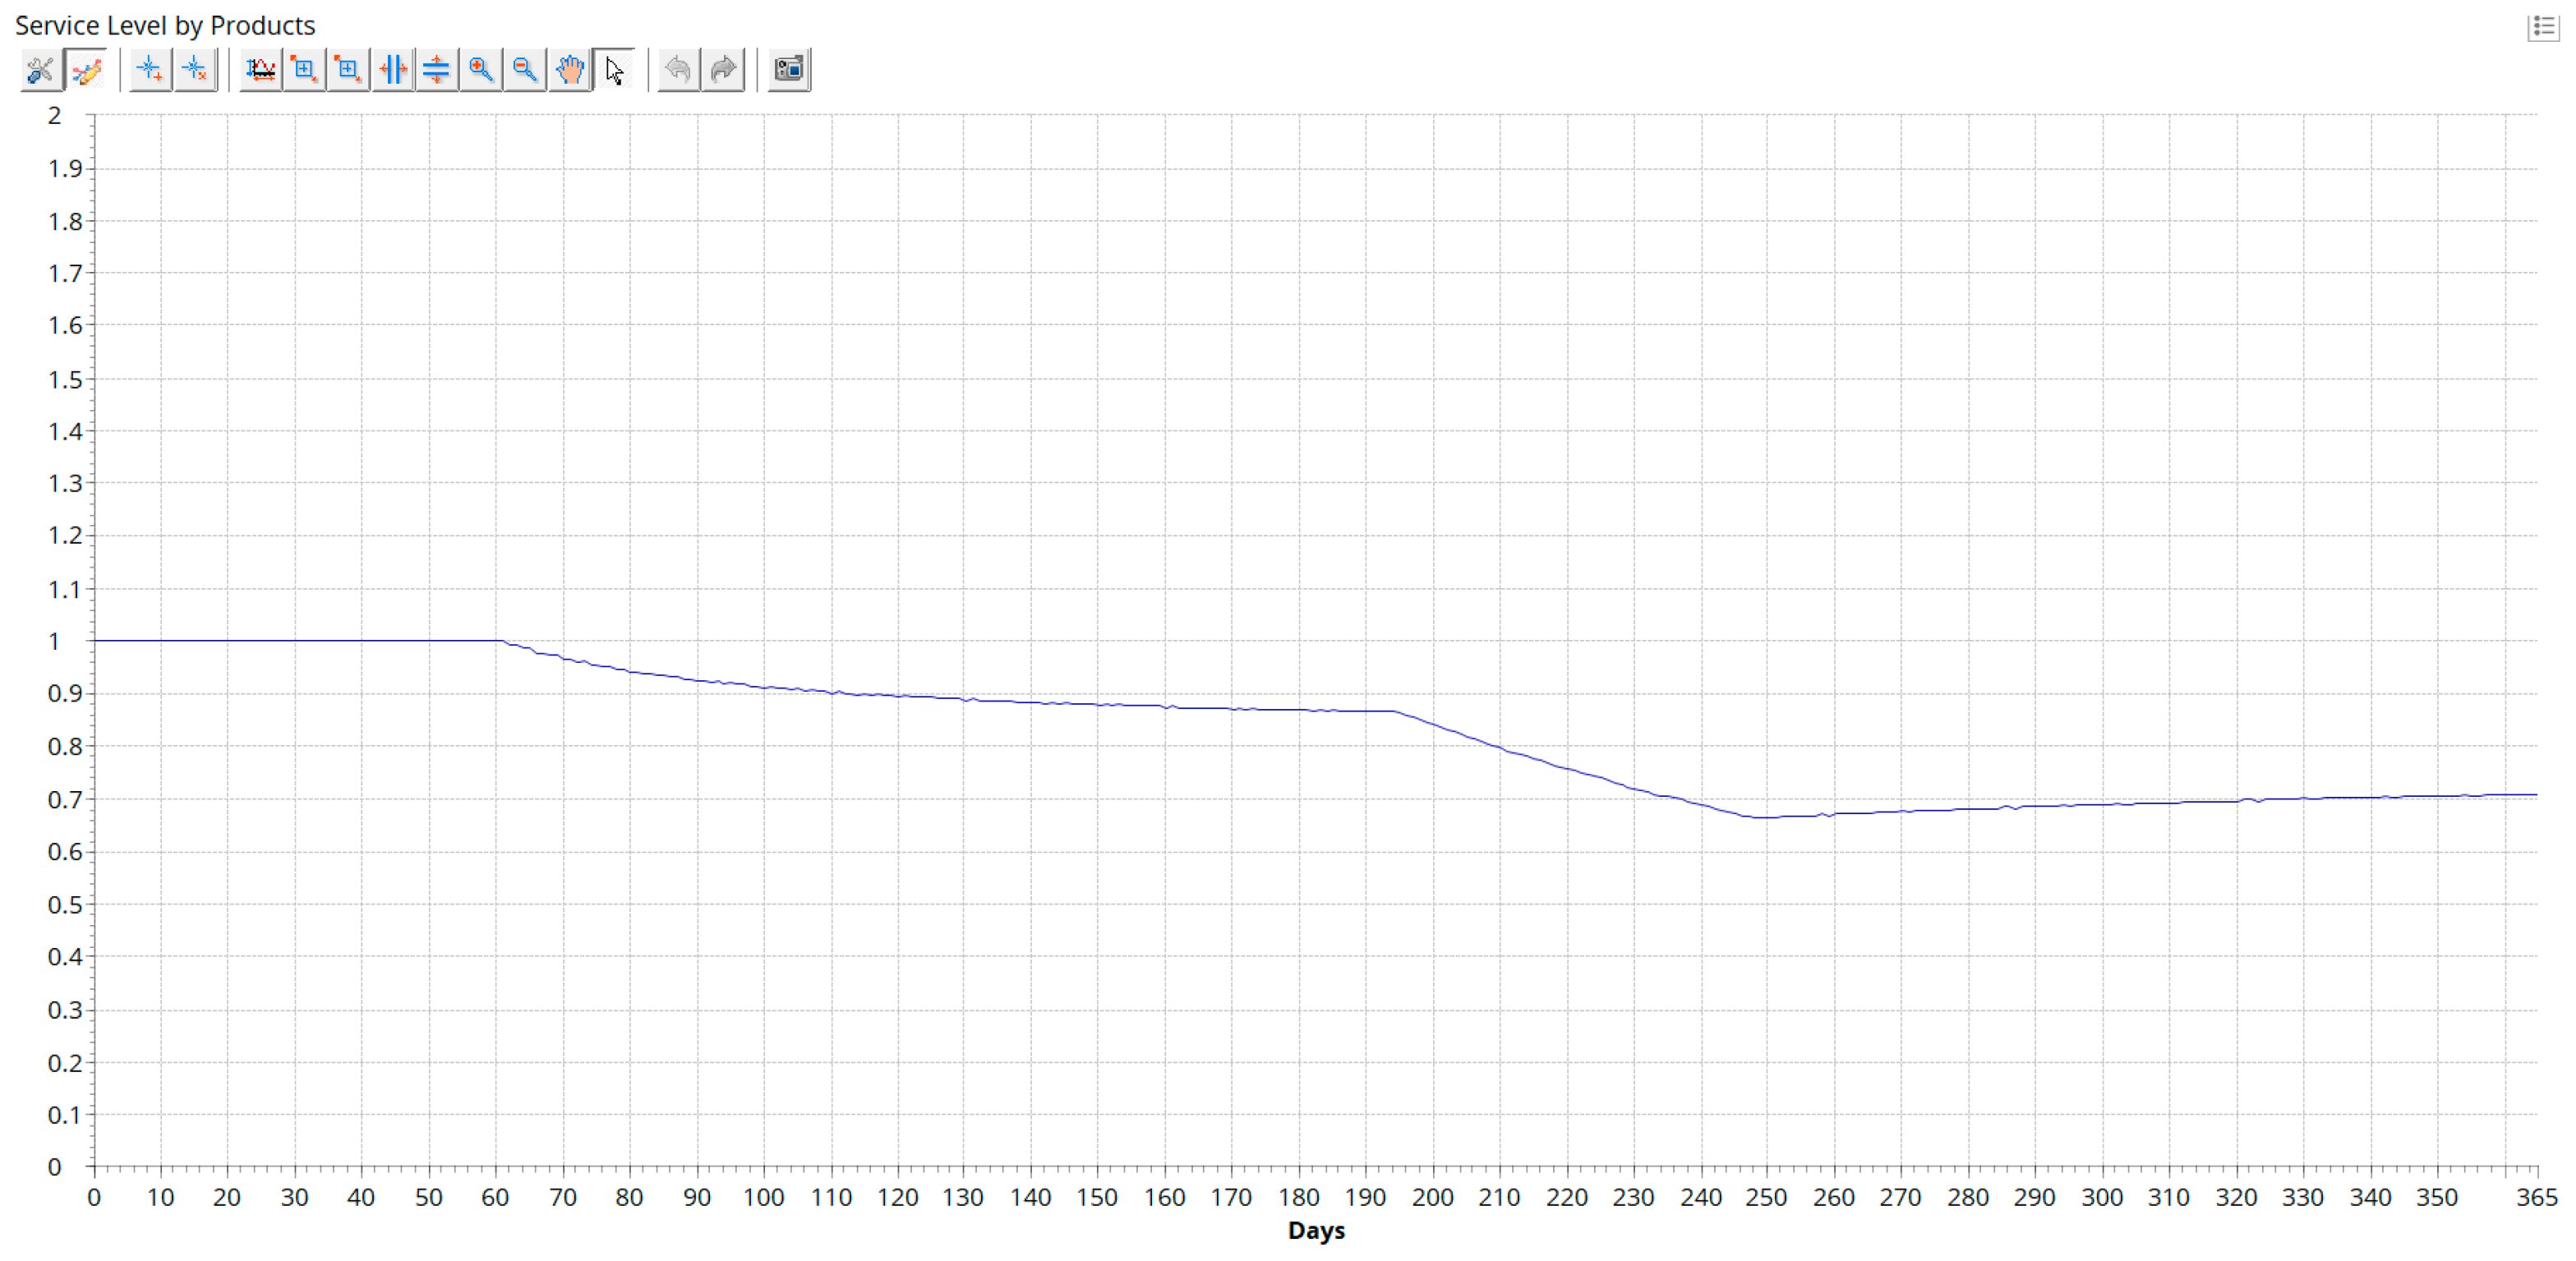
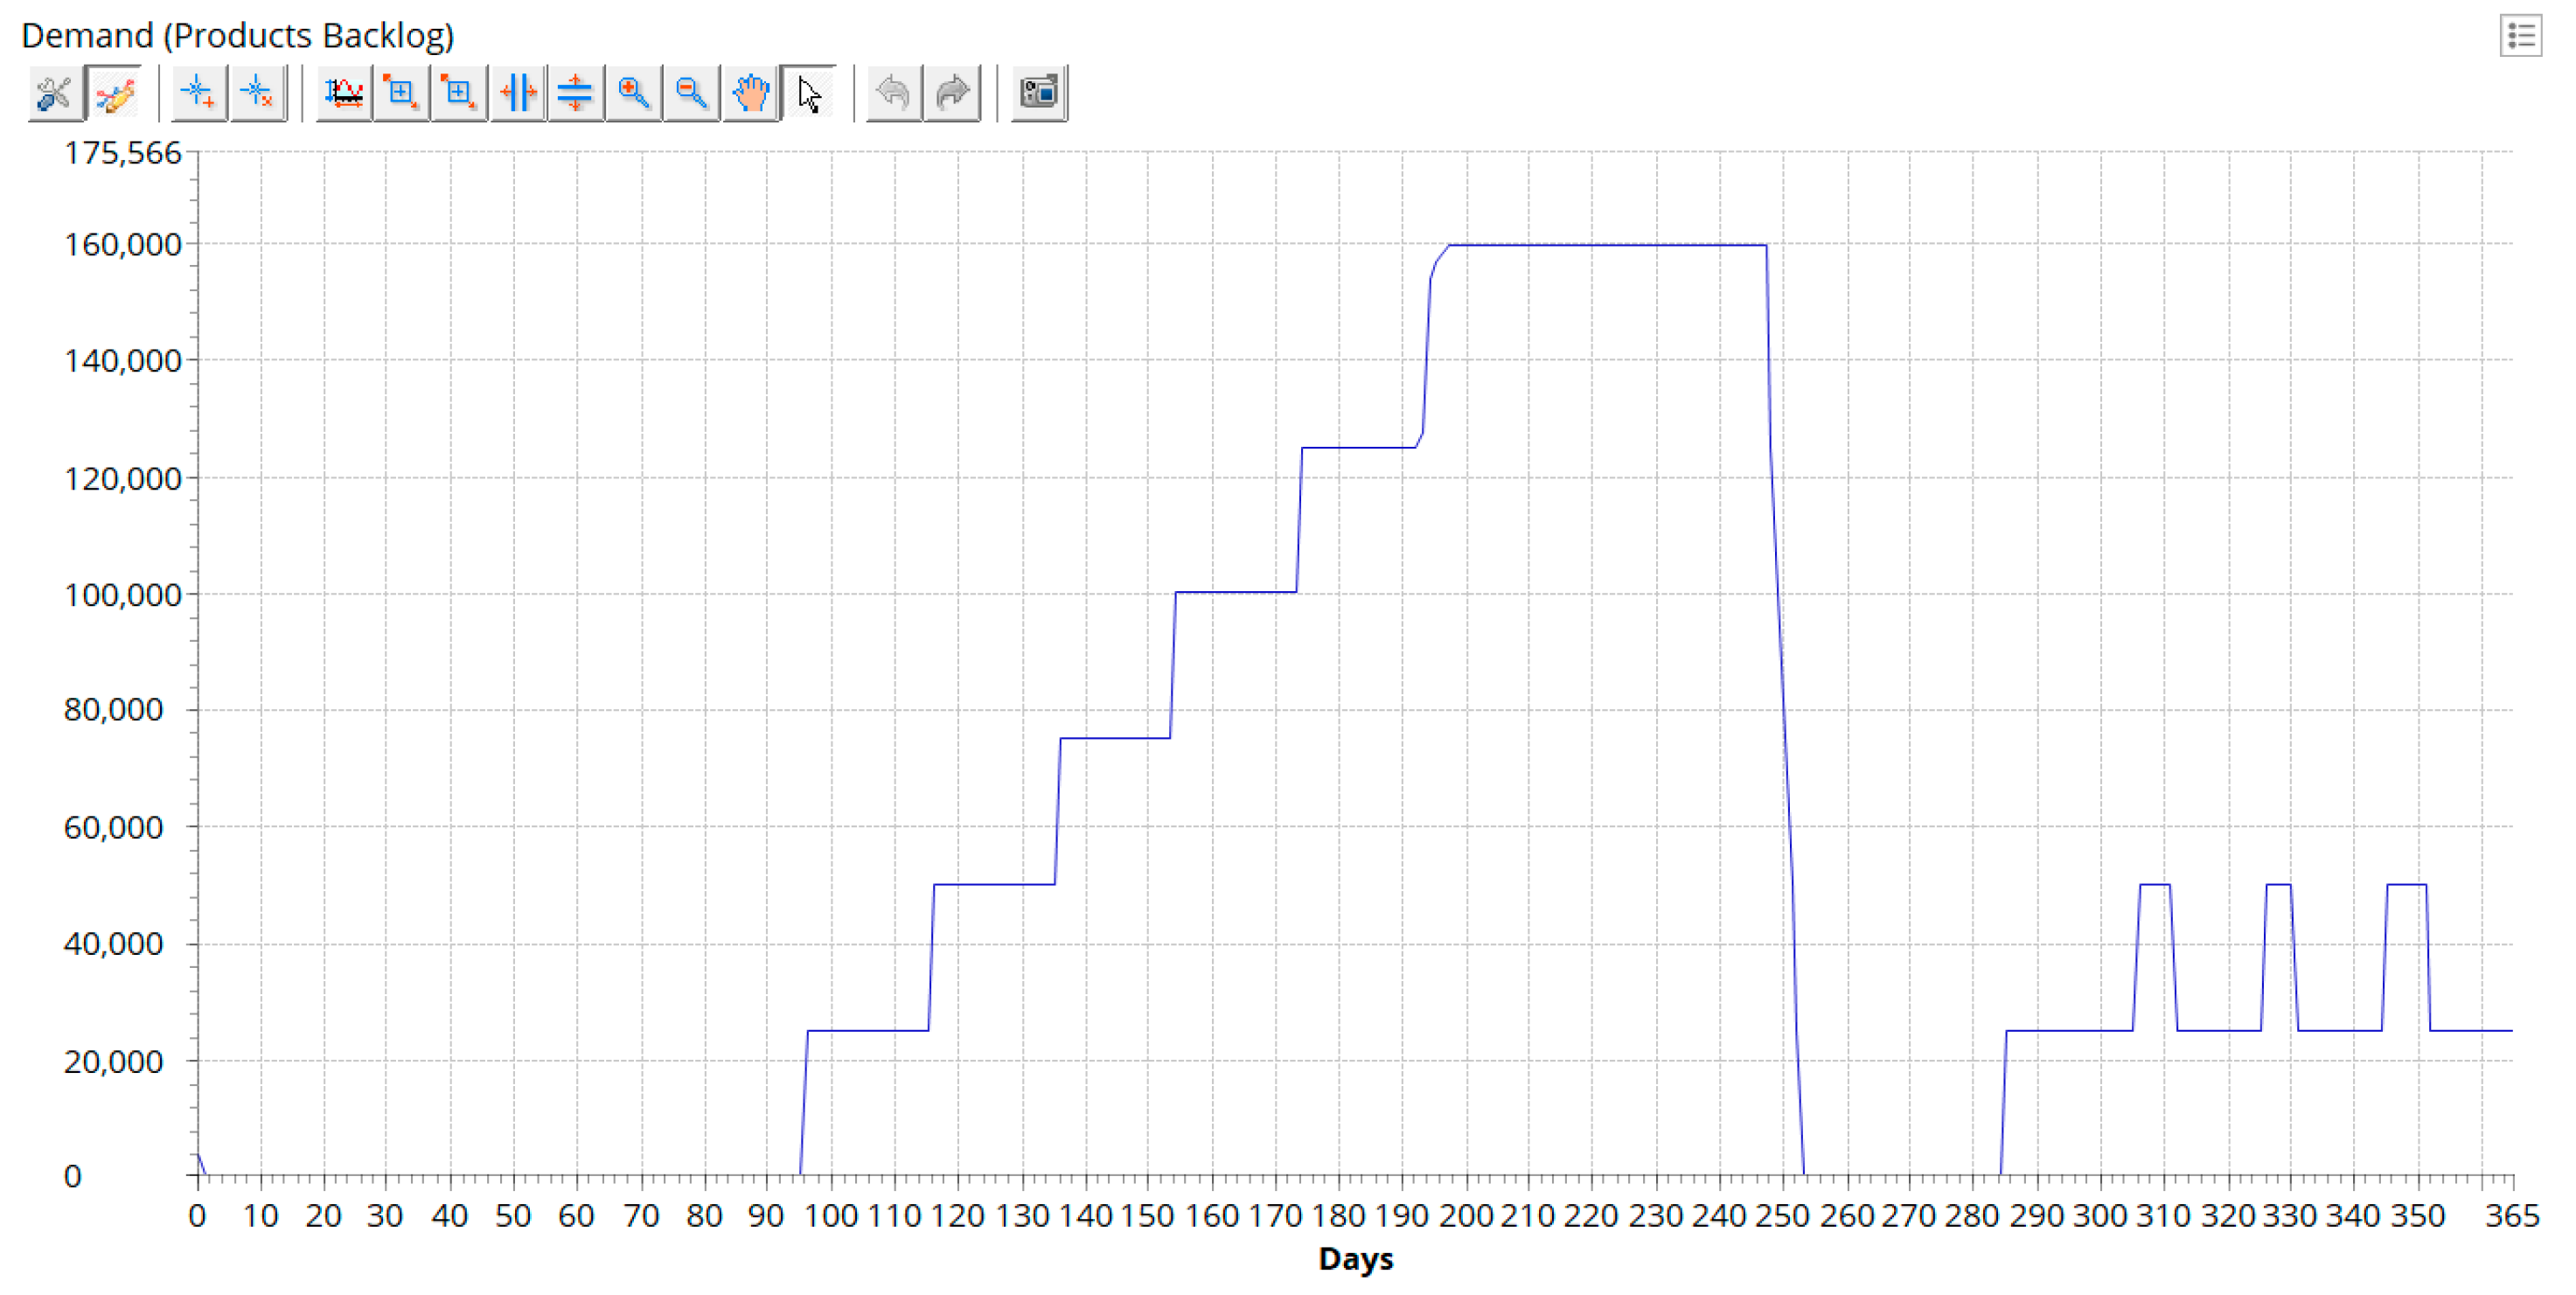
4.2. Scenario 2 (COVID-19)

This scenario seeks to simulate the disruption that occurred due to the COVID-19 outbreak. Egypt had the highest infection rate of COVID-19 during the period May–July [63]. During this period, many outlets were vulnerable to be shut down due to the fast infection spread, and rumors about potential shutdowns pushed the customers to panic buying, increasing the demand by at least 50%. Another factor is the disruption in logistics due to the pandemic, meaning that the availability of foreign suppliers (Russia and Ukraine) was highly volatile during the first three months. Also, there were concerns that a food crisis like the one that occurred between 2007 and 2008 may repeat [64]. This scenario can be characterized by three regions (normal state–lockdown–after lockdown). Figure 11 shows that the service level of the product has been affected during the lockdown period of May–July to below 0.5 of its normal value; the curve started to recover after this period to reach above 0.6 by the end of the year. This led to increasing the lead time to 1.79 days.
The results of the average daily available inventory are given in Figure 12, showing that for the first four months the inventory levels were normal even though the suppliers were disrupted as local production supplemented the need during this period. After July, the production facilities reopened and the demand increased, affecting the inventory levels. The available supply and the closure period compensated for the demand. The on-hand inventory, shown in Figure 13, has shown a normal pattern except for the last two months, when the source’s fixed supply ran out and the internal supply began to be consumed, which created a backlog in the inventory as shown in Figure 14.

4.3. Scenario 3 (The Russian–Ukrainian War)

This scenario simulates the effect of the Russian–Ukrainian war on the Baladi bread supply chain. Since the start of the war, Ukrainian exports of grain have been severely disrupted. Starting from July 2022, exports were allowed under the Black Sea Grain Initiative [65]. During the restriction period, Egypt mainly depended on the domestically cultivated crops and the wheat stock from the first three months of the year. Along with the disruption at the source supplier, forward buying occurred from March to July. Figure 15 shows that the service level for the war scenario is characterized by four regions; in the first region, the service level starts with a value of 1 until the end of February. In this region, the daily average inventory is almost normal, and no demand backlog was observed as reflected in Figure 16 and Figure 17. In the second region, the service level starts to decrease until it reaches below 0.9. With the start of the ban in March until mid-June, this decrease is due to the increase in the demand with the absence in suppliers. As for the backlog, it starts to appear in the middle of April and continues to increase within this region until it reaches 120,000 products. The distribution appears in the available inventory. In the third region, the service level reaches its lowest level at 0.65 because the internal supply was running out.
In the fourth region, the service level started to recover as the ban was lifted. It reached 0.7, and the recovery is reflected in Figure 18, where the backlog decreased from 160,000 to zero and started to appear again with a value of 50,000. The disruption in the inventory appears to be of the largest magnitude in the recovery region. For this scenario, the average lead time is 21.5 day. Figure 17 represents the on-hand inventory represented by the domestic supply stored in the Matrya silos and the imported supply of wheat that arrived at the port warehouse. It appears that a shipment of wheat arrived in Egypt before the ban. During the ban, Egypt was using its domestic store of wheat to fulfill the customer demand and after the ban was lifted, the storage was quickly replenished.

5. Discussion and Implications

From the simulation results, it was shown that the two proposed scenarios introduced significant differences from the normal supply chain of Baladi bread in Egypt (i.e., the one before the COVID-19 pandemic). In this benchmark scenario, all orders were received on time, with an average lead time of 0.56 days and without significant delays. Also, the daily inventory remains within the specified (s, S) range, it shows no disruptions, and the product backlog is zero except for an initial peak. In the COVID-19 scenario, that introduced panic buying and logistics disruptions, the service level is effected and it drops below 0.5 at the end of the lockdown period, after which it starts to recover up to 0.6. Consequently, average lead times are increased to 1.79 days, and the average daily inventory starts from a normal pattern. It is later frozen during the lockdown period, and it experiences higher volatility after lockdown due to panic buying. Under these circumstances, in fact, the on-hand inventory started to cause backlog spikes as all demand could not be met on time.
The Russian–Ukrainian war scenario simulates the disruption of wheat export in the first half of 2022, with the subsequent recovery under the Black Sea Grain Initiative. This scenario is characterized by four different regions: a normal region, starting from the same patterns as the benchmark scenario, followed by a second region where the export ban and the panic buying come into play, and, thus, the service level starts to decrease towards the value of 0.9, where the on-hand inventory is depleted and a backlog starts to build up (from mid-April), up to the total value of 160,000 products, causing a decrease in service level to 0.65, which is shown in the third region. Finally, service level and on-hand inventories start to recover in the fourth region, and there is a decrease in the backlog with the lifting of the ban. Final trends for the service level see a value of 0.7 and a remaining backlog of 50,000 products at the end of the simulation period. In this last scenario, average lead times can be as long as 21.5 days.
An interesting insight is the impact of the above-mentioned disruptions when linked with the United Nations Sustainable Development Goals (UN SDGs) [66]. According to Leal Filho et al. [67], SDG 12 (responsible consumption and production) is the area most highlighted by the literature on supply chain. However, disruptions in the global food supply chain will have direct impacts on several goals, such as SDG1 (no poverty), SDG2 (zero hunger), SDG3 (good health and well-being), SDG8 (decent work and economic growth), and SDG12 (responsible consumption and production). To achieve more sustainable supply chains, it is necessary to consider not only SDGs but also the technology and digital transformation context [68,69]. Unusual situations, in fact, require innovative solutions, hence, supply chain innovation is becoming a major player to mitigate risks through technology innovation and process innovation [70].
Another implication is that since most of the international shipping is performed through managing risks in maritime supply chains [71], further issues and disruptions may be considered in this case, such as piracy and security issues. This was seen very recently through the Red Sea crisis during the war in Gaza that led to the diversion of several container ships from their regular route through the Suez Canal to the historical route around the Cape of Good Hope in South Africa. Such a diversion adds 6000 nautical miles, which results in adding three or four weeks to delivery times [72]. Since the Suez Canal accounts for about 12% of global shipping traffic [73], such disruption had a rapid impact on shipping costs. By mid-January 2024, about three months since the start of the war, the shipping rates for a 40-foot container surged by more than 600% from North Asia to Europe, 137% from North Asia to the US East Coast, and 131% from North Asia to the US West Coast [74]. Since such disruptions do not usually happen suddenly, it may be a proper strategy to use non-traditional forecasting techniques to avoid the bullwhip effect, e.g., rolling forecasting [75], risk aversion [76], and alternative food networks and short food supply chains [77].

6. Conclusions and Future Work

Supply chain disruptions have been a hot research topic over the past few years. This became especially important following the breakout of the COVID-19 pandemic and its impact on global supply chain and logistics networks. However, few studies addressed this impact in countries in the MENA region. This paper presents a case study of the disruption in the Egyptian food supply chain due to the COVID-19 pandemic and the Russian–Ukrainian war. The study addresses the Baladi bread sector in the East Cairo region as a focal point and employs simulation modeling using anyLogistix software to assess its supply chain performance under different conditions. The simulation results obtained in this study provide valuable insights into the impact of the two occurrences on the performance of supply chains, such as operational performance and sourcing performance and customers’ performance. Specifically, the results showed that the pandemic led to a backlog problem. Furthermore, it caused an increase in lead times for customers and increased shipping duration causing unfulfilled demand. Comparable results were also obtained from simulating the effect of the war, which caused higher disruption, mainly due to the unavailability of the wheat sources.
Moreover, the research validates the effectiveness of simulation-based methodologies in modeling and analyzing the effect of unusual events on supply chains. Through simulation modeling, several parameters can be predicted, such as the increase in the transportation time, whether from the source or domestically, along with the unavailability of the sources and the effect of demand increase.
One limitation of this work is studying a specific region in Egypt. As mentioned, this was due to a lack of enough data to address the whole country. However, it would be beneficial to perform thorough analysis by simulating the effect of the disruption scenarios on different regions in Egypt to pin down the potential vulnerability in Baladi bread food supply chain all over Egypt. Other factors are expected to have a potential impact on Baladi bread food supply chain, such as the production efficiency of the mills. Storage units’ capability to store either wheat or flour for an extended period could significantly aid in reducing the disruption’s effect. The transportation hours also would have a significant effect on the lead time of the supply chain. As for the bakeries, they were considered as needing a fixed quantity, but in reality, not all bakeries will purchase a fixed quantity, and it shall vary according to the population of the region the bakeries serve. However, all the previously mentioned factors were not considered as variables in this research due to a lack of governmental data.
The findings and outcomes of this study can be used as a predictive approach to help decision-makers in analysing the potential risks the food supply chain may suffer. Such models can be used for agricultural supply chains and provide important insights that can play a significant role in maximizing food security and supply chain resilience. By utilizing the research findings, proactive strategies can be developed to minimize the impact of such disruptions in the future. Future work can be dedicated towards exploring other factors and scenarios that might have negative effects on delivery times, such as maritime transportation security, ineffective routing, inefficient order management, and long paperwork. Research directions to address such factors may include blockchain, smart contracts, data analytics, and location intelligence.

Author Contributions

Conceptualization, N.A.M. and G.R.; methodology, N.A.M. and A.A.H.; software, A.A.H.; validation, N.A.M., A.A.H. and M.E.; formal analysis, N.A.M. and A.A.H.; investigation, N.A.M. and G.R.; data curation, A.A.H. and M.E.; writing—original draft preparation, A.A.H. and M.E.; writing—review and editing, N.A.M. and G.R.; visualization, A.A.H.; supervision, N.A.M.; Revision, N.A.M., A.A.H., M.E. and G.R. All authors have read and agreed to the published version of the manuscript.

Funding

This research received no external funding.

Institutional Review Board Statement

Not applicable.

Informed Consent Statement

Not applicable.

Data Availability Statement

Data is contained within the article.

Conflicts of Interest

The authors declare no conflict of interest.

References

  1. Mari, S.I.; Lee, Y.H.; Memon, M.S. Sustainable and Resilient Supply Chain Network Design under Disruption Risks. Sustainability 2014, 6, 6666–6686. [Google Scholar] [CrossRef]
  2. Elkington, J. Partnerships from cannibals with forks: The triple bottom line of 21st-century business. Environ. Qual. Manag. 1998, 8, 37–51. [Google Scholar] [CrossRef]
  3. Mostafa, N.; Negm, A. Promoting organizational sustainability and innovation: An exploratory case study from the Egyptian chemical industry. Procedia Manuf. 2018, 22, 1007–1014. [Google Scholar] [CrossRef]
  4. Kumar, S.; Managi, S. Does Stringency of Lockdown Affect Air Quality? Evidence from Indian Cities. Econ. Disasters Clim. Change 2020, 4, 481–502. [Google Scholar] [CrossRef]
  5. Huremović, D. Psychiatry of Pandemics; Springer: Cham, Switzerland, 2019. [Google Scholar]
  6. Food and Agriculture Organization of the United Nations. Adjusting Business Models to Sustain Agri-Food Enterprises during COVID-19; FAO: Rome, Italy, 2020. Available online: https://www.fao.org/documents/card/en/c/ca8996en (accessed on 20 March 2023). [CrossRef]
  7. Domenico, L.D.; Pullano, G.; Sabbatini, C.E.; Boëlle, P.-Y.; Colizza, V. Impact of lockdown on COVID-19 epidemic in Île-de-France and possible exit strategies. BMC Med. 2020, 18, 240. [Google Scholar] [CrossRef] [PubMed]
  8. Ren, X. Pandemic and lockdown: A territorial approach to COVID-19 in China, Italy and the United States. Eurasian Geogr. Econ. 2020, 61, 423–434. [Google Scholar] [CrossRef]
  9. Hassan, M.K.; Rabbani, M.R.; Abdullah, Y. Socioeconomic Impact of COVID-19 in MENA Region and The Role of Islamic Finance. Int. J. Islam. Econ. Financ. 2021, 4, 51–78. [Google Scholar] [CrossRef]
  10. Dun & Bradstreet. 2020. Available online: https://dnb.ru/media/entry/72/DNB_Business_Impact_of_the_Coronavirus_US.pdf (accessed on 22 March 2023).
  11. Hoek, R.V. Research opportunities for a more resilient post-COVID-19 supply chain–closing the gap between research findings and industry practice. Int. J. Oper. Prod. Manag. 2020, 40, 341–355. [Google Scholar] [CrossRef]
  12. Iacovacci, C.; Caratù, M.; Addamo, G.; Grasso, V. Analyzing the Impact of COVID-19 on Business Performance through the Case-Study of a Green Italian Start-Up. Sustainability 2023, 15, 12949. [Google Scholar] [CrossRef]
  13. Romagnoli, G.; Gallo, M.; Liccardo, A.; Riedel, R. Guest editorial: Opportunities and threats in providing remote access to manufacturing-related environments. J. Manuf. Technol. Manag. 2023, 34, 497–506. [Google Scholar] [CrossRef]
  14. Xenophon, K.; Guanyi, L. Food Supply Chain Safety and Security: A Concern of Global Importance. J. Mark. Channels 2017, 24, 111–114. [Google Scholar] [CrossRef]
  15. Aday, S.; Aday, M.S. Impacts of COVID-19 on Food Supply Chain. Food Qual. Saf. 2020, 4, 167–180. [Google Scholar] [CrossRef]
  16. Sers, C.F.; Mughal, M. COVID-19 outbreak and the need for rice self-sufficiency in West Africa. World Dev. 2020, 135, 105071. [Google Scholar] [CrossRef] [PubMed]
  17. FAO. COVID-19 and the Impact on Food Security in the Near East and North Africa: How to Respond? FAO: Rome, Italy, 2020. [CrossRef]
  18. IMF. Egypt: Overcoming the COVID Shock and Maintaining Growth 2021. Available online: https://www.imf.org/en/News/Articles/2021/07/14/na070621-egypt-overcoming-the-covid-shock-and-maintaining-growth (accessed on 2 May 2023).
  19. Abdalla, A.; Stellmacher, T.; Becker, M. Trends and Prospects of Change in Wheat Self-Sufficiency in Egypt. Agriculture 2023, 13, 7. [Google Scholar] [CrossRef]
  20. Ahram Online. Egypt Increases Local Wheat Procurement Price by 20% for New Harvest Season. Available online: https://english.ahram.org.eg/NewsContent/1/2/495688/Egypt/Society/Egypt-increases-local-wheat-procurement-price-by--.aspx (accessed on 10 July 2023).
  21. FAO. The State of Food Security and Nutrition in the World. 2022. Available online: https://www.fao.org/publications/sofi/2022/en/ (accessed on 14 July 2023).
  22. World Bank. The Impact of the War in Ukraine on Global Trade and Investment. Open Knowledge Repository. 2022. Available online: https://openknowledge.worldbank.org/handle/10986/37359 (accessed on 14 July 2023).
  23. Mandour, D.A. COVID-19 and Food Security Challenges in the MENA Region, Working Papers 1506. Econ. Res. Forum 2021. Available online: https://ideas.repec.org/p/erg/wpaper/1506.html (accessed on 20 March 2023).
  24. Grigg, D. Food Consumption in the Mediterranean Region. J. Econ. Hum. Geogr. 1999, 90, 391–409. [Google Scholar] [CrossRef]
  25. CIHEAM/FAO. Mediterranean Food Consumption Patterns: Diet, Environment, Society, Economy and Health. a White Paper Priority 5 of Feeding Knowledge Programme, Expo Milan 2015, CIHEAM-IAMB; Bari/FAO: Rome, Italy, 2015.
  26. Karunarathna, N.; Siriwardhane, D.; Jayarathne, A. Exploring the measurements of COVID-19-induced supply chain disruptions and their implications on the economic vulnerability of small-scale farmers. Int. J. Ind. Eng. Oper. Manag. 2023. ahead-of-print. [Google Scholar] [CrossRef]
  27. Liu, M.; Tang, H.; Wang, Y.; Li, R.; Liu, Y.; Liu, X.; Wang, Y.; Wu, Y.; Wu, Y.; Sun, Z. Enhancing Food Supply Chain in Green Logistics with Multi-Level Processing Strategy under Disruptions. Sustainability 2023, 15, 917. [Google Scholar] [CrossRef]
  28. Ardekani, Z.F.; Sobhani, S.M.J.; Barbosa, M.W.; De Sousa, P.R. Transition to a sustainable food supply chain during disruptions: A study on the Brazilian food companies in the COVID-19 era. Int. J. Prod. Econ. 2023, 257, 108782. [Google Scholar] [CrossRef] [PubMed]
  29. Le, T.T. How do food supply chain performance measures contribute to sustainable corporate performance during disruptions from the COVID-19 pandemic emergency? Int. J. Qual. Reliab. Manag. 2023, 40, 1233–1258. [Google Scholar] [CrossRef]
  30. Nava, N.J.; Ridley, W.; Dall’erba, S. A model of the U.S. food system: What are the determinants of the state vulnerabilities to production shocks and supply chain disruptions? Agric. Econ. 2022, 54, 95–109. [Google Scholar] [CrossRef]
  31. The Guardian. Fruit and Veg ‘Will Run Out’ unless Britain Charters Planes to Fly in Farm Workers from Eastern Europe. Available online: https://www.theguardian.com/environment/2020/mar/28/fruit-and-veg-will-run-out-unless-britain-charters-planes-to-fly-in-farm-workers-from-eastern-europe (accessed on 13 April 2023).
  32. IOM UN Migration. COVID-19 Analytical Snapshot #18: Migrants & Global Food Supply. 2020. Available online: https://www.iom.int/covid-19-analytical-snapshots (accessed on 13 April 2023).
  33. Ilinova, A.; Dmitrieva, D.; Kraslawski, A. Influence of COVID-19 pandemic on fertilizer companies: The role of competitive advantages. Resour. Policy 2021, 71, 0301–4207. [Google Scholar] [CrossRef] [PubMed]
  34. Nicola, M.; Alsafi, Z.; Sohrabi, C.; Kerwan, A.; Al-Jabir, A.; Iosifidis, C.; Agha, M.; Agha, R. The socio-economic implications of the coronavirus pandemic (COVID-19): A review. Int. J. Surg. 2020, 78, 185–193. [Google Scholar] [CrossRef] [PubMed]
  35. Luckstead, J.; Nayga, R.M., Jr.; Snell, H.A. Labor Issues in the Food Supply Chain Amid the COVID-19 Pandemic. Appl. Econ. Perspect. Policy 2020, 43, 382–400. [Google Scholar] [CrossRef] [PubMed]
  36. USDA. Food Supply Chain. Available online: https://www.usda.gov/coronavirus/food-supply-chain (accessed on 10 May 2023).
  37. Hobbs, J.E. Food supply chains during the COVID-19 pandemic. Can. J. Agric. Econ./Rev. Can. D’agroeconomie 2020, 68, 171–176. [Google Scholar] [CrossRef]
  38. The Guardian. US Producers ‘in Tears’ at Having to Cull Livestock on Their Farms. Available online: https://www.theguardian.com/environment/2020/jun/10/us-producers-in-tears-at-having-to-cull-livestock-on-their-farms (accessed on 10 May 2023).
  39. USA Today. Costco to Temporarily Limit Meat Purchases to 3 Items per Person. Available online: https://www.usatoday.com/story/money/2020/05/04/costco-limits-meat-purchases-3-items-per-person/3078198001/ (accessed on 10 May 2023).
  40. Garnett, P.; Doherty, B.; Heron, T. Vulnerability of the United Kingdom’s food supply chains exposed by COVID-19. Nat. Food 2020, 1, 315–318. [Google Scholar] [CrossRef] [PubMed]
  41. FAO eBooks. Legal Mechanisms to Contribute to Safe and Secured Food Supply Chains in Times of COVID-19; FAO eBooks: Rome, Italy, 2020. [Google Scholar] [CrossRef]
  42. Esteso, A.; Alemany, M.M.E.; Ottati, F.; Ortiz, Á. System dynamics model for improving the robustness of a fresh agri-food supply chain to disruptions. Oper. Res. Int. J. 2023, 23, 28. [Google Scholar] [CrossRef]
  43. Tonnang, H.E.Z.; Sokame, B.M.; Wamalwa, M.; Niassy, S.; Muriithi, B. System dynamics modeling for assessing the impact of COVID-19 on food supply chains: A case study of Kenya and Rwanda. Sustainability 2023, 15, 4717. [Google Scholar] [CrossRef]
  44. Huang, Y.; Li, J.; Qi, Y.; Shi, V. Predicting the Impacts of the COVID-19 Pandemic on Food Supply Chains and Their Sustainability: A Simulation Study. Discret. Dyn. Nat. Soc. 2021, 2021, 7109432. [Google Scholar] [CrossRef]
  45. Burgos, D.; Ivanov, D. Food retail supply chain resilience and the COVID-19 pandemic: A digital twin-based impact analysis and improvement directions. Transp. Res. Part E Logist. Transp. Rev. 2021, 152, 102412. [Google Scholar] [CrossRef]
  46. Singh, S.; Kumar, R.; Panchal, R.; Tiwari, M.K. Impact of COVID-19 on logistics systems and disruptions in food supply chain. Int. J. Prod. Res. 2020, 59, 1993–2008. [Google Scholar] [CrossRef]
  47. Al Mal News. Available online: https://rb.gy/011mc9 (accessed on 12 May 2023).
  48. Kamal, O. Half-Baked, the other Side of Egypt’s “baladi” Bread Subsidy: A Study of the Market Intermediaries and Middlemen in the System; CIDOB: Barcelona, Spain, 2015. [Google Scholar]
  49. FAO. Data, Food Balances. Available online: https://www.fao.org/faostat/en/#data/FBS (accessed on 20 July 2022).
  50. World Trade Institute. Wheat Imports by Egypt. Available online: https://www.wti.org/media/filer_public/a4/56/a456d31b-b55c-427c-a79d-210161e8574a/wheat_imports_by_egypt.pdf (accessed on 3 May 2022).
  51. Official Portal of Cairo Governorate. East Cairo Neighborhoods. Available online: http://www.cairo.gov.eg/en (accessed on 3 May 2022).
  52. Official Portal of Cairo Governorate. Bakeries in East Cairo Neighborhoods. Available online: http://www.cairodc.gov.eg/servicess/BakeriesM.aspx (accessed on 3 May 2022).
  53. Youm 7. Determining the Maximum Serving of Bakery Flour. Available online: https://rb.gy/lq9g7w (accessed on 5 May 2022).
  54. UNCTAD. Review of Maritime Transport 2023. Available online: https://unctad.org/publication/review-maritime-transport-2023 (accessed on 5 May 2022).
  55. Fernandes, G.; Teixeira, P.; Santos, T.A. The impact of the Ukraine conflict in internal and external grain transport costs. Transp. Res. Interdiscip. Perspect. 2023, 19, 100803. [Google Scholar] [CrossRef]
  56. Anylogistix Supply Chain Software. Available online: https://www.anylogistix.com/ (accessed on 6 December 2023).
  57. Hermogenes, L.R.D.S.; De Almeida, I.D.P.; Moreira, M.Â.L.; De Araújo Costa, I.P.; Gomes, C.F.S.; Santos, M.D.; De Oliveira Costa, D.; De Moura Pereira, D.A. E-commerce Supply Chain analysis using the ANYLOGISTIX computational tool. Procedia Comput. Sci. 2022, 214, 487–494. [Google Scholar] [CrossRef]
  58. Bai, S.-Z.; Wang, W.-L. The Impact of Transportation Disruption on Adaptive Supply Chain: A Hybrid Simulation Study. In Proceedings of the 2007 International Conference on Management Science and Engineering, Harbin, China, 20–22 August 2007; pp. 844–849. [Google Scholar] [CrossRef]
  59. Zegordi, S.H.; Davarzani, H. Developing a supply chain disruption analysis model: Application of colored Petri-nets. Expert Syst. Appl. 2012, 39, 2102–2111. [Google Scholar] [CrossRef]
  60. Melnyk, S.A.; Rodrigues, A.; Ragatz, G.L. Using simulation to investigate supply chain disruptions. In International Series in Management Science/Operations Research; Springer: Boston, MA, USA, 2009; pp. 103–122. [Google Scholar] [CrossRef]
  61. Beškovnik, B.; Zanne, M.; Golnar, M. Dynamic changes in port logistics caused by the COVID-19 pandemic. J. Mar. Sci. Eng. 2022, 10, 1473. [Google Scholar] [CrossRef]
  62. Ivanov, D. Supply Chain Simulation and Optimization with Anylogistix, 5th, ed.; Berlin School of Economics and Law: Berlin, Germany, 2021. [Google Scholar]
  63. WHO. Egypt: Who Coronavirus Disease (COVID-19) Dashboard with Vaccination Data; World Health Organization: Geneva, Switzerland, 2022. Available online: https://covid19.who.int/region/emro/country/eg (accessed on 17 May 2022).
  64. UNCTAD. COVID-19 and Food Security in Vulnerable Countries. Available online: https://unctad.org/news/covid-19-and-food-security-vulnerable-countries (accessed on 17 May 2022).
  65. European Council Council of the European Union. Infographic-Ukrainian Grain Exports Explained. Available online: https://www.consilium.europa.eu/en/infographics/ukrainian-grain-exports-explained/ (accessed on 13 January 2024).
  66. United Nations. Sustainable Development. Available online: https://sdgs.un.org/ (accessed on 15 January 2024).
  67. Leal Filho, W.; Viera Trevisan, L.; Paulino Piers Eustachio, J.H.; Dibbern, T.; Castillo Apraiz, J.; Rampasso, I.; Anholon, R.; Gornati, B.; Morello, M.; Lambrechts, E. Sustainable supply chain management and the UN sustainable development goals: Exploring synergies towards sustainable development. TQM J. 2023. ahead-of-print. [Google Scholar] [CrossRef]
  68. Khan, S.A.R.; Yu, Z.; Farooq, K. Green capabilities, green purchasing, and triple bottom line performance: Leading toward environmental sustainability. Bus. Strategy Environ. 2022, 32, 2022–2034. [Google Scholar] [CrossRef]
  69. Grida, M.; Mostafa, N.A. Are smart contracts too smart for Supply Chain 4.0? A blockchain framework to mitigate challenges. J. Manuf. Technol. Manag. 2023, 34, 644–665. [Google Scholar] [CrossRef]
  70. Kwak, D.-W.; Seo, Y.-J.; Mason, R. Investigating the relationship between supply chain innovation, risk management capabilities and competitive advantage in global supply chains. Int. J. Oper. Prod. Manag. 2018, 38, 2–21. [Google Scholar] [CrossRef]
  71. Roh, S.; Tam, J.; Lee, S.-W.; Seo, Y.-J. Risk Assessment of Maritime Supply Chain Security in Ports and Waterways. Int. J. Supply Chain. Manag. 2018, 7, 300–307. [Google Scholar]
  72. The Guardian. More than 100 Container Ships Rerouted from Suez Canal to Avoid Houthi Attacks. Available online: https://www.theguardian.com/business/2023/dec/20/more-than-100-container-ships-rerouted-suez-canal-red-sea-houthi-attacks-yemen (accessed on 13 January 2024).
  73. State Information Service. Suez Canal. Available online: https://www.sis.gov.eg/Story/171459/Suez-Canal?lang=en-us (accessed on 13 January 2024).
  74. CNBC. Red Sea Crisis Could Jeopardize Inflation Fight as Shipping Costs Spike Globally. Available online: https://www.cnbc.com/2024/01/11/red-sea-crisis-could-jeopardize-inflation-fight-as-shipping-costs-spike-globally.html (accessed on 13 January 2024).
  75. Lee, K.H.; Abdollahian, M.; Schreider, S.; Taheri, S. Supply Chain Demand Forecasting and Price Optimisation Models with Substitution Effect. Mathematics 2023, 11, 2502. [Google Scholar] [CrossRef]
  76. Yang, Y.; Lin, J.; Liu, G.; Zhou, L. The behavioural causes of bullwhip effect in supply chains: A systematic literature review. Int. J. Prod. Econ. 2021, 236, 108120. [Google Scholar] [CrossRef]
  77. Gori, F.; Castellini, A. Alternative Food Networks and Short Food Supply Chains: A Systematic Literature Review Based on a Case Study Approach. Sustainability 2023, 15, 8140. [Google Scholar] [CrossRef]
Figure 1. Bread supply chain stages.
Sustainability 16 00994 g001
Figure 2. Bread supply chain logical operations.
Sustainability 16 00994 g002
Figure 3. Experiment description for Scenario 2.
Sustainability 16 00994 g003
Figure 4. Experiment description for Scenario 3.
Sustainability 16 00994 g004
Figure 5. Location of Egypt and the studied region (East Cairo).
Sustainability 16 00994 g005
Figure 6. Network of Baladi bread supply chain.
Sustainability 16 00994 g006
Figure 7. Service level for Scenario 1 (initial state–normal conditions).
Sustainability 16 00994 g007
Figure 8. Average daily available inventory for Scenario 1.
Sustainability 16 00994 g008
Figure 9. On-hand inventory for Scenario 1.
Sustainability 16 00994 g009
Figure 10. Demand (products backlog) for Scenario 1.
Sustainability 16 00994 g010
Figure 11. Service level for Scenario 2 (COVID-19).
Sustainability 16 00994 g011
Figure 12. Average daily available inventory for Scenario 2.
Sustainability 16 00994 g012
Figure 13. On-hand inventory for Scenario 2.
Sustainability 16 00994 g013
Figure 14. Demand (products backlog) for Scenario 2.
Sustainability 16 00994 g014
Figure 15. Service level for Scenario 3 (The Russian–Ukrainian war).
Sustainability 16 00994 g015
Figure 16. Average daily available inventory for Scenario 3.
Sustainability 16 00994 g016
Figure 17. On-hand inventory for Scenario 3.
Sustainability 16 00994 g017
Figure 18. Demand (products backlog) for Scenario 3.
Sustainability 16 00994 g018
Table 1. Inventory control polices for the mills.
Inventory Control Policy
Mill-1 (El-Safa)Min-max policy (s = 500, S = 1000)
Mill-2 (El-Marwa)Min-max policy (s = 500, S = 1000)
Mill-3 (El-Kawser)Min-max policy (s = 500, S = 1000)
Mill-4 (El-Matrya)Min-max policy (s = 400, S = 8000)
Disclaimer/Publisher’s Note: The statements, opinions and data contained in all publications are solely those of the individual author(s) and contributor(s) and not of MDPI and/or the editor(s). MDPI and/or the editor(s) disclaim responsibility for any injury to people or property resulting from any ideas, methods, instructions or products referred to in the content.

