Article

Investigating the Technical Reuse Potential of Crystalline Photovoltaic Modules with Regard to a Recycling Alternative

1
Institute for Technical Energy Systems (ITES), Hochschule Bielefeld—University of Applied Sciences and Arts, 33619 Bielefeld, Germany
2
Faculty of Engineering and Mathematics, Hochschule Bielefeld—University of Applied Sciences and Arts, 33619 Bielefeld, Germany
*
Author to whom correspondence should be addressed.
Sustainability 2024, 16(3), 958; https://doi.org/10.3390/su16030958
Submission received: 11 December 2023 / Revised: 5 January 2024 / Accepted: 16 January 2024 / Published: 23 January 2024

Abstract

:
Photovoltaics (PV) is a key pillar of renewable energy supply. However, the climate and resource crisis make it necessary to implement further optimizations toward a circular economy in the PV industry. One strategy for saving resources and lowering carbon dioxide emissions is the reuse of modules (second-life PV). As part of this work, various tests were carried out with crystalline modules from two different manufacturers. The modules had already been transported to a recycling company and were originally intended for recycling. The measurements carried out provide a comprehensive assessment of the condition of the PV modules. In total, five different measurement methods were used, two of which related to short-term measurements under controlled laboratory conditions and three to long-term assessments under real conditions. The investigation illustrated that modules from the recycling company have potential for reuse. However, it also showed that a clearly differentiated classification system is necessary due to module age- and environmental conditions-related degradation. Qualification and further long-term measurements should be implemented using a combination of measurement methods.

1. Introduction

In times of climate change and resource crises, it is important to establish regenerative energy supplies and build sustainable and circular structures. Photovoltaics (PV) is already providing a large contribution to this. However, the problem lies in the linear structure of the PV industry, which leads to increasing amounts of PV waste. Global PV waste generation is estimated to reach 60–78 million tons cumulative by 2050 [1]. Currently established recycling structures lead to downcycling processes and, consequently, to a loss of resources due to robust module designs and premature high-quality recycling structures. One of the major problems with recycling is that materials are contaminated, e.g., by cullet with metal components or refining agents for glass production, and therefore cannot be recovered with high quality [2,3].
The concept of a circular economy aims to overcome the current linear economic model of “Take, Make, Waste”. By establishing a new way of thinking and holistic innovation, the aim is to create cycles in which raw materials function as nutrients, waste is avoided and, in the best case, added value is created for people and the environment [4,5]. Moreover, a circular economy offers further approaches besides recycling to create sustainable value chains and therefore prevent waste and lower carbon dioxide emissions. The 9R Framework is an approach to conceptualize the different facets of a circular economy, such as remanufacturing, recycling and the principle of reuse [6,7]. For the PV industry, reuse means that demounted PV modules are reinstalled in other locations after appropriate quality control. Potential cases are modules from partly damaged systems or systems with expired subsidies, as well as overproduction. A study on the preventive maintenance of PV systems has also shown that it can be economical to replace individual modules within a system at a certain performance level [8]. However, this approach can lead to a waste of resources and is therefore also a starting point for the reuse approach. The exchange with PV recycling companies illustrates that many of these modules also end up at recycling companies although, at first glance, there is potential for reuse. However, estimating the exact reuse potential of the modules at recycling companies is a research gap. The four main causes for degradation in the field are irradiation, temperature, humidity and mechanical load [9]. In the second-life sector, additional stress is added to the impact in the field by the disassembly, transportation and storage between applications. Current aging predictions are based on laboratory testing using accelerated aging and degradation models [10]. In the best case scenario, PV plants are monitored in the field and modules are checked using drone thermography, for example. However, these tests are very time-consuming and are not carried out with every module in the field [9]. In addition, this information from the field is lost on the way to recycling companies and no information about the condition of modules at the recycling companies is available.
Initial reuse approaches are already being tested in practice and have been implemented on a small scale. This includes the offer of test and repair services. The company 2ndLIFESOLAR, for example, offers mobile test stations [11]. Providers of repair services and the sale of reuse modules include pvXchange, Second Sol, Rinovasol and Solar-pur GmbH [12,13,14,15]. Another actor in this field is the company Reiling PV-Recycling GmbH & Co. KG, Münster, Germany [16]. Reiling operates the first pure PV recycling plant in Germany and is currently establishing its first activities in the second-life sector. As a recycling company, Reiling receives modules from various origins that are destined for recycling. However, several of these modules do not show any defects at first view and therefore have the potential for reuse applications.
Despite many promising approaches, there are many challenges in the second-life business. As already described, the data quality is very limited. Digital information about the history of the modules is not available. It is difficult to make statements about the failure rates of modules based on real data, especially since module technology is constantly evolving and the availability of monitoring data is limited. In addition, there is a non-standardized recertification process across the whole PV industry [17,18]. This makes product risk management more difficult and leads to customer-unfriendly business models without product warranties. Moreover, from the point of view of the companies, the business models are currently only economically viable in market niches [18]. As a result, the business model is mainly used for systems in developing countries, where the requirements are lower. This has the major disadvantage that if modules are finally no longer usable, no proper recycling takes place and environmental pollution is the result [17].
The aim of this paper is to provide an overview of the reuse potential of crystalline PV modules that were originally destined for recycling, based on condition tests and the performance of initial long-term measurements. The selected module sample does not claim to be representative but serves as a first assessment of modules at a recycling company and a test of the measurement methodology for reuse applications. The investigation is divided into the selection of the module sample, the implementation of five different measurement methods and the evaluation of the results regarding the reuse potential of the modules, as well as the measurement methodology. The five measurement methods were structured as follows. First, a thorough assessment was carried out using a solar simulator (1) and an electroluminescence test (2) during short-term measurements under controlled laboratory conditions, which served as a basis. This was followed by a detailed examination via visual inspection with the human eye/digital camera (3), complemented by a thermal imaging camera (4). Finally, a characteristics measurement (5) was carried out through long-term assessment under real conditions, which provided a comprehensive overview of the durable performance of module condition over time.

2. Materials and Methods

2.1. Module Sample

To investigate the aging behavior and condition of potential second-life modules, a sample was selected. The modules used were provided by the recycling company Reiling. The sample consisted of 13 TSM-245PC05 modules and 3 PW-1650 modules. Based on the condition tests, the sample size for further measurements was reduced to 6 TSM-245PC05 modules and 3 PW-1650 modules. The sample modules are listed in Table A1 in Appendix A. The modules in the reduced sample are marked with * after the serial number.
The specific characteristics of the modules are shown in Table 1. The general information was taken from the data sheets of the modules. The time stamps on the data sheets also allowed for an estimate of the ages of the modules. Therefore, two polycrystalline module types, each with an approximate age of 10 and 20 years, were used as the sampling basis. From the manufacturer’s performance guarantee information, which amounts to a linear degradation of 0.8% per year for both modules, the granted power of the modules at the start of the investigations was determined [19,20].
Due to the preselection process at the recycling company, modules with immediately visible glass breakage or defective connection cables were filtered out. In addition, only polycrystalline modules from the two mentioned manufacturers were suitable for further testing at the time of sampling.

2.2. Condition Testing with Sun Simulator (1) and Electroluminescence Test (2): Short-Term Measurements under Laboratory Conditions

The condition tests were performed using an MBJ Mobile PV-Testcenter (MBJ Solutions GmbH, Ahrensburg, Germany), based on the IEC 60904-9 standard [21,22].
The first test with the sun simulator was a characteristic curve measurement under laboratory conditions. The sun simulator reproduced the solar spectrum with an air mass of 1.5 via a flash of light. The modules were illuminated with a homogeneous illumination of 1000 W/m2. The correction of irradiance and temperature to standard test conditions (STC) was conducted according to IEC 60891 [23]. In addition, connection tests using a diode test and hipot (high potential) test were performed in the test device. The hipot test was used to ensure the insulation strength of the module. The result of the curve measurement was a current–voltage (I–V) characteristic curve of the tested module, including short-circuit current, open-circuit voltage and maximum power point (MPP), with an accuracy of the power of ±1%. The determined nominal power allowed us to draw conclusions about power degradation. The characteristic curve could also provide information on the causes of degradation.
The second part of the condition test was performed using an electroluminescence test device. Due to forward pass operation, light emission was enabled. This was recorded with the use of a charge-coupled device (CCD) camera. The result of the measurement was electroluminescence images of the individual cells, which could provide information about microcracks and voltage-induced degradation [9].
These measurements were carried out one year before the long-term methods with the 13 TSM-245PC05 modules on behalf of Reiling. The modules were stored in a roofed warehouse during this year. These measurements were not carried out with the PW-1650 modules. The modules of the reduced sample were transported from the recycling company to the University of Applied Sciences and Arts and mounted on the roof for long-term testing. The results here refer to the first life of the modules and are therefore included in this study as a starting point.

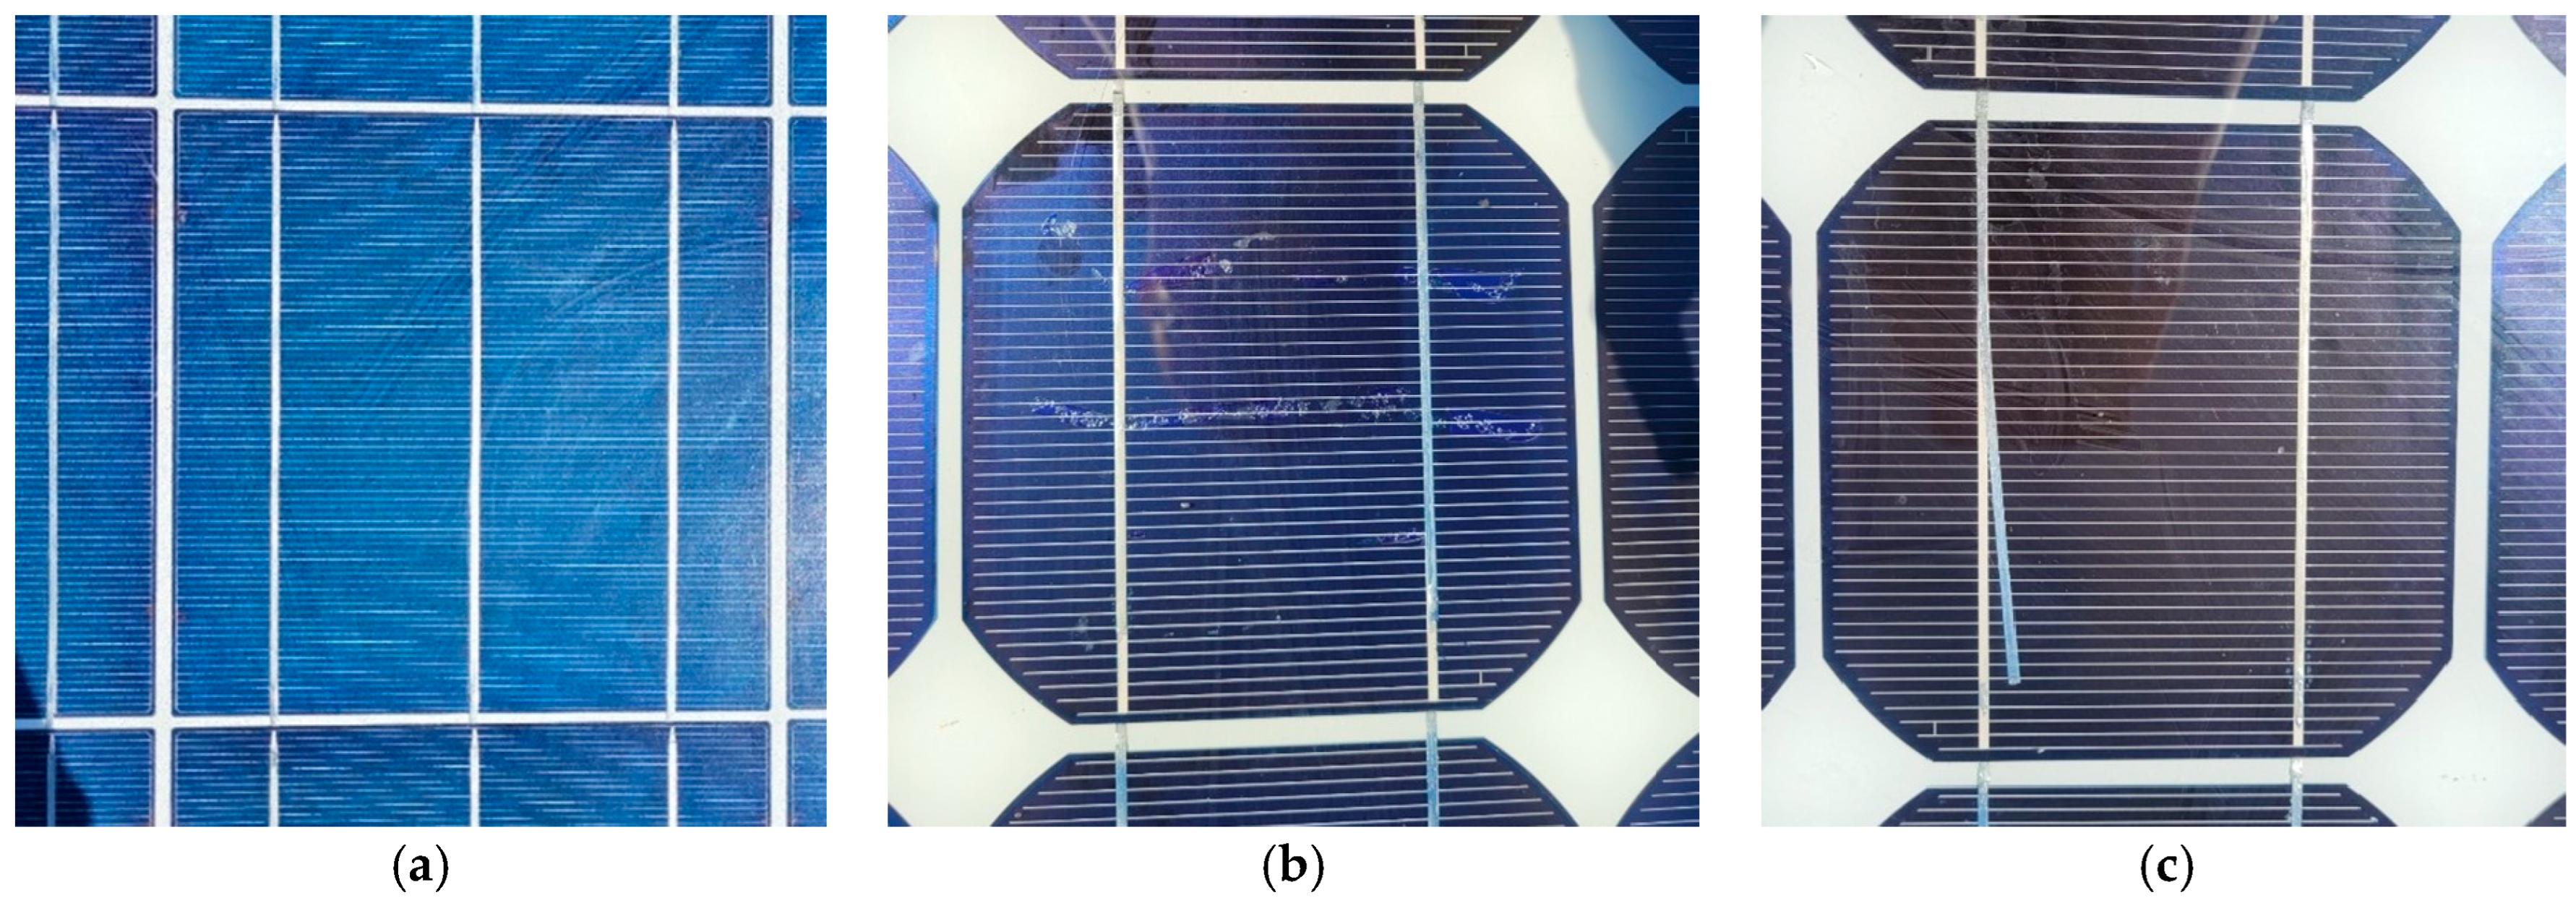
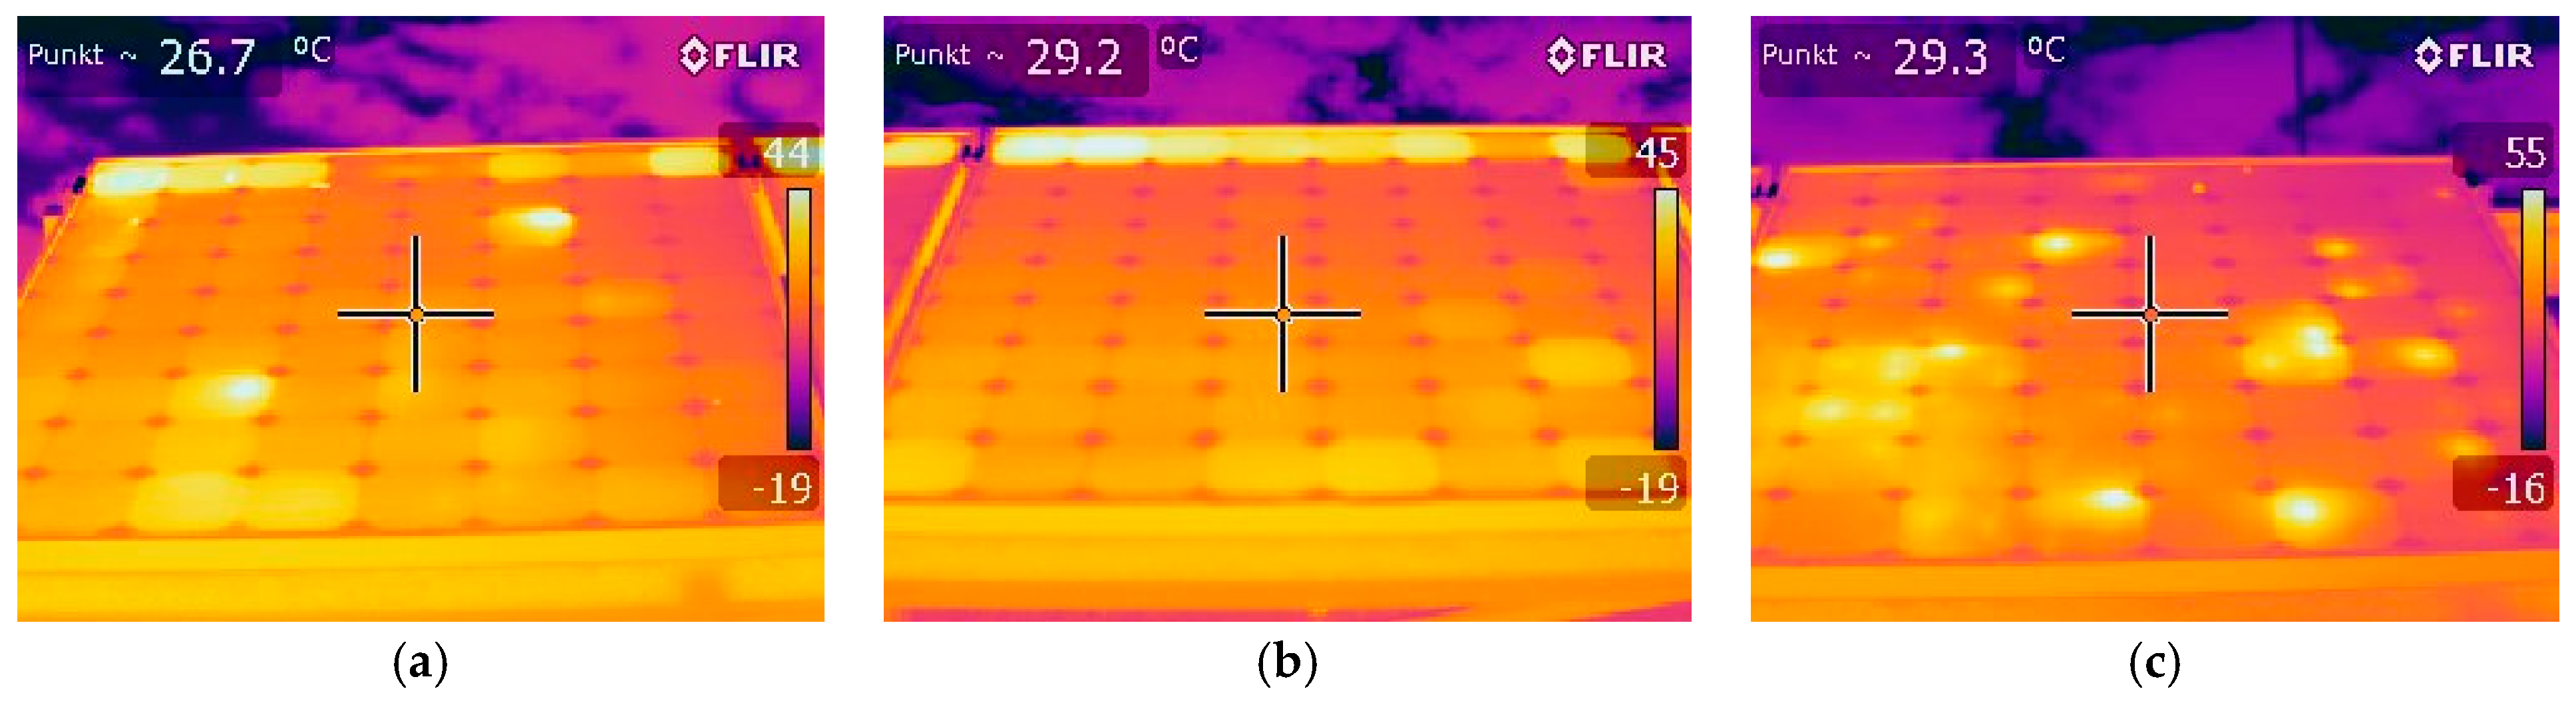
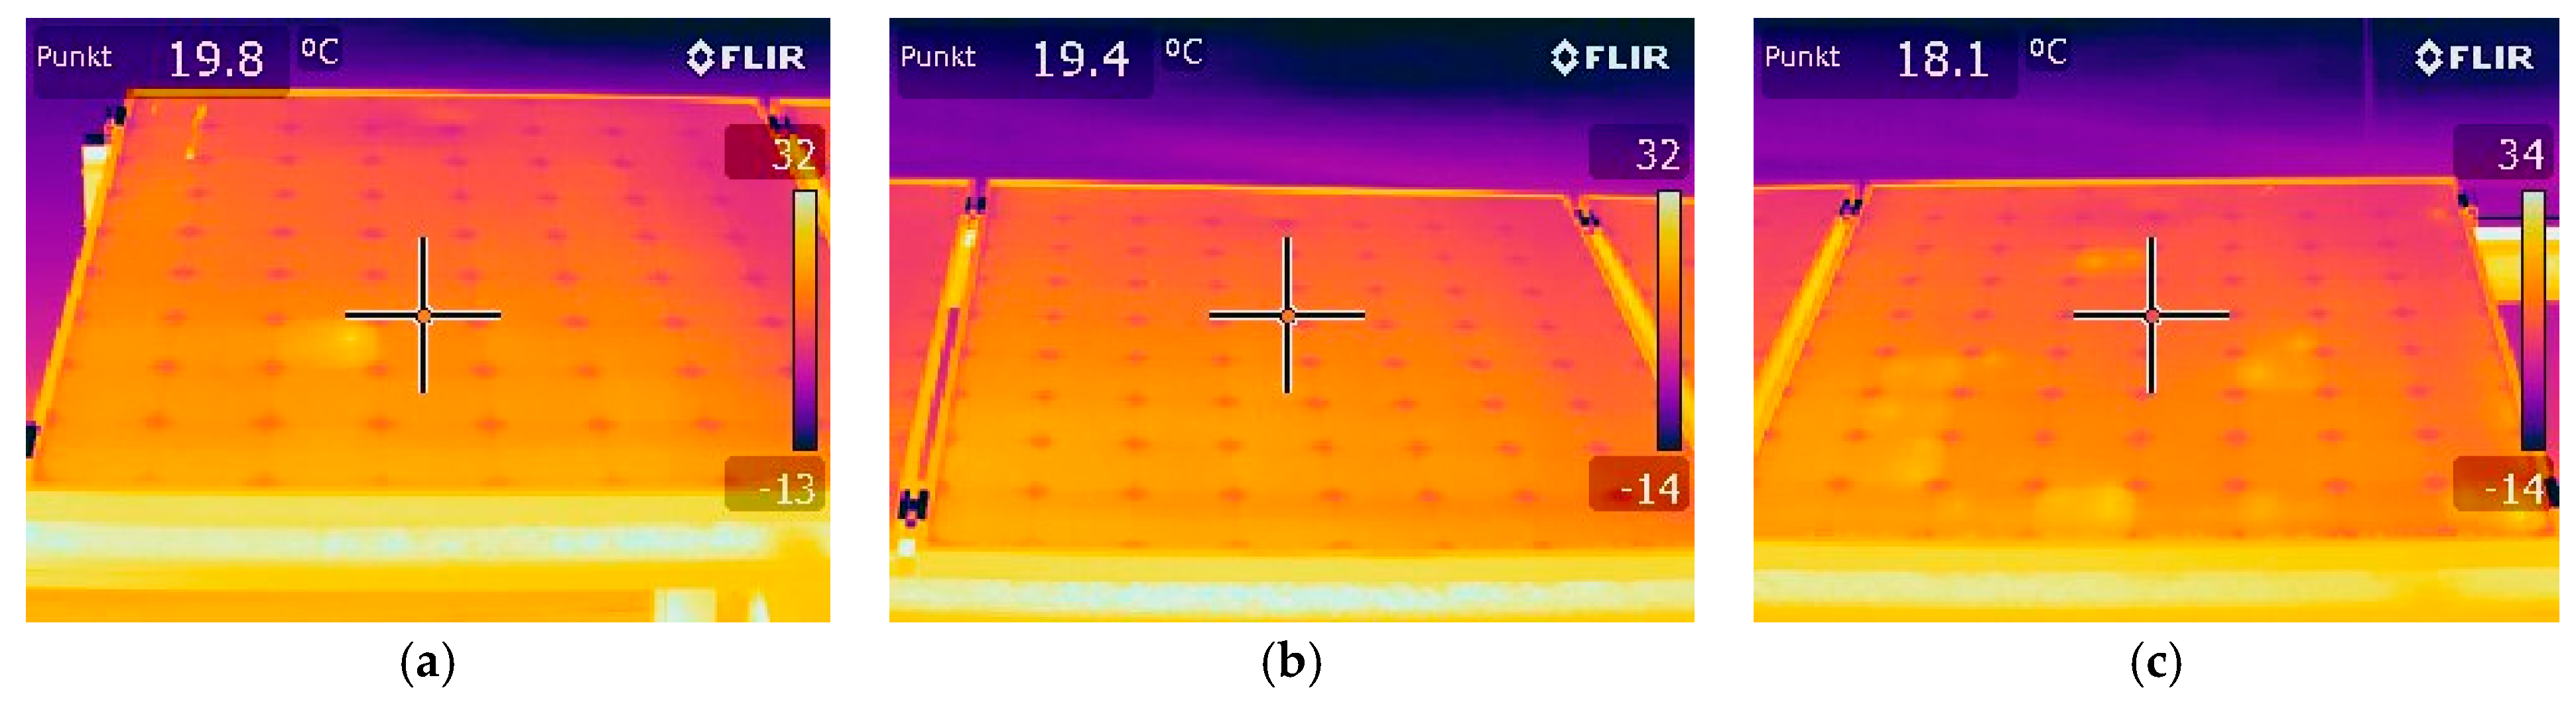
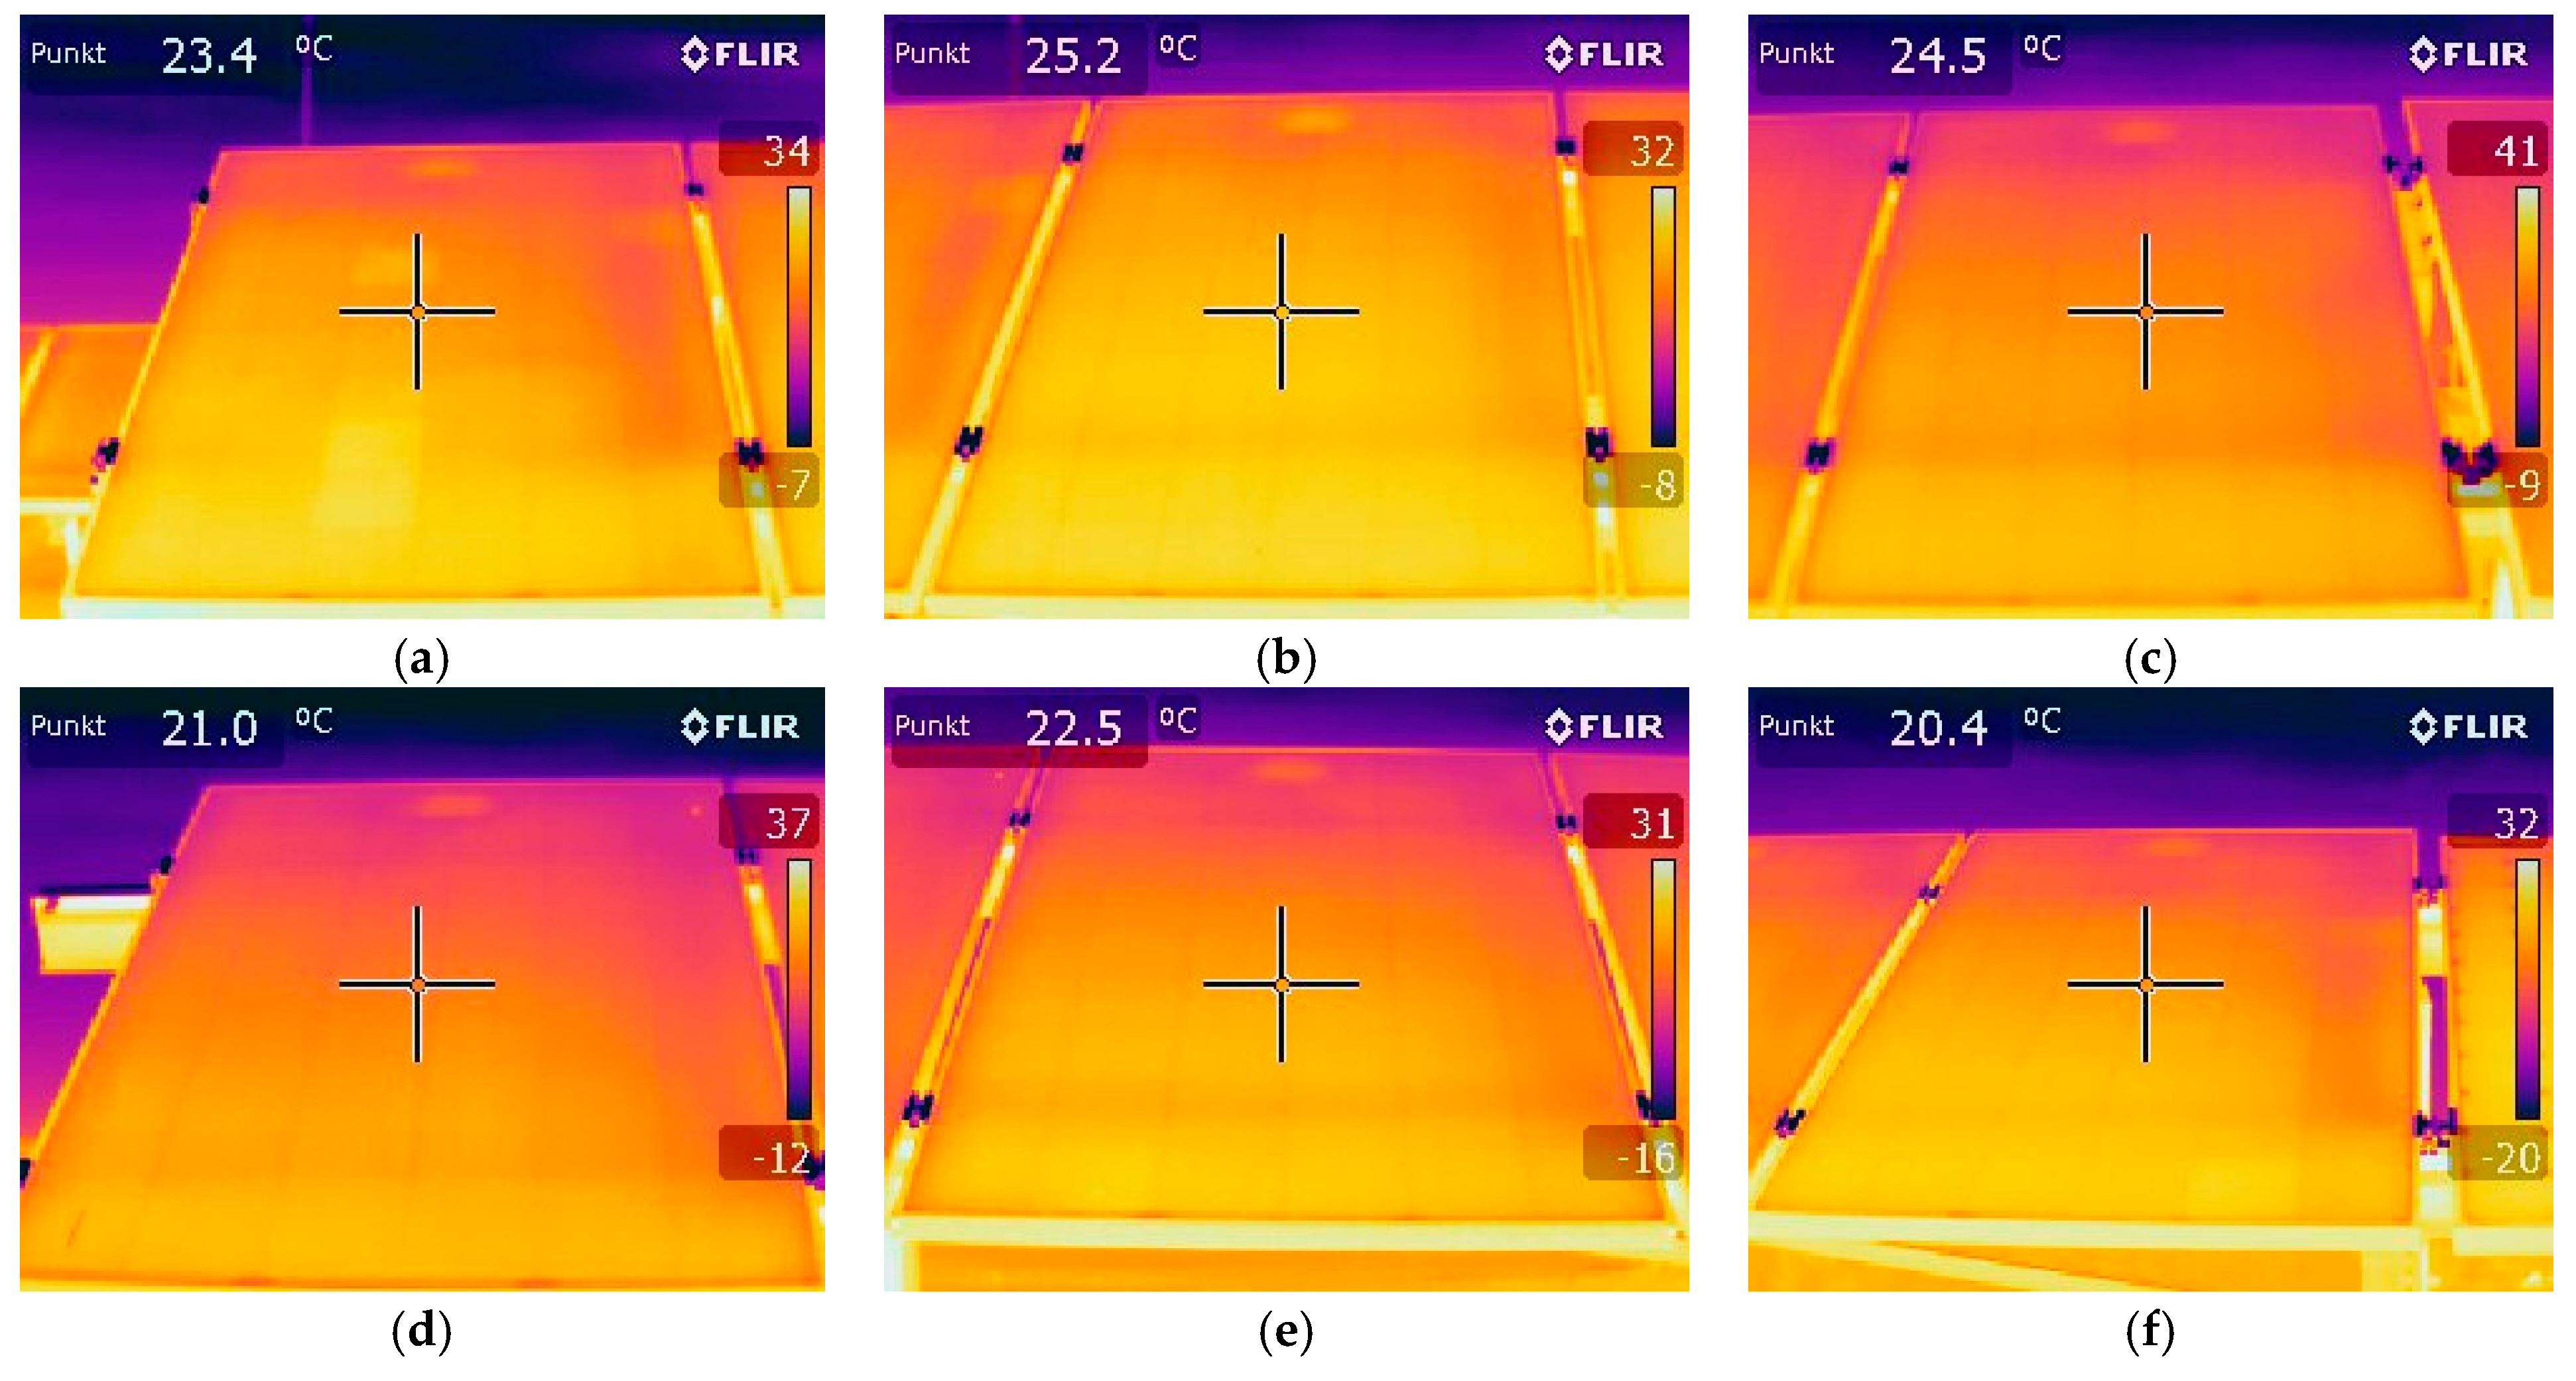
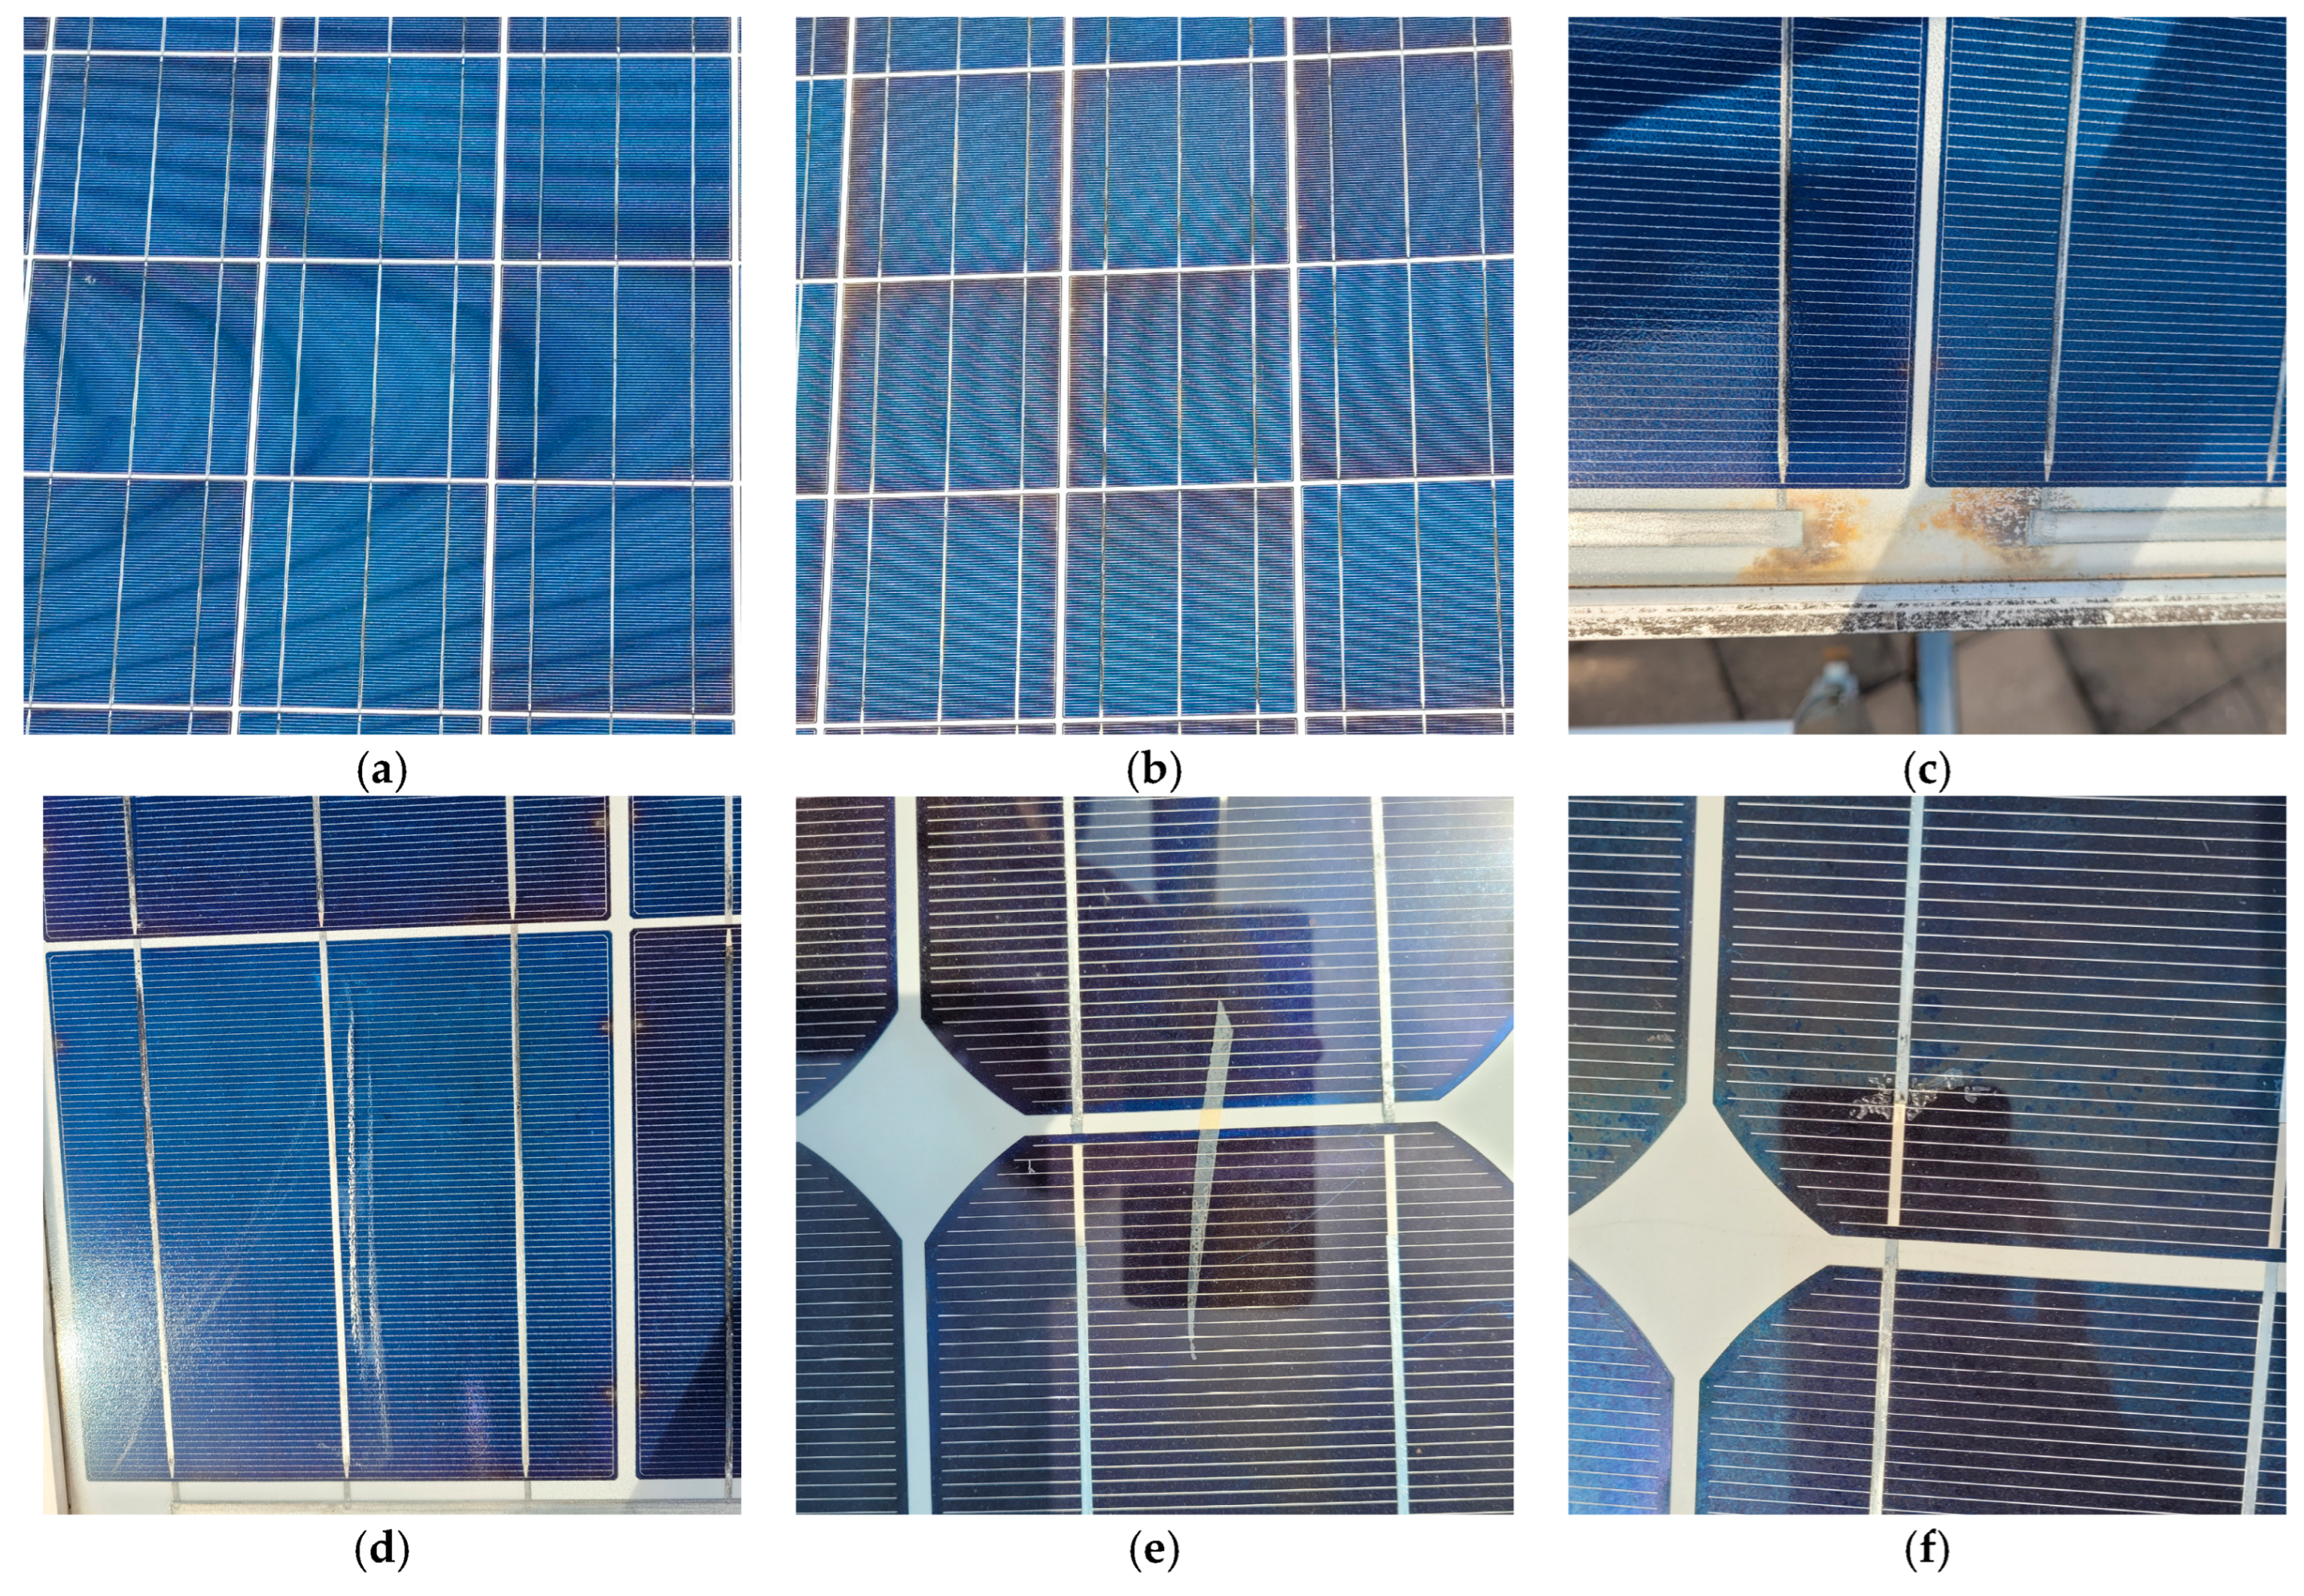
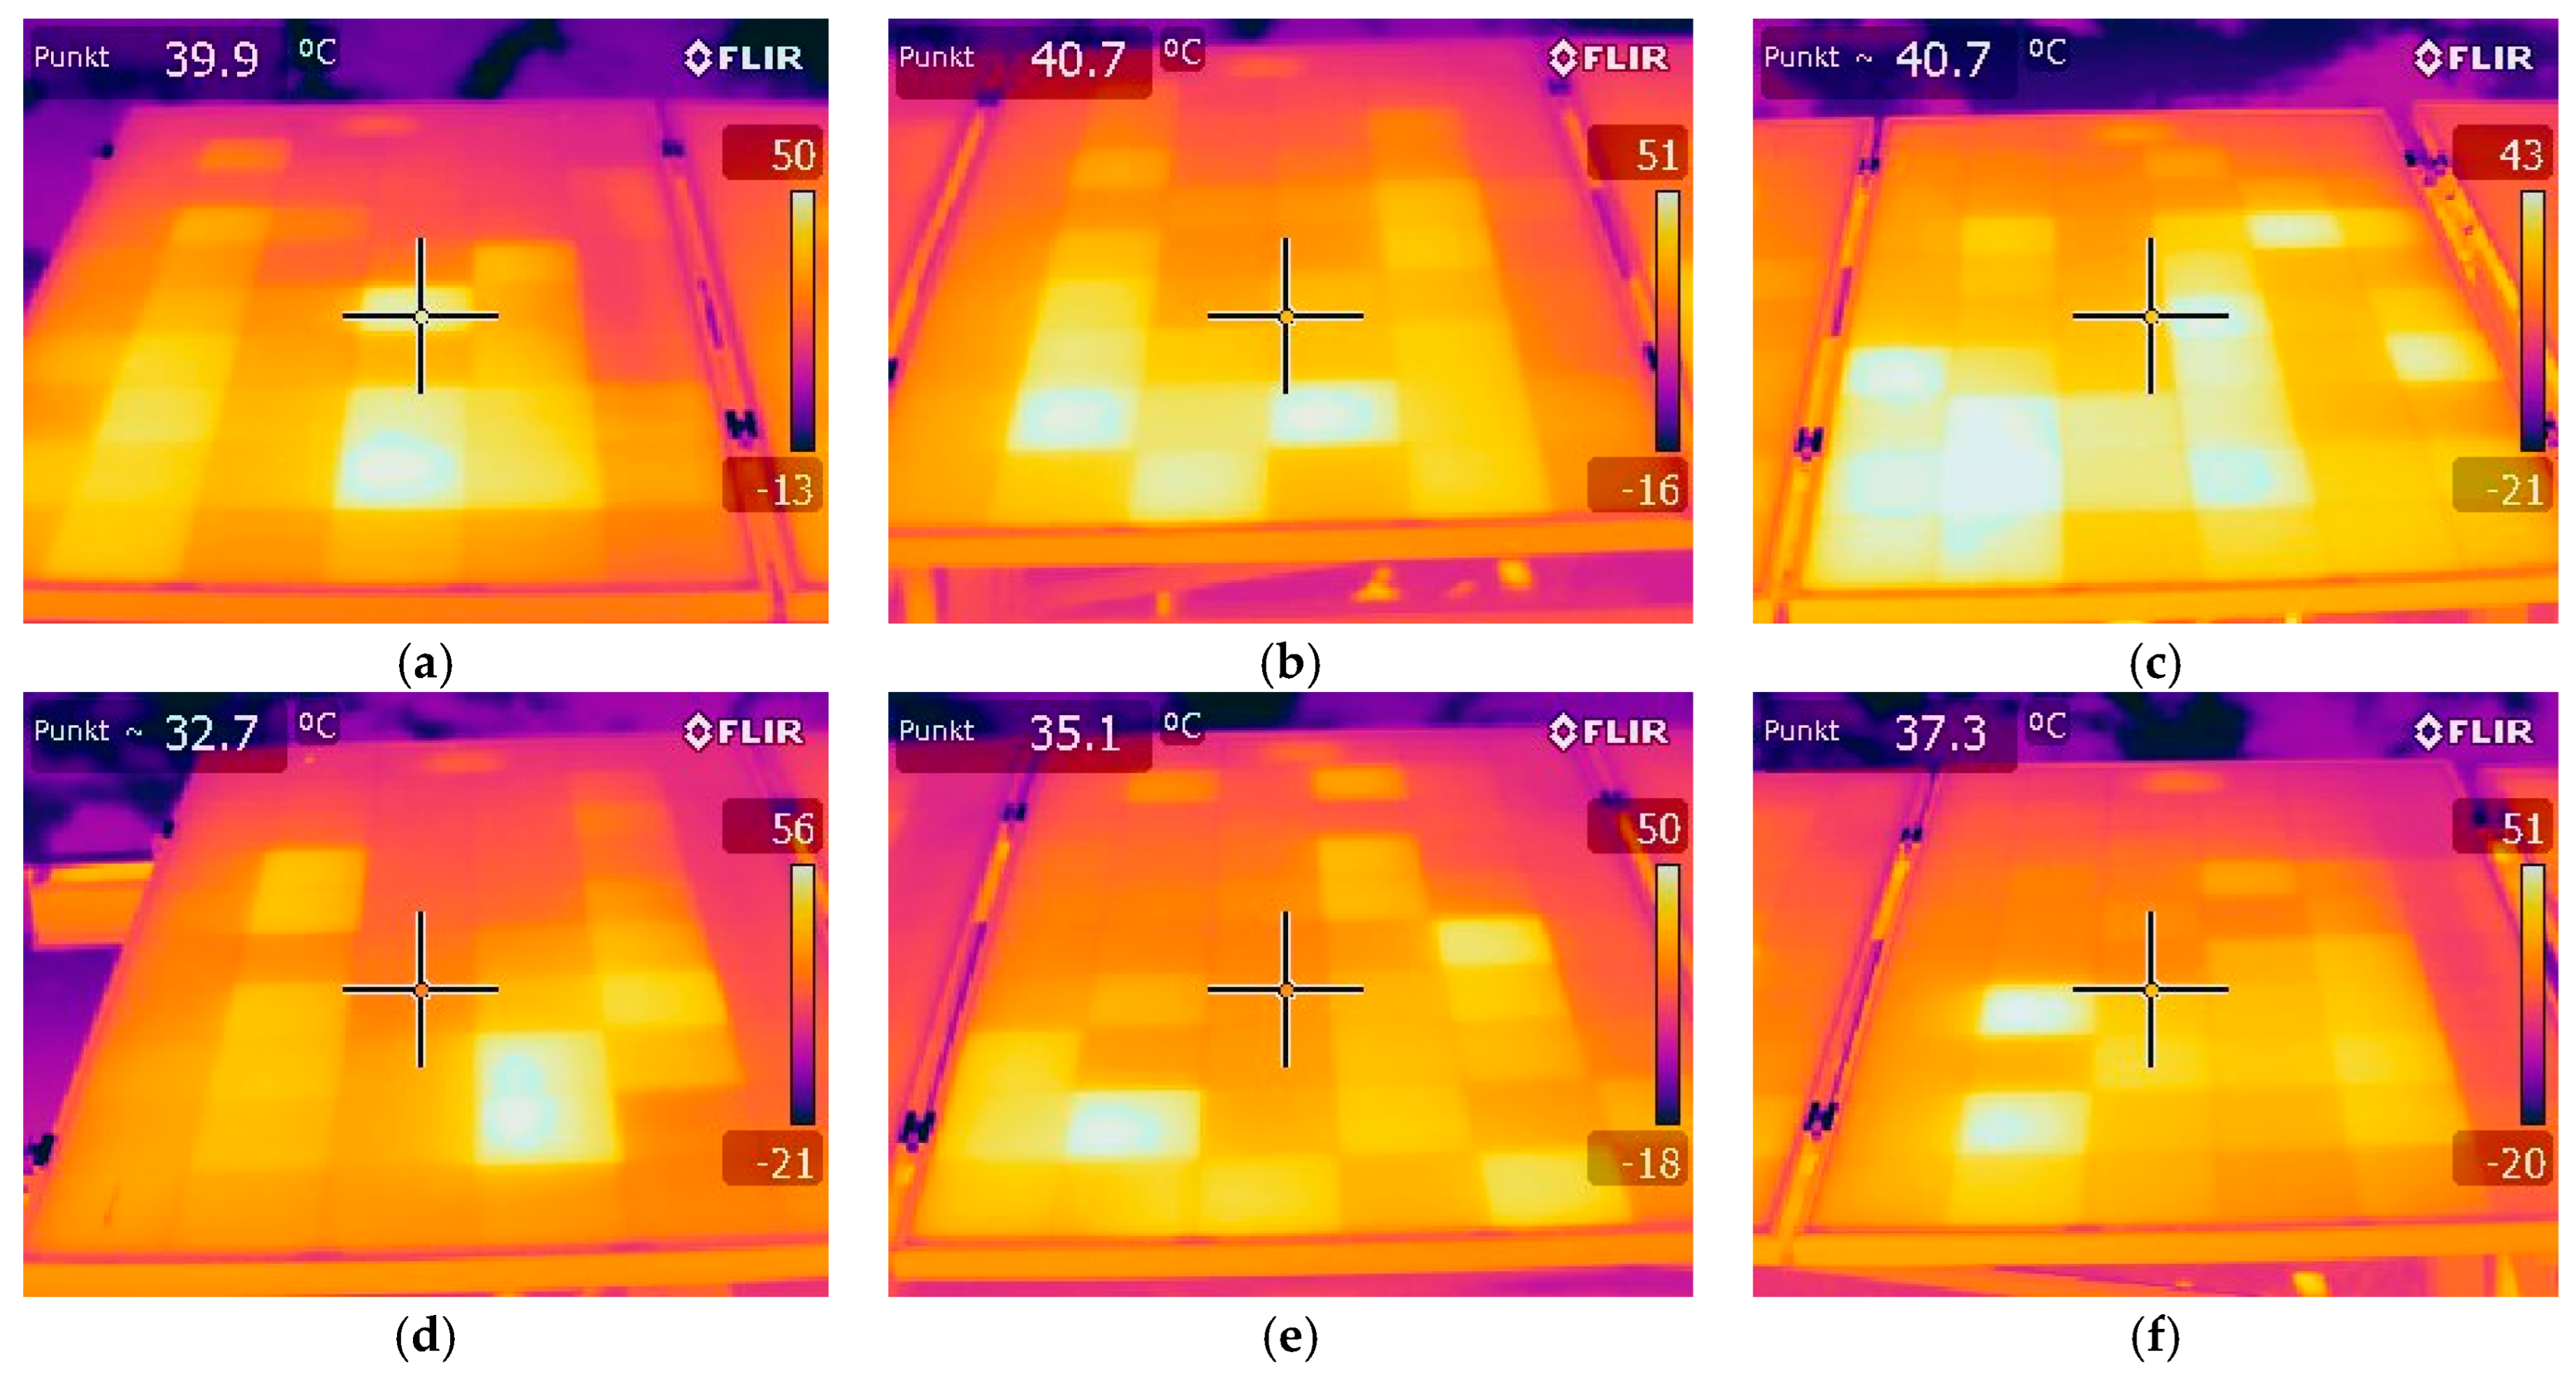
2.3. Visual Inspection with Digital Camera (3) and Thermal Imaging Camera (4): Long-Term Measurements under Real Conditions

The first stage of visual inspection was an investigation with the naked eye and a digital camera with a resolution of 12 mega pixels (3). This method was used to detect aging degradation and defects, such as the following:
  • delamination, browning, yellowing and bubble formation in module front;
  • broken regions, cracks and the discoloring of antireflection coating in module cells;
  • the burning and oxidization of metallization;
  • the bending, breakage, scratching and misalignment of module frames;
  • delamination, yellowing, scratching, burning and bubble formation in module back;
  • the corrosion, oxidation and looseness of junction box;
  • the brittleness, detachment and exposure of electric components in connectors and/or wires [9].
This examination can be performed at periodic intervals before and after exposure to stress. Since visible differences only become apparent over a longer period, examinations at intervals of one year were used. Consequently, this method was performed on all nine modules in the reduced sample at the beginning and end of the analyzed period.
The second stage of the visual inspection was an investigation with a thermal imaging camera (4), which was used primarily for fault localization. Moreover, a linear relationship between temperature difference and power loss could be assumed [9]. The FLIR E50 Thermal Imaging Camera (Teledyne FLIR LLC, Frankfurt am Main, Germany) was used to properly assess the thermal properties of the solar modules and draw conclusions about hotspots [24]. The camera allowed thermal pictures with a resolution of 240 × 180 pixels to be taken. The measured temperatures had an error margin of ±2 °C or ±2%. Additionally, the camera had a thermal sensitivity of <0.05 °C. During the recording of thermal pictures, normal digital pictures were also taken simultaneously.
These measurements were carried out in the last quarter of the analyzed period and were performed on all nine modules in the reduced sample. To obtain more complete and detailed information about the modules, the measurement was divided into two parts: one under electrical load and one in short circuit. Each measurement took place on a different day to avoid measurement errors due to system inertia. In order to be able to compare the measurements, the measurements were all carried out at roughly the same time, between 11 a.m. and 3 p.m., and under approximately the same conditions.

2.4. Characteristic Measurements (5): Long-Term Measurement under Real Conditions

The characteristic curve measurement under real conditions was carried out using a mobile characteristic curve measuring device by TRIENERGY Schweiz AG (Olten, Switzerland), called TRI-KA. The measurement uncertainty for voltage and current was specified by the manufacturer as less than 1%. In addition to the characteristic curve, the irradiation and module temperature were recorded using a reference solar cell and the temperature sensor of the TRI-SEN device [25]. The measuring range for temperature was 0–100 °C, with a measurement uncertainty of 3% in relation to a black body. The measuring range for irradiation was between 100 W/m2 and 1200 W/m2, with a measurement uncertainty of 5%. This allowed the characteristic curve to be extrapolated to STC, according to IEC 60891. The result of the measurement, comparable to methodology (1), was an I–V curve of the tested module, including short-circuit current, open-circuit voltage and MPP. The determined nominal power allowed conclusions to be drawn about power degradation. A lower short-circuit current can, for example, be caused by a failure of the encapsulation or delamination, whereas a lower open-circuit voltage indicates a failure of the cell connection, short circuits in the cells or light- or potential-induced degradation [9]. The shape of the characteristic curve could also provide information about the causes of degradation. For example, the slope of the I–V curve near the short-circuit current usually corresponded to a decrease in shunt resistance and a lower slope near the open-circuit voltage usually corresponded to an increase in series resistance [9].
These measurements were initially performed over a period of three months at intervals of approximately two weeks. In the further procedure, the characteristic curves of all modules in the reduced sample were recorded in the last quarter and at the end of the investigation period of one year. The results refer to the simulated second life of the modules.

3. Results

3.1. Condition Testing with Sun Simulator (1) and Electroluminescence Test (2)

The pre-tests, including connection, diode and hipot tests, were positive for all modules. Table 2 shows the results of the condition tests. On the left side are the results of the sun simulator test (1) and on the right side are the results of the electroluminescence test (2). The characteristic curves did not show any particular anomalies. The power loss was very low for all modules. They ranged from 0.2% in the best module to 2.9% in the worst module. The loss of short-circuit current was slightly lower than that of open-circuit voltage in nominal percentage. For short-circuit current, the loss ranged from 0.00% to 2.30%. For the open-circuit voltage, the loss was between 1.55% and 2.32%. The fill factor of the modules ranged from 0.748 and 0.768.
In the electroluminescence test, no cells were rated as very critical due to an affected cell area of more than 20%. A maximum of seven cells were conspicuous in any module. Figure 1 visualizes the state of a critical cell and a non-critical cell as examples. In the case of an uncritical cell, less than 1% of the cell surface shows abnormalities. In a critical cell, 1–20% of the cell surface is affected.

3.2. Visual Inspection with Digital Camera (3) and Thermal Imaging Camera (4)

During the first inspection of the modules using a digital camera in September 2022, the six Trina Solar modules did not show any particular abnormalities. The condition of the module surface of module TSM-245PC05-6120217500442 is shown as an example in Figure 2a. In contrast, the Photowatt modules were already conspicuous at the beginning of the observed period. Module PW-1650-01 showed no visible abnormalities at the beginning; however, bubbles formed in the encapsulation material of module PW-1650-02 (Figure 2b). In module PW-1650-03, one busbar became detached (Figure 2c).
The examination at the end of the period under consideration (the end of August 2023) showed changes in the condition of the modules. The Trina Solar modules continued to be the most inconspicuous. However, black corrosion spots formed on the busbars. In Figure 3a,b, modules TSM-245PC05-6120217500442 and TSM-245PC05-5120213004347 are shown as examples. In addition, there was clearly visible corrosion on the lower busbars of module TSM-245PC05_6120217500329 (Figure 3c) and a scratch on the surface of module TSM-245PC05-5120213004347 (Figure 3d). The formation of bubbles in the encapsulation material was particularly noticeable in the Photowatt modules. New bubbles formed in module PW-1650-01 (Figure 3f), whereas none had been observed previously. The formation of bubbles increased in module PW-1650-02. In addition, damage to the antireflection coating occurred in module PW-1650-01 (Figure 3e).
The thermographic measurements under load in the MPP range showed the operating states of the modules (Figure A1 and Figure A2 in Appendix B). In the operating state, the first brighter cells could be seen on the Trina Solar modules. Anomalies were particularly visible on the TSM-245PC05-6120217500442 module and slightly visible on the TSM-245PC05-6120217500329 module. On the TSM-245PC05-5120213004347 module, cooler stripes could also be seen on the cell in the bottom left-hand corner. Apart from a slight warming of the junction box and a temperature gradient from top to bottom, the other modules were unremarkable. Among the Photowatt modules, the PW-1650-03 module in particular showed bright spots. In contrast, the PW-1650-01 module only had one significantly brighter spot and the PW-1650-02 module was inconspicuous.
In the thermography measurements in the short circuit, the differences between the cells became even clearer due to the higher current, as illustrated in Figure 4 and Figure 5. Many different cell temperatures could be seen in the Trina Solar modules. The area at the bottom left of the TSM-245PC05-5120213003847 module was particularly noticeable. In two of the Photowatt modules (PW-1650-01 and PW-1650-02), the upper rows of cells were particularly hot. The PW-1650-03 module did not show the complete heating of cells, but rather spot heating distributed across the module.

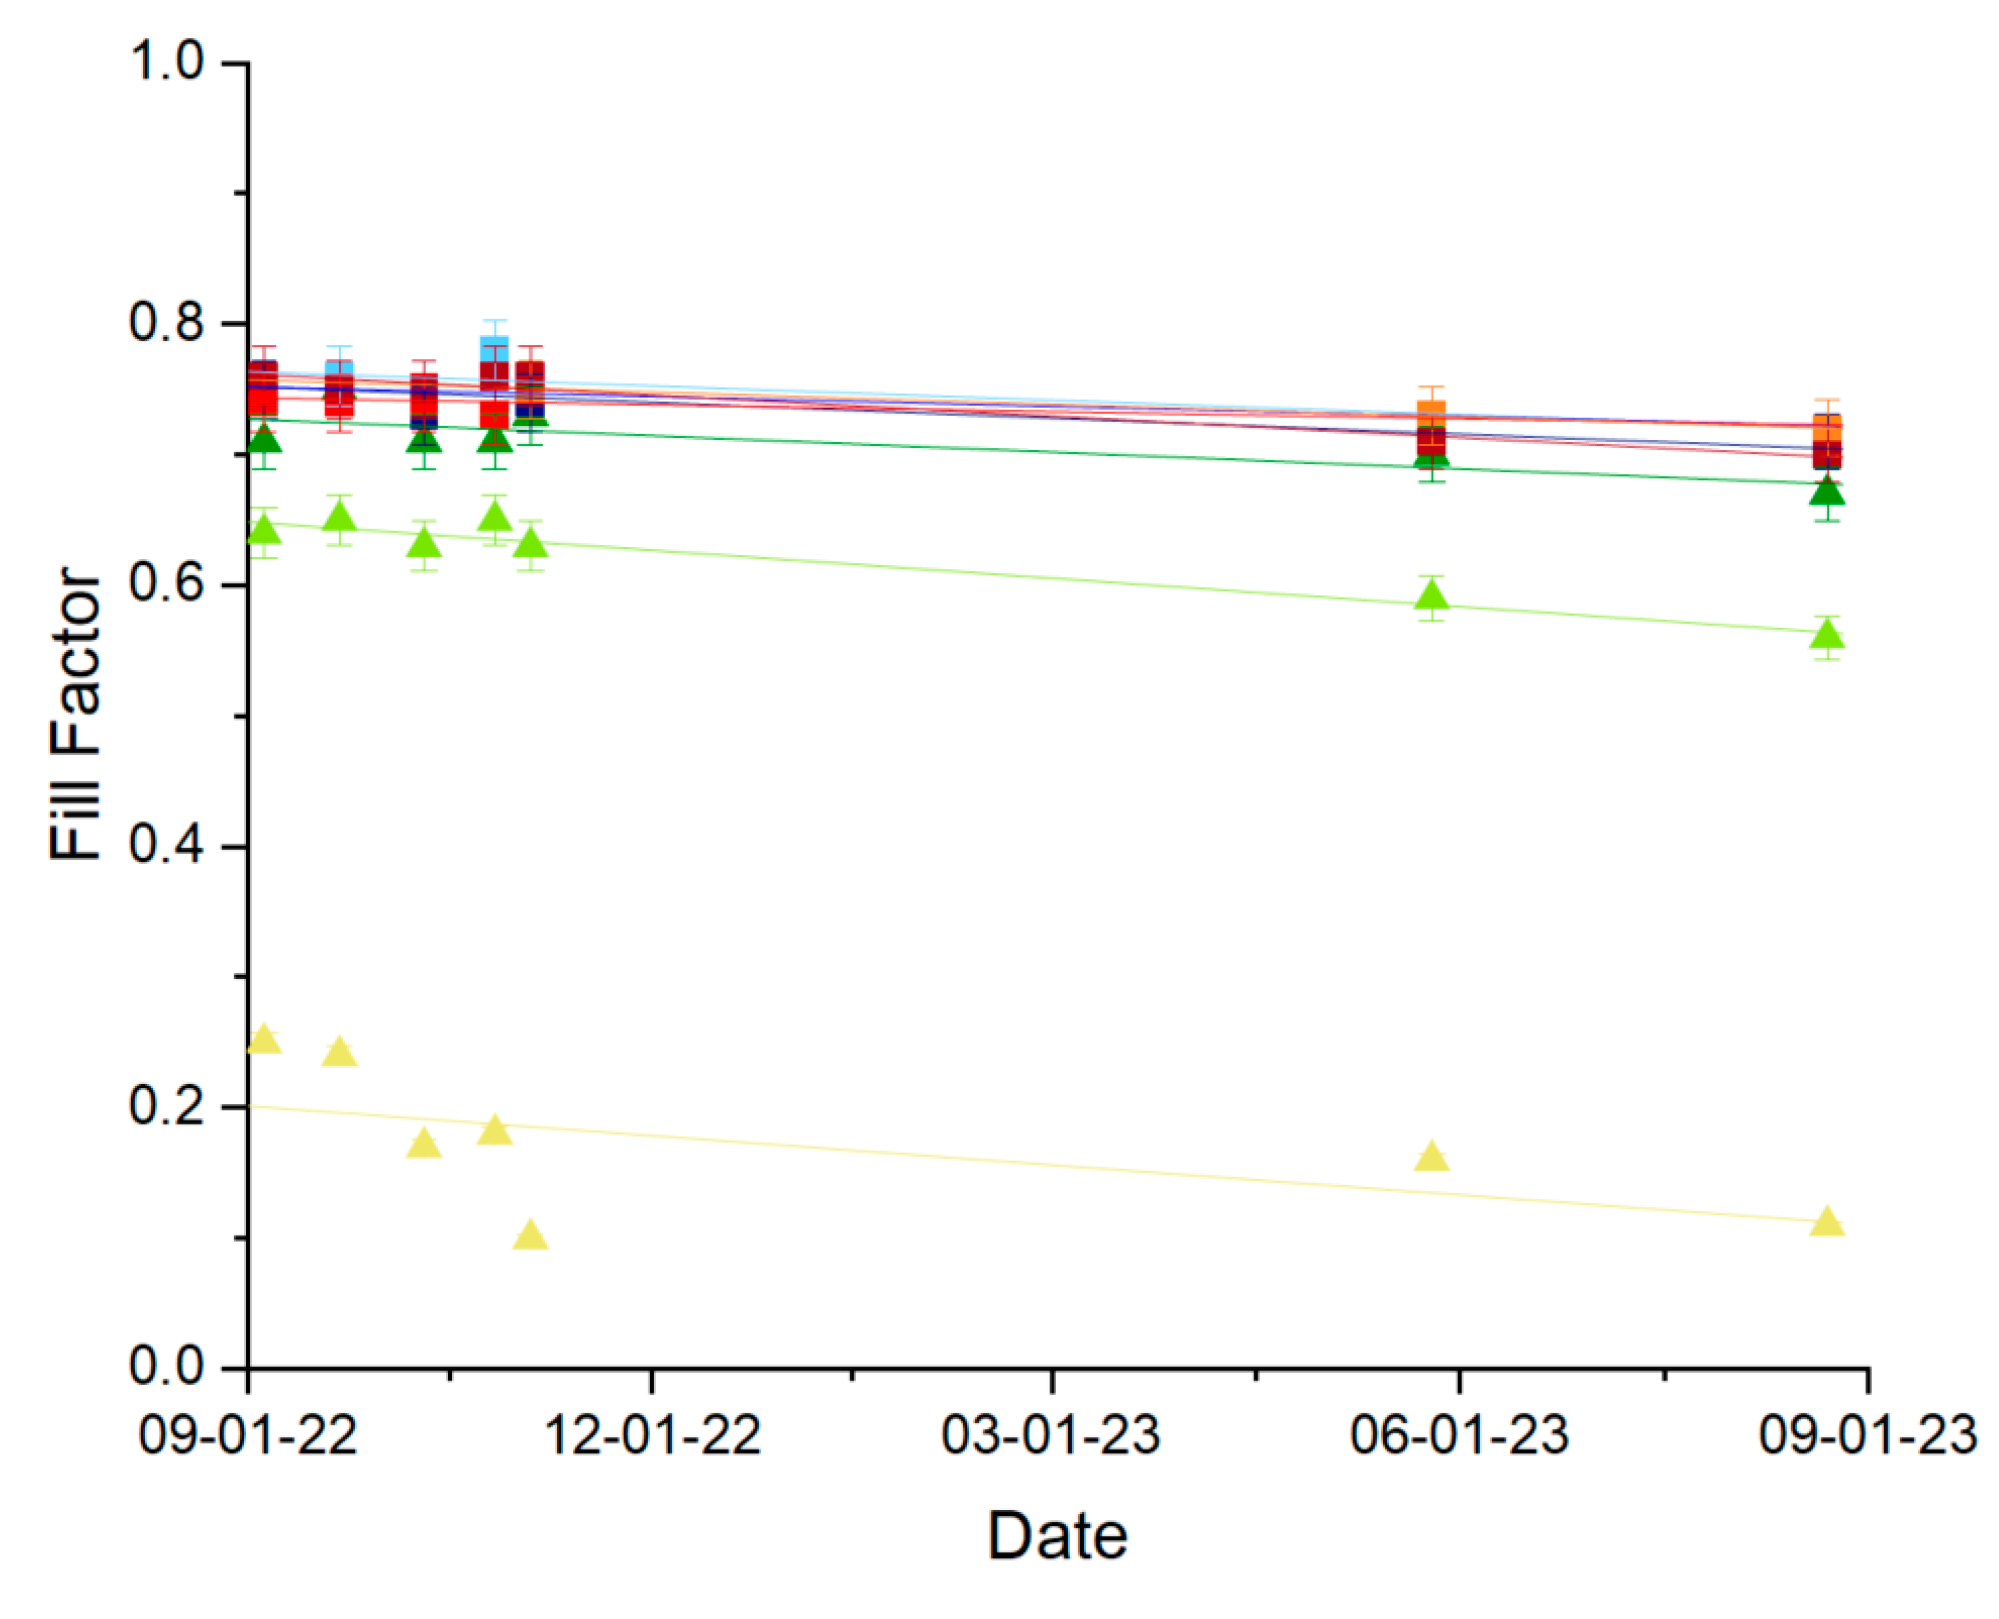
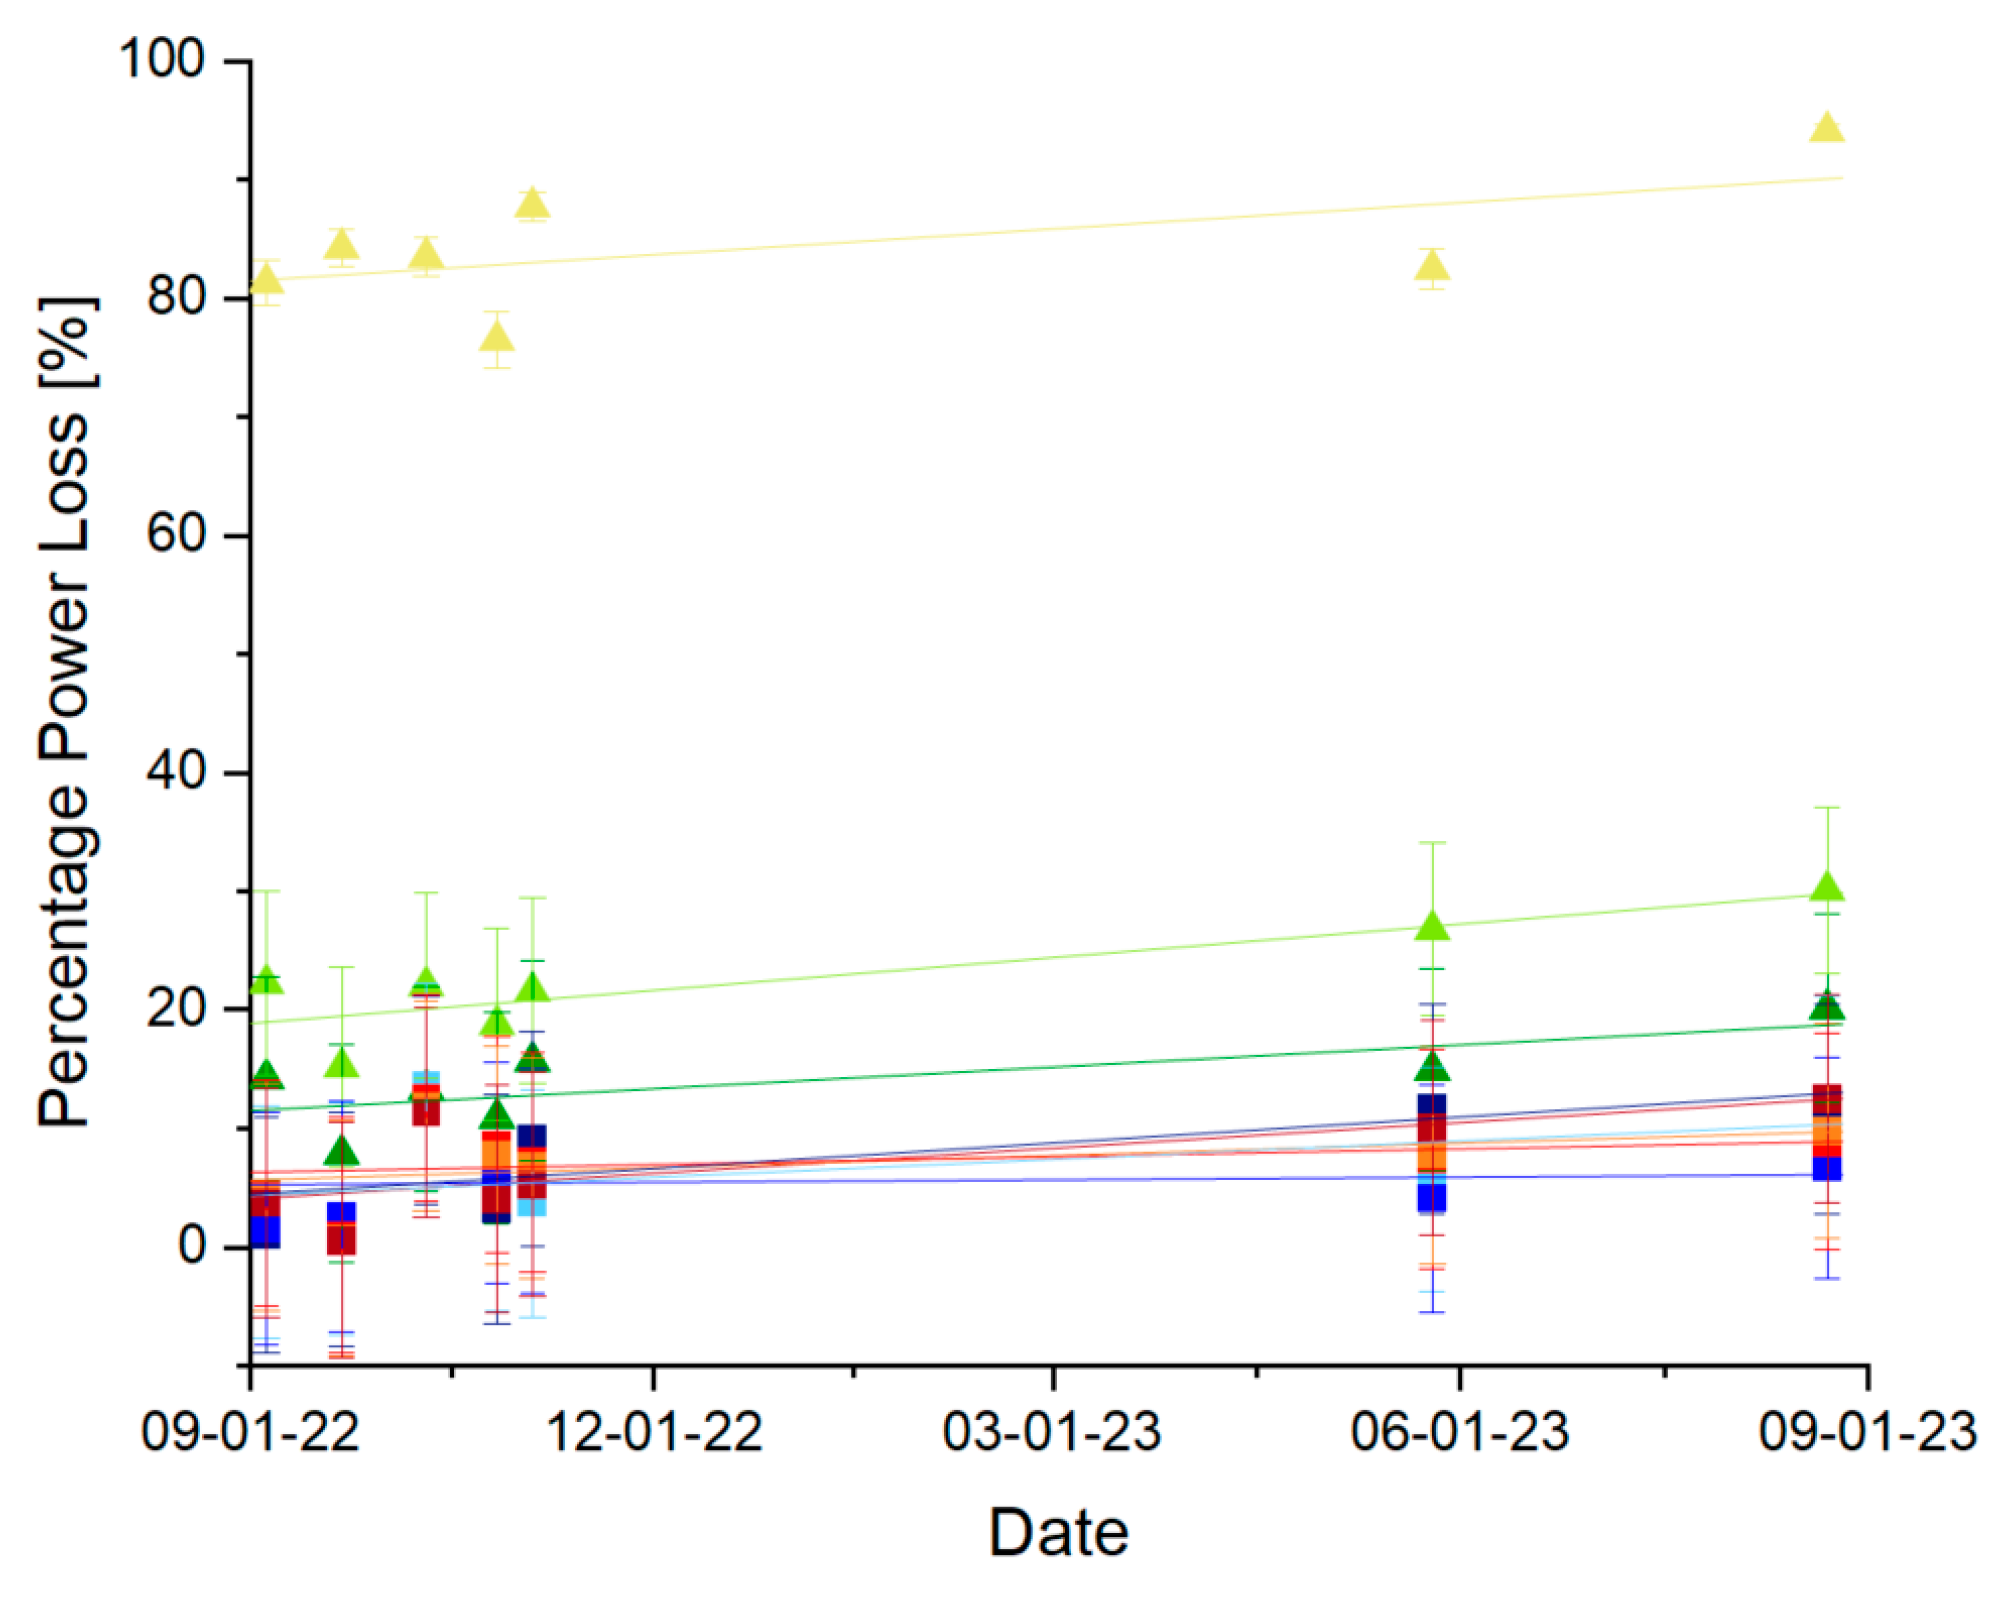
3.3. Characteristic Measurements (5)

The characteristic curves of the Trina Solar modules did not show any significant changes during the measurement period from the beginning of September 2022 to the end of August 2023. The characteristic curves also corresponded to the shapes in the data sheets. The I–V curves of module TSM-245PC05-6120217500442 at the beginning of September 2022 and the end of August 2023 are shown in Figure A3 as representatives.
The characteristic curves of the Photowatt modules showed more conspicuousness. In the long-term measurements, there were also small changes; however, those small changes related less to the shape of the curve and more to the initial (short-circuit current) and final values (open-circuit voltage). The characteristic curves of module PW-1650-01 showed a significantly earlier current decrease and thus, a significantly flatter curve at the end. The form of the characteristic curve of module PW-1650-02 was comparable to the curve in the data sheet. The characteristic curve of module PW-1650-03 collapsed almost linearly. Figure 6 compares the characteristic curve of module PW-1650-03 from the measurement at the beginning of September 2022 to that at the end of August 2023. The same is shown in Figure A4 for module PW-1650-01 and in Figure A5 for module PW-1650-02.
The fill factor is a quantitative parameter that is related to the shape of a characteristic curve. Figure 7 shows the fill factor of the modules investigated over the measurement period. The fill factor of the Trina Solar modules was between 0.76 and 0.70 whereas the fill factor of the Photowatt modules was significantly lower. The fill factor of the modules degraded slightly over the measurement period of one year. For the Trina Solar modules, it remained above 0.7, even at the end of the measurement period, whereas for the Photowatt modules, degradation was slightly higher and the values at the end of the measurement period ranged from 0.11 for module PW-1650-03 to 0.67 for module PW-1650-02.
In addition to the characteristic curve shape, the loss of power is a central parameter in the degradation of modules. The power loss in relation to the nominal power of the data sheet is shown in Figure 8 and tended to increase over the measurement period for all modules. Overall, it was around 10% for the Trina Solar modules. For the Photowatt modules, the power loss was significantly higher and exceeded 20% for all three modules at the end of the measurement period.
Power loss results from a combination of current and voltage loss. Voltage loss is primarily due to changes on a cell and interconnection basis, whereas current loss is primarily related to changes on a module basis [9]. Figure 9 illustrates the curves of short-circuit current loss and Figure 10 shows the open-circuit voltage loss in relation to the nominal values over the measurement period considered. Neither curve showed a clear tendency to increase over the measurement period. Overall, however, the percentage loss for the short-circuit current was slightly higher for the Photowatt modules. There was no clear difference in the percentage of open-circuit voltage loss, although the loss of the Trina Solar modules tended to be minimally larger. Overall, the values were below 10%. Module PW-1650-03 (yellow line) was excluded from this analysis as the characteristic values could not be plausibly extrapolated due to the broken contact.

4. Discussion

The five investigation methods revealed many different aspects of the modules’ potential. The positive results of the pre-tests from the condition testing of the Trina Solar modules showed that there was no fundamental safety risk in the potential reuse of the modules. The intact diodes further ensured loss minimization in the case of shading. The higher open-circuit voltage loss during the condition testing suggested that the power loss of the Trina Solar modules was mainly due to the degradation of the cells rather than the other module components. The fill factor of the modules was in the lower range of the usual values for silicon-based modules (0.75–0.85) [26]. Based on the electroluminescence test, no direct conclusions could be drawn from the number of conspicuous cells about power loss. For module TSM-245PC05-6120217500072, for example, power loss was only 0.3%; however, seven cells within the module were conspicuous in the electroluminescence test. Nevertheless, it must be noted that cell cracks can have long-term effects on module performance [9].
The effects visible In the visual Inspection could have been due to the following causes. The bubble formation in the Photowatt modules could have been due to electrochemical reactions caused by UV radiation, the presence of oxygen or the degradation of the encapsulation due to increased temperatures [9]. Moreover, the detached busbar could have occurred due to poor soldering and hermos-mechanical loading and could have caused short-circuited or open-circuited cells and an increase in resistance [9]. The black corrosion could have been caused by an oxidation reaction, for example, with sulfur compounds in the case of silver contacts, and could have caused a leakage of current [9]. By comparing the Trina Solar modules and including the results of the electroluminescence test, it became clear that the effect was much more evident in the three modules with poorer results in the electroluminescence examination. The scratch on module TSM-245PC05-5120213004347 and the detachment of the contact in module PW-1650-03 were reflected in the thermographic results in the form of cooler strips and particularly heated areas. The bubble formation on modules PW-1650-01 and PW-1650-02 was not visible in the thermographic images.
The results of the long-term characteristic measurements were consistent with the condition tests performed. The shapes of the characteristic curves indicated an increase in internal resistance. This was also illustrated by the fill factor, which was significantly below the literature values for the Photowatt modules. In contrast, the fill factor of the Trina Solar modules remained in the lower range of the literature values and at the end of the course, was slightly below the literature range. The power loss of the Trina Solar modules was probably not caused by visible external defects. In contrast, the external defects of the Photowatt modules were reflected in increased short-circuit currents. Overall, the results of the characteristic measurements reflected those of the visual tests of the modules. However, a conclusion on the electroluminescence test was not clearly possible here, nor could any further conclusions be drawn from the comparison of open-circuit voltage loss.
Even with the inclusion of measurement uncertainties, the courses of the loss in the long-term measurements showed that performance degradation varied greatly and that older modules in particular could deviate from the manufacturer’s performance guarantee. A comparison of the loss to the manufacturer specifications regarding short-circuit current, open-circuit voltage and fill factor could not be made due to the lack of manufacturer specifications. The 10–12-year-old Trina Solar modules were significantly better than the performance guarantee under laboratory conditions and comparable to the guarantee in the long-term tests. In contrast, the 20–22-year-old Photowatt modules aged slightly to significantly more than declared in the data sheets and the first safety-relevant defects occurred. Safety risks can have various causes, such as electrical arcs, short circuits, high series resistance and hotspots, which can result in fire [9]. In the case of the Trina Solar modules, safety risk due to electric arc has already been excluded. However, due to the detached contact, the fire risk for module PW-1650-03 was significant.
If the results are considered in the context of past degradation studies, the following becomes clear. A review of the degradation and failures of photovoltaics by Akram et al. [7] showed that 17 different types of degradation have been reported in the literature. In this study with modules from the recycling company, seven different types were observed (cell cracks, hotspots, bubble formation, glass scratches, the corrosion/oxidation of busbars, the detachment of busbars and damage to antireflection coating). According to the literature, the most commonly detected defect is encapsulation discoloration. This defect did not occur in the tested modules. This result is probably explained either by the evolution of encapsulation technology or the size of the sample. Another common failure is the cracking of cells. This was noticeable in the sample examined, but the cracks did not lead directly to a degradation in performance during the investigation. Special anomalies due to second-life applications and transportation by the recycling company could not be detected on the basis of the measurements carried out. However, external damage during disassembly, such as cut cables, must not be completely disregarded. Nevertheless, these have already been excluded from the module sample.
Regarding the electrical data, existing studies on the degradation of PV modules have shown varying results, which cannot be summarized in a clear statement. Additionally, more recent studies are limited. Jordan et al. [27] summarized 24 studies on polycrystalline modules from 1995 to 2011, with a median of 0.61 to 0.64% in performance degradation per year. However, degradation rates can vary greatly depending on environmental conditions and corresponding causes of degradation, as well as the period under consideration. For example, Kahoul et al. [28] showed voltage degradation of approximately 28% with a power loss of approximately 35% for polycrystalline modules in Algeria after just 11 years. In contrast, the current loss was around 11%. Lillo-Šanchez et al. [29] showed voltage loss of almost 0% and current loss of almost 9% for polycrystalline modules in Spain after 12 years, with a power degradation of approximately 10%. After 22 years, comparable modules showed a power degradation of approximately 31%, as well as a current degradation of 16% and a voltage degradation of approximately 5%. Therefore, the results of the present study were within a plausible range. Comparable to the results of Lillo-Šanchez et al. [29], degradation due to current loss dominates in the long term. However, the comparability of past studies is limited due to differing external conditions and restricted sample sizes. Moreover, we are not aware of any studies on the conditions considered in the present study.
Overall, the analysis of the modules from the recycling company showed clear potential regarding remaining performance. On the other hand, it also illustrated that the performance guarantee and degradation models can only be used as guidelines. In practice, however, a reliable classification system is required in the reuse sector that also considers the age of modules and thus, the probability of external module damage. With newer modules, the first signs of internal degradation may become visible on cells and contacts, but these do not necessarily have a direct effect on performance degradation. This must also be considered in a classification system.
During the measurements, high measurement uncertainties in STC power, which are influenced by the environmental conditions (temperature and radiation), emerged. For this reason, characteristic curve measurements in the field that have the aim of determining nominal STC values are only of limited value. Therefore, for condition measurement, characteristic curve measurements under laboratory conditions are recommended. Neither these tests under STC conditions nor the visual tests were influenced by these high measurement uncertainties. In contrast, the long-term measurement of real reuse scenarios should concentrate on yield investigations, for example, based on the development of performance ratio. The measurements should be supplemented by regular investigations of the shape of the characteristic curves and visual inspections in order to be able to analyze the causes of power loss. In addition, the procedures should be used to detect particular changes more quickly and trigger further examinations under laboratory conditions. The area of module inspection is currently subject to significant further development, particularly in connection with artificial intelligence and automation [9]. Machine learning algorithms, such as those used in electroluminescence testing, could be used, for example, to classify the results of other measurement methods, such as characteristic curves. This aspect should be included in the further evaluation of additional examinations in the second-life area to optimize the efficiency of inspections and the significance of results. Further combinations of measurement methods should be investigated to optimize quality management in the reuse sector. In addition, the possibility of developing further key figures that are almost independent of ambient conditions for the long-term measurement of power loss should also be examined. All in all, the high measurement uncertainties in determining STC performance did not relativize the conclusion that the modules had fundamental technical potential for reuse applications. However, the described optimizations are necessary for a more precise classification.

5. Conclusions

The reuse/second-life approach is a decisive strategy in photovoltaics for saving resources and lowering carbon dioxide emissions. In this work, tests were carried out on polycrystalline modules from two manufacturers, which were already localized at a recycling company and were originally intended for recycling. The investigation showed that the modules from the recycling company also had potential for reuse. Although there were some visible defects, such as the corrosion of contacts, the performance degradation of the approximately 10-year-old Trina Solar modules was lower or comparable to the data sheet specification. In comparison, the approximately 20-year-old modules showed more defects, such as the detachment of contacts, which could lead to higher performance degradation beyond the performance guarantee. By recycling, which is currently often limited to glass recycling, many important raw materials that are normally lost could still be used in the module complex. Better quality management could enable the reuse business model in Germany and the European Union. This could create a time buffer for the establishment of higher quality recycling processes. However, to implement reuse applications with good quality management, classification systems with well-differentiated classes and the inclusion of age considerations are necessary. The detailed significance of this study is limited by the inaccuracy of the characteristic curve measurements under real conditions. In order to be able to make more detailed statements than a general confirmation of potential and the necessity for age differentiation, the test methodology must be further optimized. This includes, among other things, the optimal combination of measurement methods, with a focus on measurements under STC conditions, the inclusion of algorithms for classification and the expansion of the sample regarding the number of modules and various module manufacturers. The long-term goal of investigations should be to create a representative dataset, which could serve as a basis for the development of a reliable classification and testing system for the second-life sector.
Optimizing the test methodology is also important for practical cost-effective implementation from the service provider’s perspective. In addition, the economic viability of second-life systems from the user’s point of view must also be examined regarding certain fields of application. Since the degradation of modules cannot be denied and the use of modules cannot be extended indefinitely, current state-of-the-art high-performance applications can be excluded from the outset. However, there is potential for applications with lower power requirements, such as systems that have the aim of increasing self-consumption or systems that provide additional structural functions. The economic viability of these applications should be tested based on simulations and field tests. However, the amount of PV waste will increase and the availability of critical resources could become more difficult, both of which would increase the profitability of second-life modules.

Author Contributions

Conceptualization, writing—original draft preparation, methodology, supervision, visualization, data curation, funding acquisition and project administration, A.K.S.; investigation, A.K.S., T.R., E.H. and J.U.; validation, formal analysis and writing—review and editing, A.K.S., P.K., F.S. and E.S.-H. All authors have read and agreed to the published version of the manuscript.

Funding

This research received no external funding.

Institutional Review Board Statement

Not applicable.

Informed Consent Statement

Not applicable.

Data Availability Statement

Data are contained within the article.

Acknowledgments

We would like to thank Reiling PV-Recycling GmbH & Co. KG for the provision of the module sample and the results of the condition tests.

Conflicts of Interest

The authors declare no conflicts of interest. The funders had no role in the design of the study, the collection, analyses or interpretation of data, the writing of the manuscript or the decision to publish the results.

Appendix A

In Appendix A, the details of the module sample are shown.
Table A1. Type and serial number of the module sample.
TypeSerial Number
TSM-245PC054120210300062 *
TSM-245PC055120213003149 *
TSM-245PC055120213003847 *
TSM-245PC055120213004347 *
TSM-245PC056120217400416
TSM-245PC056120217500072
TSM-245PC056120217500329 *
TSM-245PC056120217500405
TSM-245PC056120217500420
TSM-245PC056120217500442 *
TSM-245PC056120217500504
TSM-245PC056120217500531
TSM-245PC056120217500582
PW-165001 *
PW-165002 *
PW-165003 *
* Modules in the reduced sample.

Appendix B

Appendix B contains further visualizations of the research results.
Figure A1. Results of optical inspections of the Trina Solar modules (MPP area) using a thermal imaging camera in May 2023: (a) TSM-245PC05-6120217500442; (b) TSM-245PC05-4120210300062; (c) TSM-245PC05-5120213003847; (d) TSM-245PC05-5120213004347; (e) TSM-245PC05-5120213003149; (f) TSM-245PC05-6120217500329.
Sustainability 16 00958 g0a1
Figure A2. Results of optical inspections of the Photowatt modules (MPP area) using a thermal imaging camera in May 2023: (a) PW-1650-01; (b) PW-1650-02; (c) PW-1650-03.
Sustainability 16 00958 g0a2
Figure A3. Characteristic curves of module TSM-245PC05-6120217500442 (raw measurements (blue line), extrapolation to STC (black line) and data sheet (red line)): (a) September 2022; (b) August 2023.
Sustainability 16 00958 g0a3
Figure A4. Characteristic curves of module PW-1650-01 (raw measurements (blue line), extrapolation to STC (black line) and data sheet (red line)): (a) September 2022; (b) August 2023.
Sustainability 16 00958 g0a4
Figure A5. Characteristic curves of module PW-1650-02 (raw measurements (blue line), extrapolation to STC (black line) and data sheet (red line)): (a) September 2022; (b) August 2023.
Sustainability 16 00958 g0a5

References

  1. Tsanakas, J.A.; Heide, A.; Radavičius, T.; Denafas, J.; Lemaire, E.; Wang, K.; Poortmans, J.; Voroshazi, E. Towards a circular supply chain for PV modules: Review of today’s challenges in PV recycling, refurbishment and re-certification. Prog. Photovolt. Res. Appl. 2020, 28, 454–464. [Google Scholar] [CrossRef]
  2. Schnatmann, A.K.; Schoden, F.; Schwenzfeier-Hellkamp, E. Sustainable PV Module Design—Review of State-of-the-Art Encapsulation Methods. Sustainability 2022, 14, 9971. [Google Scholar] [CrossRef]
  3. Schoden, F.; Schnatmann, A.K.; Davies, E.; Diederich, D.; Storck, J.L.; Knefelkamp, D.; Blachowicz, T.; Schwenzfeier-Hellkamp, E. Investigating the Recycling Potential of Glass Based Dye-Sensitized Solar Cells-Melting Experiment. Materials 2021, 14, 6622. [Google Scholar] [CrossRef] [PubMed]
  4. Ellen Macarthur Foundation. The Circular Economy in Detail. Available online: https://ellenmacarthurfoundation.org/the-circular-economy-in-detail-deep-dive (accessed on 28 June 2023).
  5. Osann, I.; Mattheis, H. Workbook Circular Economy: Developing Innovations-Shaping Transformation: With Methods, Tools and Checklists! Hanser eLibrary: Munich, Germany, 2021. (In German) [Google Scholar]
  6. Kirchherr, J.; Reike, D.; Hekkert, M. Conceptualizing the circular economy: An analysis of 114 definitions. Resour. Conserv. Recycl. 2017, 127, 221–232. [Google Scholar] [CrossRef]
  7. Uwe Handmann, W.I.; RETHINK. Impulses for Circular Value Creation/Enabling the Circular Economy. 2022. Available online: www.prosperkolleg.ruhr (accessed on 28 June 2023). (In German).
  8. Zhao, Y.; Pohl, O.; Bhatt, A.I.; Collis, G.E.; Mahon, P.J.; Rüther, T.; Hollenkamp, A.F. A Review on Battery Market Trends, Second-Life Reuse, and Recycling. Sustain. Chem. 2021, 2, 167–205. [Google Scholar] [CrossRef]
  9. Waqar Akram, M.; Li, G.; Jin, Y.; Chen, X. Failures of Photovoltaic modules and their Detection: A Review. Appl. Energy 2022, 313, 118822. [Google Scholar] [CrossRef]
  10. Aghaei, M.; Fairbrother, A.; Gok, A.; Ahmad, S.; Kazim, S.; Lobato, K.; Oreski, G.; Reinders, A.; Schmitz, J.; Theelen, M.; et al. Review of degradation and failure phenomena in photovoltaic modules. Renew. Sustain. Energy Rev. 2022, 159, 112160. [Google Scholar] [CrossRef]
  11. 2nd Life Solar GmbH & Co., KG. 2ndlifesolar. Available online: https://2ndlifesolar.de/ (accessed on 31 July 2023).
  12. pvXchange Trading GmbH. Pvxchange—Photovoltaic Distribution. Available online: https://www.pvxchange.com/ (accessed on 31 July 2023).
  13. SecondSol GmbH. SecondSol—The Photovoltaic Marketplace. Available online: https://www.secondsol.com/ (accessed on 31 July 2023).
  14. Rinovasol Global Services B., V. Rinovasol Global O and M GmbH. Available online: https://www.rinovasol.de/ (accessed on 31 July 2023).
  15. solar-pur, AG. solar-pur AG|Photovoltaics & Electrical Engineering. Available online: https://www.solar-pur.de/ (accessed on 31 July 2023). (In German).
  16. Reiling GmbH & Co., KG.; Materials Management. Recycling. Available online: https://www.reiling.de/ (accessed on 28 June 2023).
  17. German Environmental Aid, e.V. Strengthening the Circular Economy in the Solar Industry-Using Old Photovoltaic Modules to Protect the Climate and Resources: White Paper on Strengthening the Reuse and Recycling of Photovoltaic Modules. 2021. Available online: https://www.duh.de/projekte/pv-recycling/ (accessed on 10 December 2023). (In German).
  18. Franco, M.A.; Groesser, S.N. A Systematic Literature Review of the Solar Photovoltaic Value Chain for a Circular Economy. Sustainability 2021, 13, 9615. [Google Scholar] [CrossRef]
  19. Trina Solar Ltd. TSM-PC05—The Universal Module-Datasheet. 2013. Available online: https://static.trinasolar.com/sites/default/files/TSM_PC05_datasheet_EN.pdf (accessed on 30 November 2023).
  20. Photowatt International S., A. PW1650-12/24 V High Efficiency Photovoltaic Module–Jbox. 2003. Available online: https://reenergyhub.com/files/hersteller/Photowatt/pdf/Photowatt_PW1650_24V_155-175_12V_155-175_EN.pdf (accessed on 30 November 2023).
  21. MBJ Solutions GmbH. Product Portfolio-MBJ Solutions GmbH. Available online: https://www.mbj-solutions.com/produktportfolio-mbj-solutions (accessed on 30 November 2023). (In German).
  22. IEC 60904-9:2020; Photovoltaic Devices—Part 9: Classification of Solar Simulator Characteristics. International Electrotechnical Commission: Geneva, Switzerland, 2020.
  23. IEC 60891:2021; Photovoltaic Devices—Procedures for Temperature and Irradiance Corrections to Measured I-V Characteristics. International Electrotechnical Commission: Geneva, Switzerland, 2021.
  24. FLIR Systems, Inc. Technical Data FLIR E50; FLIR Systems, Inc.: Wilsonville, OR, USA, 2012. [Google Scholar]
  25. TRITEC International, AG. Simple and Quick Performance Check of Installed Solar Modules; TRITEC International AG: Bottmingen, Switzerland, 2011. [Google Scholar]
  26. Mertens, K. Photovoltaics: Textbook on Basics, Technology and Practice; Carl Hanser Verlag GmbH & Co. KG: Munich, Germany, 2020. (In German) [Google Scholar]
  27. Jordan, D.C.; Kurtz, S.R. Photovoltaic Degradation Rates—An Analytical Review. Prog. Photovolt. Res. Appl. 2013, 21, 12–29. [Google Scholar] [CrossRef]
  28. Kahoul, N.; Chenni, R.; Cheghib, H.; Mekhilef, S. Evaluating the reliability of crystalline silicon photovoltaic modules in harsh environment. Renew. Energy 2017, 109, 66–72. [Google Scholar] [CrossRef]
  29. Lillo-Sánchez, L.; López-Lara, G.; Vera-Medina, J.; Pérez-Aparicio, E.; Lillo-Bravo, I. Degradation analysis of photovoltaic modules after operating for 22 years. A case study with comparisons. Sol. Energy 2021, 222, 84–94. [Google Scholar] [CrossRef]
Figure 1. Examples of the appearance of a critical cell (a) and a non-critical cell (b).
Sustainability 16 00958 g001
Figure 2. Results of optical inspections using a digital camera in September 2022: (a) the surface of module TSM-245PC05-6120217500442; (b) bubble formation on module PW-1650-02; (c) detached busbar in module PW-1650-03.
Sustainability 16 00958 g002
Figure 3. Results of optical inspections using a digital camera in August 2023: (a) the surface of module TSM-245PC05-6120217500442; (b) the surface of module TSM-245PC05_5120213004347; (c) corrosion on the contacts of module TSM-245PC05_6120217500329; (d) a scratch on the surface of module TSM-245PC05-5120213004347; (e) damage to the antireflection coating of module PW-1650-01; (f) increased bubble formation on module PW-1650-02.
Sustainability 16 00958 g003
Figure 4. Results of optical inspections of the Trina Solar modules (short circuit) using a thermal imaging camera in May 2023: (a) TSM-245PC05-6120217500442; (b) TSM-245PC05-4120210300062; (c) TSM-245PC05-5120213003847; (d) TSM-245PC05-5120213004347; (e) TSM-245PC05-5120213003149; (f) TSM-245PC05-6120217500329.
Sustainability 16 00958 g004
Figure 5. Results of optical inspections of the Photowatt modules (short circuit) using a thermal imaging camera in May 2023: (a) PW-1650-01; (b) PW-1650-02; (c) PW-1650-03.
Sustainability 16 00958 g005
Figure 6. Characteristic curves of module PW-1650-03 (raw measurements (blue line), extrapolation to STC (black line) and data sheet (red line)): (a) September 2022; (b) August 2023.
Sustainability 16 00958 g006
Figure 7. Course of the fill factor of modules TSM-245PC05-6120217500442 (dark red square), TSM-245PC05-4120210300062 (orange square), TSM-245PC05-5120213003847 (light red square), TSM-245PC05-5120213004347 (blue square), TSM-245PC05-5120213003149 (light blue square), TSM-245PC05-6120217500329 (dark blue square), PW-1650-01 (dark green triangle), PW-1650-02 (green triangle) and PW-1650-03 (yellow triangle) over the period from September 2022 to August 2023.
Sustainability 16 00958 g007
Figure 8. Course of the power loss of modules TSM-245PC05-6120217500442 (dark red square), TSM-245PC05-4120210300062 (orange square), TSM-245PC05-5120213003847 (light red square), TSM-245PC05-5120213004347 (blue square), TSM-245PC05-5120213003149 (light blue square), TSM-245PC05-6120217500329 (dark blue square), PW-1650-01 (dark green triangle), PW-1650-02 (green triangle) and PW-1650-03 (yellow triangle) over the period from September 2022 to August 2023.
Sustainability 16 00958 g008
Figure 9. Course of the short-circuit current loss of modules TSM-245PC05-6120217500442 (dark red square), TSM-245PC05-4120210300062 (orange square), TSM-245PC05-5120213003847 (light red square), TSM-245PC05-5120213004347 (blue square), TSM-245PC05-5120213003149 (light blue square), TSM-245PC05-6120217500329 (dark blue square), PW-1650-01 (dark green triangle), PW-1650-02 (green triangle) and PW-1650-03 (yellow triangle) over the period from September 2022 to August 2023.
Sustainability 16 00958 g009
Figure 10. Course of the open-circuit voltage loss of modules TSM-245PC05-6120217500442 (dark red square), TSM-245PC05-4120210300062 (orange square), TSM-245PC05-5120213003847 (light red square), TSM-245PC05-5120213004347 (blue square), TSM-245PC05-5120213003149 (light blue square), TSM-245PC05-6120217500329 (dark blue square), PW-1650-01 (dark green triangle), PW-1650-02 (green triangle) and PW-1650-03 (yellow triangle) over the period from September 2022 to August 2023.
Sustainability 16 00958 g010
Table 1. Characteristics of the sampled modules.
CharacteristicTSM-245PC05 [19]PW-1650 [20]
ProducerTrina SolarPhotowatt
Cell typePolycrystallinePolycrystalline
Module structureFront glass—back sheetFront glass—back sheet
Nominal power (PMPP)245 W165 W
Nominal voltage (UMPP)30.2 V34.4 V
Nominal current (IMPP)8.13 A4.8 A
Open circuit voltage (OCV)37.5 V43.2 V
Short circuit current (SCC)8.68 A5.1 A
Module efficiency15.0%15.0%
Temperature coefficient:
SCC0.047%/K0.027%/K
OCV−0.32%/K−0.36%/K
PMPP−0.43%/K−0.43%/K
Power warrantyLinear degradation of 0.8%/yearLinear degradation of 0.8%/year
Estimated age at the start of the condition testingAbout 10 yearsAbout 20 years
Guaranteed power at the start of the condition testing (Power loss)225.4 W (8%)138.6 W (16%)
Table 2. Results of the sun simulator and electroluminescence tests.
Module
Designation
Sun Simulator (1)EL Test (2)
PMPP (W)/Loss (%)SCC (A)/Loss (%)OCV (V)/Loss (%)FF (%)Critical; Uncritical;
Inconspicuous (Cells)
4120210300062241.3/1.58.63/0.5836.92/1.5575.70; 2; 58
5120213003149239.6/2.28.48/2.336.91/1.5776.53; 3; 54
5120213003847242.1/1.28.67/0.1236.81/1.8475.90; 3; 57
5120213004347240.6/1.88.64/0.4636.74/2.0375.83; 1; 56
6120217400416241.3/1.58.66/0.2336.75/2.0075.80; 0; 60
6120217500072244.3/0.38.70/-0.2336.81/1.8476.31; 6; 53
6120217500329238.0/2.98.64/0.4636.83/1.7974.81; 3; 56
6120217500405238.2/2.88.56/1.3836.63/2.3275.91; 4; 55
6120217500420243.2/0.78.62/0.6936.83/1.7976.71; 2; 57
6120217500442240.4/1.98.66/0.2336.73/2.0575.60; 0; 60
6120217500504241.6/1.48.64/0.4636.75/2.0076.10; 0; 60
6120217500531243.7/0.68.62/0.6936.82/1.8176.81; 3; 56
6120217500582244.5/0.28.68/0.0036.83/1.7976.50; 0; 60
Disclaimer/Publisher’s Note: The statements, opinions and data contained in all publications are solely those of the individual author(s) and contributor(s) and not of MDPI and/or the editor(s). MDPI and/or the editor(s) disclaim responsibility for any injury to people or property resulting from any ideas, methods, instructions or products referred to in the content.

