Article

Interaction between Thermal Conditions and Ventilation in Kindergartens in Melbourne, Australia

by
Brett Munckton
1 and
Priyadarsini Rajagopalan
2,3,*
1
School of Property, Construction and Project Management, RMIT University, 124 La Trobe Street, Melbourne, VIC 3000, Australia
2
Sustainable Building Innovation Laboratory, School of Property, Construction and Project Management, RMIT University, 124 La Trobe Street, Melbourne, VIC 3000, Australia
3
Post Carbon Infrastructure and Built Environment Research Centre, RMIT University, 124 La Trobe Street, Melbourne, VIC 3000, Australia
*
Author to whom correspondence should be addressed.
Sustainability 2024, 16(3), 1186; https://doi.org/10.3390/su16031186
Submission received: 10 December 2023 / Revised: 26 January 2024 / Accepted: 27 January 2024 / Published: 31 January 2024

Abstract

:
Kindergartens are important community facilities that introduce children to a classroom learning environment. The research aimed to examine current practices in kindergarten heating, cooling, and ventilation and investigate how IAQ and thermal comfort interact with each other at five selected kindergartens in Melbourne. This research used field measurements to investigate indoor air quality (IAQ) and thermal conditions during the COVID-19 pandemic and used CO2 concentration levels as an indicator of IAQ. The research found that high CO2 levels above recommended maximums were reached in operational kindergartens. The highest level identified during class time was 1908 ppm. Conditions outside recommended levels for thermal comfort were also recorded. A kindergarten operating with the use of both mechanical and natural ventilation was found to have lower CO2 levels than the kindergartens relying solely on mechanical ventilation. However, thermal comfort was compromised in this kindergarten. The data collected in kindergartens in their natural settings offered insights into the actual ventilation conditions in these facilities and provided baseline data for developing pandemic-resilient kindergartens. The findings are relevant to kindergartens in other countries that have dynamic window/door-opening behavior.

1. Introduction

The provision of adequate ventilation and thermal comfort are of key importance in building design. Australian standards for IAQ and ventilation have been influenced by international standards and guides [1]. They allow buildings to be naturally ventilated, relying on windows and doors for fresh air rather than mechanical systems [2]. Various studies have identified that educational facilities commonly rely on natural ventilation, both in Australia [3,4,5] and internationally [6,7,8]. IAQ can be compromised if windows and doors are not opened while naturally ventilated buildings are occupied, which may often be the case due to adverse outside conditions [3].
As building occupants breathe in oxygen and exhale CO2, their presence in indoor environments increases CO2 levels, subject to ventilation rates. Indoor CO2 concentration levels are widely used as a metric of IAQ and indoor ventilation, primarily for ease of use. Though higher levels of CO2 within buildings are an indication of poor IAQ, a single concentration will not serve as a ventilation indicator for spaces with different occupancies and ventilation requirements [9]. In school environments, high CO2 levels have been linked to increased student absence [10], reduced academic speed and concentration, increased errors [11,12], poorer logic test results, fatigue, and various health problems [13,14]. Considering the reliance on natural ventilation, it is not surprising that high levels of CO2 have been found in educational buildings. The recommended maximum internal level for CO2 is 1000 ppm [15]. Studies focusing on schools have recorded CO2 levels well above this, including levels over 5000 ppm [4,5,12]. Studies specifically focused on kindergarten IAQ have also found CO2 levels that are not ideal [8,16,17,18,19].
There is an increased focus on building air tightness to improve energy efficiency by reducing losses of conditioned air. Dovjak et al. [18] outline how increasing building air tightness can negatively impact IAQ in kindergartens, finding CO2 levels of over 4000 ppm following an air tightness retrofit of a Slovenian kindergarten without mechanical ventilation. The study highlights the need for mechanical ventilation in reasonably air-tight buildings, which can include heat recovery to minimize energy losses. Various studies support this. Hammad et al. [20] demonstrate that energy savings heat recovery can be achieved on a mechanical ventilation system. Cosbod et al. [6] highlight that mechanical ventilation allows for outside air to be filtered, which is not possible when natural ventilation is used.
The COVID-19 pandemic has caused an increased awareness about IAQ in schools and kindergartens [21]. Consistent with suggestions of the CDC [22], Crabb et al. [23] and Schofield [24] recommend a CO2 level below 800 ppm due to the COVID-19 pandemic and the use of air filtration units if this cannot be achieved. Crabb et al. [23] advise that without filtration, CO2 levels of 800 ppm to 1500 ppm represent a moderate risk of infection, while levels over 1500 ppm represent a high risk of infection. Although air filtration units may remove virus aerosols from a room, they do not increase ventilation rates or dilute pollutant concentration, seeing impacts on health and educational outcomes persist.
In response to the COVID-19 pandemic, several interventions were proposed by local and international authorities in relation to educational facilities, including kindergartens. Kindergarten includes learning through play and intentional teaching, early literacy, numeracy, and emotional and social development [25]. Victorian four-year-olds spend 15 h a week in kindergarten [26]. Suitable conditions must be provided for kindergarten classes as they are intended to ‘develop a foundation for future success in learning’ [25] (p. 5). In Australia, particularly in Victoria, kindergartens, mainly located in local government-owned community centers, are normally designed to be mechanically ventilated, employing a variety of heating and cooling systems and ventilation strategies. Consistent with international trends, Victorian kindergartens have been encouraged to increase ventilation by opening windows and doors as much as possible in response to COVID-19 [19,27,28,29]. Ventilation can impact thermal comfort, which in turn can impact health and decrease the ability of children to learn and concentrate [14,30,31,32,33,34]. Although children may accept a broader range of temperatures than adults, the impact of temperature on their learning also needs to be considered. Wargocki and Wyon [32] found that the thermal and air quality conditions accepted by most building occupants still reduce performance by 5–10% in adults and 15–30% in children. This indicates that children’s acceptance of broader range temperature has a greater impact on performance when compared to adults. The study outlines that high temperatures cause headaches and impact clear thinking, while low temperatures impact manual dexterity. Wyon [30] conducted experiments in school classes and found that the comprehension and reading skills of nine-year-old children decreased as temperature increased from 20 °C to 27 °C. Wargocki et al. [34] analyzed 18 studies and calculated that in temperate climates, lowering temperature from 30 °C to 20 °C can be expected to increase performance on school tasks by 20% on average. Most of the research that quantified the impact of thermal conditions in educational facilities focused on the consequences of warmer temperatures, with limited studies on the impact of cooler conditions focusing on educational facilities. Furthermore, no studies report the thermal and ventilation conditions of Victorian kindergartens in their natural settings. This study examined heating and ventilation strategies in selected Victorian local government kindergartens and employed field measurements to monitor ventilation and thermal comfort conditions. The research took place in August 2022 during the COVID-19 pandemic, with an increased focus on IAQ. The baseline data collected in this study provided insights into the adequacy of some of the interventions proposed by local and international authorities in response to the pandemic.

2. Materials and Methods

2.1. Kindergarten Selection

Floor plans and permits of potential kindergartens to be involved in the study were reviewed to select kindergartens with a variety of relevant characteristics for the research. A regularly used kinder room in selected community centers located in suburban areas in Melbourne was used for this study. The kindergarten operates from 8 am to 5 pm, Monday to Friday. Occupancy levels varied at all kindergartens, and typically, there were up to 25 children in a room and 4 teachers. Numbers went up and down during the day as groups left and returned from outside play. Table 1 summarizes key features with respect to the kindergartens and the rooms selected for the study. Figure 1 shows the layout of one of the kindergarten rooms. All kindergartens had multiple openable windows and heating and cooling systems, and most relied on natural ventilation. Kindergarten 3 was an exception, with ventilation provided by its air conditioning system. As per the mechanical drawings, the system serving K3 is designed to provide 235 Ls−1 of fresh air when operating. The supply air temperature is specified as 21 °C.

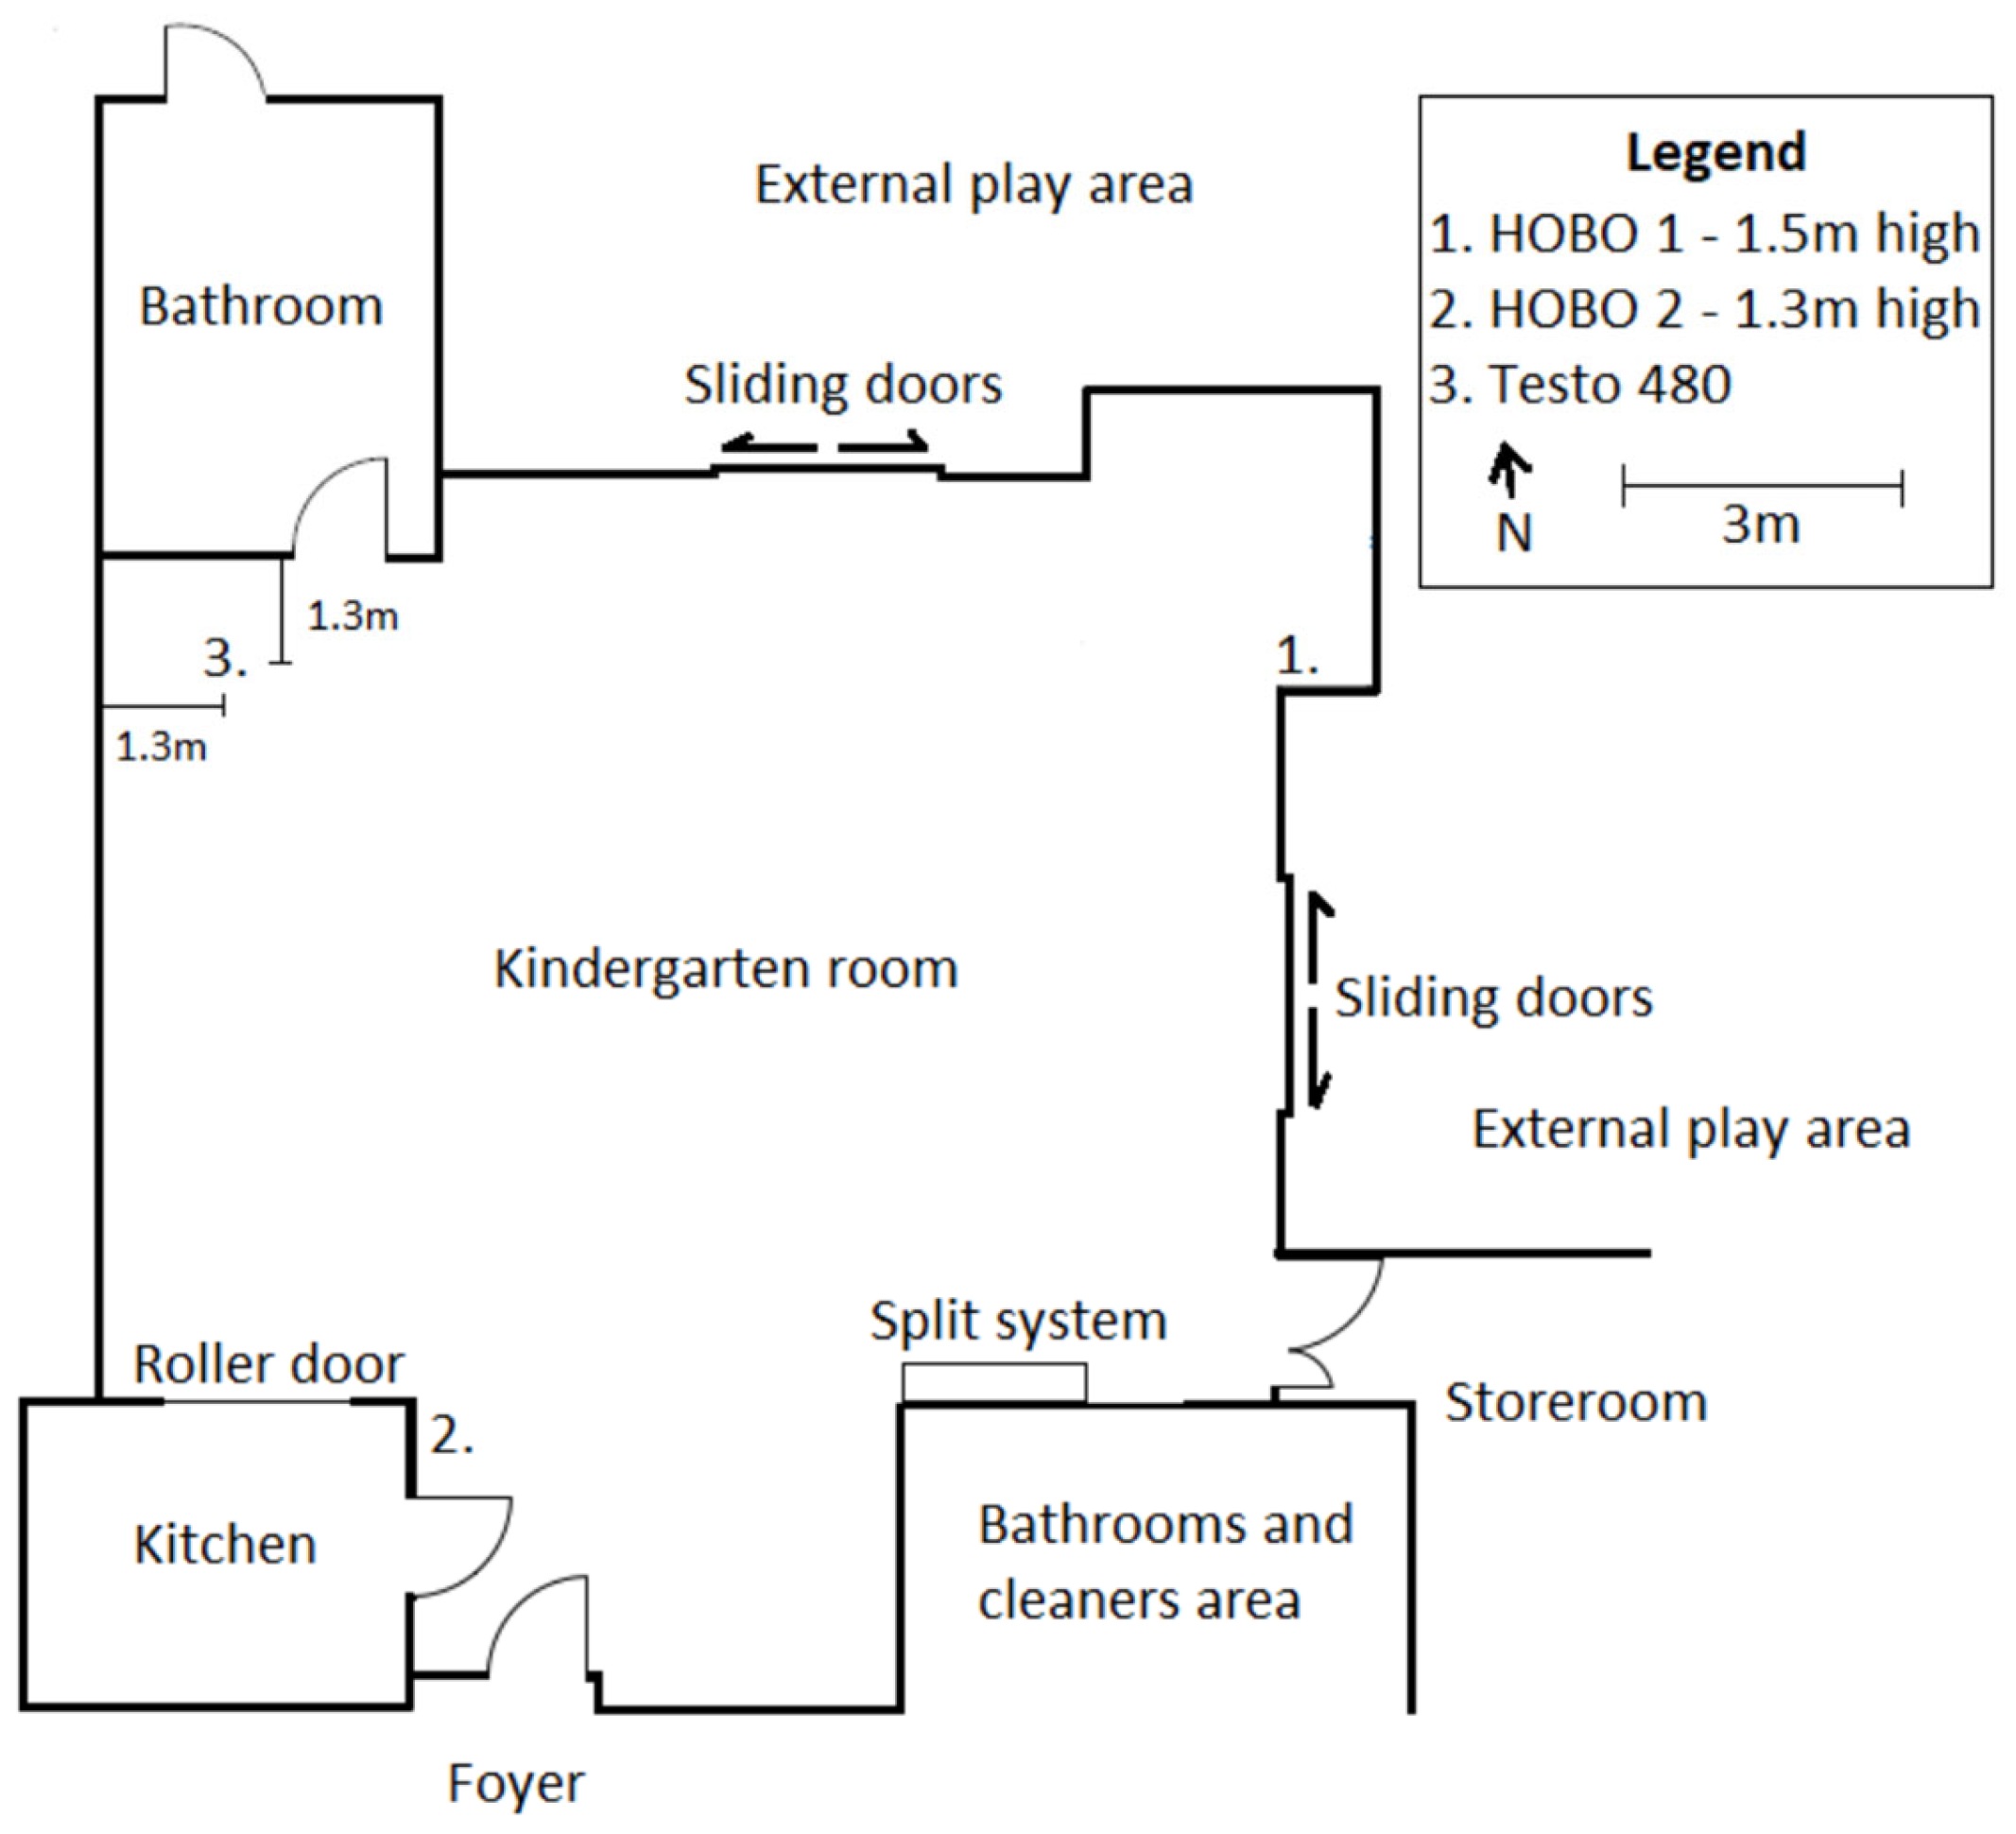
2.2. Data Collection

This research utilized quantitative methods to understand ventilation and thermal comfort at selected kindergartens in Melbourne, Victoria. Melbourne’s climate is characterized by uncomfortable outside thermal conditions, including daily maximums under 10 °C and minimums around 1 °C in winter and exceeding 40 °C in summer [35]. The average temperatures in winter range from 6.5 to 14.2 °C. Data collection for this study took place in winter, as it demonstrates a challenging period for the management of thermal comfort and ventilation due to Melbourne’s low outdoor air temperatures. Air temperature, relative humidity, and CO2 concentration levels were monitored using two HOBO MX1102 (manufactured by Onset, Wareham, MA, USA) at each kindergarten (K1–K5) throughout August 2022. For thermal comfort, data including air temperature, relative humidity, air speed, and globe temperature required to calculate predicted mean vote (PMV), percentage of people dissatisfied (PPD), and adaptive comfort was collected for one day at each site, the main monitoring day (see Table 1) using Testo 480 monitoring device manufactured by Instrument Choice, Dry Creek, Australia. HOBO U12-013 data loggers manufactured by manufactured by Onset, Wareham, MA, USA were used to record outdoor temperature and relative humidity. The readings from the equipment were checked and compared against each other prior to deployment in kindergartens to confirm correct operation. Equipment was placed away from student tables, external doors, and operable windows, as well as supply and return air points, as per the methods used by Rajagopalan et al. [4].
Locating ideal points for the placement of monitoring equipment was challenging due to the small size of the kindergarten rooms, the active use of all areas of the room, and the presence of multiple openings and supply and return air points. All the data loggers were set to record data in 15-min intervals. The HOBO MX1102 has a display screen that displays CO2 levels. This was programmed to be turned off for the study, so kindergarten staff did not adjust their behavior due to any CO2 readings displayed. The specification of measuring equipment is outlined in Appendix A.
The Testo 480 was set up at approximately 1 m height as close to the occupants and close to the center of the rooms as practical, as per the methodology used by Yun et al. [36]. Where it is not possible to place the equipment at the center of the classroom due to occupational safety concerns and disturbance to classroom activities, another suitable location was selected. The researcher stayed near the Testo device to manage its correct operation and ensure non-interference by children and staff; however, a 2-m clearance was generally provided to limit interference with CO2 readings. On the main monitoring day in each kindergarten, the level of activity and clothing level of children and teachers were recorded to establish PMV and associated PPD metrics. As exact details could not be observed, assumptions were made regarding clothing layers. Additionally, occupancy levels, the type of heating and cooling systems, and their operation were recorded. The opening and closing of windows and doors were also recorded to represent natural ventilation levels. Weather data were sourced from the nearest weather stations [37].

2.3. Data Consolidation and Analysis

Data from each pair of installed HOBO MX1102 meters was combined to provide average values for each kindergarten room for analysis of CO2 concentration and ventilation. The data collected from each kindergarten’s main monitoring day using Testo 480 was further consolidated to generate PMV and PPD values to assess thermal comfort using the CBE Thermal Comfort Tool [38]. Globe temperature was converted to mean radiant temperature (MRT) using the same tool. For the analysis, the child metabolic rate recorded following ASHRAE Standard 55 [39] was multiplied by 1.21 as per the findings of Fabbri [40], in consideration of a higher child metabolic rate. Adaptive comfort levels were also generated by inputting internal air speed, MRT, and air temperature, as well as prevailing mean outdoor temperature in the CBE Thermal Comfort Tool [38]. Data were analyzed using time series, box and whiskers plots, and linear regression analysis. Also, cluster analysis was used to examine thermal comfort based on natural ventilation level quantified based on the amount of time windows or doors were open.

3. Results and Discussions

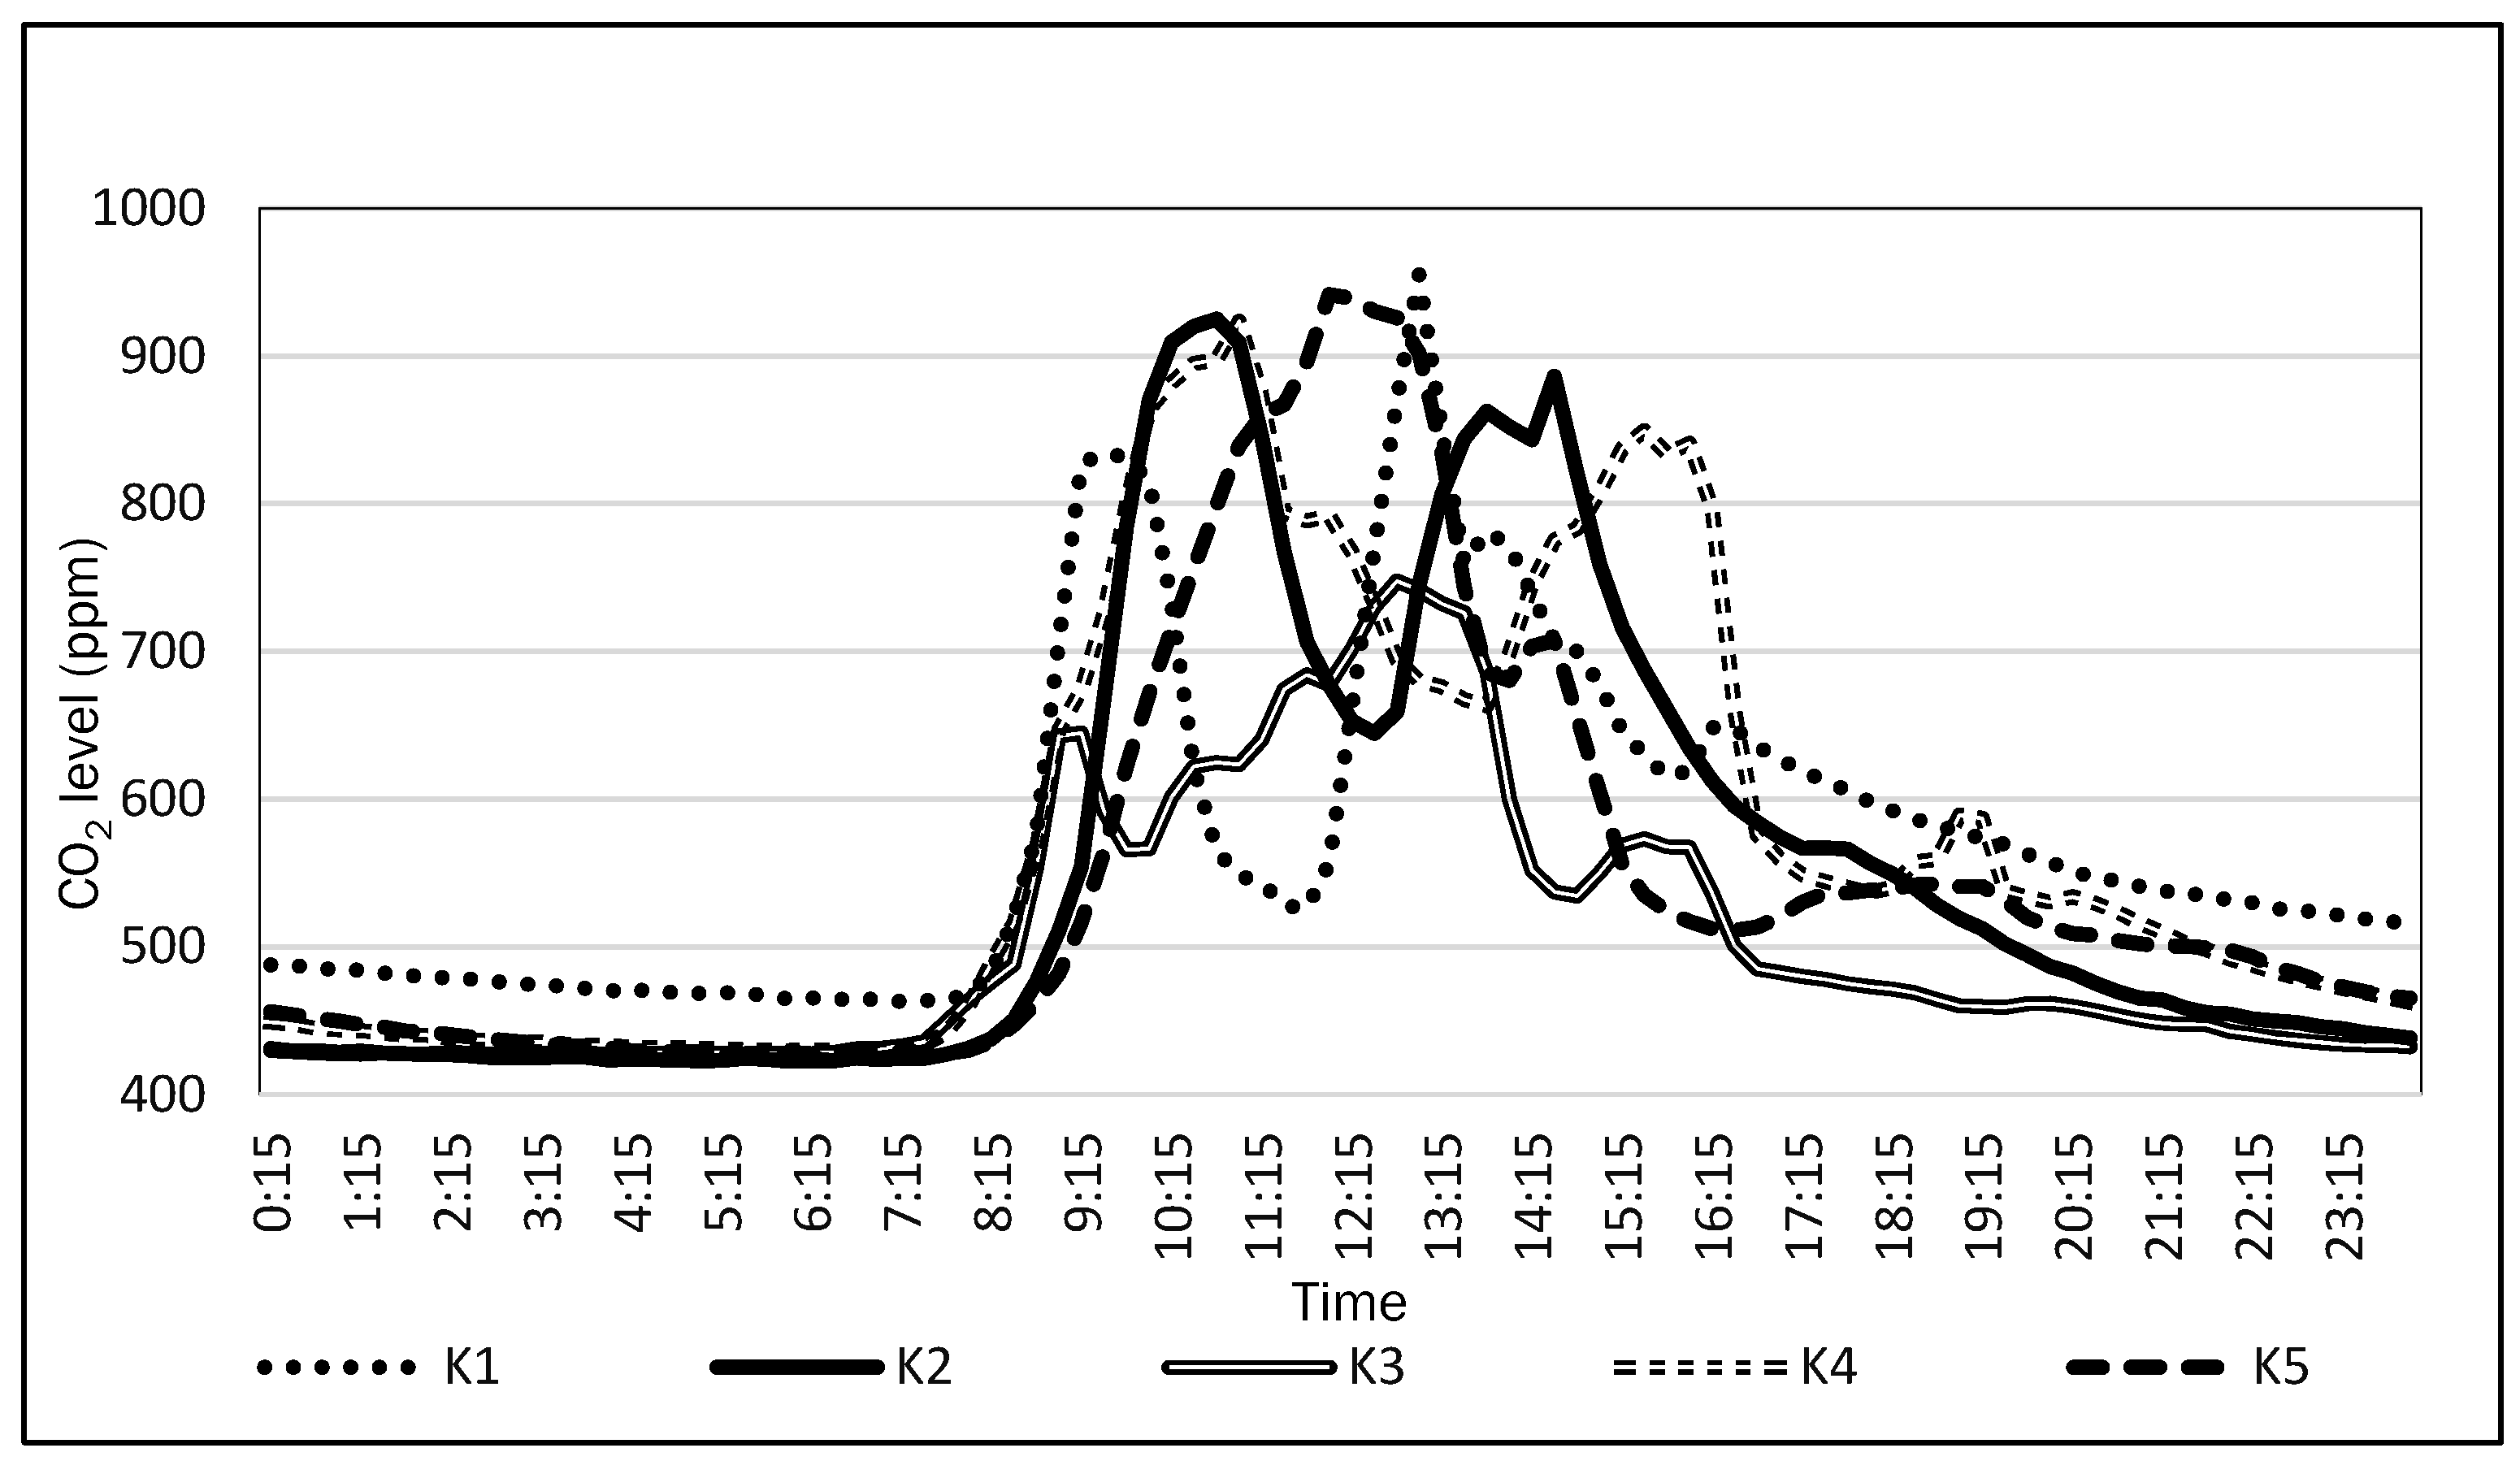
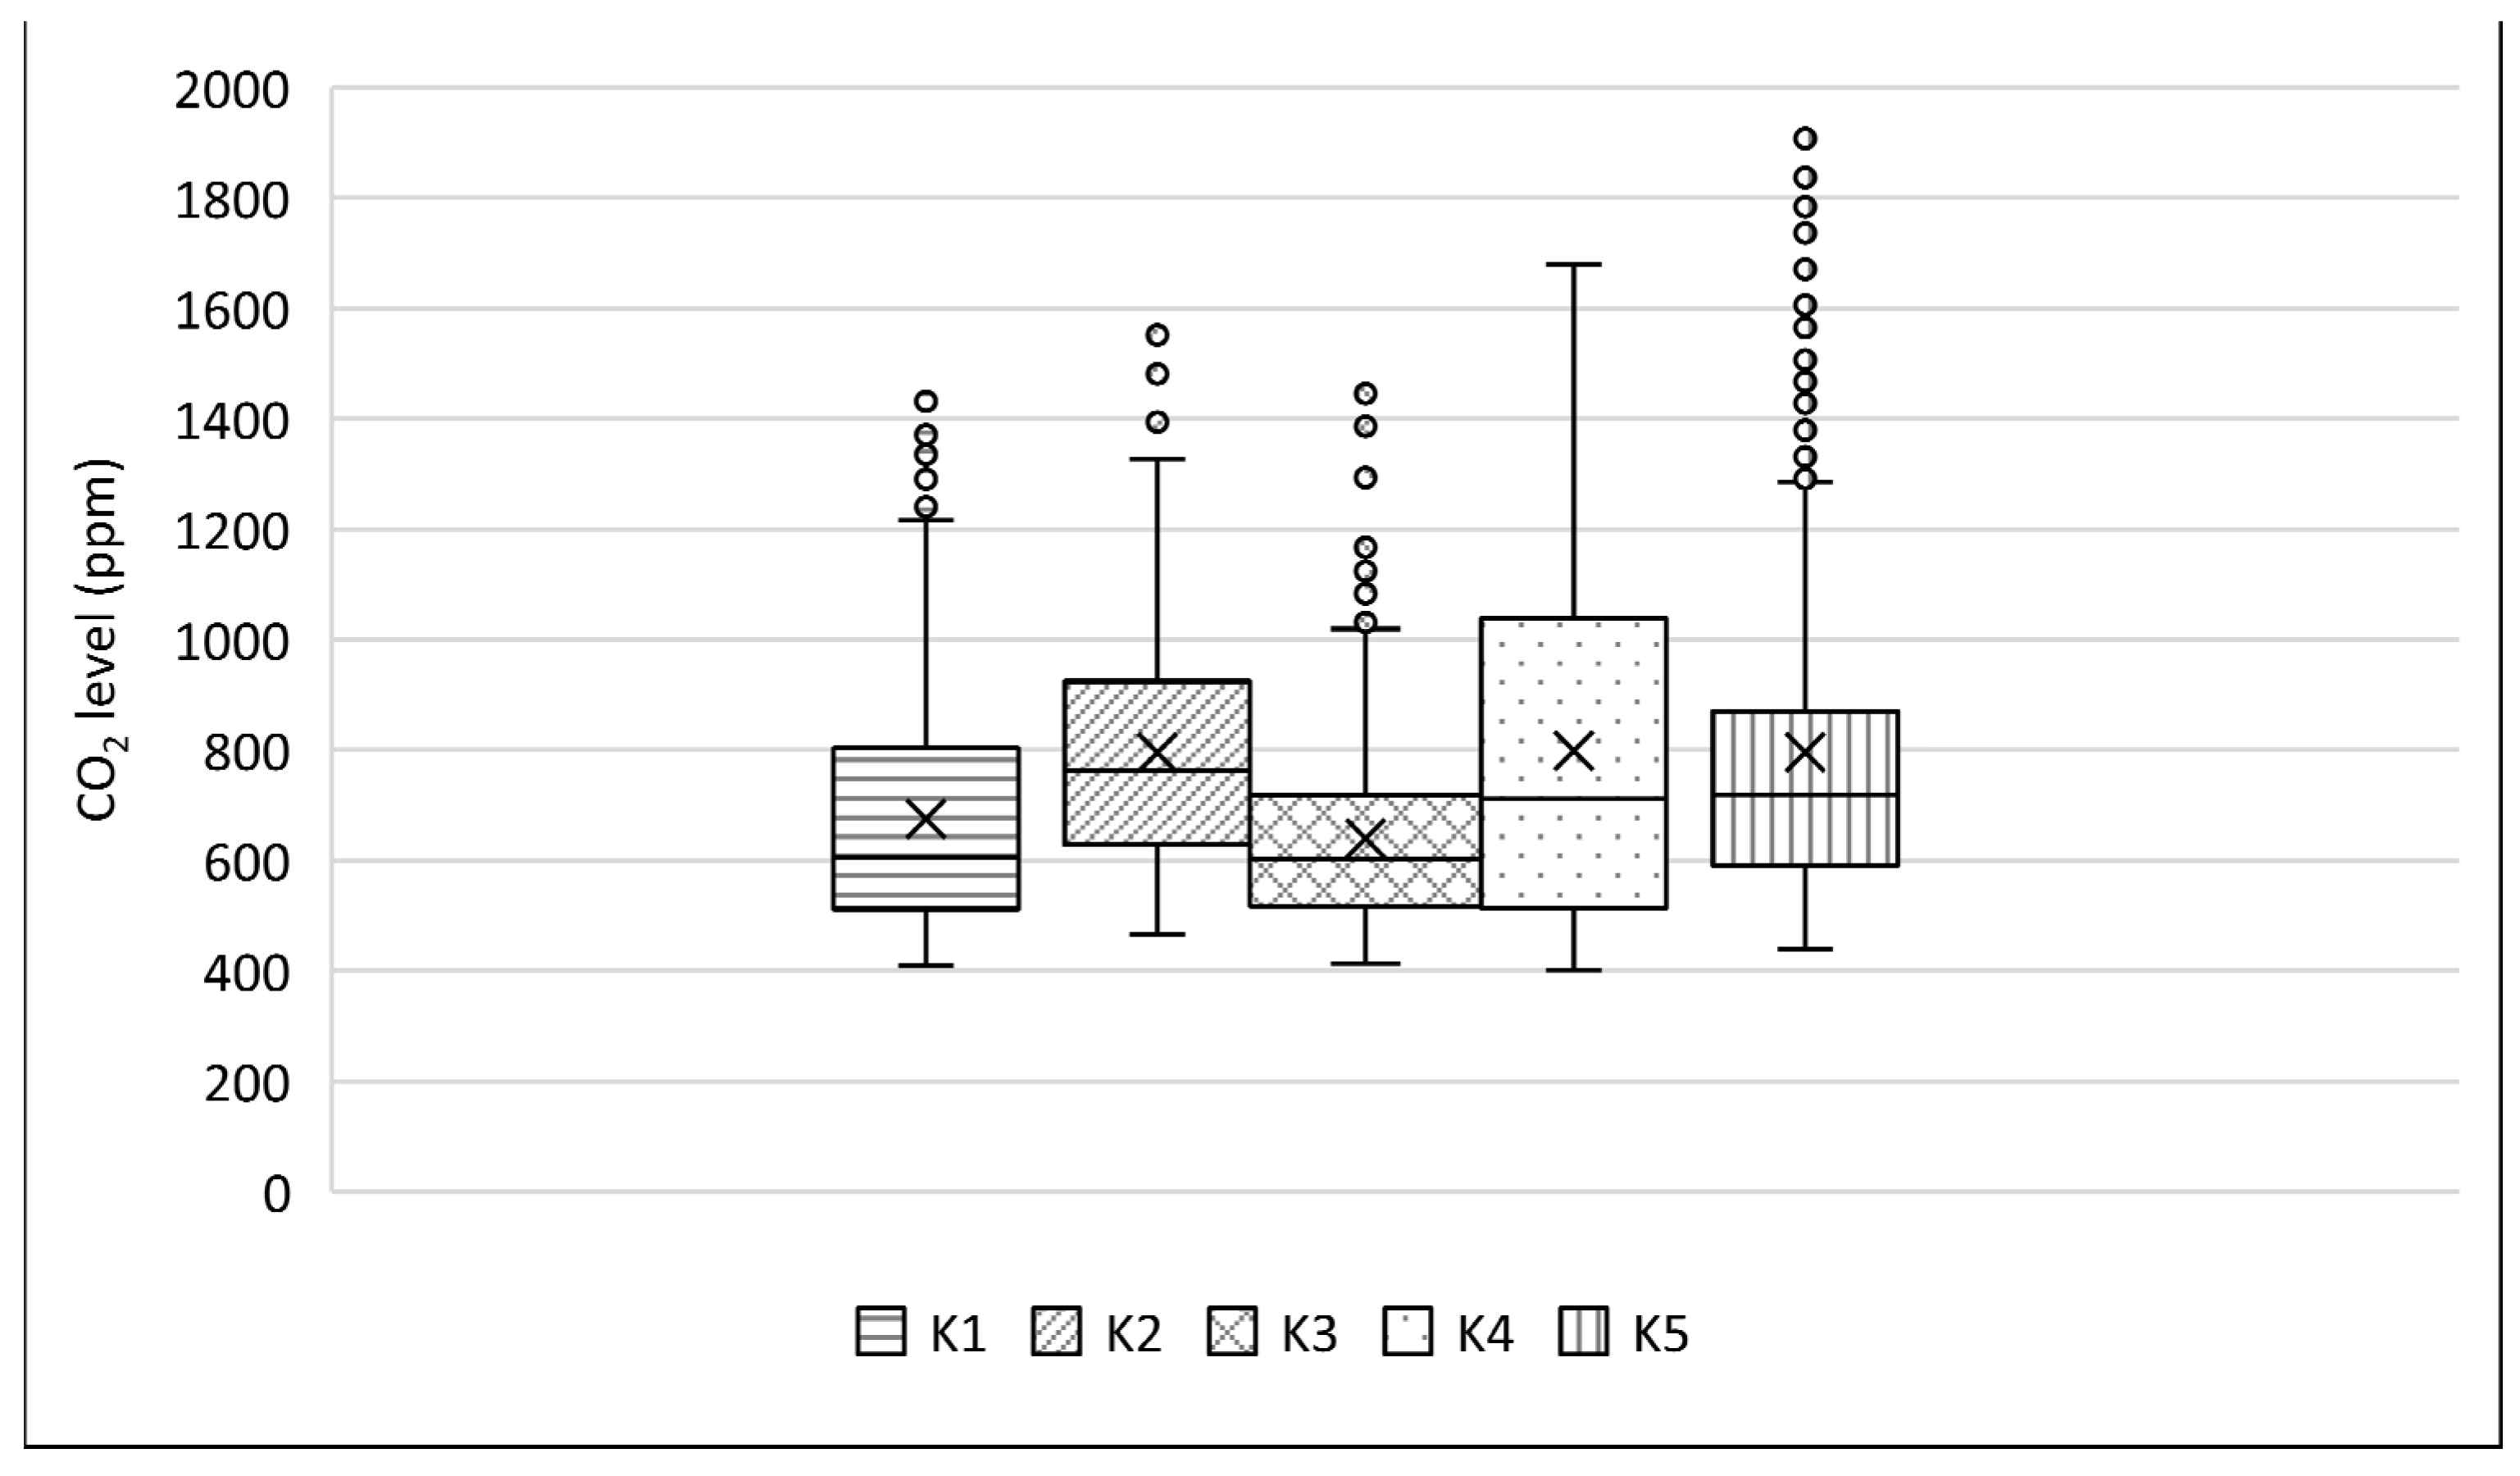
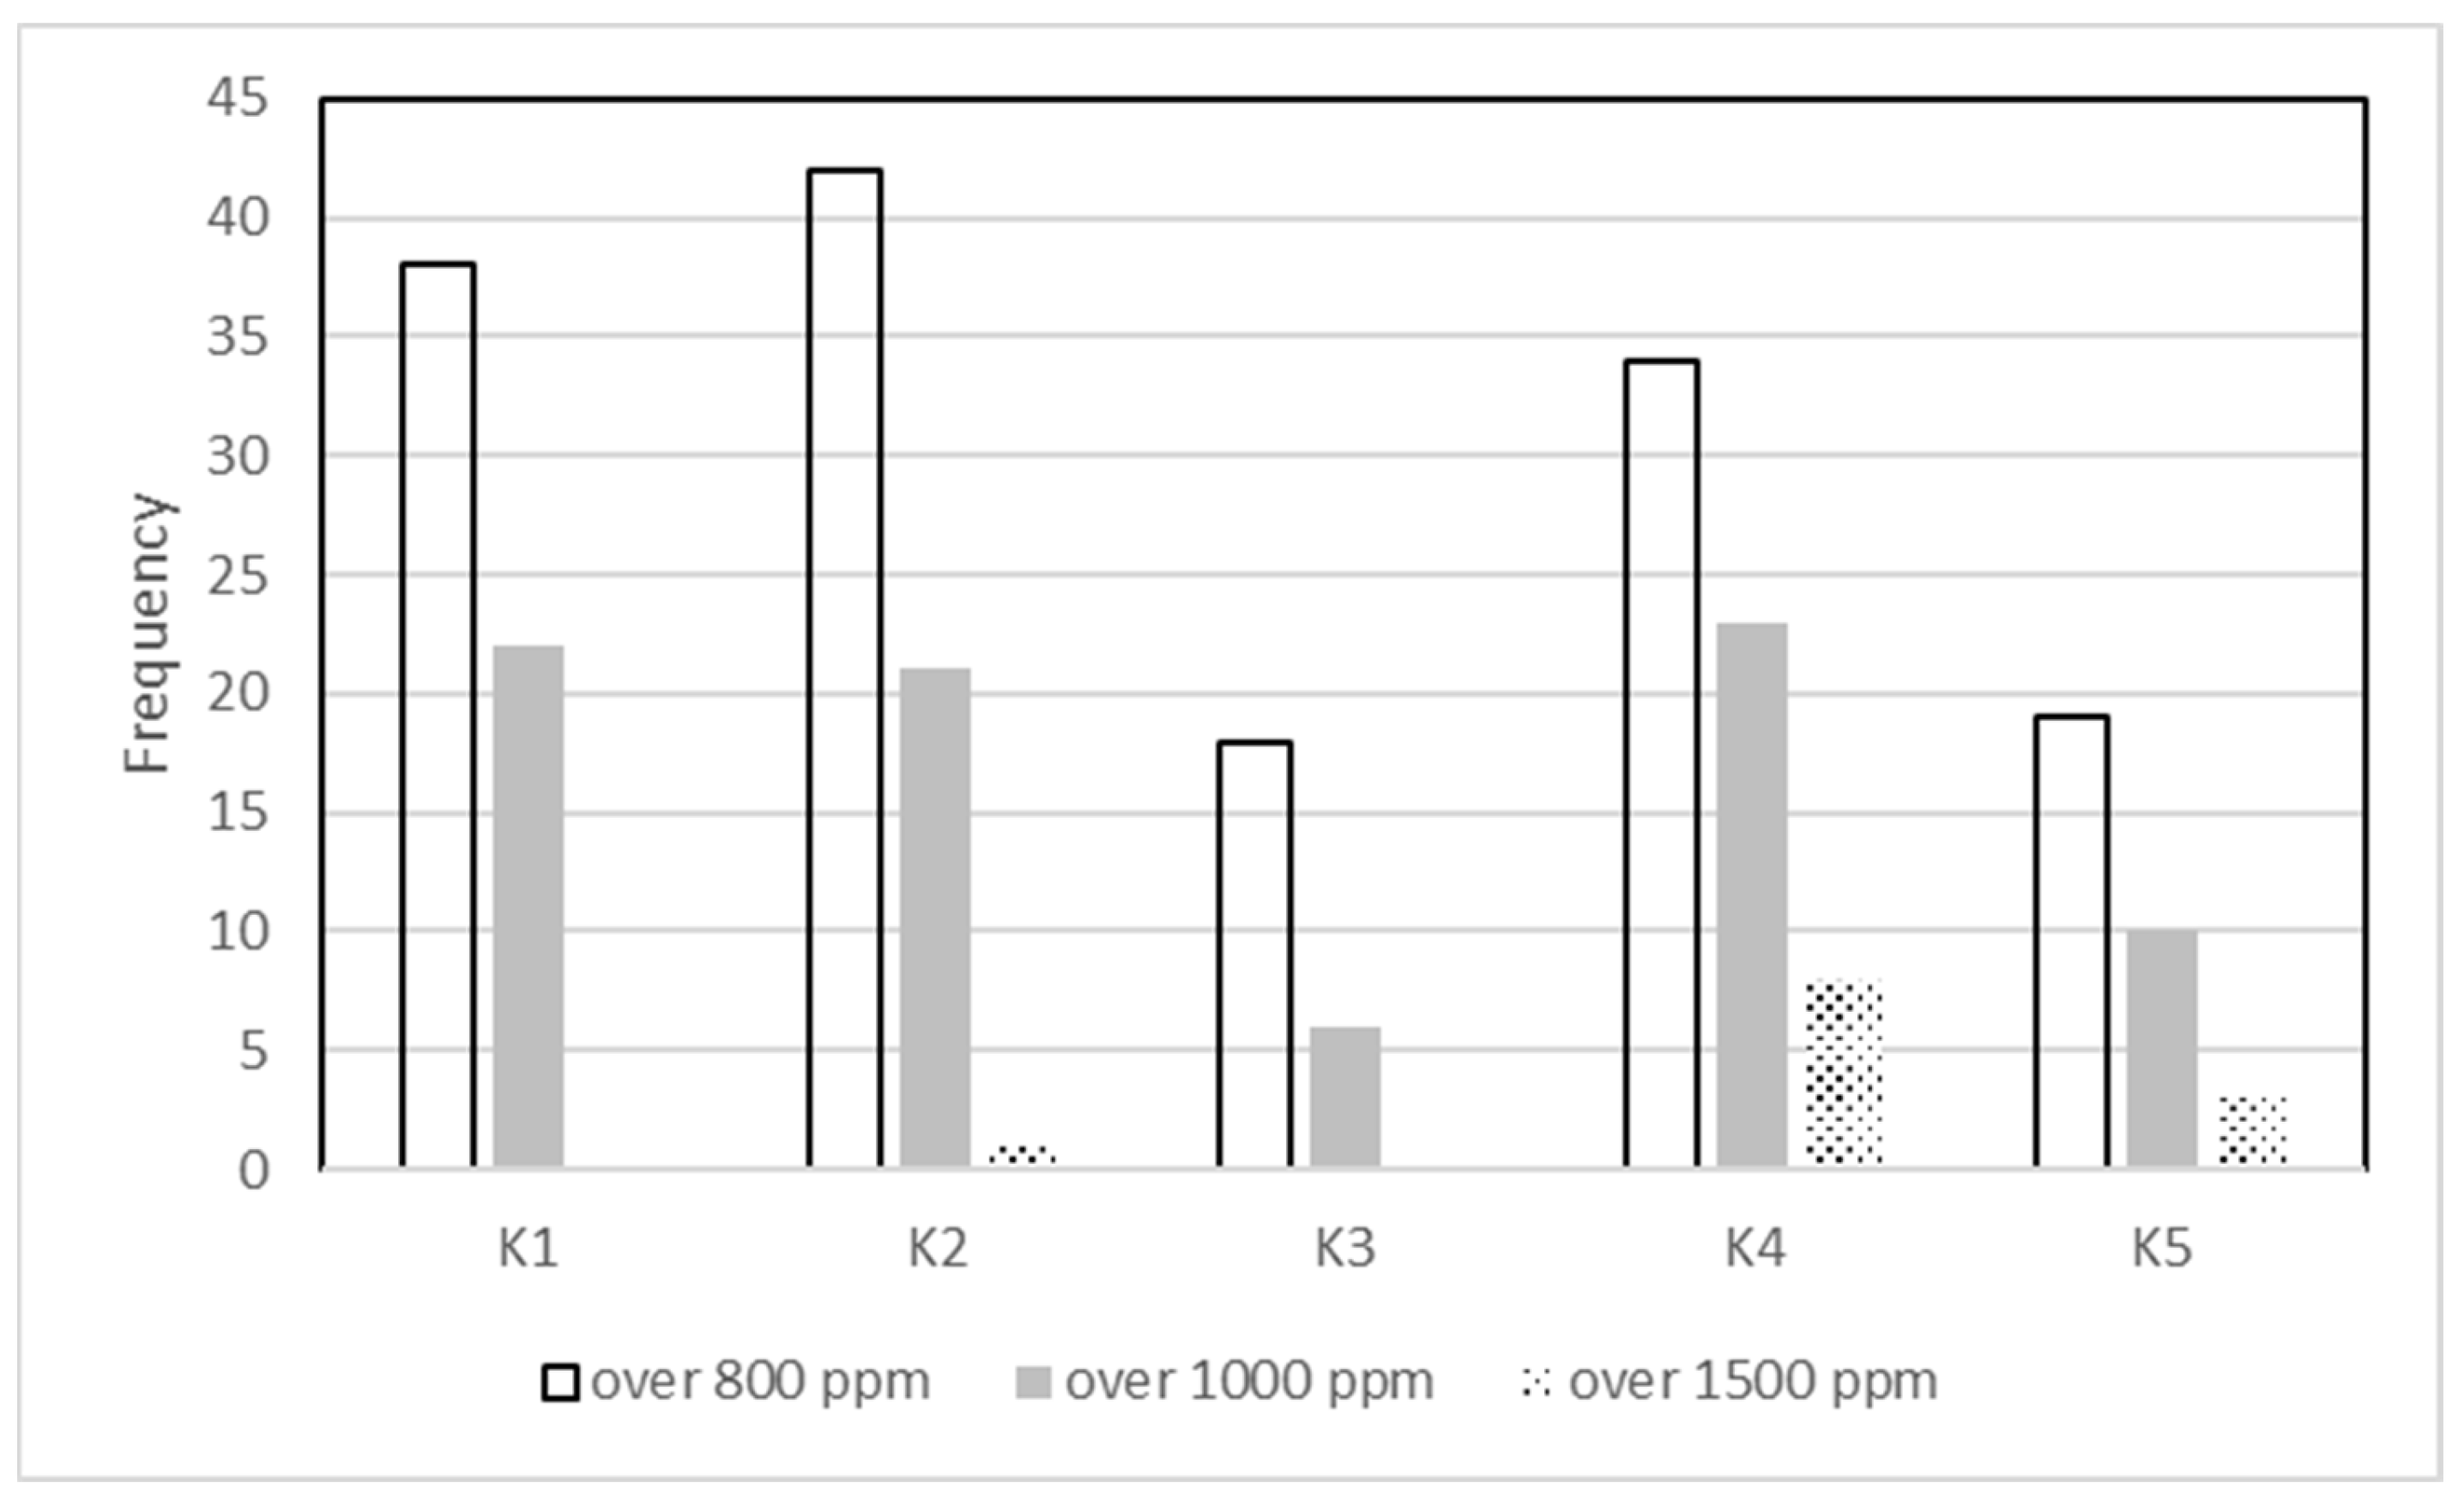
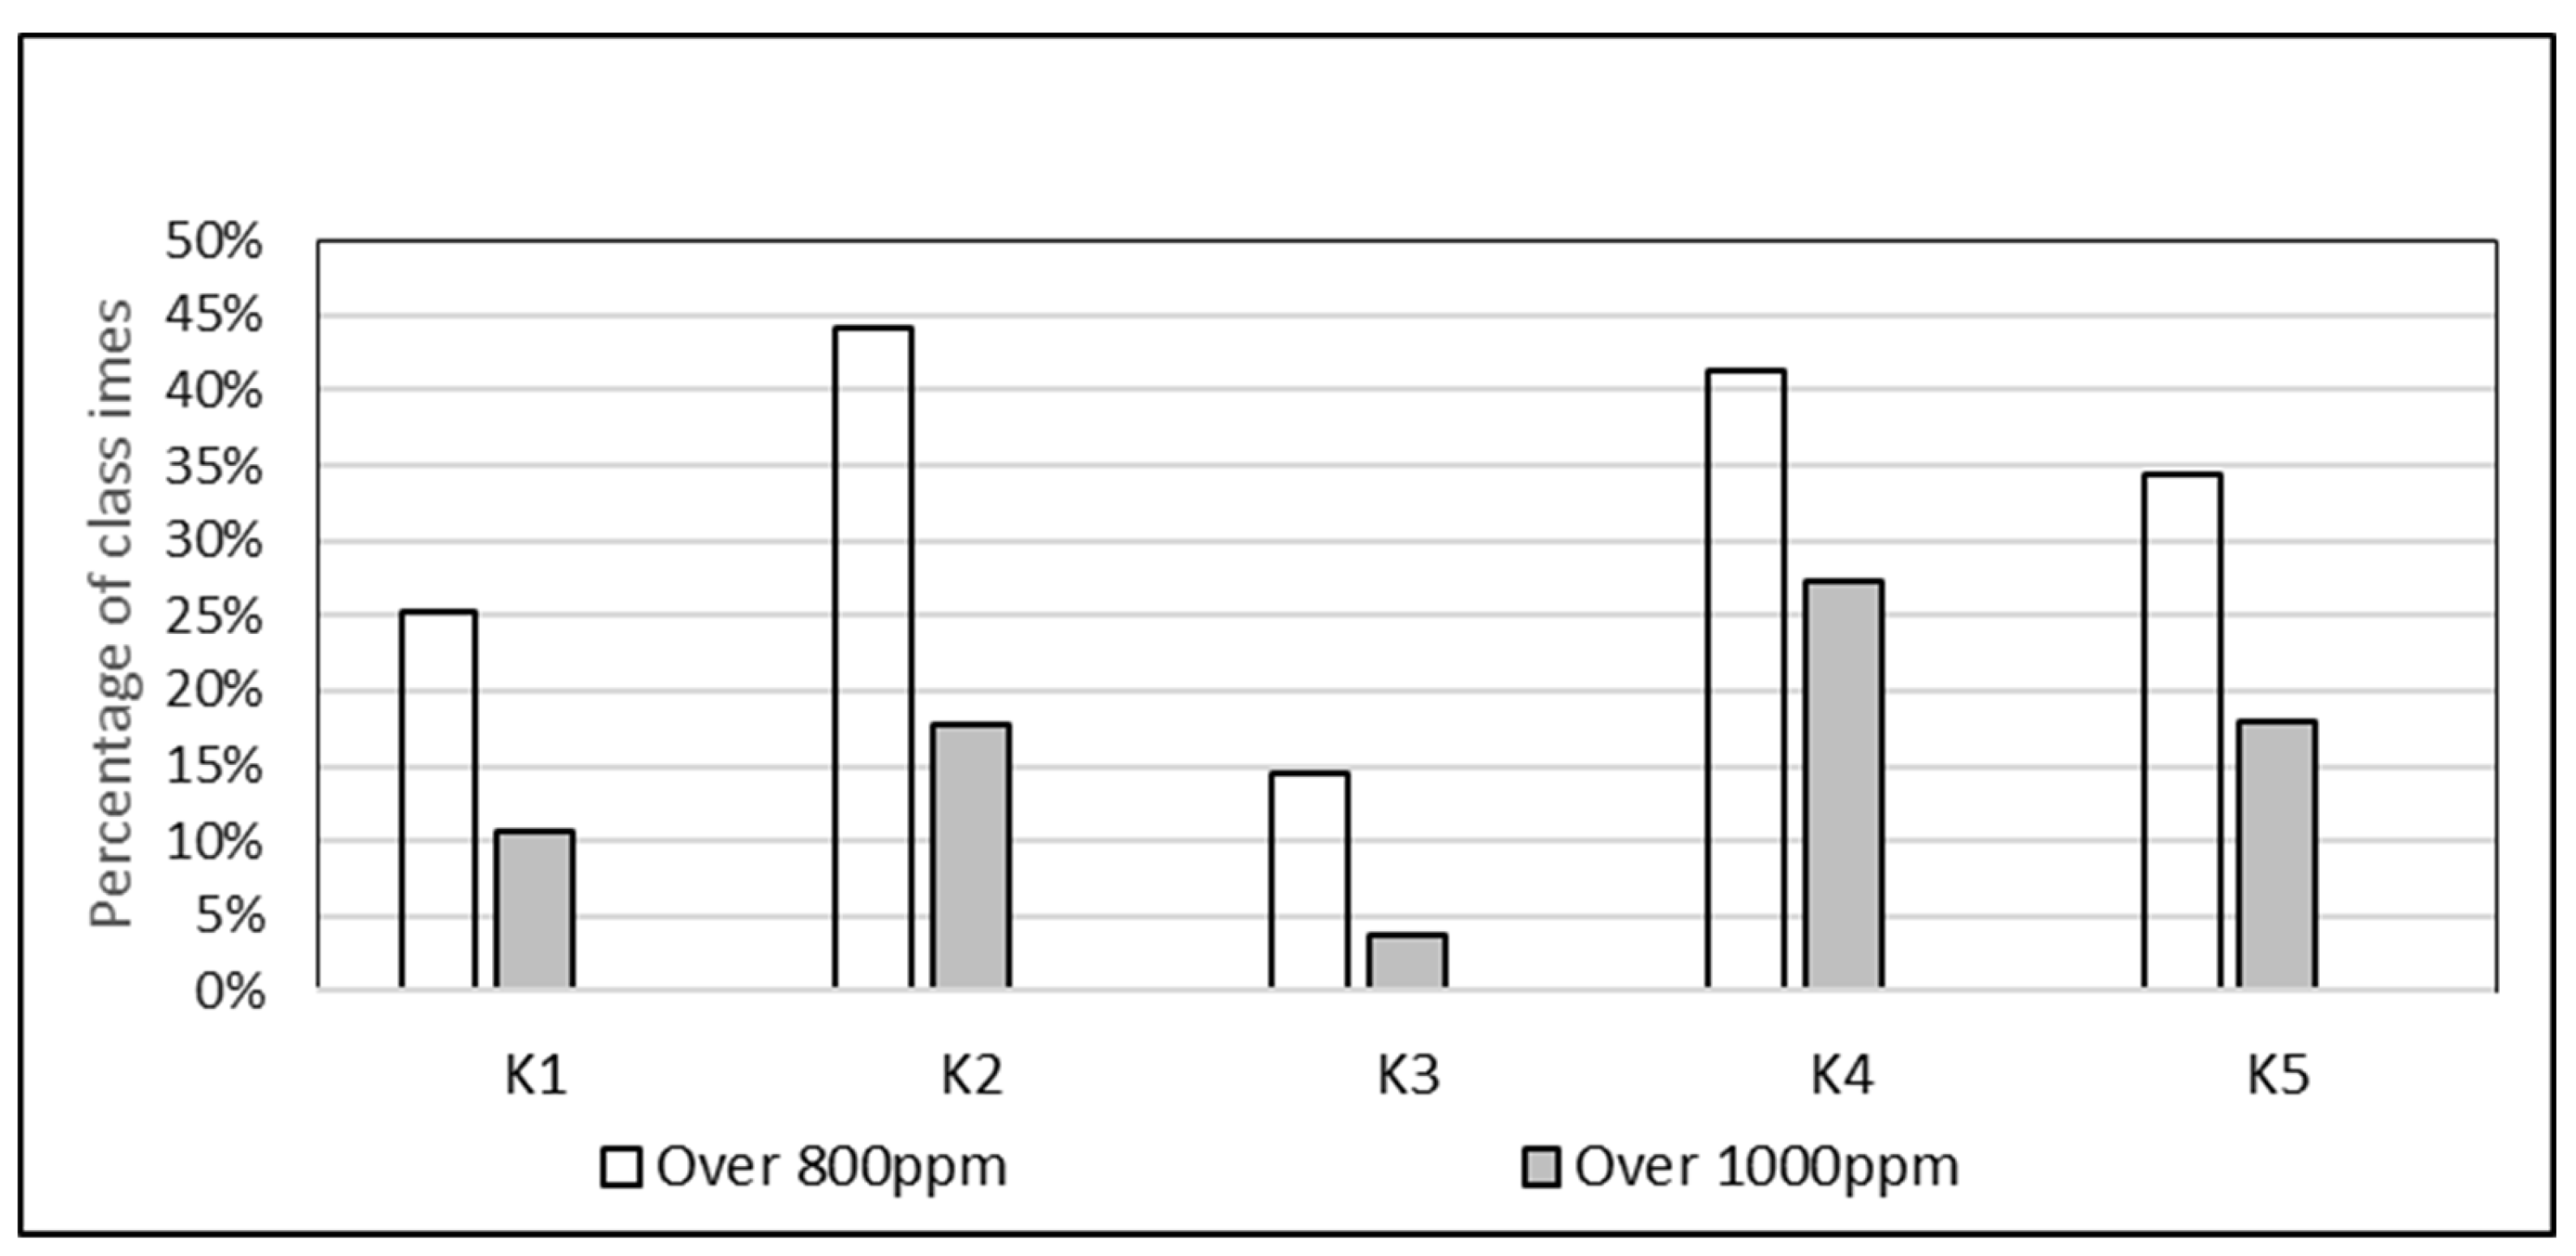
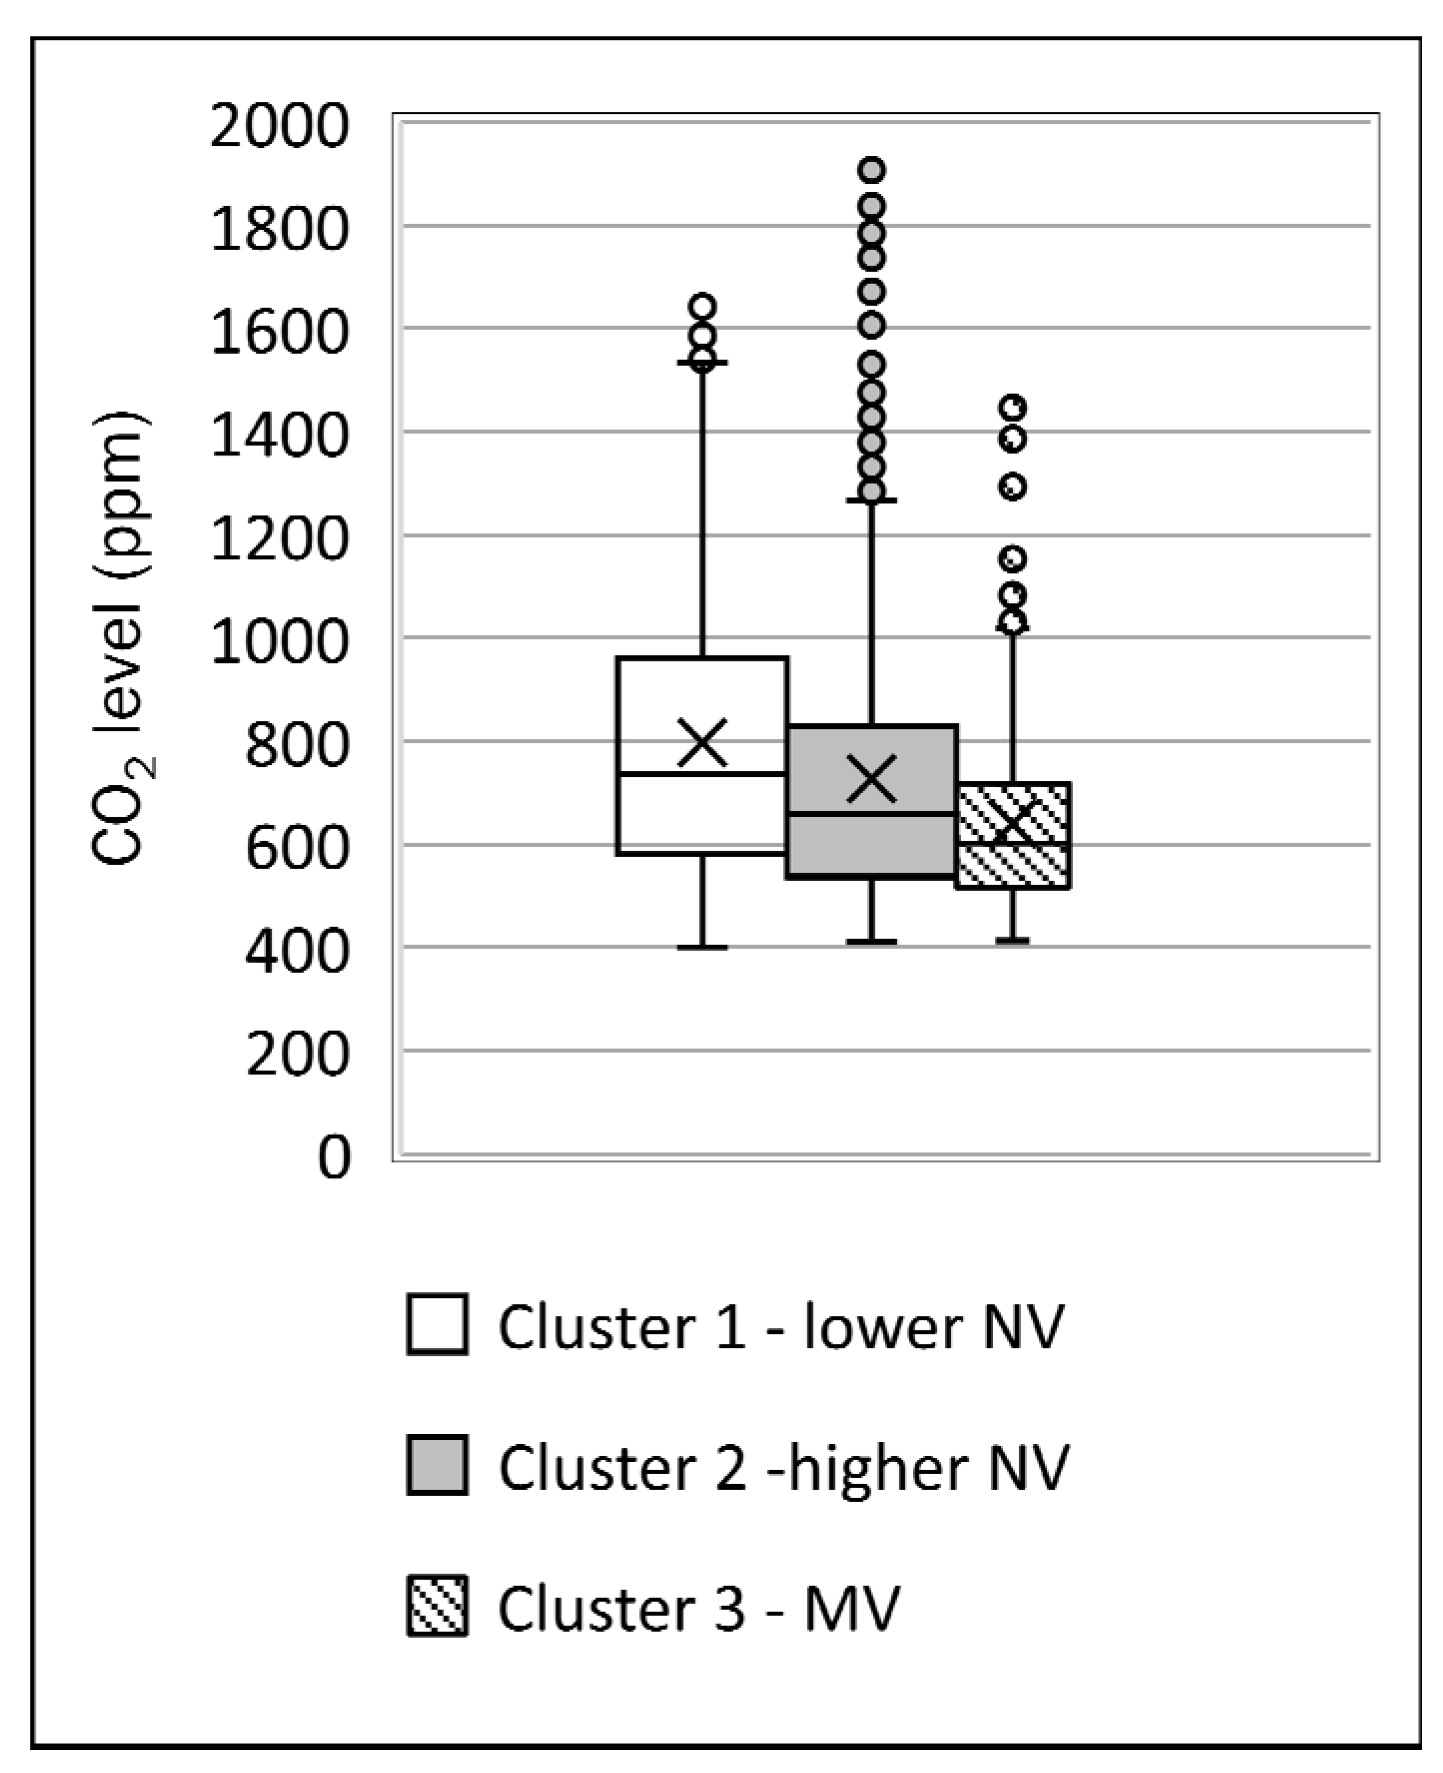
3.1. IAQ and Ventilation

A summary of CO2 levels recorded at each kindergarten is included in Table 2. Ventilation rates were calculated with the steady-state method using the peak analysis approach as per Equation (1).
a = (Ng/V)/(CsCo)
where a is the air change rate, N is the number of occupants in the room, g is the indoor CO2 concentration rate per person, V is the volume of the room, Cs is the final CO2 concentration, and Co is the CO2 concentration in outdoor air. It is to be noted that a steady state was difficult to achieve in the kinder rooms due to the very low air change rates and varying levels of occupancy throughout the day. The peak CO2 concentration levels ranged from 1432 ppm to 1908 ppm, and average CO2 ranged from 640 ppm to 799 ppm. K5 had the highest average, and K3 had the lowest average. The ventilation rates calculated with peak CO2 concentration levels ranged from 2.1 to 3.1 Ls−1 per person, and the ventilation rates calculated with average peak CO2 concentration levels during class days ranged from 5.9 to 9.3 Ls−1 per person. All these ventilation rates are lower than 12 Ls−1 per person recommended by Australian Standards, AS 1668 [2].
To provide a further understanding of the achieved ventilation rates at the kindergartens, recorded CO2 concentrations for each center for each time interval during August class days were averaged and plotted on a time series in Figure 2. Figure 2 and Table 2 confirm that only K3, which has a fresh air supply through its heating and cooling system, maintained an average peak CO2 value that did not exceed 800 ppm. Data covering all August class times was also reviewed using box and whiskers, as seen in Figure 3. The cross marks in the center area represent the mean and the small circles above the maximum represent outliers.
Figure 3 demonstrates that K3, which was observed to be using natural ventilation during the monitoring day and the only kindergarten with mechanical ventilation, had the lowest mean and upper quartile CO2 levels. The upper quartile for K3 was 718 ppm. No other kindergarten had an upper quartile below 800 ppm. Data were analyzed to demonstrate how long the high CO2 levels lasted, the number of high CO2 level exceedances, and the percentage of class times with high CO2 levels, as seen in Figure 4, Figure 5 and Figure 6. The data used in Figure 5 were based on 15-min intervals, and each time CO2 concentration exceeded the threshold, it was counted as an exceedance.
Figure 4, Figure 5 and Figure 6 show that the kindergartens often exceeded 800 ppm of CO2, the level recommended to keep below during the COVID-19 pandemic [23,24,26]. It can also be seen from the figure that they exceeded 1000 ppm, which is the generally accepted maximum level of 1000 ppm for significant periods. Figure 5 shows K3, with fresh air supplied through the heating and cooling system in addition to natural ventilation, had the lowest percentage of class time exceedance of both 800 ppm and 1000 ppm, 14 and 4%, respectively. Figure 6 demonstrates that K3 also had the lowest number of exceedances of all threshold values. Figure 7 demonstrates the percentage of class time that natural ventilation was observed to be used at the kindergartens on the main monitoring day. Figure 8 presents IAQ results in clusters based on ventilation design and levels. Natural ventilation was quantified based on the amount of time one or more windows or doors were open. Two levels of natural ventilation were noted. K2 and K4 have lower levels of natural ventilation, and K1 and K5 have higher levels of natural ventilation.
Figure 7 and Figure 8 demonstrate that K2 and K4 with lower levels of natural ventilation (NV) had higher CO2 levels than the other kindergartens with higher natural ventilation. When analyzing data on the main monitoring day, natural ventilation was found to be correlated with a reduction in CO2 levels, and higher occupant density (per m3) was found to lead to higher CO2 levels.
Although the recorded CO2 levels at the kindergartens were above recommended levels, they were less than those identified in school classrooms in other studies conducted before the pandemic. Multiple recent studies have recorded higher CO2 levels in school classrooms, including levels over 5000 ppm [4,8]. This is mainly because of the instructions to open windows and doors. Although providing fresh air with the heating and cooling system at K3 has led to lower CO2 levels, there were still instances of 1000 ppm being exceeded at this kindergarten. Mechanical plans show that the air conditioning unit serving the kindergarten room is designed to provide 235 Ls−1 of fresh air when operating. Under AS 1668.2, this could be used to provide fresh air for 20 people based on the 12 L/s requirement or a greater number with a suitable air filtration system [2]. On the main monitoring day, a maximum occupancy level of 27 was observed, equating to a fresh air rate of 8.7 L/s per person from the heating and cooling system. In 1989, when atmospheric CO2 level was lower, ASHRAE suggested 7.5 Ls−1 of ventilation would equate to 1000 ppm of CO2 [41]. This indicates that 8.9 Ls−1 should be roughly able to achieve 1000 ppm today based on the 18% increase in atmospheric CO2 since 1989 [42,43]. Wall-mounted CO2 sensor alarm thresholds can be set for each kindergarten based on recommended CO2 levels and what is achievable in the kindergarten room while maintaining an adequate level of thermal comfort. Teachers should be trained in appropriate interventions to improve ventilation, looking at the CO2 readings for balancing ventilation and thermal comfort.

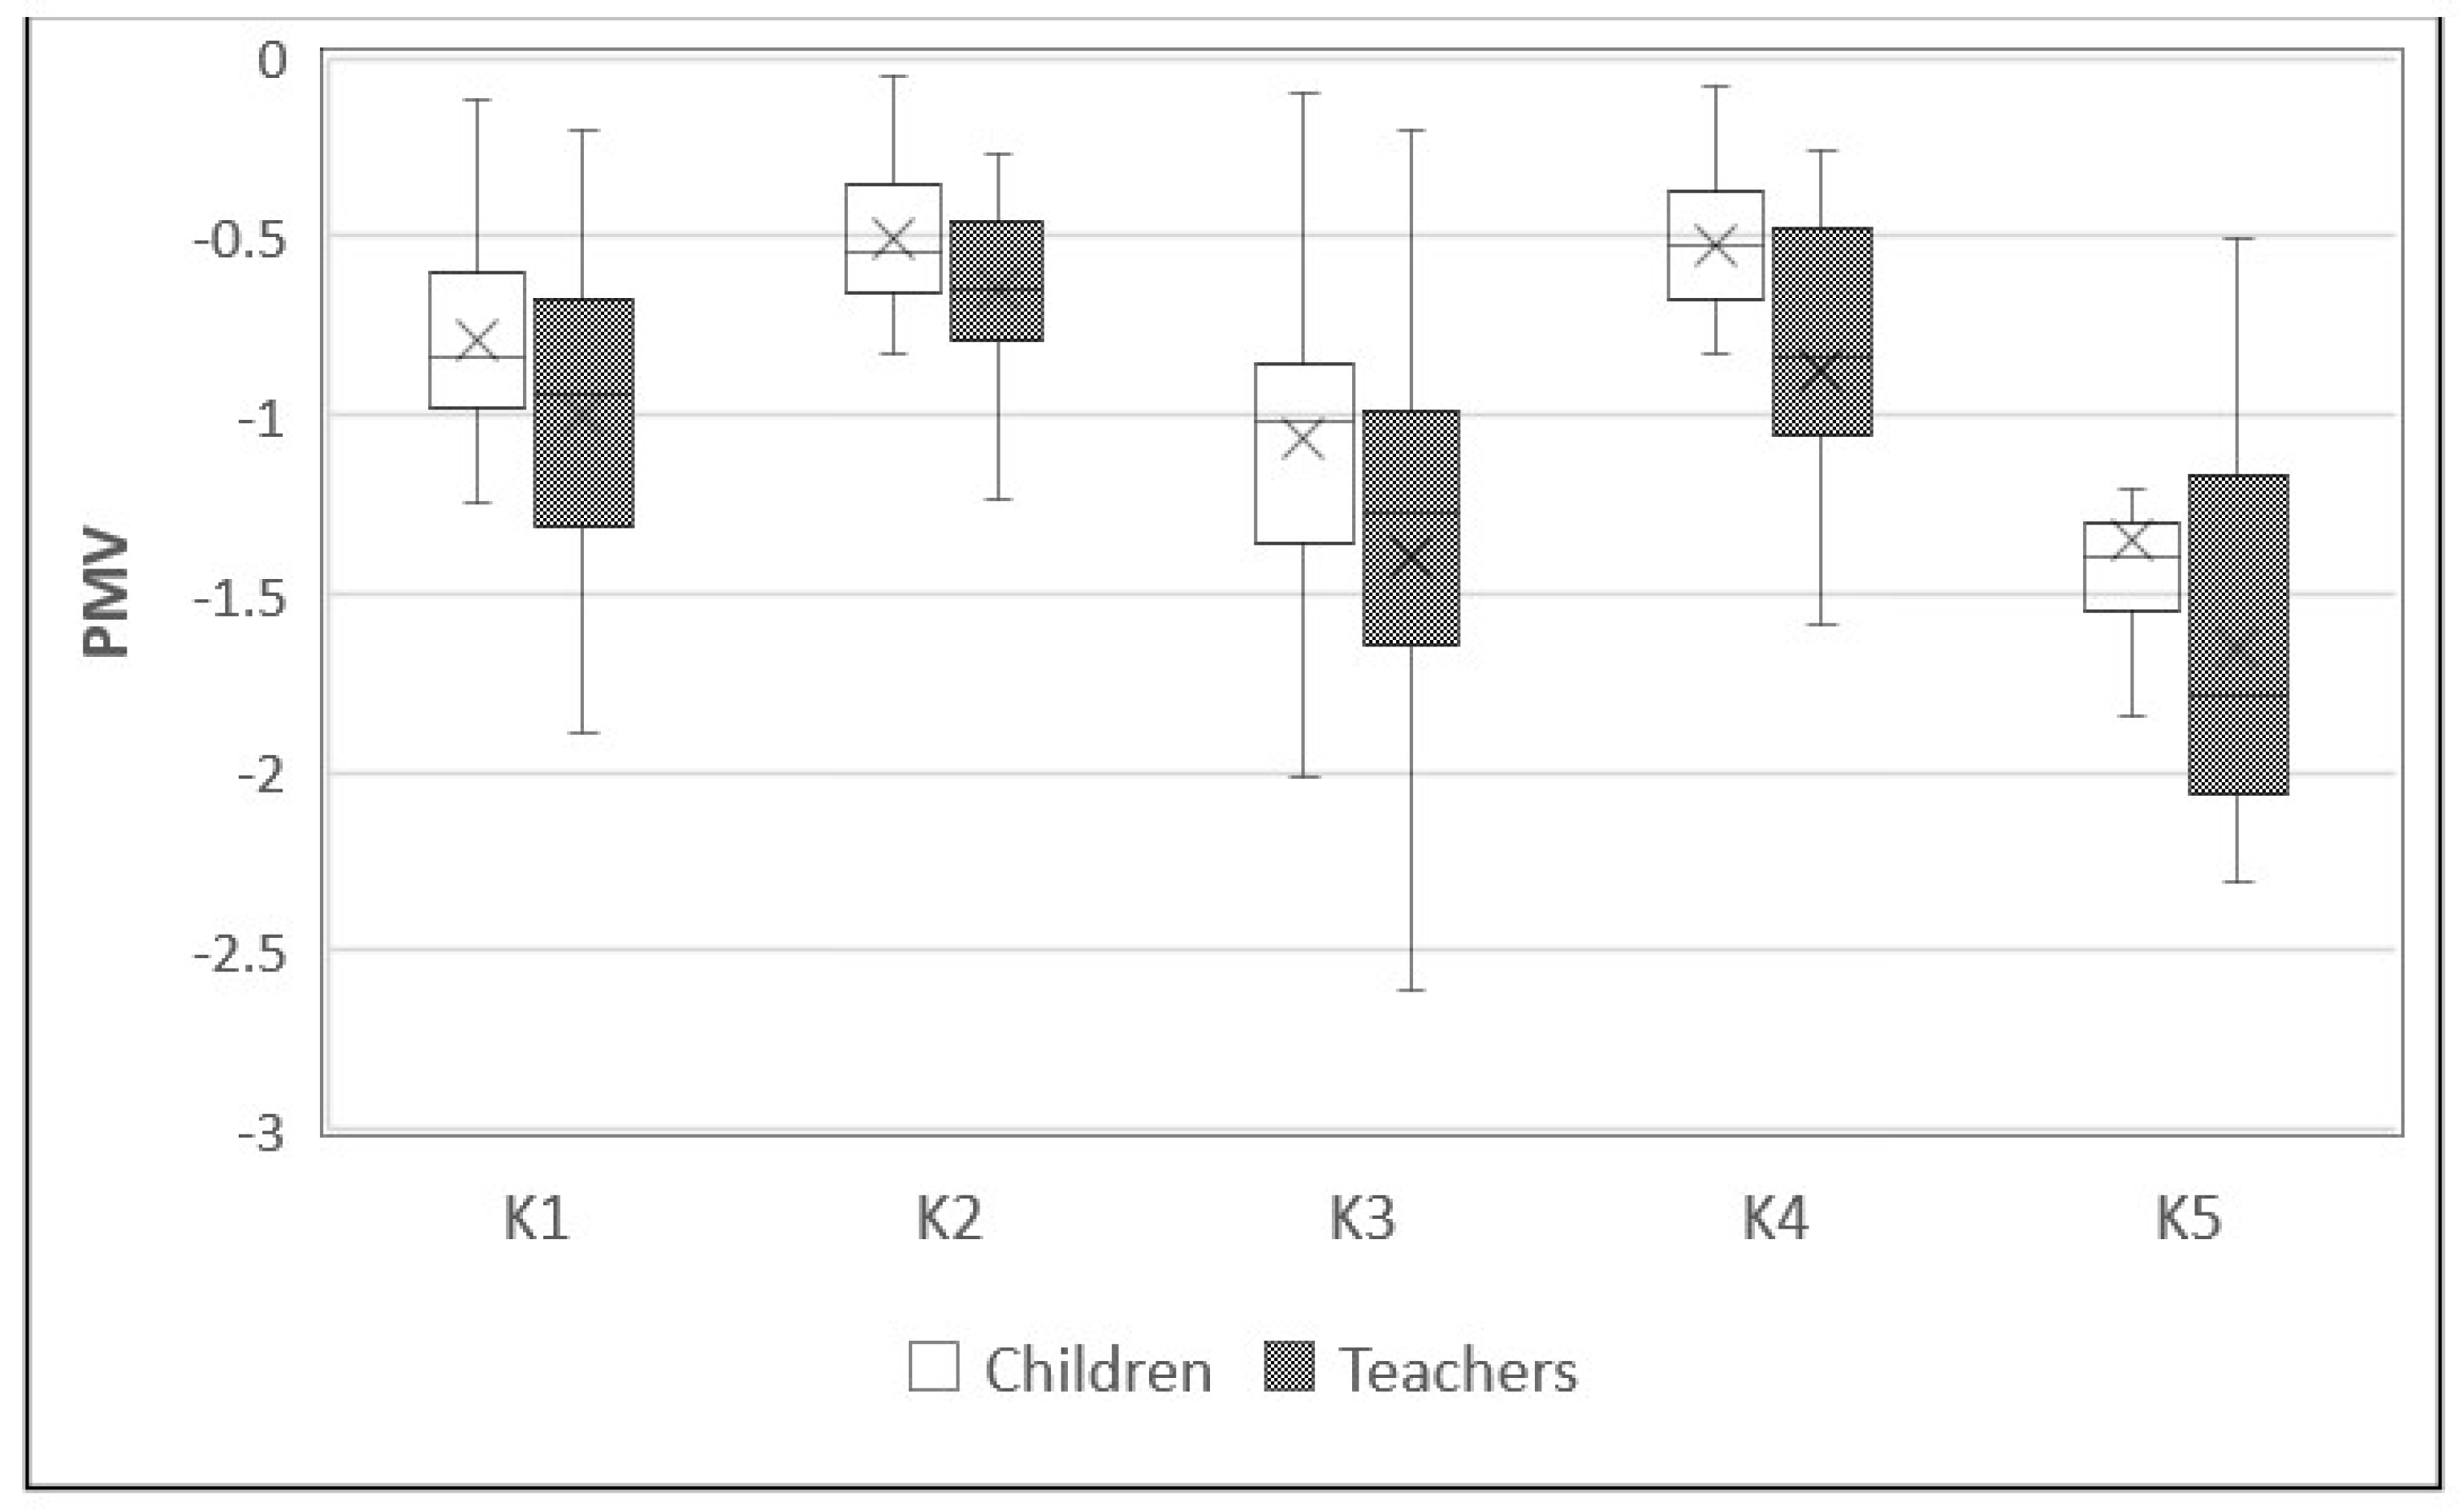
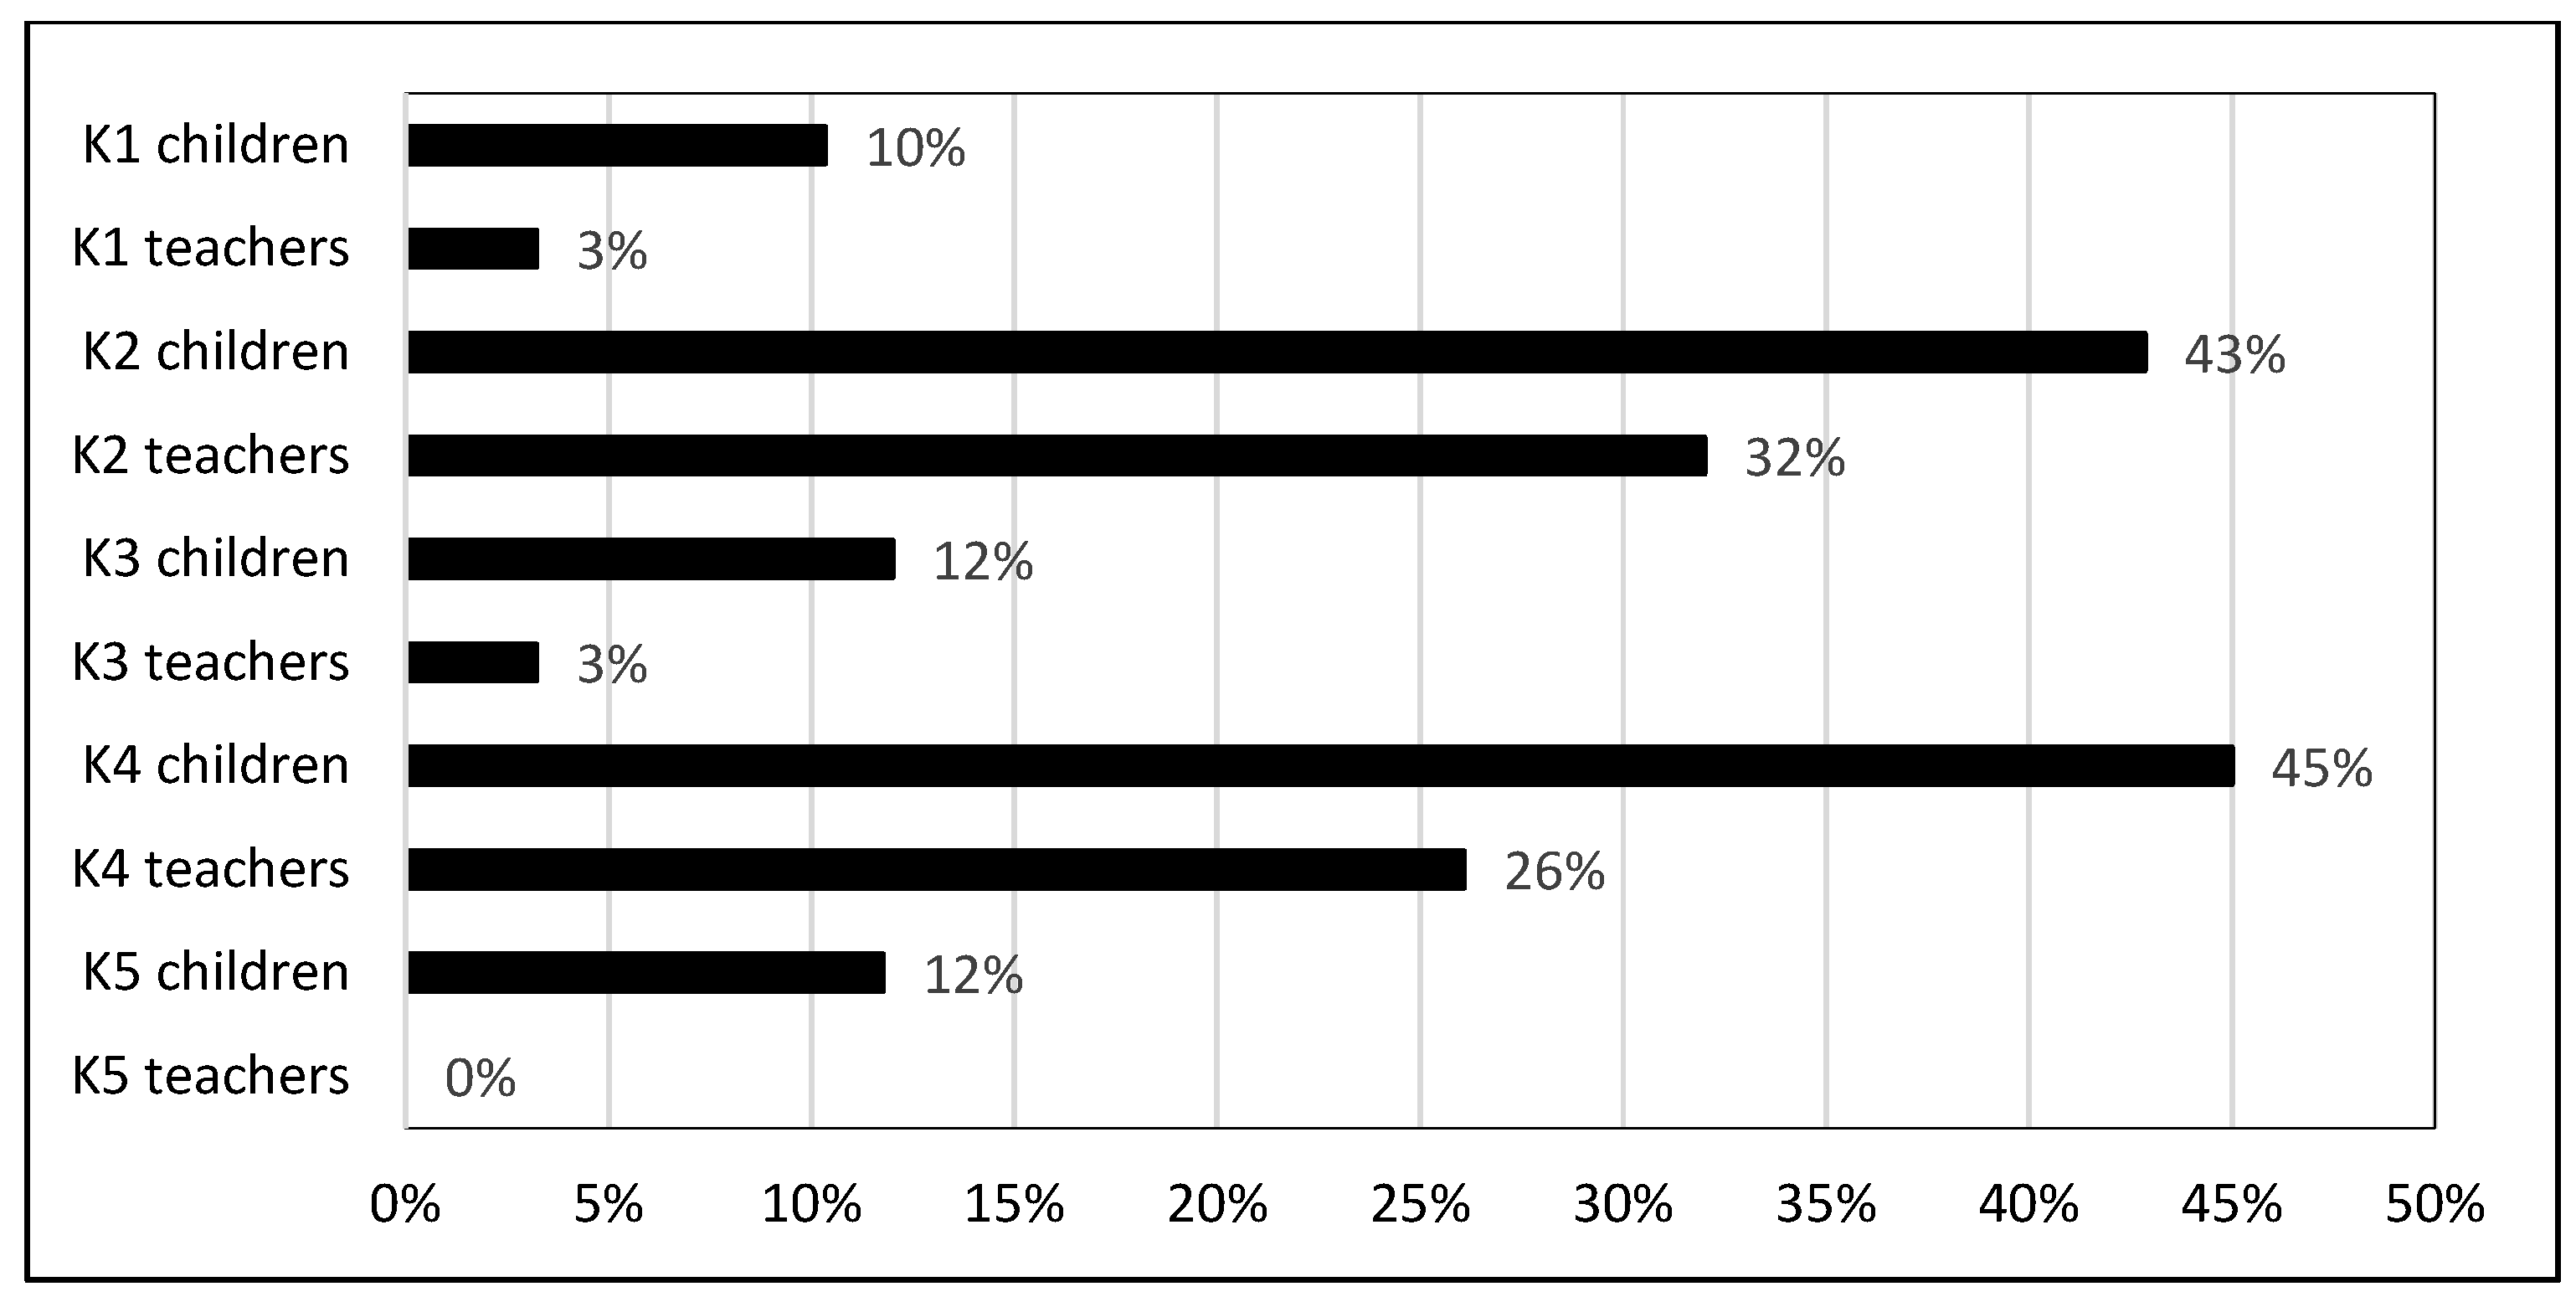
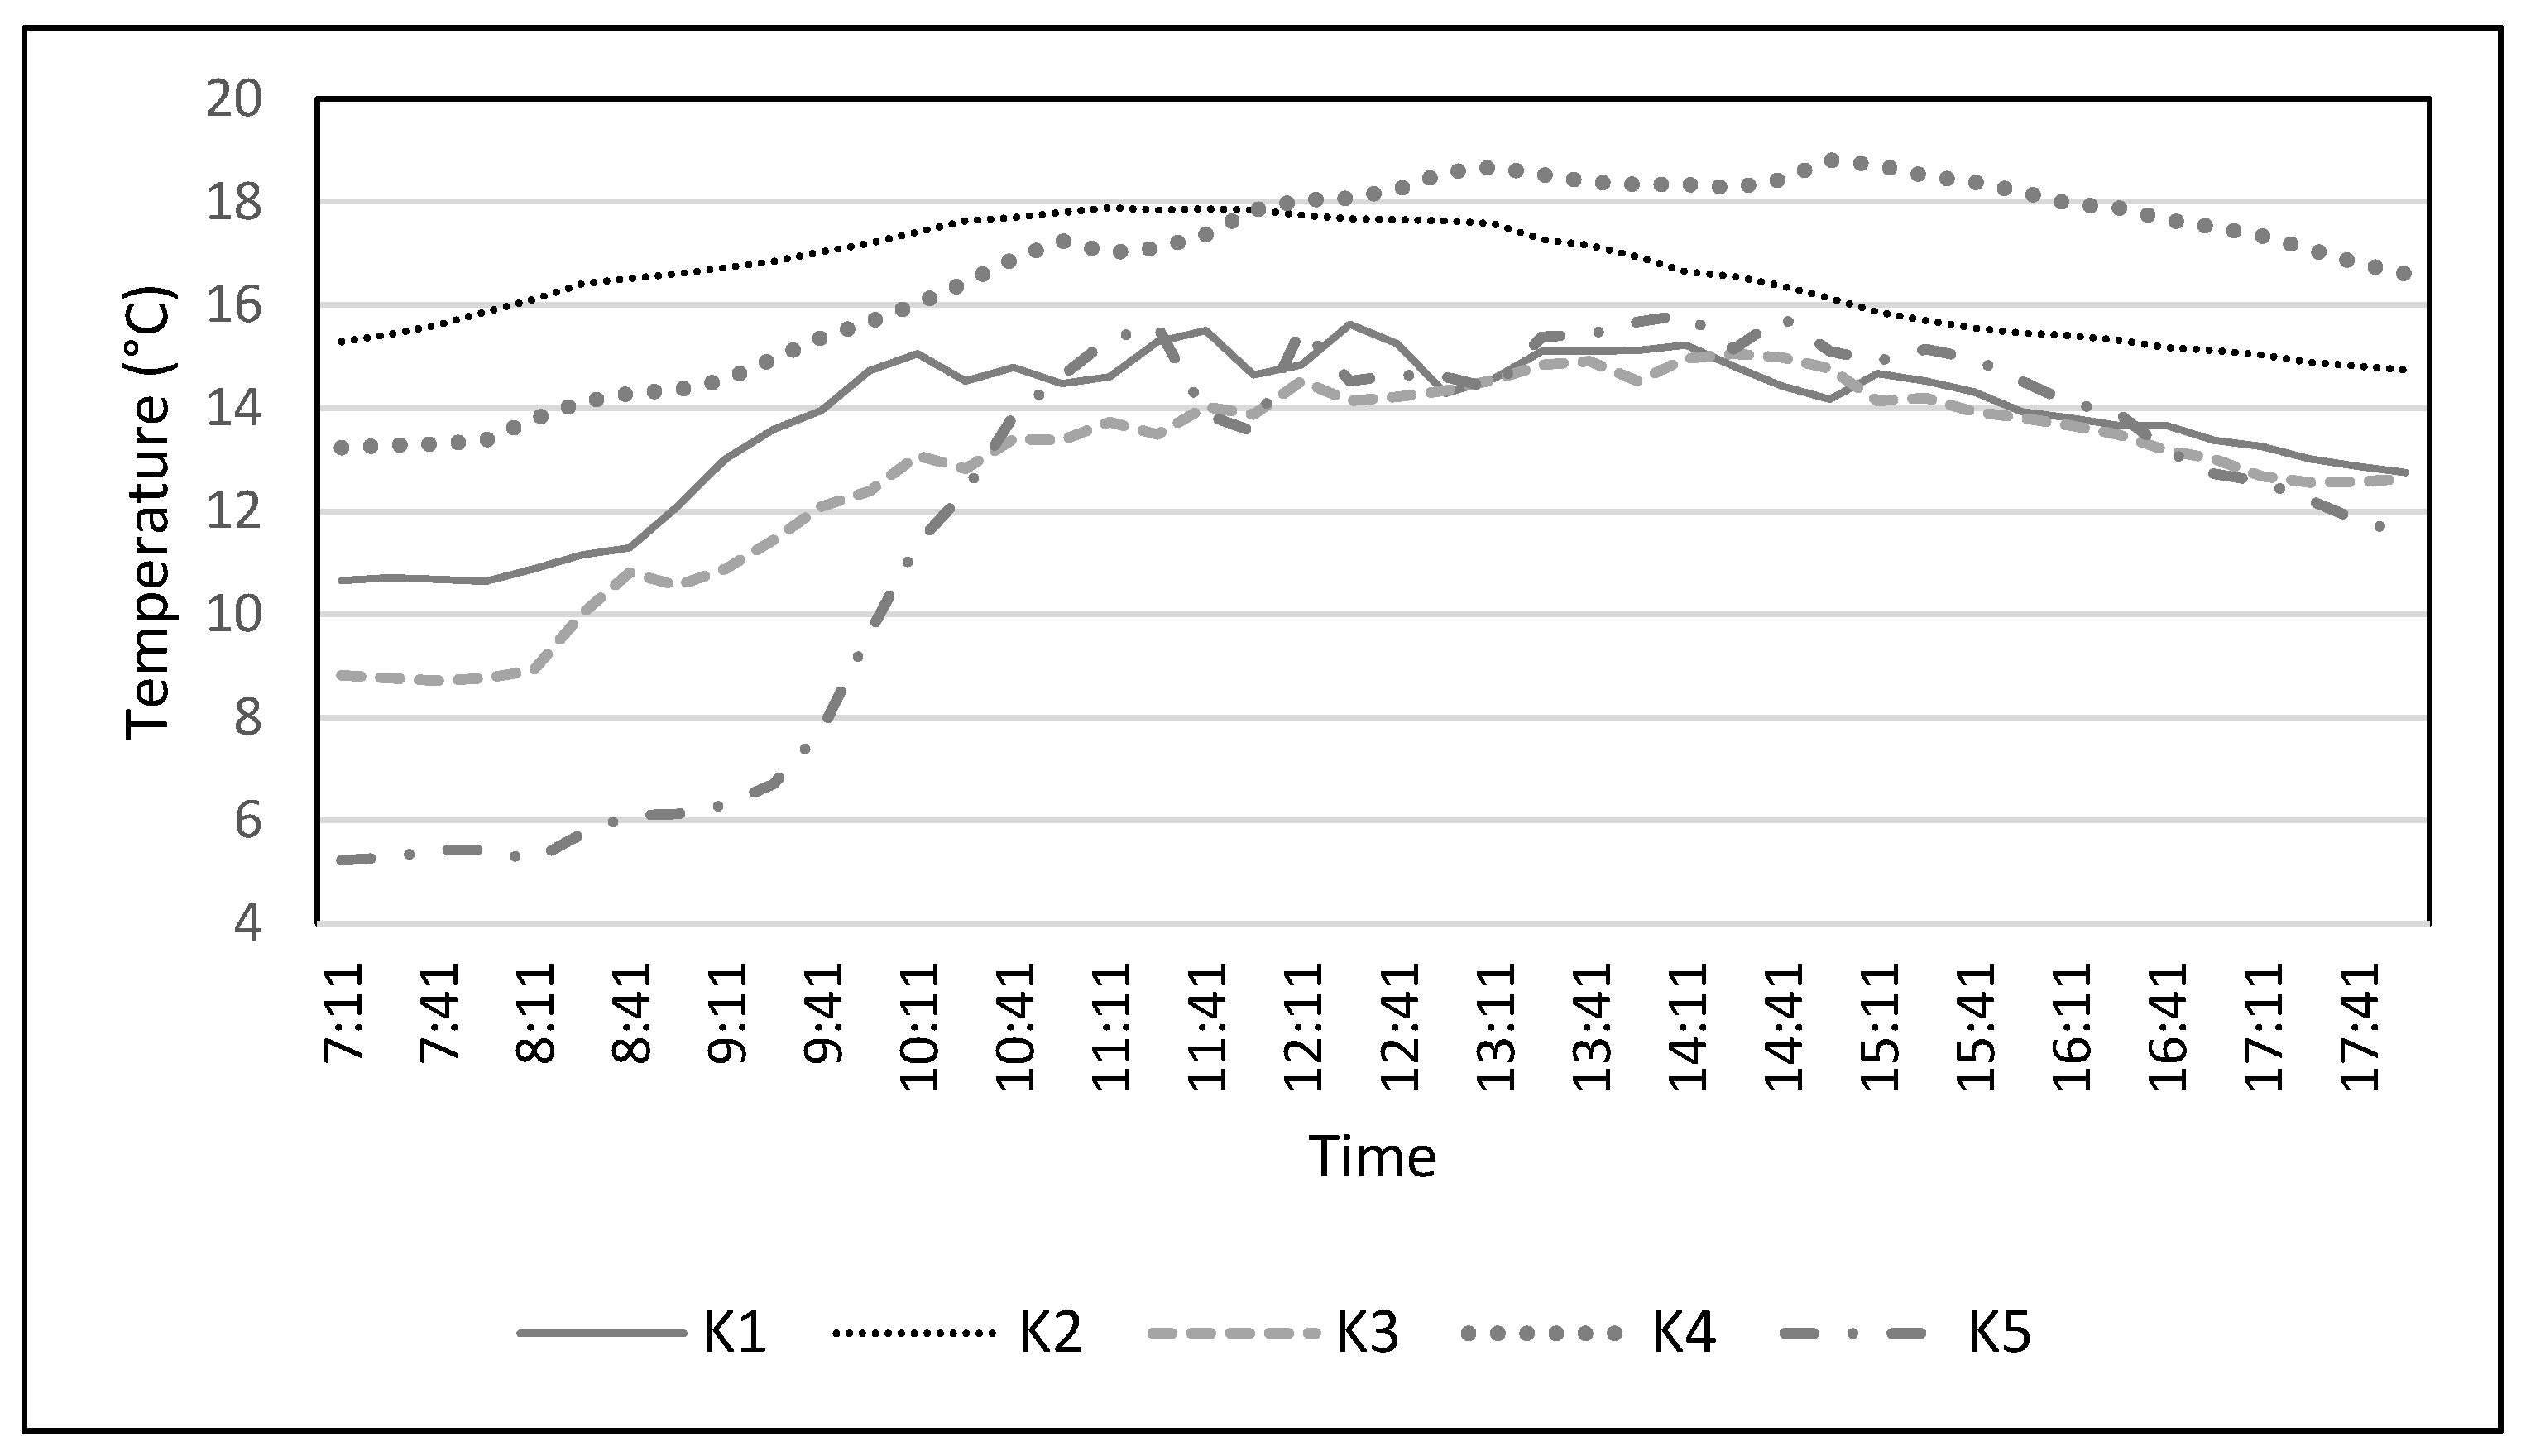
3.2. Thermal Comfort

Following analysis of IAQ and ventilation, thermal comfort was investigated using PMV and PPD indices. PMV and PPD results were analyzed using box and whisker plots for both teachers and children. This analysis takes into consideration air speed, MRT, air temperature, humidity, clothing level, and activity rate. The air temperature measured was between 12 and 22 °C, whereas the air velocity ranged between 0.03 and 0.42 m/s. Relative humidity ranged between 44 to 54%. PPD of 10% or less is recommended for general comfort in ASHRAE Standard 55 [39]. Figure 9 and Figure 10 show PPD and PMV results, respectively. The median PMV ranged between −0.5 to −1.4 for children and −0.65 to −1.8 for teachers. ASHRAE Standard 55 [39] outlines a PMV range of −0.5 to +0.5 as being acceptable for general comfort, and Figure 11 shows the percent of recorded time PMV within this range.
Figure 9 confirms that on main monitoring days, K5 generally had the lowest calculated comfort, with a median PPD of 67% for teachers and 46% for children and upper quartiles of 54 and 80% for children and teachers, respectively. K5 had the coolest internal class time average temperature throughout August. K2 had the highest level of comfort on the main monitoring day, with a median PPD of 11% for children and 14% for teachers.
For PMV analysis, zero indicates a neutral temperature, while positive values indicate feelings of warmth and negative values cold feelings. Figure 10 shows that all kindergartens’ thermal comfort levels are related to being cooler than neutral, which is what would be expected in winter. Figure 11 shows that an acceptable comfort level was achieved at all the kindergartens at some point during the day; however, the time within this zone was limited at K1, K3, and K5. Figure 10 shows that only K2 and K4 had upper quartiles in this range. Children and teachers in K3 and K5 often had a calculated PMV below −1, indicating cooler thermal conditions. External temperatures measured at each of the kindergartens are shown in Figure 12, and this shows that K5, which is located at the highest elevation, had the coolest external conditions, which could impact internal comfort.
ASHRAE Standard 55 [39] also provides an alternative adaptive model for determining acceptable thermal conditions in occupant-controlled naturally ventilated spaces. The standard outlines that in these spaces, cooler indoor conditions will be acceptable in cooler weather and warmer conditions in warmer weather. Consistent with the adaptive model, de Dear et al. [44] confirmed that there was greater thermal tolerance in school students exposed to a wider range of weather variations. The relevance of the standard’s adaptive model for children in kindergartens can be questioned, as artificial heating and cooling are used, and children cannot open and close windows. The adaptive comfort analysis was, however, applied to the kindergartens, and it demonstrated that acceptable thermal comfort was achieved nearly all the time in K2 to K4, 97% of the time in K1, and 57% of the time in K5, the main monitoring days.
K3 did not have a particularly low air temperature on the main monitoring day, though it had low PMV values with means below −1 for teachers and children and mean PPD of 32% for children and 44% for teachers. On the main monitoring day, the air temperature was above 18 °C for 86% of the observed period and over 20 °C for 32% of it. Children and teachers had similar activity and clothing levels to other kindergartens. This kindergarten, however, had a higher air velocity reading of 0.2 m/s on average throughout the main monitoring day (compared to 0.08–0.12 m/s at the other centers) caused by its packaged air conditioning unit. This shows the impact of the kindergarten’s higher air velocity readings on thermal comfort calculations. Some areas of the room further away from the heating and cooling system supply air points may have experienced improved comfort levels.
This study used objective data to analyze thermal comfort in kindergartens. The lack of subjective responses about children’s comfort perceptions is a limitation of this study. Higher levels of discomfort were calculated at K5. This is also the only kindergarten observed to open windows in addition to doors. Although natural ventilation would affect comfort across the centers, a higher focus on ventilation at K5 may have a greater impact. The kindergarten’s lower outside air temperatures would also be influencing the thermal comfort conditions.

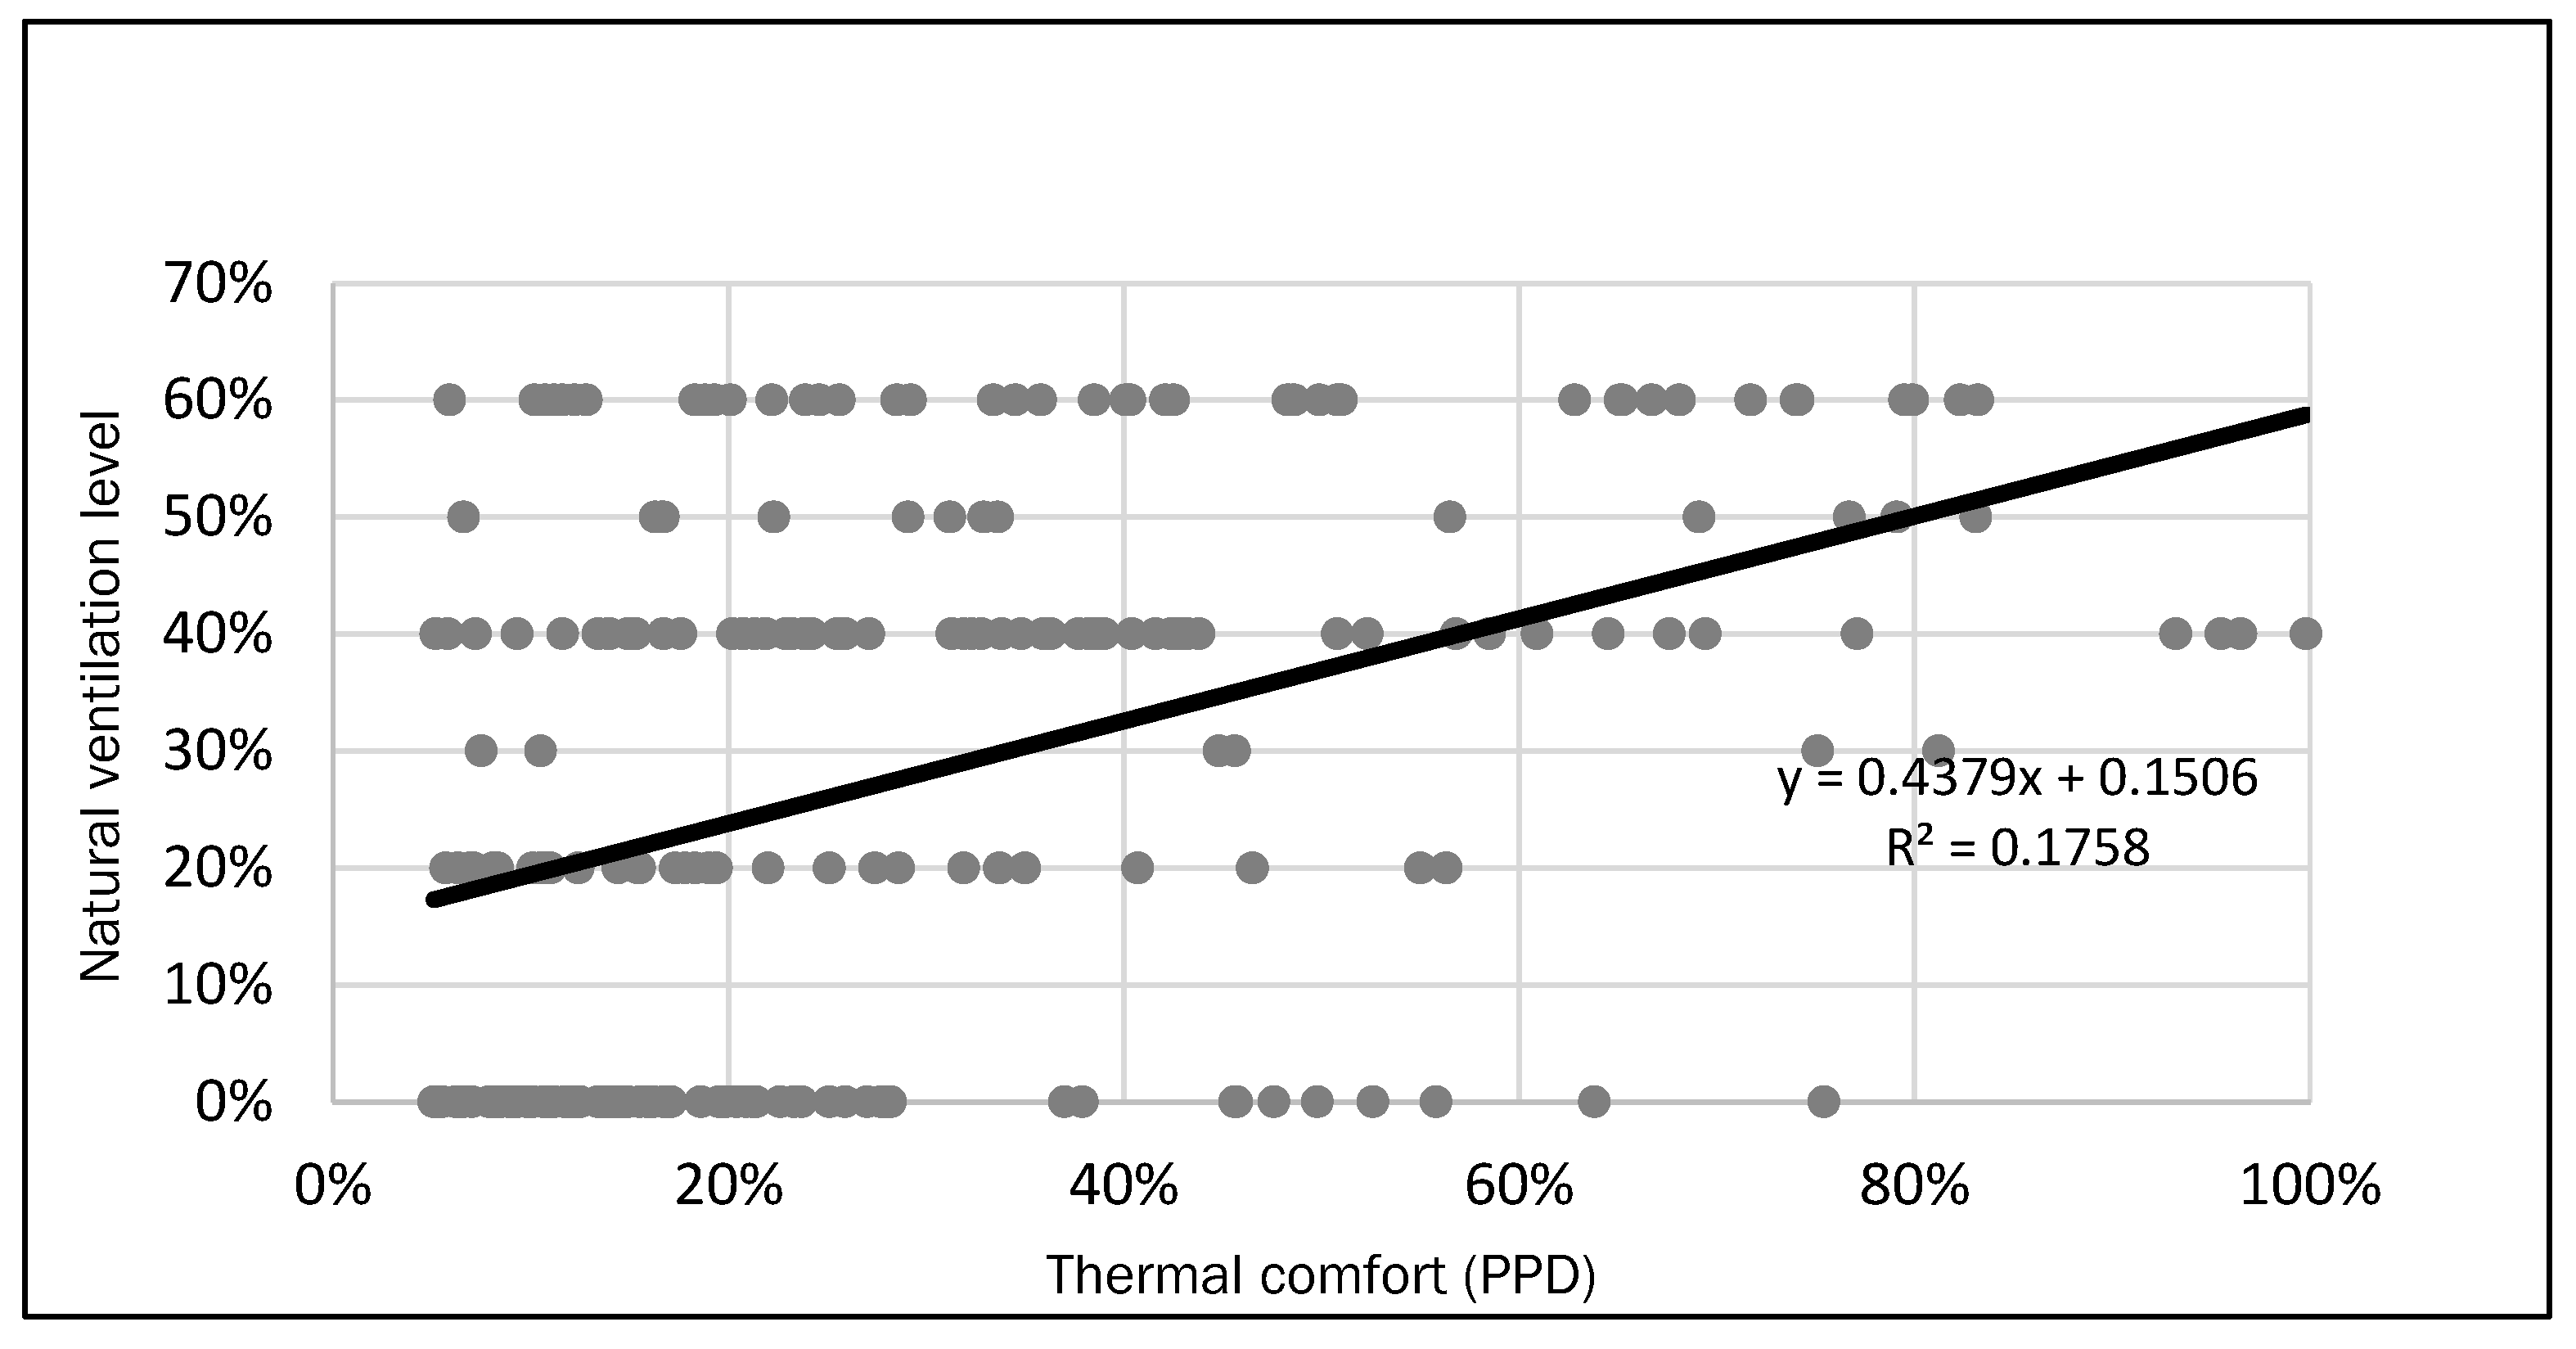
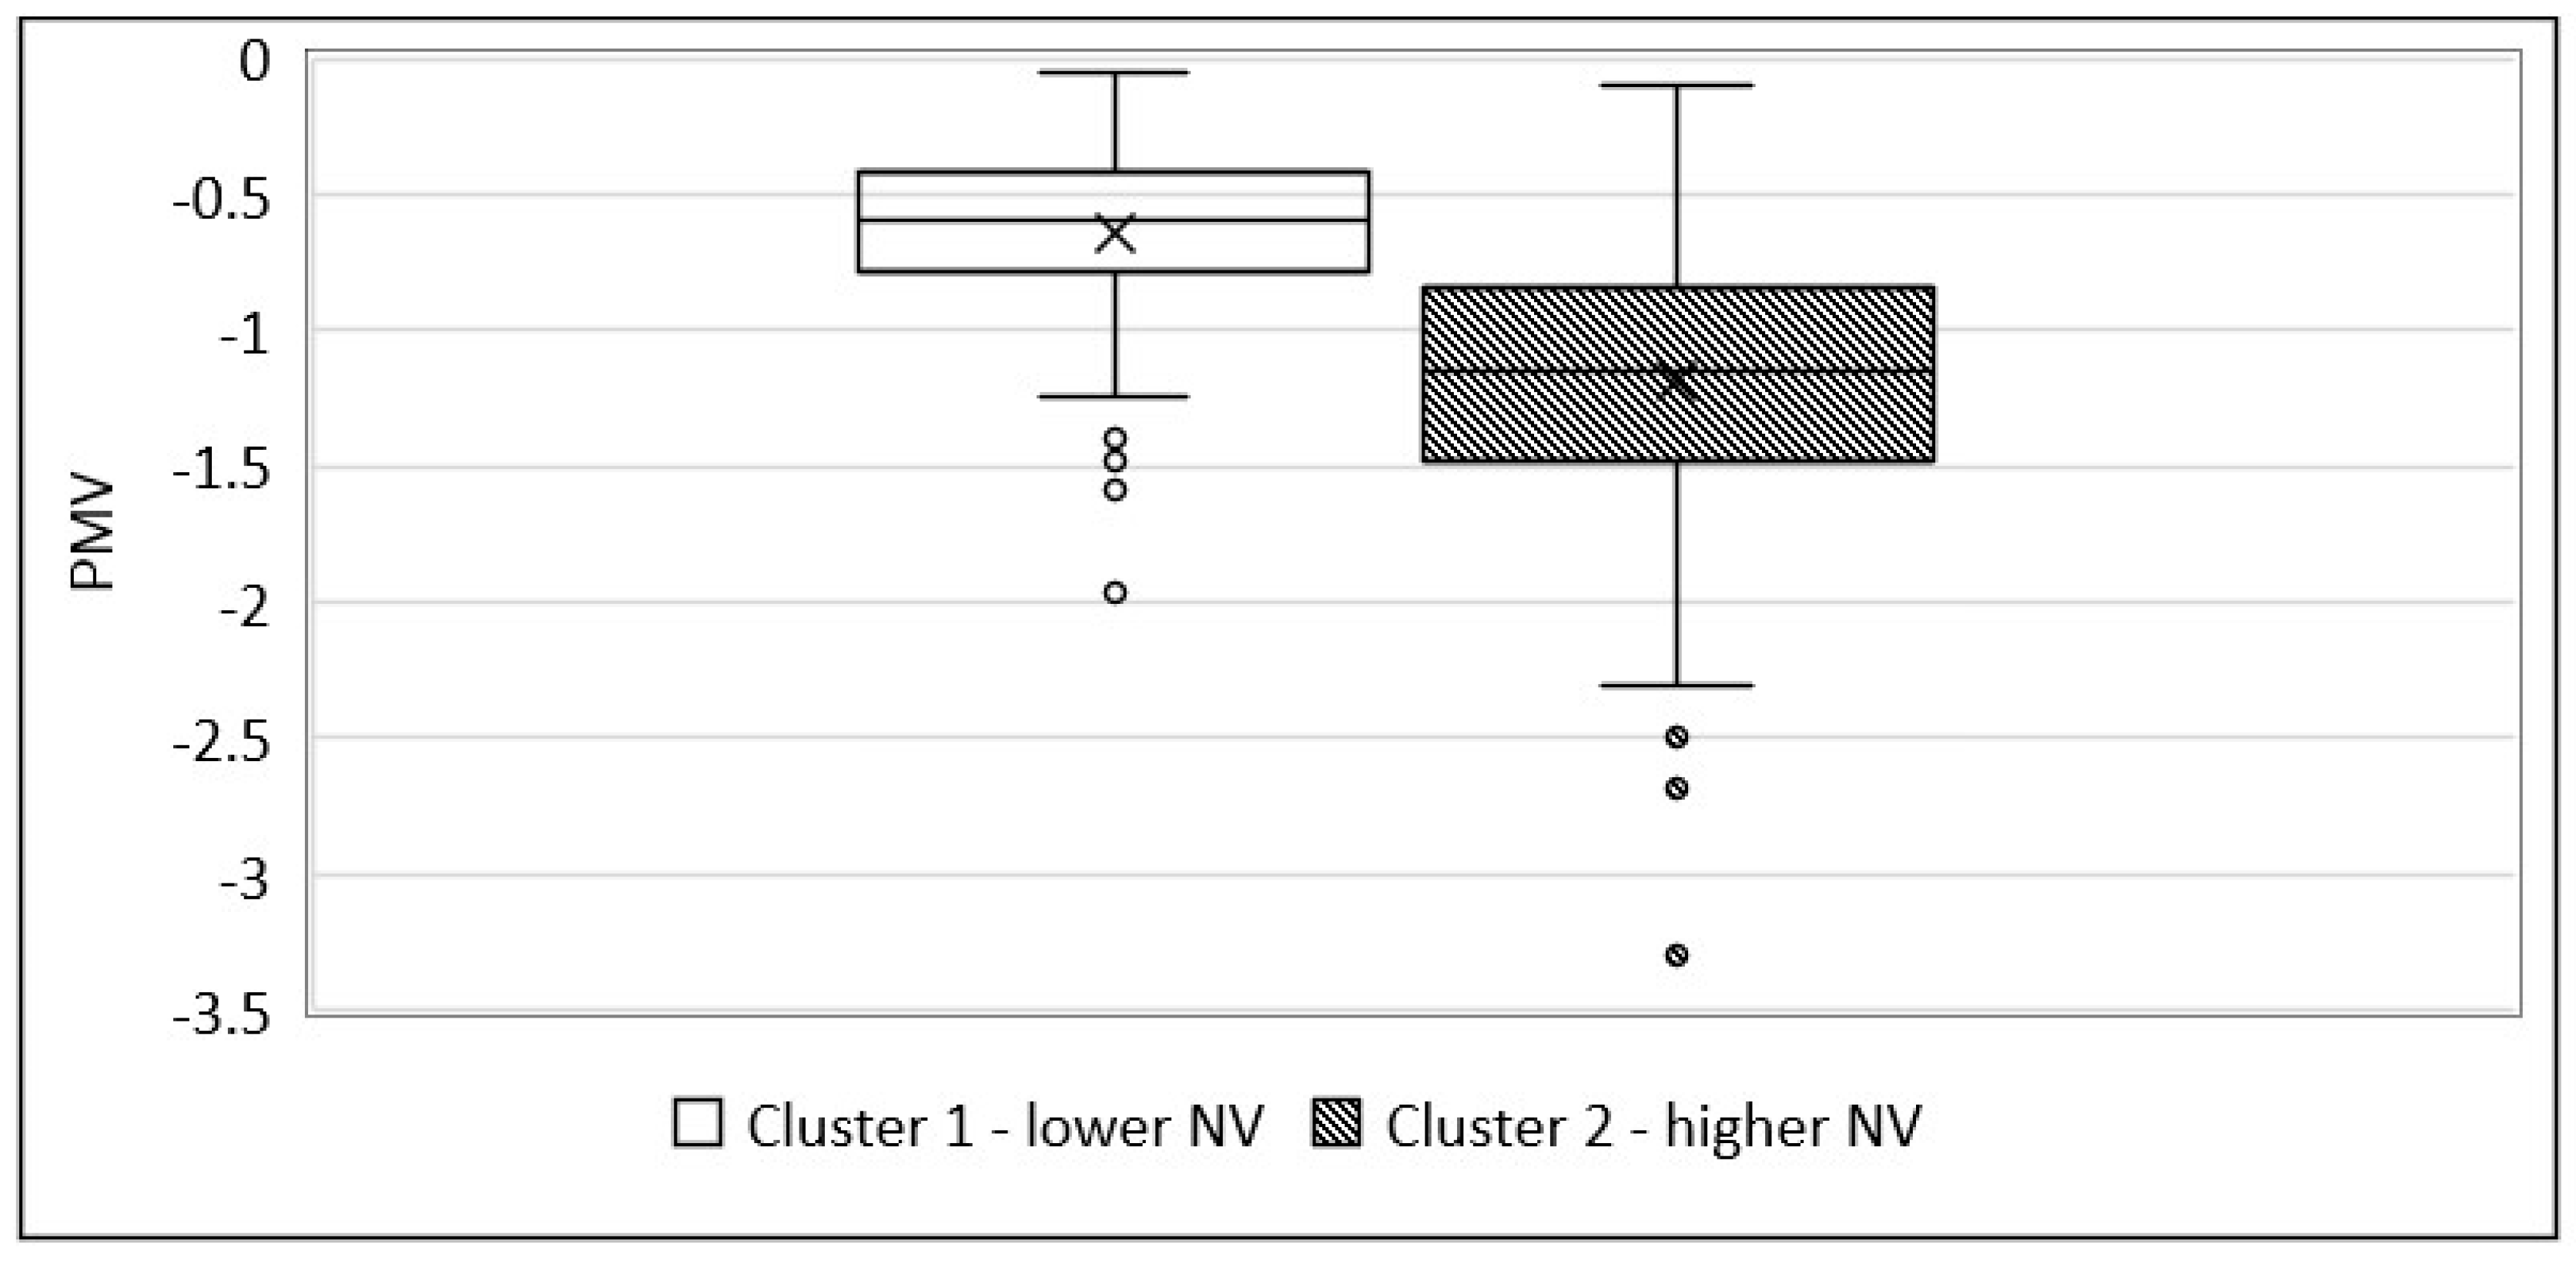
3.3. Ventilation and Thermal Comfort Correlational Analysis

To understand the thermal comfort impact of natural ventilation, it was correlated with PPD for teachers and children, and the results are shown in Figure 13. A low correlation coefficient was observed. High p-values show that the relationship is not significant. Thermal comfort data were analyzed in clusters based on natural ventilation level, as shown in Figure 14.
Figure 13 shows a trend of natural ventilation provision decreasing thermal comfort, demonstrating that improving IAQ through natural ventilation can have negative impacts on comfort. Figure 14 analyses PMV at the kindergartens in clusters, with data from K2 and K4, which had lower levels of natural ventilation compared to the other kindergartens that had higher levels of natural ventilation. There are opportunities to reduce natural ventilation to benefit energy efficiency and thermal comfort without exceeding the maximum 800 ppm CO2 level. Other than equipment used for this study, no CO2 monitoring equipment was identified at the kindergartens. Wall-mounted CO2 monitoring equipment could alert teachers to higher levels of CO2 and prompt an increase in ventilation. This could assist with the management of IAQ and thermal comfort at kindergartens in the short term; however, teachers do need to focus on educating children, and this does not provide a long-term solution. In the longer term, mechanical ventilation systems integrated with demand-control ventilation can be designed to provide a controlled amount of fresh air.

4. Conclusions

This study has investigated ventilation and thermal comfort conditions at selected kindergartens using field monitoring during winter. It was found that the CO2 level exceeded recommended maximums and was up to 1908 ppm, and the calculated ventilation rates ranged from 2.1 to 3.1 and 5.9 to 9.3 Ls−1 per person with the peak and average CO2 concentration levels, respectively. Thermal comfort levels were often outside the comfort range, with median PMV values ranging between −0.5 to −1.4 for children and −0.65 to −1.8 for teachers. Median PPD values ranged between 11 and 46% for children and 14 to 67% for teachers.
A kindergarten that used a combination of natural and mechanical ventilation systems was found to have lower CO2 levels than the kindergartens relying solely on natural ventilation. Throughout the research, it was observed that some kindergartens would intentionally open windows and/or doors for no reason other than ventilation, while at other kindergartens, natural ventilation occurred when doors were opened to facilitate outside play. At times, CO2 levels were well below recommended maximums. Still, significant natural ventilation was provided, which adversely impacted thermal comfort conditions. The provision of wall-mounted CO2 sensors with alarms is recommended for all kindergartens, subject to the support of teachers, as an initial step to improve comfort and IAQ.
Though thermal comfort estimation based on a single-day measurement is a limitation, this study provided valuable insights into the indoor thermal and ventilation conditions of kindergartens in Australia. Also, the PMV model has limitations in predicting the thermal sensation of children. Given the limitations, there are opportunities for further research. The study could be extended for summer months to understand the IAQ and thermal comfort implications when outdoor temperature is high, particularly during periods of extreme temperatures. Additional research involving surveys to collect subjective responses from children and teachers about their thermal perceptions is required to compare with the calculated PMV indices. Further research involving the installation of energy sub-metering on heating, cooling, and ventilation systems before and after the introduction of mechanical ventilation could assist in determining the energy implications.

Author Contributions

Conceptualization, B.M. and P.R.; Methodology, B.M. and P.R.; Formal analysis, B.M. and P.R.; Investigation, B.M.; Resources, P.R.; Data curation, B.M.; Writing—original draft, B.M.; Writing—review & editing, P.R.; Supervision, P.R.; Project administration, B.M. All authors have read and agreed to the published version of the manuscript.

Funding

This research received no external funding.

Institutional Review Board Statement

Not applicable.

Informed Consent Statement

Not applicable.

Data Availability Statement

The data presented in this study are available on request from the corresponding author. The data are not publicly available due to confidentiality.

Conflicts of Interest

The corresponding author was employed in Victorian local government in a building and facilities role. The remaining authors declare that the research was conducted in the absence of any commercial or financial relationships that could be construed as a potential conflict of interest.

Appendix A. Monitoring Equipment Accuracy

Table A1 outlines the monitoring equipment utilized for the study and its accuracy.
Table A1. Monitoring equipment accuracy.
DeviceReadingAccuracySource
Testo 480 IAQ probeAir temperature±0.5 °CTesto SE and Co (2022) [45]
Testo 480 IAQ probeHumidity±(1.8% RH + 0.7% of mv)Testo SE and Co (2022) [45]
Testo 480 IAQ probeCO2±(75 ppm + 3% of mv)
0 to +5000 ppm
Testo SE and Co (2022) [45]
Testo 480 globe thermometerMRTClass 1Testo SE and Co (2022) [46]
Testo 480 comfort level probeVelocity±(0.03 m/s + 4% of mv)Testo SE and Co (2022) [47]
HOBO MX1102Temperature±0.21 °C from 0° to 50 °COnset Computer Corporation (2015) [48]
HOBO MX1102HumidityMaximum of ±4.5% at 25 °COnset Computer Corporation (2015) [48]
HOBO MX1102CO2±50 ppm ±5% of reading at 25 °C, less than 70% RH and 1013 mbarOnset Computer Corporation (2015) [48]
HOBO U12-013Temperature±0.35 °C from 0° to 50 °COnset Computer Corporation (2016) [49]
HOBO U12-013HumidityMaximum of ±3.5% from 10% to 90% RHOnset Computer Corporation (2016) [49]

References

  1. Andamon, M.M.; Woo, J. Indoor environmental quality of preparatory to year 12 (P-12) educational facilities in Australia: Challenges and prospects. In Energy Performance in the Australian Built Environment; Rajagopalan, P., Andamon, M.M., Moore, T., Eds.; Springer Nature: Singapore, 2019; pp. 111–130. ISBN 978-981-10-7880-4. [Google Scholar]
  2. AS 1668.4; The Use of Ventilation and Airconditioning in Buildings—Part 4 Natural Ventilation in Buildings. SAI Global Database: Sydney, Australia, 2012.
  3. Haddad, S.; Synnefa, A.; Marcos, M.A.P.; Paolini, R.; Delrue, S.; Prasad, D.; Santamouris, M. On the potential of demand-controlled ventilation system to enhance indoor air quality and thermal condition in Australian school classrooms. Energy Build. 2021, 238, 110838. [Google Scholar] [CrossRef]
  4. Rajagopalan, P.; Andamon, M.M.; Woo, J. Year long monitoring of indoor air quality and ventilation in school classrooms in Victoria, Australia. Archit. Sci. Rev. 2022, 65, 1–13. [Google Scholar] [CrossRef]
  5. Snow, S.; Danam, R.; Leardini, P.; Glencross, M.; Beeson, B.; Ottenhaus, L.-M.; Boden, M. Human factors affecting ventilation in Australian classrooms during the COVID-19 pandemic: Towards insourcing occupants’ proficiency in ventilation management. Front. Comput. Sci. 2022, 4, 888688. [Google Scholar] [CrossRef]
  6. Cosbod, E.; Annesi-Maesano, I.; Carrer, P.; Kephalopoulos, S.; Madureira, J.; Rudnai, P.; de Oliveira Fernandes, E.; Barrero, J.; Beregszászi, T.; Hyvärinen, A.; et al. Final Report: Schools Indoor Pollution and Health Observatory Network in Europe (SINPHONIE), JRC Publications Repository Website. 2014. Available online: https://publications.jrc.ec.europa.eu/repository/handle/JRC91160 (accessed on 14 April 2022).
  7. Borgese, L.; Tomasoni, G.; Marciano, F.; Zacco, A.; Bilo, F.; Stefana, E.; Cocca, P.; Rossi, D.; Cirelli, P.; Ciribini, A.L.C.; et al. Definition of an Indoor Air Sampling Strategy for SARS-CoV-2 Detection and Risk Management: Case Study in Kindergartens. Int. J. Environ. Res. Public Health 2022, 19, 7406. [Google Scholar] [CrossRef]
  8. Muhic, S.; Muhic, T. Measurements of air quality in kindergartens and schools in the Republic of Slovenia before the COVID-19 Epidemic. Stroj. Vestn.-J. Mech. Eng. 2022, 68, 290–299. [Google Scholar] [CrossRef]
  9. Persily, A. Development and application of an indoor carbon dioxide metric. Indoor Air 2022, 32, e13059. [Google Scholar] [CrossRef] [PubMed]
  10. Shendell, D.G.; Prill, R.; Fisk, W.J.; Apte, M.G.; Blake, D.; Fawkner, D. Associations Between Classroom CO2 Concentrations and Student Attendance in Washington and Idaho. Indoor Air 2004, 14, 333–341. [Google Scholar] [CrossRef] [PubMed]
  11. Wargocki, P.; Porras-Salazar, J.A.; Contreras-Espinoza, S.; Bahnfleth, W. The relationships between classroom air quality and children’s performance in school. Build. Environ. 2020, 173, 106749. [Google Scholar] [CrossRef]
  12. Woo, J.; Rajagopalan, P.; Andamon, M.M. An evaluation of measured indoor conditions and student performance using d2 Test of Attention. Build. Environ. 2022, 214, 108940. [Google Scholar] [CrossRef]
  13. Simoni, M.; Annesi-Maesano, I.; Sigsgaard, T.; Norback, D.; Wieslander, G.; Nystad, W.; Canciani, M.; Sestini, P.; Viegi, G. School air quality related to dry cough rhinitis and nasal patency in children. Eur. Respir. J. 2010, 35, 742–749. [Google Scholar] [CrossRef] [PubMed]
  14. Sadrizadeh, S.; Yao, R.; Yuan, F.; Awbi, H.; Bahnfleth, W.; Bi, Y.; Cao, G.; Croitoru, C.; de Dear, R.; Haghighat, F.; et al. Indoor air quality and health in schools: A critical review for developing the roadmap for the future school environment. J. Build. Eng. 2022, 57, 104908. [Google Scholar] [CrossRef]
  15. D6245-18; Standard Guide for Using Indoor Carbon Dioxide Concentrations to Evaluate Indoor Air Quality and Ventilation. ASTM International: West Conshohocken, PA, USA, 2018.
  16. Gładyszewska-Fiedoruk, K. Correlations of air humidity and carbon dioxide concentration in the kindergarten. Energy Build. 2013, 62, 45–50. [Google Scholar] [CrossRef]
  17. Mijakowski, M.; Sowa, J. An attempt to improve indoor environment by installing humidity sensitive air inlets in a naturally ventilated kindergarten building. Build. Environ. 2016, 111, 180–191. [Google Scholar] [CrossRef]
  18. Dovjak, M.; Slobodnik, J.; Krainer, A. Consequences of Energy Renovation on Indoor Air Quality in Kindergartens. Build. Simul. 2020, 13, 691–708. [Google Scholar] [CrossRef]
  19. Lovec, V.; Premrov, M.; Leskovar, V.Z. Practical impact of the COVID-19 pandemic on indoor air quality and thermal comfort in kindergartens. A case study of Slovenia. Int. J. Environ. Res. Public Health 2021, 18, 9712. [Google Scholar] [CrossRef]
  20. Hammad, M.; Ebaid, M.S.Y.; Al-Hyari, L. Green building design solution for a kindergarten in Amman. Energy Build. 2014, 76, 524–537. [Google Scholar] [CrossRef]
  21. Li, Y.; Qian, H.; Hang, J.; Chen, X.; Cheng, P.; Ling, H.; Wang, S.; Liang, P.; Li, J.; Xiao, S.; et al. Probable Airborne Transmission of SARS-CoV-2 in a Poorly Ventilated Restaurant. Build. Environ. 2021, 196, 107788. [Google Scholar] [CrossRef] [PubMed]
  22. CDC (Centres for Disease Control and Prevention). Ventilation in Buildings Frequently Asked Questions. Available online: https://www.cdc.gov/coronavirus/2019-ncov/community/ventilation.html#Ventilation-FAQs (accessed on 20 November 2022).
  23. Crabb, B.; Doolan, C.; Cole, K.; Hanmer, G.; Marks, G.; Miller, A.; Monty, J.; Morawska, L.; de Silva, C. OzSage Safe Indoor Air (Ventilation) Recommendations. Available online: https://ozsage.org/wp-content/uploads/2021/09/Safe-Indoor-Air-advice.pdf (accessed on 19 September 2022).
  24. Schofield, R. University of Melbourne Guide to Air Cleaner Purchasing. Available online: https://sgeas.unimelb.edu.au/engage/guide-to-air-cleaner-purchasing (accessed on 14 April 2022).
  25. Department of Education and Training, Commonwealth. The Early Years Learning Framework for Australia. Available online: https://www.acecqa.gov.au/sites/default/files/2018-02/belonging_being_and_becoming_the_early_years_learning_framework_for_australia.pdf (accessed on 18 April 2022).
  26. Department of Education and Training, Victoria. All about Kindergarten. Available online: https://www.education.vic.gov.au/Documents/childhood/parents/kindergarten/allaboutkinder.pdf (accessed on 14 April 2022).
  27. Hassan, J. The Washington Post: With Winter on the Way and Windows Open, Europe’s Students Prepare for the Cold. Available online: https://www.washingtonpost.com/world/2020/10/13/school-windows-coronavirus-europe-winter/ (accessed on 20 November 2022).
  28. CDC (Centres for Disease Control and Prevention). Ventilation in Buildings. Available online: https://www.cdc.gov/coronavirus/2019-ncov/community/ventilation.html (accessed on 20 November 2022).
  29. Department of Education and Training, Victoria. Ventilation Advice for Early Childhood Education and Care Services. Available online: https://www.education.vic.gov.au/Documents/about/department/covid-19/ecec/ventilation-advice.pdf (accessed on 15 April 2022).
  30. Wyon, D.P. Studies of children under imposed noise and heat stress. Ergonomics 1970, 13, 598–612. [Google Scholar] [CrossRef]
  31. Haverinen-Shaughnessy, U.; Shaughnessy, R.J. Effect of classroom ventilation rate and temperature on students’ test scores. PLoS ONE 2015, 10, e0136165. [Google Scholar] [CrossRef]
  32. Wargocki, P.; Wyon, D.P. Ten questions concerning thermal and indoor air quality effects on the performance of office work and schoolwork. Build. Environ. 2017, 112, 359–366. [Google Scholar] [CrossRef]
  33. WHO (World Health Organisation). WHO Housing and Health Guidelines. Available online: http://apps.who.int/iris/bitstream/handle/10665/276001/9789241550376-eng.pdf (accessed on 16 April 2022).
  34. Wargocki, P.; Porras-Salazar, J.A.; Contreras-Espinoza, S. The relationship between classroom temperature and students performance in schools. Build. Environ. 2019, 157, 197–204. [Google Scholar] [CrossRef]
  35. BOM (Bureau of Meteorology). Climate Data Online. Available online: http://www.bom.gov.au/climate/data/index.shtml (accessed on 1 May 2022).
  36. Yun, H.; Nam, I.; Kim, J.; Yang, J.; Lee, K.; Sohn, J. A field study of thermal comfort for kindergarten children in Korea: An assessment of existing models and preferences of children. Build. Environ. 2014, 75, 182–189. [Google Scholar] [CrossRef]
  37. BOM (Bureau of Meteorology). Latest Weather Observations for Victoria. Available online: http://www.bom.gov.au/vic/observations/vicall.shtml (accessed on 1 September 2022).
  38. Tartarini, F.; Schiavon, S.; Cheung, T.; Hoyt, T. CBE Thermal Comfort Tool, University of California Centre for the Built Environment Website. Available online: https://comfort.cbe.berkeley.edu/ (accessed on 30 July 2022).
  39. ASHRAE Standard 55; Thermal Environmental Conditions for Human Occupancy. (American Society of Heating Refrigeration and Air-Conditioning Engineers): Atlanta, GA, USA, 2004.
  40. Fabbri, K. Thermal comfort evaluation in kindergarten: PMV and PPD measurement through data logger and questionnaire. Build. Environ. 2013, 68, 202–214. [Google Scholar] [CrossRef]
  41. Persily, A.; Bahnfleth, W.P.; Kipen, H.; Lau, J.; Mandin, C.; Sekhar, C.; Wargocki, P.; Weekes, L.C.N. ASHRAE Position Document on Indoor Carbon Dioxide. Available online: https://www.ashrae.org/file%20library/about/position%20documents/pd_indoorcarbondioxide_2022.pdf (accessed on 26 January 2023).
  42. Lindsey, R. Climate Change: Atmospheric Carbon Dioxide. 2023. Available online: https://www.climate.gov/ (accessed on 21 November 2023).
  43. European Environment Agency. Trends in Atmospheric Concentrations of CO2 (ppm), CH4 (ppb) and N2O (ppb), between 1800 and 2017. 2019. Available online: https://www.eea.europa.eu/data-and-maps (accessed on 18 September 2023).
  44. de Dear, R.; Kim, J.; Candido, C.; Deuble, M. Adaptive thermal comfort in Australian school classrooms. Build. Res. Inf. 2015, 43, 383–398. [Google Scholar] [CrossRef]
  45. Testo SE & Co. IAQ Probe Including Tripod. Available online: https://www.testo.com/en-US/iaq-probe-including-tripod/p/0632-1543 (accessed on 30 September 2022).
  46. Testo SE & Co. Globe Thermometer (TC Type K)—For Radiant Heat. Available online: https://www.testo.com/en-AU/globe-probe-o-150mm-tc-type-k-for-measuring-radiant-heat/p/0602-0743 (accessed on 30 September 2022).
  47. Testo SE & Co. Comfort Level Probe—For Degree of Turbulence Measurement According. Available online: https://www.testo.com/en-AU/comfort-level-probe/p/0628-0143 (accessed on 30 September 2022).
  48. Onset Computer Corporation. HOBO MX CO2 Logger (MX1102) Manual. Available online: https://www.onsetcomp.com/files/manual_pdfs/22504-F%20MX1102A%20Manual.pdf (accessed on 30 September 2022).
  49. Onset Computer Corporation. HOBO U12 Logger. Available online: https://www.onsetcomp.com/files/data-sheet/Onset%20HOBO%20U12%20Data%20Loggers.pdf (accessed on 30 September 2022).
Figure 1. Floor plan of Kindergarten 1 room.
Sustainability 16 01186 g001
Figure 2. Hourly average CO2 concentrations during August (class days).
Sustainability 16 01186 g002
Figure 3. Descriptive analysis of class time CO2 level.
Sustainability 16 01186 g003
Figure 4. Longest duration of high CO2 levels.
Sustainability 16 01186 g004
Figure 5. Number of high CO2 exceedances.
Sustainability 16 01186 g005
Figure 6. Class time high CO2 levels.
Sustainability 16 01186 g006
Figure 7. Class time natural ventilation.
Sustainability 16 01186 g007
Figure 8. CO2 level cluster analysis.
Sustainability 16 01186 g008
Figure 9. PPD box and whiskers analysis.
Sustainability 16 01186 g009
Figure 10. PMV box and whiskers analysis.
Sustainability 16 01186 g010
Figure 11. % of time PMV in the range of −0.5 to +0.5.
Sustainability 16 01186 g011
Figure 12. External air temperature during the main monitoring day.
Sustainability 16 01186 g012
Figure 13. PPD and natural ventilation.
Sustainability 16 01186 g013
Figure 14. PMV cluster analysis.
Sustainability 16 01186 g014
Table 1. Kindergartens selected for the study.
Kindergarten/Main Monitoring DayBuilding AgePredominant MaterialsVentilation DesignApproximate Room SizeApproximate Room VolumeApproximate Elevation
K1
16 August 2022
<10 yearsBrick veneer wall, metal roofNatural ventilation124 m2347 m330–60 m
K2
29 August 2022
10–20 yearsCement sheet cladding and blocks, timber framing, plaster-lined walls—metal roofNatural ventilation118 m2429 m330–60 m
K3
1 August 2022
10–20 yearsCement sheet cladding and blocks, timber framing, plaster-lined walls, metal roofMechanical and natural ventilation115 m2346 m330–60 m
K4
3 August 2022
Over 50 yearsBrick veneer—metal roofNatural ventilation98 m2268 m330–60 m
K5
8 August 2022
Over 50 yearsBrick veneer—metal roofNatural ventilation148 m2421 m3300–400 m
Table 2. CO2 concentration levels summary.
KindergartenPeak CO2 Level RecordedAverage CO2 Level (Class Times) *Average Peak CO2 Level (Class Days) **Ventilation Rates Peak (L/s)Ventilation Rates Average (L/s)
K11432 ppm675 ppm955 ppm3.15.8
K21552 ppm795 ppm925 ppm2.86.1
K31446 ppm640 ppm748 ppm3.19.3
K41679 ppm799 ppm923 ppm2.56.2
K51908 ppm796 ppm942 ppm2.15.9
* The average of all CO2 readings during all August class times. ** The average of the highest CO2 readings recorded on each August class day.
Disclaimer/Publisher’s Note: The statements, opinions and data contained in all publications are solely those of the individual author(s) and contributor(s) and not of MDPI and/or the editor(s). MDPI and/or the editor(s) disclaim responsibility for any injury to people or property resulting from any ideas, methods, instructions or products referred to in the content.

