Abstract
China’s pursuit of carbon peak and carbon neutrality relies heavily on the widespread adoption of electric vehicles (EVs), necessitating the optimal location and sizing of charging stations (CSs). This study proposes a model for minimizing the overall social cost by considering CS construction and operation costs, EV user charging time costs, and associated carbon emissions costs. An improved quantum genetic algorithm, integrating a dynamic rotation angle and simulated annealing elements, addresses the optimization problem. Performance evaluation employs test functions and a case study using electric taxi trajectory data from Shenzhen. Findings reveal that higher charging power does not always yield better outcomes; appropriate power selection effectively reduces costs. Increasing the number of CSs beyond a threshold fails to significantly reduce carbon emission costs but enhances demand coverage.
1. Introduction
Electric vehicles (EVs) offer significant benefits for promoting a green, environmentally-friendly, and sustainable future. They reduce greenhouse gas emissions, improve air quality, and combat climate change. By integrating EVs with renewable energy sources, such as solar and wind power, we can further reduce our dependence on fossil fuels and create a more resilient energy system. The adoption of EVs also drives technological innovation, particularly in battery technology and charging infrastructure, leading to improved energy efficiency and increased convenience for users [1].
However, despite these advantages, the widespread adoption of EVs faces obstacles, particularly the mismatch between existing charging infrastructure and the growing demand for charging services. This predicament creates difficulties for EV users in finding suitable charging stations (CSs) in high-demand areas, while many CSs remain underutilized, leading to economic losses. These challenges dampen public enthusiasm for purchasing EVs and present significant obstacles for governments and charging service providers.
To address these challenges effectively and promote the widespread adoption of EVs as a crucial strategy for achieving environmental sustainability, it is crucial to strategically plan the locations and capacities of CSs. This ensures convenient access to charging services and encourages more individuals to embrace EVs. By overcoming the charging infrastructure hurdle, we can make significant progress towards a greener and more sustainable transportation ecosystem.
The location problem of CSs is a typical multi-dimensional nonlinear mixed integer programming problem, known for its NP-hard complexity. Traditional location models, such as the point-demand model [2] and the flow-demand model [3,4,5], provide valuable guidance for CSs construction. However, specific applications often require additional considerations. In response to this, many scholars have taken into account various real-world factors, including CSs’ capacities [6], the charging behavior of EV users [7], and the impact of EVs on the load variance of power grids [8]. These studies have enhanced the practicality of CSs construction, but have also increased the complexity of the models, thereby posing challenges for algorithm development.
For solving the issue of CSs location model, there are three common categories of algorithms: Exact Solution Algorithms, Deep Learning Algorithms, and Heuristics Algorithms. The Exact Solution Algorithms mainly include branch and bound [9], branch and cut [10] and Benders decomposition [11]. The advantage of Exact Solution Algorithms is that they can obtain the global optimal solutions. However, the shortcomings are also obvious. First, they need precise environmental parameters, and fuzzy, uncertain, and estimated parameters can make Exact Solution Algorithms lose their value, but requiring the accuracy of all parameters is impossible. Second, they are only applicable to small-scale examples, while in reality, the calculation time for large-scale CS location problems is too long.
Due to the remarkable performance in data-processing and strong learning abilities, Deep Learning Algorithms have been gradually applied to the location problem of CSs in recent years, via the use of Recurrent Neural Networks [12,13] and Generative Adversarial Networks [14]. Although they perform well in solving some complicated CSs location models, need for the excessive training, sophisticated learning model construction and hardware still hinder the extensive applications regarding the CSs location problem.
Heuristic Algorithms are currently the most mainstream solution methods. The most commonly used is the Genetic Algorithm (GA). Taking the entire national region of Ireland as an example, Zhou et al. used GA to solve the CS location model which aimed at minimizing the total social cost; the results prove that GA performs well [15]. Zhang et al. improved the crossover rates by using fitness values, memories and transferring quality genes to overcome the problem of premature convergence of GA [16]. Li et al. improved the crossover operator and applied it to Haikou and Shanghai’s CSs location problem [17]. Another way to improve the performance of GA is to combine other heuristic. Abhishek et al. combined GA and Particle Swarm Optimization for CSs location in the Allahabad [18]. Wang et al. studied fast CSs location in a highway network with consideration of the budget constraint and drivers’ charging strategies, and GA combined with some greedy search rules is used to solve the problem. A practical case in Hebei verified the robustness and efficiency of the combined algorithms [19]. In addition, other heuristic algorithms have been applied in CSs location and sizing problems. Zhang et al. used an Immune Algorithm to solve the battery swapping station location problem, and the algorithm could provide a better solution in a shorter time as compared to the results obtained by CPLEX [20]. Ai et al. considered the comprehensive profits of CS operators, EV users and power grid enterprises. Through the introduction of chaos theory and the simulated annealing algorithm (SAA), they proposed the Chaotic Simulated Annealing Particle Swarm Algorithm to solve the CSs location and sizing problem [21]. Liu et al. applied Tabu Search to a CS location model for a highway network, with consideration of users’ charging behaviors and mileage anxiety [22]. Qin et al. established a CS selection method considering traffic information and investment cost [23]. The Particle Swarm Optimization also has good performance in multi-objective problems of CS location [24,25]. In recent years, various intelligence algorithms have been updated and progressively applied to the CS location and sizing problem, such as Harris Hawks Optimization [26], Coyote Optimization Algorithm [27], Whale Optimization Algorithm (WOA) [28,29] and so on.
Although GA is easy to understand, has simple programming, and flexible search rules, it also has limitations, such as slow convergence speed and susceptibility to premature convergence. In response, researchers have introduced quantum computing into GA, leading to the development of the Quantum Genetic Algorithm (QGA) [30,31]. QGA uses a completely new encoding scheme and population updating mechanism, applying the probability amplitude of quantum bits to chromosome encoding. This allows a single chromosome to express the superposition of multiple states, greatly enhancing the algorithm’s searching ability [32,33,34].
The main contributions of this study are reflected in the algorithm and model:
Algorithm:in this study, an improved Quantum Genetic Algorithm (IQGA) optimization method is proposed to enhance search ability and retain high-quality individuals within the population. Compared to QGA [30,31], the following adjustments were made:
- IQGA introduces a dynamic quantum rotation angle that adapts based on the number of iterations. By adjusting the rotation angle, the algorithm can strike a balance between exploration and exploitation, enabling faster convergence towards optimal solutions. This dynamic adjustment mechanism ensures efficient exploration of the search space, leading to improved solution quality.
- IQGA incorporates the concept of simulated annealing into the population updating process. Simulated annealing helps the algorithm escape local optima by allowing occasional acceptance of solutions that are worse than the current best. This mechanism prevents premature convergence and promotes exploration of the solution space, enhancing the algorithm’s ability to discover high-quality solutions.
Model: This study proposes an innovative and comprehensive location and sizing model for CSs, taking into account multiple perspectives, including CS operators, EV users, and the environment. In contrast to the approach presented in [15], this study extends the analysis by incorporating capacity decision-making into the model. Specifically, we consider the effects of CS capacity on user waiting cost, recognizing that inadequate capacity can lead to increased wait times and inconvenience for EV users. Additionally, this study introduces the concept of carbon emission prices to quantify the environmental costs of CS operations. By incorporating carbon emission prices into our model, we emphasize the importance of reducing carbon emissions and promoting environmentally sustainable transportation solutions. This innovative addition allows us to evaluate the broader socioeconomic and environmental impacts of CS deployment strategies.
2. Location and Sizing Model of the CSs
2.1. Model Objectives
In this paper, the models objectives are to minimize the social costs, including the construction cost of CSs, the operation cost of CSs, the time cost of charging and the carbon emission cost; the specific objectives are expressed as follows:
2.1.1. Construction Cost
The construction cost includes expenses related to land acquisition or leasing, procurement of chargers, and ancillary costs such as installation, transportation, and electricity distribution system upgrades. These ancillary costs are considered fixed investment costs. The annual construction cost of the CSs can be represented as [29]. The equation below illustrates the composition of :
where the parameter represents the unit price of chargers, while denotes the ancillary cost associated with their installation. The variables S and represent the average required area of a single charger and the unit land price of CS j, respectively. The discount rate is denoted by , and represents the expected operating life of the CS, assumed to be 20 years in this study. The decision variable is a binary variable (0 or 1), indicating whether candidate point j is selected for establishing a CS. The variable represents the number of chargers to be installed in CS j.
2.1.2. Operating Cost
The operating cost of a CS consists primarily of two components: station equipment maintenance cost and labor cost. The annual operating cost of the CSs is denoted as and can be expressed as follows:
where represents the coefficient that converts the construction cost into the annual operating cost [29].
2.1.3. User Charging Cost
The user charging cost of a CS includes two components: the traveling cost and the waiting cost. The traveling cost represents the electricity consumption cost for EV users traveling from their point of demand to the nearest CS. The waiting cost refers to the time cost incurred when EV users arrive at the station and find all chargers occupied, resulting in them entering a waiting queue until charging becomes available. The user charging cost, denoted as , can be defined as follows:
where represents the average daily number of EVs to be charged at demand point i. is the road curvature coefficient. represents the Euclidean distance from demand point i to CS j. P is the unit cost of EV charging measured in yuan per kilowatt-hour (kWh). E represents the power consumption of an EV per kilometer traveled, measured in kWh per kilometer (kWh/km). is the average waiting time of an EV at CS j. represents the coefficient that converts the unit waiting cost to the unit cost of EV charging. Finally, is a binary variable. When is 1, it indicates that EVs from demand point i go to CS j for charging; otherwise, they do not go for charging.
In Equation (3), the EV user charging behaviour is assumed as follows: (1) The user will choose to go to the nearest CS for charging. (2) The time for the user to reach the CS obeys a Poisson distribution, and the charging time of the EV obeys a negative exponential distribution. Therefore, the EV charging behaviour can be modelled as a queuing system. is expressed as follows [35]:
where is the average charging rate of one charger, represents the average daily number of EVs arrival at CS j, , and is the probability that CS j is idle. These formulas provide a way to estimate the waiting time experienced by EV users at a CS, considering the queuing behavior and the availability of chargers.
2.1.4. Carbon Emissions Cost
The carbon emissions cost in this context refers to the environmental impact of CS location, specifically the carbon dioxide (CO2) emissions associated with the electricity generation required to charge the vehicles. To calculate the carbon emissions of EVs, existing literature often converts CO2 emissions into carbon emission factors. The carbon emission factor, denoted as c, represents the CO2 emissions per kilometer traveled by an EV. The calculation of the carbon emission factor is as follows (unit: gCO2/km) [15]:
where represents the transmission efficiency of the distribution power network, measured in percentage. denotes the carbon emission factor of the power grid.
To incorporate the carbon emissions into the analysis, this paper proposes the introduction of a carbon emission price, , sourced from the national carbon trading market [36]. The carbon emission cost, denoted as , can be expressed as follows:
In Equation (7), represents the average daily number of EVs to be charged at demand point i. represents the Euclidean distance from demand point i to CS j. c denotes the carbon emission factor calculated using Equation (6). represents the carbon emission price from the national carbon trading market. Equation (7) allows for the monetization of environmental costs associated with carbon emissions, enabling the assessment of the environmental impact of EV charging.
In summary, the objective function of the CSs location and sizing model is as follows:
2.2. Constraints
The model constraints are shown below:
Constraint (9) requires the establishment of at least one CS. Constraint (10) ensures that each demand point is assigned to exactly one CS. Constraint (13) guarantees that a demand point can only be assigned to a CS if that CS is established. In Constraint (14), the variable M represents a very large positive number. Constraint (14) ensures that chargers can only be set in a CS if it is built at demand point j.
Sets, parameters, and decision variables in our model can be referred to in Table 1.

Table 1.
Sets, parameters, and decision variables.
3. Algorithms
3.1. IQGA
QGA is a probabilistic search algorithm that combines principles from quantum theory with traditional GA techniques. The main difference between QGA and GA lies in the population coding method and evolutionary strategy. In QGA, the population coding method utilizes quantum bits (qubits) and quantum superposition states to encode chromosomes, in contrast to the traditional binary encoding used in GA. Instead of employing the standard crossover and mutation operations found in GA, QGA employs quantum rotation gates to update the population and facilitate evolution based on the optimal individual information from the current iteration. Throughout the iteration process, the superposition state of each qubit gradually converges to stability, achieving the objective of function optimization. This unique encoding and updating approach in QGA result in several advantages over traditional GA, including higher convergence accuracy, enhanced population diversity, and faster convergence speed.
However, as research expands and deepens in various fields, certain limitations of QGA have become apparent. One such limitation is the fixed value of the quantum rotation angle, which may pose challenges in achieving a balance between computational speed and accuracy when dealing with different problems. To address this, the paper proposes specific adjustment methods:
- (1)
- Dynamic changes in the quantum rotation angle: the size of the quantum rotation angle is adjusted from a fixed value to a dynamic value. The original parameter value () is modified using the following formula to determine the value of :where l is the number of times with the fitness value remaining unchanged, is a coefficient, t is the current iteration number, and is the maximum iteration number.
Then, the quantum rotation angle updates as , and the ith bit of the chromosome is updated as follows:
where and are two numbers that represent the probability amplitudes of a quantum state, and .
This adjustment strategy allows the algorithm to dynamically adapt the quantum rotation angle during the optimization process. When the solution fails to show continuous improvement, gradually reducing the quantum rotation angle as the iteration progresses enables the algorithm to refine the search space and enhance the accuracy of computational results. This adjustment helps the algorithm to focus on exploiting the best solutions found so far, narrowing down the search space and potentially converging towards the optimal solution. By reducing the quantum rotation angle, the algorithm places more emphasis on exploiting promising regions of the search space, improving the chances of finding better solutions.
However, it is important to note that this approach carries the risk of becoming trapped in local optima, where further improvement becomes challenging. To mitigate this risk and promote exploration, it is crucial to incorporate strategies such as simulated annealing.
- (2)
- Simulated annealing strategy: SAA uses the probabilistic jump property to explore the solution space and avoid local optima. By introducing controlled randomness and allowing occasional acceptance of worse solutions, SAA enables the algorithm to make exploratory moves and potentially discover better solutions that may lie outside the immediate vicinity of the current solution.
The integration of SAA with other heuristics provides a valuable global search capability while maintaining algorithm efficiency. This advantage has been extensively supported by numerous studies in the field [37,38]. By combining the strengths of SAA with the existing components of the IQGA, the algorithm gains the ability to effectively explore the solution space, overcome local optima, and converge towards high-quality solutions.
The chromosome coding scheme is used to represent the candidate CS locations. The length of the chromosome is determined by the number of candidate locations being considered. Each bit represents the probability of selecting quantum state 0 or 1. The determined solution A(t) represents the CS configuration. Taking into account the constraint that must be less than 1, calculate the minimum required number of chargers in each CS. Next, incrementally increase the number of chargers in each CS, evaluating the cost of adding additional chargers. This process continues until the cost of adding more chargers exceeds the cost of queuing. The fitness value is then calculated based on the comparison of costs.
The process of IQGA is as follows (Algorithm 1):
| Algorithm 1 IQGA |
|
3.2. Function Testing
To evaluate the performance of IQGA, we compare it with QGA and four other heuristics: Fire-Works Algorithm (FWA), WOA, Invasive Weed Optimization (IWO), and Grey Wolf Optimization (GWO). These algorithms are tested on six different functions (listed in Table 2) with a maximum of 100 iterations. All experiments are conducted on a PC running Windows 10, equipped with a 2.60 GHz CPU, 8.00 GB of RAM, and MATLAB R2018a. Each algorithm is executed 15 times for each function. The results, including the solution gaps and running time, are presented in Table 3.

Table 2.
Testing functions.

Table 3.
Algorithms’ performance.
By analyzing the data in the “optimum value” row of Table 3, it is observed that the optimum values achieved by IQGA for functions to are closer to the global optimal values compared to the other five algorithms. The global optimal values for each function can be found in Table 2. Moreover, by comparing the “Average gap” data, it can be observed that IQGA has the smallest average gap among the six algorithms for functions to . The average gap represents the average difference between the obtained solutions and the corresponding global optimal values. The smaller the average gap, the closer the obtained solutions are to the global optima. Thus, the performance comparison results presented in Table 3 demonstrate that IQGA outperforms the other five algorithms in terms of accuracy for functions to . Particularly notable is IQGA’s ability to reach the global optimum for functions and . In terms of function , both IQGA and GQA perform well, each having its own advantages. IQGA achieves a better optimal value compared to QGA, while QGA exhibits a better average gap.
The iterative processes of IQGA corresponding to functions to are illustrated in Figure 1a–f. These figures illustrate the fast convergence speed of IQGA.
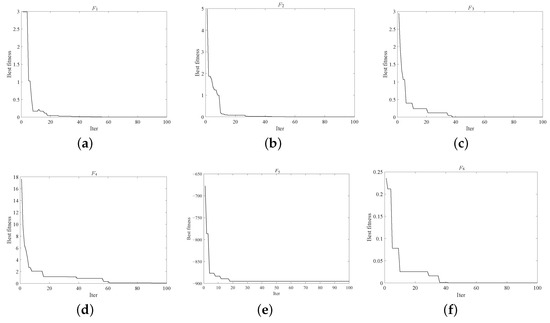
Figure 1.
Iterative process of IQGA.
However, the tests shows that one of the potential limitations of the IQGA approach is its longer computation time. This is primarily due to the incorporation of the simulated annealing algorithm, which adds an additional computational overhead. As a result, when dealing with large-scale problem instances, there is a possibility that the IQGA algorithm may not be able to achieve the desired solution within an acceptable time frame.
4. Case Study
Situated in the southern part of Guangdong Province, Shenzhen is recognized as a national economic hub and an innovation city. It comprises nine districts spanning a total area of 1997.47 square kilometers and is home to a population of 17,681,800 residents.
To begin with, the city of Shenzhen is divided into a grid system, resulting in a total of 633 grids. Subsequently, GPS travel data is collected from 27,204 electric taxis operating throughout Shenzhen over the course of a single day. This GPS data records both the pick-up and drop-off locations of passengers, as well as the corresponding travel time between these points. The drop-off locations are used to determine the charging demands for electric taxis [39,40]. By analyzing this data, the number of charging demands within each grid and the travel distances between different grids can be calculated. The distribution of charging demands is illustrated in Figure 2. We further narrow down the analysis to specific time periods within a day when the demand for charging is relatively higher in the identified areas. The arrival rate of EVs during relatively busy times at CS j can be obtained.
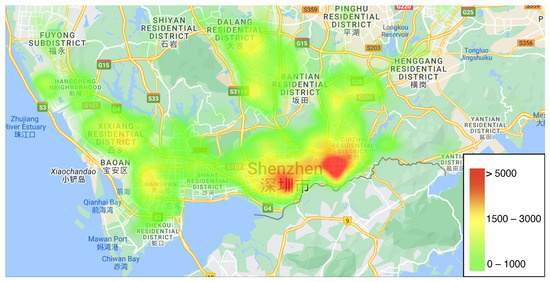
Figure 2.
Charging demands distribution.
The parameters are set as follows: in Shenzhen, the electric taxi model is the BYD E6, with a power consumption of 19.5 kWh per 100 km and an average speed of 25 km/h in the urban area. The fast chargers have a uniform power capacity, and the average service rate is assumed to be two vehicles per hour ( = 2). The CS is expected to have a service life of 20 years, with a fixed construction cost of 0.5 million yuan (). The unit price of the charger is 100,000 yuan (). The area required by a single charger is 16 square meters (S) and the unit land price based on the benchmark land price for public service usage in Shenzhen is 1606 yuan per square meters (P). The discount rate is assumed to be 0.1 (). The coefficient of the CS’s maintenance and labor cost is 0.1 (). Based on the charging prices observed on Tencent APP, which typically range between 1.6 and 2 yuan, the charging price is assumed to be 1.6 yuan/kWh (P). The road curvature coefficient is taken as 1.2 (), and the coefficient is set to 0.1. According to Guangdong Province Enterprise CO2 Emission Information Reporting Guidelines [41], carbon emission factor of power grid is 637.9 gCO2/kWh. Based on this information, calculating the value of c yields a result of 138 gCO2/km.
The parameters of the algorithm are set as follows. The maximum number of iterations is 500. The population size is 100. Since the existing literature has not mentioned the dynamically updated quantum rotation angle, based on lots of experimental tests, is set to be 0.025 and is 30. In the simulated annealing operations, = 200, m = 2 and .
The iterative process of IQGA is compared with the QGA in Figure 3. As observed in the figure, under the same operating environment, QGA reaches a stable state after approximately 50 iterations, while IQGA continues to improve its solution accuracy for about 120 iterations. The IQGA outperforms QGA in terms of solution accuracy. This improvement can be attributed to the dynamic updating of the rotation gate and the incorporation of annealing operations in IQGA. These modifications help IQGA avoid getting stuck in local optima prematurely and enhance its search capability. The optimal location and sizing decision obtained using IQGA are illustrated in Figure 4. Each color in the figure represents the number of chargers assigned to different regions.
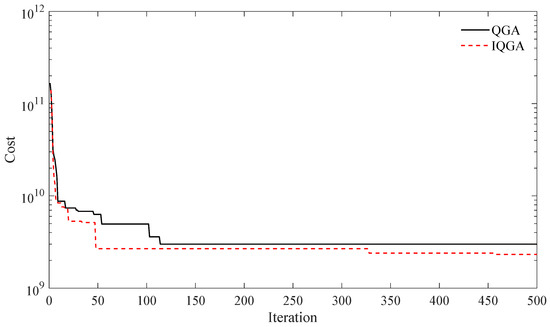
Figure 3.
Comparison of IQGA and QGA algorithm iterations.
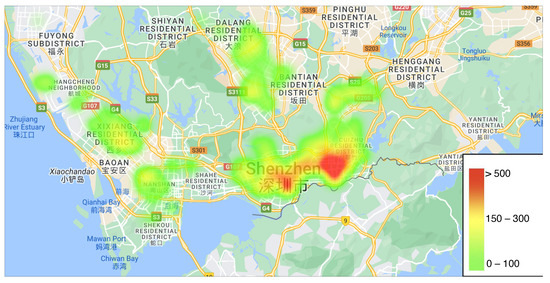
Figure 4.
Location and sizing of CSs.
Figure 5 illustrates the social costs associated with different numbers of CSs. The bar in the figure represents the optimal value obtained by performing IQGA 20 times, while the error bar indicates the difference between the optimal and average values. The results reveal that an optimal number of CSs is required to minimize the social cost. Having too many or too few CSs leads to an increase in the social cost. Figure 6 presents the cost components for different numbers of CSs. It is evident that having too few CSs significantly raises the costs for EV users and carbon emissions, while an excess of CSs greatly increases the construction and operational costs for the CS operator. This demonstrates the importance of optimizing CSs from a holistic perspective, taking into account the social cost and balancing the costs among CS operators, EV users, and the environment.
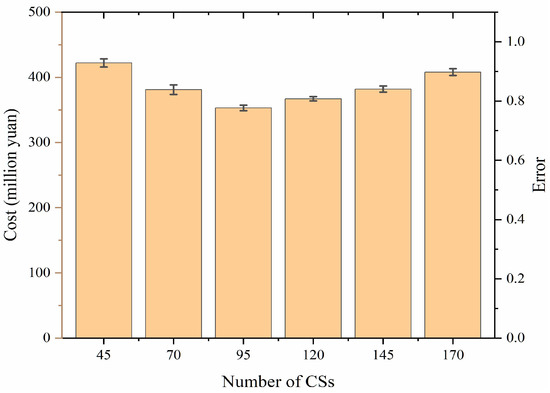
Figure 5.
Total cost and error.
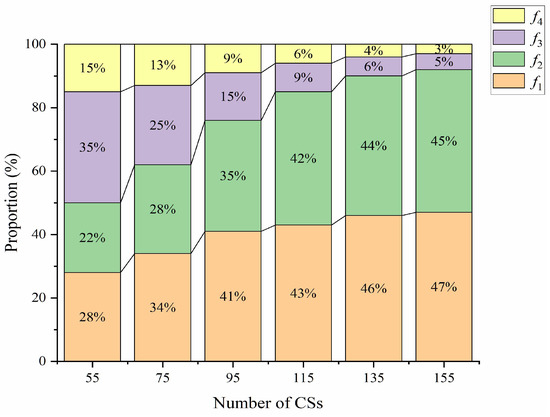
Figure 6.
Proportion of cost components.
The impact of the number of CSs on carbon emissions was investigated and depicted in Figure 7. We have observed a consistent pattern where an increase in the number of CSs leads to a gradual reduction in carbon emissions. However, as the number of stations continues to grow, the rate of emission reduction begins to diminish. Particularly, when the number of CSs reaches a range of 135 to 195, the reduction in emissions becomes nearly linear. This trend can be attributed to the initial decline in carbon emissions resulting from the reduced proximity between EVs and CSs. However, as the CS distribution network expands further, the advantage of reduced traveling distances for EVs becomes less pronounced. When considering the environmental impact, it becomes crucial to take into account the diminishing marginal environmental benefits associated with the increasing number of CSs. It is imperative to carefully evaluate and select an optimal number of stations rather than pursuing uncontrolled expansion.
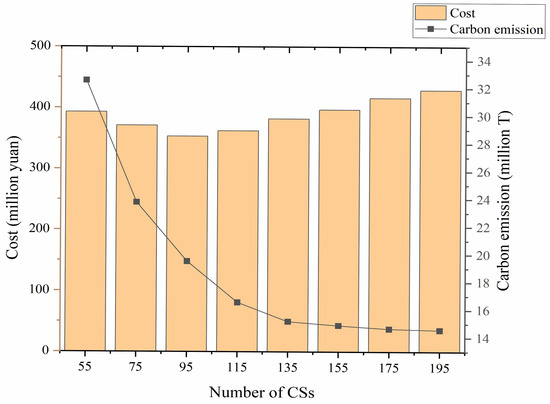
Figure 7.
Changes in costs and carbon emissions with the number of CSs increasing.
We conducted a study to analyze the impact of different types of fast chargers on costs. Four main types of fast chargers available in the market were selected for evaluation. Model 1 DCL040A/B ( = 1) has a cost of 30,000 RMB per unit, model 2 DCL080A/B ( = 2) has a cost of 100,000 RMB per unit, model 3 DCL0160A/B ( = 3) has a cost of 200,000 RMB per unit, and model 4 DCL0240B ( = 4) has a cost of 400,000 RMB per unit. It is important to note that the charger cost increases with shorter charging times for these fast chargers. Table 4 presents the optimization results and cost variations associated with different charger types. As evident from the table, the choice of charger type significantly impacts the costs. A low charging power option ( = 1) tends to result in a greater infrastructure requirement, including a larger number of CSs and chargers. On the other hand, high-power chargers ( = 4) are accompanied by higher charger prices. As increases, the number of CSs and chargers decreases significantly; however, the construction cost and operating cost are higher compared to low-power chargers ( = 2). The user cost and carbon emission cost show an increasing trend with the increase in . This is due to the limited charging resources, where users have fewer options to access the nearest CS for charging, resulting in longer distances () traveled. From the perspective of carbon emission reduction, it is observed that the most substantial decrease occurs when the power of fast chargers changes from = 4 to = 3. However, the reduction in carbon emissions is relatively minor when transitioning from = 3 to = 2. Furthermore, when the power is further reduced from = 2 to = 1, there is a significant increase in the number of CSs from 95 to 210. However, the reduction in carbon emissions is not proportionate to the increase in CS numbers. This difference arises because the carbon emission curve exhibits a diminishing marginal effect with respect to the number of CSs, as illustrated in Figure 7. Therefore, decision-makers need to consider the charger type during the planning phase of CS location and sizing, rather than making decisions after the CS construction is completed.

Table 4.
Optimization results for different power chargers.
Figure 8 illustrates the coverage rate with varying numbers of CSs and covering radius. In real-world scenarios, if the distance between a demand point and the nearest CS exceeds the covering radius, the willingness and satisfaction of EV users to travel to that particular CS significantly decrease. Thus, we studied how different numbers of CSs can effectively cover the demand. It is evident that as the number of CSs and the covering radius increase, the number of effectively covered EVs also increases, although the rate of increment differs significantly. When the covering radius is less than 8 km, the gap in covered demand becomes larger as the number of CSs increases. Conversely, when the covering radius exceeds 8 km, the gap in covered demand decreases with an increase in the number of CSs, eventually nearly disappearing when the number of CSs reaches 160. From the previous analysis in Figure 7, it is observed that additional CSs can increase social costs and do not significantly reduce carbon emissions. However, it is crucial to enhance user satisfaction and increase coverage demand.
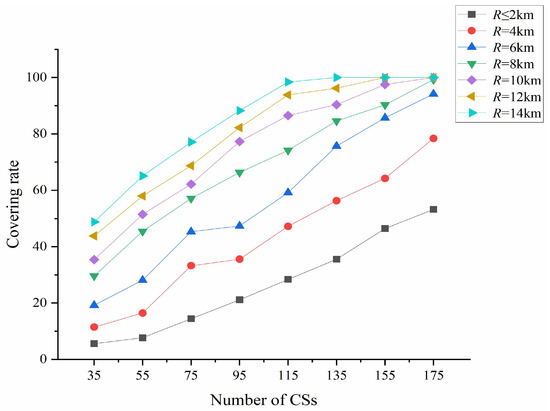
Figure 8.
Covering rate with different number of CSs and covering radius.
5. Conclusions
In this study, we propose IQGA to address the CS location and sizing problem. The IQGA combines dynamic updating of the quantum rotation gate angle with the integration of the simulated annealing algorithm, effectively avoiding local optima. Through rigorous function tests and a comprehensive case study, we demonstrate the effectiveness and efficiency of the IQGA in solving the CS location and sizing problem.
Furthermore, we highlight the significance of considering social costs when determining CS locations and capacities. By optimizing the number of CSs and selecting the appropriate types and quantities of chargers, we not only achieve cost reduction but also significantly decrease carbon emissions. However, we find that the reduction in carbon emissions becomes marginal once the number of CSs exceeds a certain threshold. Nonetheless, the coverage rate continues to improve with the increase in the number of CSs. Consequently, decision-makers must strike a careful balance between costs and coverage rates, taking into account the limited additional reduction in carbon emissions beyond a certain number of CSs.
In conclusion, our proposed IQGA offers a robust and practical approach to effectively solve the CS location and sizing problem while considering both economic and environmental factors. To address the needs of charging infrastructure operators, it is highly recommended to adopt a cohesive planning approach that encompasses the selection of CS locations, the optimal number of stations, and appropriate charging power levels. This comprehensive strategy facilitates cost optimization and maximizes resource efficiency. Policymakers, on the other hand, play a vital role by considering the triple-bottom-line benefits—CS operator, EV users, and environment—in their decision-making process. It is essential for them to develop well-informed policies or provide subsidies that align with their specific environmental targets and coverage objectives.
6. Future Research
In terms of future research directions, there are several areas that offer opportunities for improving and expanding the proposed model and algorithm. Regarding the model, this study primarily focused on the decision-making process related to CS location and capacity determination. However, future models could incorporate additional factors to enhance the analysis. These factors may include considerations of grid load, integration of renewable energy sources, and addressing the challenges associated with the grid impact resulting from the widespread adoption of EV. By incorporating these aspects, researchers can explore more comprehensive and cost-effective CS deployment strategies and develop solutions to mitigate potential grid impacts associated with the increasing demand for EV charging. In terms of the algorithm, further efforts can be dedicated to finding efficient solutions for the aforementioned model. This could involve exploring advanced optimization techniques, adaptive algorithms, or hybrid approaches that combine different optimization methods. By leveraging these approaches, researchers can improve the computational efficiency and effectiveness of the proposed algorithm, enabling faster and more accurate decision-making processes for charging infrastructure planning and development.
Author Contributions
Conceptualization, D.H. and X.L.; methodology, X.L.; software, X.L.; validation, D.H. and X.L.; formal analysis, X.L.; investigation, C.L.; resources, C.L.; data curation, C.L.; writing—original draft preparation, D.H. and X.L.; writing—review and editing, D.H., X.L. and Z.-W.L.; visualization, X.L. and C.L.; supervision, D.H.; project administration, D.H.; funding acquisition, D.H. All authors have read and agreed to the published version of the manuscript.
Funding
The research was funded by National Social Science Fund of China grant 22BGL273.
Institutional Review Board Statement
Not applicable.
Informed Consent Statement
Not applicable.
Data Availability Statement
Dataset available on request from the authors.
Conflicts of Interest
The authors declare no conflict of interest.
References
- Jia, C.; He, H.; Zhou, J.; Li, J.; Wei, Z.; Li, K. A novel health-aware deep reinforcement learning energy management for fuel cell bus incorporating offline high-quality experience. Energy 2023, 282, 128928. Available online: https://www.sciencedirect.com/science/article/pii/S0360544223023228 (accessed on 1 November 2023). [CrossRef]
- Wang, Y.W.; Wang, C.R. Locating passenger vehicle refueling stations. Transp. Res. Part E 2010, 46, 791–801. [Google Scholar] [CrossRef]
- Capar, I.; Kuby, M.; Leon, V.J.; Tsai, Y.-J. An arc cover–path-cover formulation and strategic analysis of alternative-fuel station locations. Eur. J. Oper. Res. 2013, 227, 142–151. [Google Scholar] [CrossRef]
- Wu, F.; Sioshansi, R. A stochastic flow-capturing model to optimize the location of fast-charging stations with uncertain electric vehicle flows. Transp. Res. Part D Transp. Environ. 2017, 53, 354–376. [Google Scholar] [CrossRef]
- Xu, M.; Yang, H.; Wang, S. Mitigate the range anxiety: Siting battery charging stations for electric vehicle drivers. Transp. Part C Emerg. Technol. 2020, 114, 164–188. [Google Scholar] [CrossRef]
- Zhang, J.; Wang, Z.; Miller, E.J.; Cui, D.; Liu, P.; Zhang, Z.; Sun, Z. Multi-period planning of locations and capacities of public charging stations. J. Energy Storage 2023, 72, 108565. [Google Scholar] [CrossRef]
- Ren, Y.; Lan, Z.; Yu, H.; Jiao, G. Analysis and prediction of charging behaviors for private battery electric vehicles with regular commuting: A case study in beijing. Energy 2022, 253, 124160. [Google Scholar] [CrossRef]
- Bai, X.; Wang, Z.; Zou, L.; Liu, H.; Sun, Q.; Alsaadi, F.E. Electric vehicle charging station planning with dynamic prediction of elastic charging demand: A hybrid particle swarm optimization algorithm. Complex Intell. Syst. 2022, 8, 1035–1046. [Google Scholar] [CrossRef]
- Li, J.; Xie, C.; Bao, Z. Optimal en-route charging station locations for electric vehicles: A new modeling perspective and a comparative evaluation of network-based and metanetwork-based approaches. Transp. Part C Emerg. Technol. 2022, 142, 103781. [Google Scholar] [CrossRef]
- Yildiz, B.; Olcaytu, E.; Sen, A. The urban recharging infrastructure design problem with stochastic demands and capacitated charging stations. Transp. Res. Part B Methodol. 2019, 119, 22–44. [Google Scholar] [CrossRef]
- Kadri, A.A.; Perrouault, R.; Boujelben, M.K.; Gicquel, C. A multi-stage stochastic integer programming approach for locating electric vehicle charging stations. Comput. Oper. Res. 2020, 117, 104888. [Google Scholar] [CrossRef]
- Rajani, B.; Kommula, B.N. An optimal energy management among the electric vehicle charging stations and electricity distribution system using gpc-rernn approach. Energy 2022, 245, 123180. [Google Scholar] [CrossRef]
- Su, S. Method of location and capacity determination of intelligent charging pile based on recurrent neural network. World Electr. Veh. 2022, 13, 186. [Google Scholar] [CrossRef]
- Wang, C.; Sun, Y.; Dong, L. A locating method of ev fast charging stations based on the conditional generative adversarial networks. In Proceedings of the 2019 IEEE Innovative Smart Grid Technologies—Asia (ISGT Asia), Chengdu, China, 21–24 May 2019. [Google Scholar]
- Zhou, G.; Zhu, Z.; Luo, S. Location optimization of electric vehicle charging stations: Based on cost model and genetic algorithm. Energy 2022, 247, 123437. [Google Scholar] [CrossRef]
- Zhang, B.; Yan, Q.; Zhang, H.; Zhang, L. Optimization of charging/battery-swap station location of electric vehicles with an improved genetic algorithm-based model. CMES-Comput. Model. Eng. Sci. 2023, 134, 1177. [Google Scholar] [CrossRef]
- Li, J.; Liu, Z.; Wang, X. Public charging station location determination for electric ride-hailing vehicles based on an improved genetic algorithm. Sustain. Cities Soc. 2021, 74, 103181. [Google Scholar] [CrossRef]
- Awasthi, A.; Venkitusamy, K.; Padmanaban, S.; Selvamuthukumaran, R.; Blaabjerg, F. Optimal planning of electric vehicle charging station at the distribution system using hybrid optimization algorithm. Energy 2017, 133, 70–78. [Google Scholar] [CrossRef]
- Yue, W.; Jianmai, S.; Rui, W.; Zhong, L.; Ling, W. Siting and sizing of fast charging stations in highway network with budget constraint. Appl. Energy 2018, 228, 1255–1271. [Google Scholar]
- Zhang, H.; Zhang, K.; Zhou, Y.; Ma, L.; Zhang, Z. An immune algorithm for solving the optimization problem of locating the battery swapping stations. Knowl.-Based Syst. 2022, 248, 108883. [Google Scholar] [CrossRef]
- Xin, A.I.; Yizheng, L.I.; Kunyu, W.; Junjie, H.U. Locating and sizing of electric vehicle charging station based on chaotic simulated annealing particle swarm optimization algorithm. Electr. Power Autom. 2018, 9, 9–14. [Google Scholar]
- Liu, H.; Li, Y.; Zhang, C.; Li, J.; Li, X.; Zhao, Y. Electric vehicle charging station location model considering charging choice behavior and range anxiety. Sustainability 2022, 14, 4213. [Google Scholar] [CrossRef]
- Qin, J.; Qiu, J.; Chen, Y.; Wu, T.; Xiang, L. Charging stations selection using a graph convolutional network from geographic grid. Sustainability 2022, 14, 16797. [Google Scholar] [CrossRef]
- Cui, Y.; Meng, X.; Qiao, J. A multi-objective particle swarm optimization algorithm based on two-archive mechanism. Appl. Soft Comput. 2022, 119, 108532. [Google Scholar] [CrossRef]
- Muthukannan, S.; Karthikaikannan, D. Multiobjective planning strategy for the placement of electric-vehicle charging stations using hybrid optimization algorithm. IEEE Access 2022, 10, 48088–48101. [Google Scholar] [CrossRef]
- Heidari, A.A.; Mirjalili, S.; Faris, H.; Aljarah, I.; Mafarja, M.; Chen, H. Harris hawks optimization: Algorithm and applications. Futur. Comput. Syst. 2019, 97, 849–872. [Google Scholar] [CrossRef]
- Pierezan, J.; Coelho, L.D.S. Coyote optimization algorithm: A new metaheuristic for global optimization problems. In Proceedings of the 2018 IEEE congress on evolutionary computation (CEC), Rio de Janeiro, Brazil, 8–13 July 2018; pp. 1–8. [Google Scholar]
- Mirjalili, S.; Lewis, A. The whale optimization algorithm. Adv. Eng. Softw. 2016, 95, 51–67. [Google Scholar] [CrossRef]
- Cheng, J.; Xu, J.; Chen, W.; Song, B. Locating and sizing method of electric vehicle charging station based on improved whale optimization algorithm. Energy Rep. 2022, 8, 4386–4400. [Google Scholar] [CrossRef]
- Han, K.-H.; Kim, J.-H. Quantum-inspired evolutionary algorithm for a class of combinatorial optimization. IEEE Trans. Evol. 2002, 6, 580–593. [Google Scholar] [CrossRef]
- da Cruz, A.V.A.; Barbosa, C.R.H.; Pacheco, M.A.C.; Vellasco, M. Quantum-inspired evolutionary algorithms and its application to numerical optimization problems. In Proceedings of the Neural Information Processing: 11th International Conference, ICONIP 2004, Calcutta, India, 22–25 November 2004; pp. 212–217. [Google Scholar]
- Mondal, S.; Tsourdos, A. Two-dimensional quantum genetic algorithm: Application to task allocation problem. Sensors 2021, 21, 1251. [Google Scholar] [CrossRef]
- Shill, P.C.; Akhand, M.; Murase, K. Fuzzy logic controller for an inverted pendulum system using quantum genetic optimization. In Proceedings of the 14th International Conference on Computer and Information Technology (ICCIT 2011), Dhaka, Bangladesh, 22–24 December 2011; pp. 503–508. [Google Scholar]
- Huang, Z.; Chen, Z.; Zheng, Y.; Sun, M.; Sun, Q. Optimal design of load frequency active disturbance rejection control via double-chains quantum genetic algorithm. Neural Comput. Appl. 2021, 33, 3325–3345. [Google Scholar] [CrossRef]
- Erlang, A.K. The theory of probabilities and telephone conversations. Nyt. Tidsskr. Mat. B 1909, 20, 33–39. [Google Scholar]
- Available online: https://www.cneeex.com/qgtpfqjy/mrgk/2023n/ (accessed on 30 June 2023).
- Javidrad, F.; Nazari, M. A new hybrid particle swarm and simulated annealing stochastic optimization method. Appl. Soft Comput. 2017, 60, 634–654. [Google Scholar] [CrossRef]
- Mafarja, M.M.; Mirjalili, S. Hybrid whale optimization algorithm with simulated annealing for feature selection. Neurocomputing 2017, 260, 302–312. [Google Scholar] [CrossRef]
- Hu, D.; Huang, L.; Liu, C.; Liu, Z.W.; Ge, M.F. Data driven optimization for electric vehicle charging station locating and sizing with charging satisfaction consideration in urban areas. IET Renew. Power Gener. 2022, 16, 2630–2643. [Google Scholar] [CrossRef]
- Li, Y.; Luo, J.; Chow, C.-Y.; Chan, K.-L.; Ding, Y.; Zhang, F. Growing the charging station network for electric vehicles with trajectory data analytics. In Proceedings of the 2015 IEEE 31st International Conference on Data Engineering, Seoul, Republic of Korea, 13–17 April 2015. [Google Scholar]
- Guangdong Province Enterprise CO2 Emission Information Reporting Guidelines (Revised 2023 Edition); Department of Ecology and Environment of Guangdong Province: Guangzhou, China, 2023. Available online: https://gdee.gd.gov.cn/attachment/0/515/515612/4285363.pdf (accessed on 7 March 2023).
Disclaimer/Publisher’s Note: The statements, opinions and data contained in all publications are solely those of the individual author(s) and contributor(s) and not of MDPI and/or the editor(s). MDPI and/or the editor(s) disclaim responsibility for any injury to people or property resulting from any ideas, methods, instructions or products referred to in the content. |
© 2024 by the authors. Licensee MDPI, Basel, Switzerland. This article is an open access article distributed under the terms and conditions of the Creative Commons Attribution (CC BY) license (https://creativecommons.org/licenses/by/4.0/).