Article

Examining the Impact of External Debt, Natural Resources, Foreign Direct Investment, and Economic Growth on Ecological Sustainability in Brazil

by
Saleem Haji Saleem
1,
Dildar Haydar Ahmed
1,2 and
Ahmed Samour
3,*
1
Faculty of Administrative and Economics, Near East University, Nicosia 99138, Turkey
2
Department of Economic Science, College of Administration and Economics, University of Zakho, Zakho P.O. Box 12, Iraq
3
Accounting Department, Dhofar University, Salalah 211, Oman
*
Author to whom correspondence should be addressed.
Sustainability 2024, 16(3), 1037; https://doi.org/10.3390/su16031037
Submission received: 12 December 2023 / Revised: 20 January 2024 / Accepted: 22 January 2024 / Published: 25 January 2024
(This article belongs to the Section Energy Sustainability)

Abstract

:
Although some recent papers have explored the impacts of external debt on environmental sustainability, the impacts of external debt on the load capacity factor (LCF) have been ignored. In this regard, this work aims to examine the influence of renewable energy, FDI, and external debt on the LCF in Brazil over the period 1970–2021; this indicator implies the country’s strength to promote the population based on current lifestyles. This paper uses the novel augmented autoregressive distributive lag (A-ARDL) technique. The findings from the A-ARDL show that renewable energy positively influenced ecological sustainability by promoting the LCF by 0.451% in the short run and 0.038% in the long run. In addition, the findings show that an increase in the rent of natural resources promotes the LCF. In contrast, the outcomes illustrate that an increase in the external debt led to an adverse impact on ecological sustainability by decreasing the level of LCF by 0.093% in the short run and 0.162% in the long run. Furthermore, the findings demonstrated that FDI negatively affects the ecological sustainability quality by reducing the LCF in the country. The study provides beneficial recommendations to policymakers in Brazil for achieving sustainable development in Brazil.

1. Introduction

In the modern era, all economies are mainly reliant on fossil fuel energy at all stages of economic activities. Thus, energy has become an essential ingredient of industrialization and growth. Global fossil fuel energy use has risen over time due to excessive economic and financial development objectives, and significant industrialization. However, this type of energy produces large amounts of carbon emissions (CO2), resulting in global warming and climate change [1]. Over the last few decades, a growing consensus has emerged among environmental policymakers and scientists that global warming adversely impacts individual life, human well-being, and ecological sustainability [2], as a result of effects such as severe weather extremes. Therefore, mitigating CO2 emissions and promoting environmental neutrality have become a worldwide concern for sustainable development.
To combat the arduous challenge of ecological pollution, many nations have implemented several environmental policies to promote environmental sustainability [3]. In 2015, more than 200 nations jointly proposed an international climate agreement (Paris 2015 Agreement) in France, which set the goal of achieving “net zero” ecological emissions by the end of 2050. Likewise, among the United Nations Sustainable Development Goals (SDGs), SDGs 13 and 7 aim to incorporate government strategies to combat climate change and global warming rapidly, and promote accessibility of green energy sources to mitigate ecological pollution and achieve the SDGs [4].
Environmental sustainability occupies a significant place on the agenda of nations and policymakers as well as in the literature. Thus, governments are seeking to find different paths leading to ecological sustainability to achieve the SDGs that combine all the activities that promote long-term economic and financial development without negatively affecting society. Ecological sustainability can only be achieved by examining the association between economic factors and ecological pollution. Against this background, the present paper explores the influence of external debt, FDI, renewable energy, and economic growth on ecological sustainability in Brazil. In this way, the prime objective of the present work is to answer three questions: Could external debt be a prime determinant of the LCF in the case of Brazil? What is the impact of foreign direct investment (FDI) on the LCF in the case of Brazil? Could REC affect the LCF in Brazil?
The linkage among economic development and environmental sustainability has attracted continuous recognition and significance in the ecological empirical literature [5,6,7,8]. Several empirical studies suggest that the significant increase in global economic and financial development signifies a strong probability of an increase in demand for energy, which would concurrently cause grave ecological pollution concerns. On the other hand, a significant increase in external debt and its effects have received significant attention in the energy and environment literature. Some papers have investigated the interconnection between external debt and economic expansion (e.g., [9,10,11]). Other papers have assessed the connection between debt and ecological sustainability (e.g., [12,13,14]). However, it is evident that no agreement has been reached on the impact of external debt on ecological sustainability. Sadiq et al. [8] indicated that external debt can provide finance sources for the energy transition, which in turn affects the level of renewable utilization and environmental quality. In contrast, using these sources to finance fossil fuel energy utilization and investment may increase ecological pollution. Katircioglu and Celebi [12] indicated that the government uses external debt to decrease the saving–investment gap. Additionally, these sources can drive energy demand, thereby promoting the level of energy use. Farooq et al. [15] indicated that external debt indirectly affects ecological sustainability through the economic channel. An adequate level of public debt is believed to promote capital inflow, reinforce investment, and positively affect economic performance. Subsequently, it may affect ecological sustainability. In contrast, Akam et al. [16] suggested that external debt does not contribute to ecological sustainability in the studied countries.
According to the gaps observed in the empirical literature, the current paper contributes to the empirical studies in the following ways. First, some recent empirical papers have used the LCF as a fresh indicator to evaluate ecological quality (e.g., [17,18,19,20]). The mentioned papers measured environmental sustainability using the ecological footprint and CO2 emission indicators. These proxies cover the demand part of environmental sustainability but exclude the supply part. Therefore, there is a need for an ecological indicator that takes into account both the supply sides of nature (biocapacity) and the demand sides of ecological sustainability (ecological footprint) [11]. In this regard, Siche et al. (2010) [21] proposed the LCF as an upgraded proxy to evaluate environmental sustainability by analyzing both biocapacity and ecological footprint to provide a more comprehensive indicator of ecological sustainability. Hence, this indicator can help the country to assess whether the environment is sustained (if the value of LCF is more than one) or not (if the value of LCF is less than one). However, the existing empirical literature has ignored the connection between external debt and LCF. Consequently, the aim of this paper is to assess the influence of external debt on the LCF for the first time in the case of Brazil. In this context, the study aims to fill the gap in the ecological sustainability literature by assessing the determinants of LCF in Brazil and taking the role of external debt into consideration. The present study is the first to study the impact of external debt on environmental sustainability using the novel proxy LCF. Second, several approaches, such as the autoregressive distributed lag (ARDL) method, have been used to evaluate ecological quality. The upgraded ARDL technique, as introduced by Sam et al. (2019) [22], has not been commonly employed in the extant empirical studies. Hence, the main objective of this research is to offer fresh evidence by applying the novel AARDL approach. This approach takes into account the  F s t a t i s t i c  for the overall test and the  T s t a t i s t i c  on a lagged dependent variable, and the  F s t a t i s t i c  for the independent variable provide better findings than the traditional cointegration methods. Finally, it is critical to understand the main determinants of the load capacity factor in Brazil, which is considered as one of the world’s fastest-growing economies, to explore this country and offer useful recommendations based on empirical findings. Thus, the present paper aims to offer some important recommendations to the policymakers in Brazil to achieve ecological sustainability by promoting renewable energy investment and production.
Brazil presents an ideal case study for examining the impact of external debt, natural resources, and FDI on environmental sustainability: (1) Brazil has become one of the safest places in the Latin America region, which has helped to attract large amounts of savings and FDI. The country was valued at USD 1.92 trillion in terms of gross domestic product (GDP) in 2022. This makes the country one of the biggest economies in South America. In addition, foreign direct investments in the country have increased significantly over the last few decades, from USD 391 million in 1970 to USD 91 billion in 2020. Brazil is grouped along with the leading five emerging countries. (2) External debt has grown steadily over the last few decades, especially in leading emerging economies such as Brazil. The external debt in the country increased to USD 4251 billion by the end of 2020, its highest level since 1970. (3) Despite being an emerging economy, Brazil has been classified as one of the economies with the largest sources of renewables. The country generates 89 percent of its electricity from green energy sources. Furthermore, the share of renewable energy of total energy utilization increased from 26% in 1970 to 48% in 2022. Renewable sources such as hydropower and solar power dominate a significant part of the country’s energy sector [
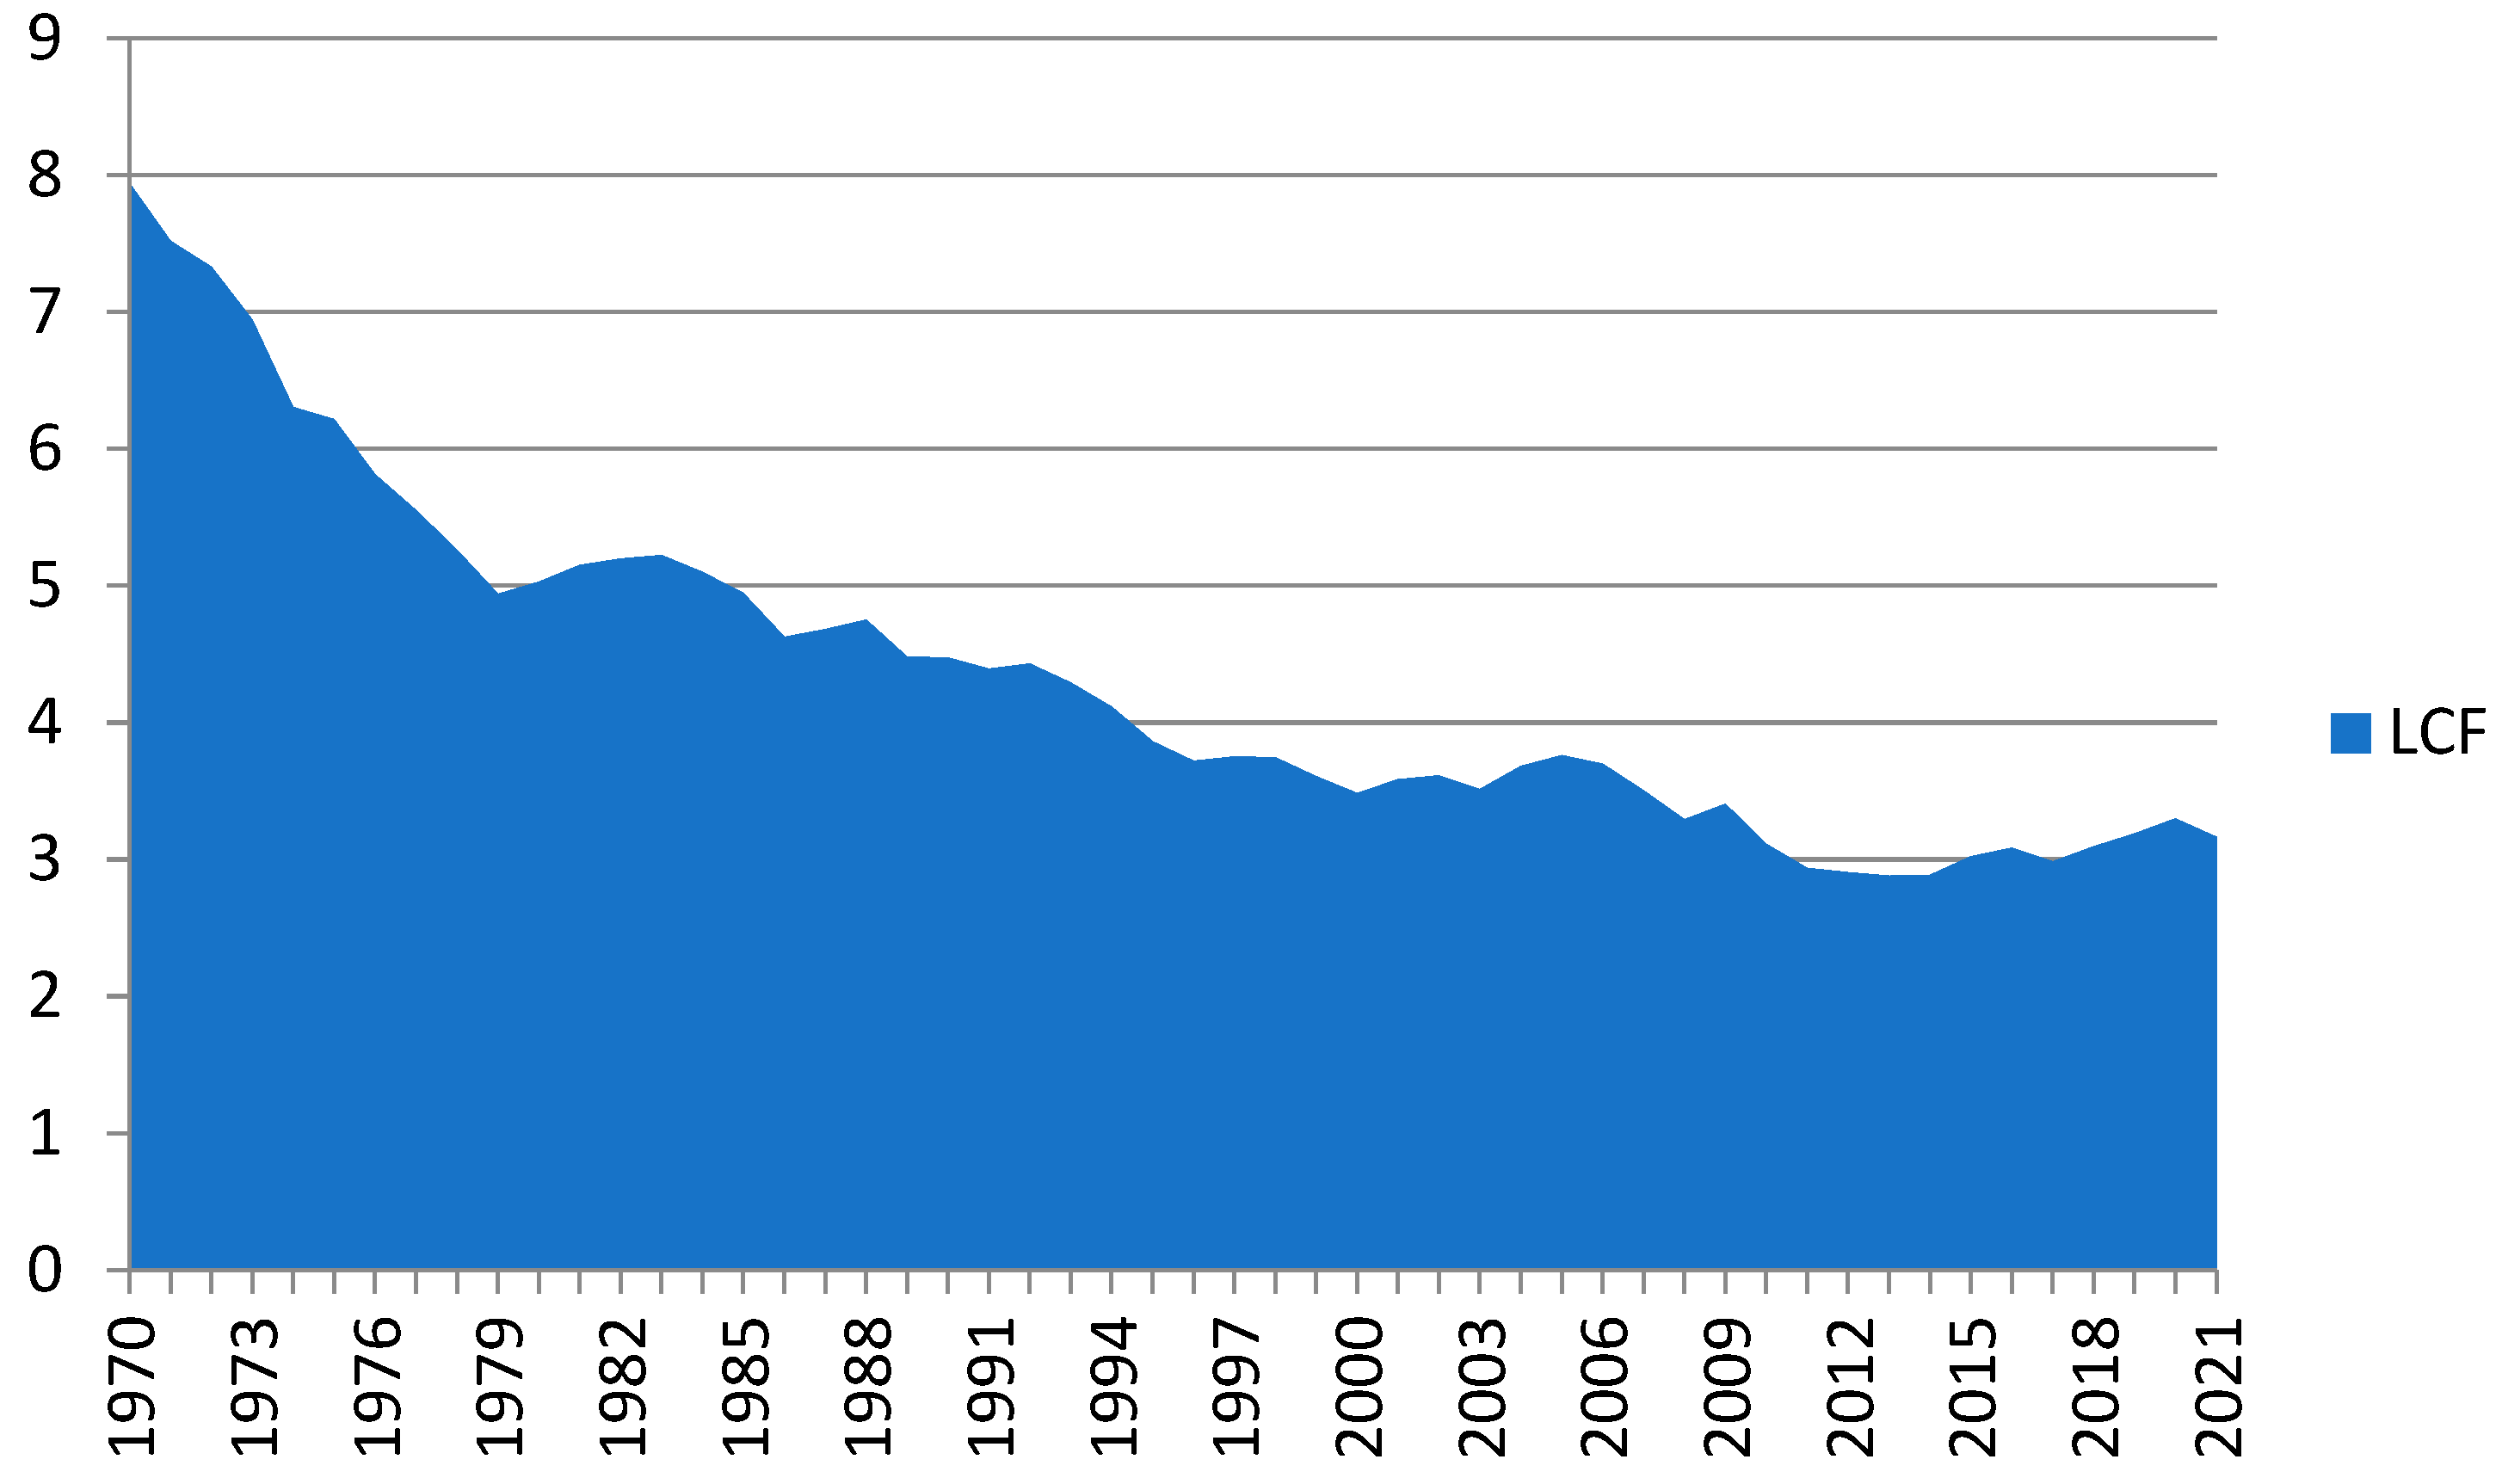
14]. (4) Brazil ratified the Paris agreement in September 2016, committing to lowering greenhouse gas and achieving environmental neutrality by 2050. Nevertheless, Brazil is classified as one of the top-10 carbon emitters in the world. The country’s ecological quality level has declined over the last few decades. In this context, the LCF factor in Brazil decreased from 7.9 in 1970 to 3.35 in 2021 (see Figure 1). Therefore, the country has significant ecological challenges and mitigating ecological pollution should be a priority.
The structure of this paper is designed as follows. The empirical literature review section is presented in Section 2. Section 3 and Section 4 present the data, model, employed methodology, and empirical outcomes. Lastly, Section 5 and Section 6 include this work’s empirical discussion and conclusion.

2. Literature Review

2.1. Energy, Economic Growth, and Ecological Sustainability

A growing body of scientific papers has emerged on the influence of economic expansion and renewable energy consumption (REC) on ecological quality. For example, Charfeddine and Mrabet [6] utilized the Dynamic Ordinary Least Squares (DOLS) test to explore the impacts of economic growth and REC on the EF in Middle East and North African (MENA) economies. The study demonstrated that economic growth decreases environmental sustainability by increasing the EF. Using the same approach, Shah et al. [4] assessed the impact of REC on EF in the BRICS economies over the period 1990–2019. Their outcomes showed that REC decreases EF in the tested economies, implying that these variables positively contribute to ecological sustainability. Zafar et al. [7] investigated the connections among the EF, economic expansion, and REC in the case of the USA over the period from 1970 to 2015. Using the ARDL method, the outcomes displayed that REC is helpful in curtailing EF, while economic expansion is harmful. Using the CS-ARDL test and data from 1995 to 2017 in China, Shen et al. [23] evaluated the impact of REC and economic expansion on CO2. The authors found that economic expansion increases the CO2 emissions while REC contributes to a CO2 decrease. Wei et al. [24] evaluated the nexus among REC and CO2 in Brazil using data from the period from 1990 to 2018. The authors found evidence indicating a positive linkage between REC and CO2 emissions in the SEA region. The authors of [25] assessed the impact of clean energy technologies on ecological sustainability in 29 sub-Saharan African economies from 2002 to 2018. The findings of this study indicated that clean energy promotes ecological sustainability. Using the LCF as a novel indictor to determine the ecological quality, Pata and Samour [18] demonstrated that REC had a positive impact on LCF in the case of 27 OECD economies from 1990 to 2018. Pata et al. [19] assessed the connection among economic expansion, REC, and LCF in the USA over the period from 1961 to 2018. The findings demonstrated that economic growth reduces environmental sustainability, while the REC promotes it.

2.2. Nexus between Natural Resources and Ecological Sustainability

In the literature, scientific interest in the connection between natural resources rent (NRR) and ecological sustainability has increased significantly, focusing on different key indicators for assessing ecological sustainability. Some papers have used CO2 and EF as proxies to capture ecological sustainability. For instance, Shen et al. [23] used CS-ARDL to examine the nexus between NRR and CO2 for 30 Chinese provinces from 1975 to 2015. The authors of this study found evidence of a positive relationship between NRR and CO2 emissions. Similarly, Xiaoman et al. [26] conducted the GMM test to assess the same relation in the case of the MENA economies from 1980 to 2018. The authors reported that NRE significantly improves environmental sustainability. Similar results were found by Kongbuamai et al. [27] who implied that NRR helps to improve the ecological sustainability of the ASEAN economies. Conversely, Ahmad et al. [28] examined this relation in some emerging economies from 1984 to 2016 and found that NRR positively influences EF. Recently, some studies have used LCF to evaluate the linkage between NRR and environmental sustainability. For example, Sun et al. [29] employed the AMG assessment to assess the linkage between NRR and LCF for selected Asian economies from 1990–2019, and suggested that NRR increases the LCF in the tested countries. Jin et al. [30] used A-ARDL and evaluated the same link in Germany from 1974 to 2018. Their findings showed that NRR has a negative influence on the LCF. In contrast, Li et al. [31] used the CS-ARDL approach and found that an increase in NRR has a negative impact on LCF in the case of the Next 11 countries.

2.3. Nexus between FDI and Ecological Sustainability

Several studies have assessed the linkage between FDI and ecological sustainability in the context of the pollution haven (PHV) and pollution halo (PHO) hypotheses. These hypotheses were proposed by Walter and Ugelow [32] and Baumol and Oates [33] to evaluate whether FDI transfers pollution-intensive industries to the host economies and leads to environmental degradation. PHVH implies an increase in FDI will lead to a rise in carbon emissions. This can be attributed to the fact that ecological pollution from developed economies is being shifted to less developed countries because of a need to reduce production costs and protect their countries’ environmental quality. With the absence of stringent environmental regulations in the host economies, the carbon emission level will be increased [34]. Doytch [35] assessed the influence of FDI on the EF in some developing and developed economies, finding that FDI increases the EF in the tested countries. For 31 African countries, Arogundade et al. [4] demonstrated that an increase in FDI led to a rise in ecological footprint, indicating that the hypothesis was valid. Similarly, Sabir and Gorus [36] found that the PHV hypothesis was valid in the case of South Asian economies over the period of 1975–2017. Recently, Wei et al. [37] suggested that the PHV hypothesis is valid in the belt and road initiative region. On the other hand, the PHV hypothesis argues that multinational firms transfer their greener technologies to host countries through FDI, which, in turn, leads to ecological sustainability being enhanced. In this context, Yi et al. [38] suggested that ecological quality is positively associated with FDI by providing more modern and green technology.

2.4. Nexus between External Debt and Ecological Sustainability

The external debt of a country can have a powerful influence on its economic growth, which in turn may affect the environmental quality. This may require these economies to adopt additional policies to avoid the adverse impact of external debt on ecological quality. Several studies have emphasized the association among economic growth and carbon emission, but research on the direct impacts of external debt on the environment is still limited. In this context, Bese [14] examined the influence of external debt on the level of carbon emissions in China from 1978 to 2014. Using the ARDL approach, the study showed that an increase in external debt led to increased CO2 emissions in the tested country. Using the ARDL approach, Katircioglu and Celebi [12] suggested the existence of a positive linkage between foreign debt and Turkey’s carbon emissions. The authors suggested that their results can be attributed to fact that an increase in the level of debt increases investment in the country, which in turn increases the energy demand, thereby worsening ecological pollution. Conversely, Sadiq et al. [8] assessed the influence of debt on ecological sustainability in the BRICS. The authors found that external debt promoted environmental sustainability in the tested countries from 1990 to 2019. According to the authors, external debt may provide the necessary resources for the green energy transition by financing green energy investment and projects. Hence, external debt can play a positive role in promoting ecological sustainability. Farooq et al. (2023) [15] assessed the link between debt and ecological degradation in Organisation of Islamic Cooperation countries for the period from 1996 to 2018. The authors found that an increase in the level of debt increased ecological degradation in the tested countries. The authors suggested that external debt can affect ecological sustainability through the economic channel by promoting capital inflow and investment. However, some studies have not found any significant link between debt and ecological sustainability. For example, Akam et al. [16] examined this relation in the case of the South African, Algerian, and Nigerian economies. They suggested that external debt does not contribute to ecological sustainability in the tested countries. However, most empirical studies imply that a research gap exists in examining the external debt and LCF linkage.

2.5. Research Gap

The preceding discussion in the empirical literature focused on carbon emission (CO2) and ecological footprint to capture environmental sustainability using different periods (e.g., 1970 to 2015, 1995 to 2017). These proxies cover the demand part of environmental sustainability and exclude the supply part. Recently, some studies have used LCF to capture environmental sustainability, which takes into account both the supply sides of nature and the demand sides of ecological sustainability. Most empirical literature has ignored the connection between external debt and LCF. Thus, the present study aims to fill the research gap by examining the impact of external debt on the LCF for the first time in the case of Brazil. Likewise, this paper aims to present novel empirical evidence by applying the AARDL approach using two different periods, from 1990 to 2021 and from 1970 to 2021.

3. Data and Methodology

3.1. Data and Tested Model

To assess the impacts of economic growth, renewable energy, NRR, FDI, and external debt on the LCF in Brazil, this study uses annual data from 1970 to 2021. In this context, we perform the tested model by taking into account the novel LCF indicator to measure environmental sustainability in the tested country. The tested model of this analysis is formulated as follows:
l n L C F i t = β 0 + δ 1 l n E G i t + δ 2 l n R E C i t + δ 3 l n N R i t + δ 4 l n F D I i t + δ 5 l n E D i t + u i t
where    L C F t  denotes the load capacity factor indicator,  l n E G t  denotes economic growth (GDP),  l n R E C t  denotes renewable energy consumption per capita, and  l n N R t  denotes the natural resources as a proportion of GDP.   l n F D I t  denotes foreign direct investment net outflows and  l n E D t  represents total external debt stocks (% of GDP). A description of the selected variables in this study and data sources is in Table 1. In addition, Table 2 shows the variables’ descriptive statistics, including the mean, maximum, median, and minimum values. Furthermore, Figure 2 shows the selected variables in this study in plots.
Natural resources can play a significant role in ecological sustainability. This effect might be explained by the fact that natural resources substantially impact biocapacity. Economies with abundant natural resources benefit from fast economic development. Hence, using these resources to promote green energy investment and production may positively affect ecological sustainability. In contrast, the ecological sustainability is harmed by careless natural resources exploitation. Thus, examining the influence of natural resources on ecological sustainability is essential. On the other hand, FDI in both developing and developed nations has been identified as a significant factor in promoting economic and financial development. Hence, these resources can significantly support technological diffusion, financial flows, and resource modeling. On the other hand, external debt can play a significant role in economic development, which in turn may affect the level of investment, such as infrastructure and industry investment. Subsequently, this may affect the level of energy and environmental quality. Thus, using these factors to evaluate environmental sustainability is appropriate. However, we selected variables for the present research based on the UN SDGs.
The coefficient sign of  δ 1 is predicted to be positive [18]; thus, an improvement in the economic expansion will increase the LCF. The  δ 2 is predicted to be positive. Renewable energy sources are green and clean sources, and they have a positive role in promoting sustainable development.
δ 3 is expected to be positive due to the country having abundant green natural resources [30].  δ 4 is predicted to be negative because the FDI of the country fails to promote green technologies and investment [37]. The  δ 5 is expected to be negative because an increase in the external debt in turn may have a positive impact on economic expansion [12]. This will lead to a rise in fossil fuel consumption and a decrease in LCF.

3.2. Stationary and Cointegration Assessments

This study used the Augmented Dickey–Fuller (ADF) unit-root test to evaluate the stationarity of the tested time-series data. However, it is a well-known issue that classical unit-root tests, such as ADF test, do not consider structural-break dates. To overcome this issue, this study uses the Perron–Vogelsang (PV) test, which was proposed by Perron and Vogelsang [39]. This test takes into account one endogenous structural-break date.
The fractional integration in the examined data can cause significant problems in the empirical tests. To fix this issue, several empirical studies have used the ARDL bounds test as introduced by Pesaran et al. (2001) [40] to evaluate the cointegration among the selected time series. In this test, the examined variables are not required to be equally stationary and integrated. In this approach, the cointegration hypothesis will be accepted if  F s t a t i s t i c  exceed the Pesaran et al. (2001) [40] critical values. McNown et al. [41] upgraded this approach by considering the bootstrap simulations issue to provide more accurate findings; however, the authors illustrated that it was insufficient to affirm the cointegration only by using the value of the  F s t a t i s t i c  for the overall assessment and for the  T s t a t i s t i c  on a lagged dependent variable. In this context, McNown et al. [41] suggested an additional  t s t a t i s t i c  or  F s t a t i s t i c  on the lagged independent variables to upgrade the ARDL assessment to distinguish among cases of cointegration or degenerate cases. Sam et al. (2019) [22] upgraded the model and introduced the  F s t a t i s t i c  CV for the independent variable to evaluate cointegration. Additionally, cointegration according to the Sam et al. (2019) [22] approach will be evaluated using the  T s t a t i s t i c  and  F s t a t i s t i c  overall value which can be derived from Pesaran et al. [40] and Narayan [42]. The upgraded ARDL is formulated as follows:
l n L C F t = β 0 + i = 1 n y 1 l n L C F 2 t j + i = 1 n y 2 l n E G t j + i = 1 n y 3 l n R E C t j + i = 1 n y 4 l n N R t j + i = 1 n y 5 l n F D I t j + i = 1 n y 5 l n E D t j + 1 l n L C F i t i + 2 l n E G t 1 + 3 l n R E C t 1 + 4 l n N R t 1 + 5 l n F D I t 1 + 6 l n E D t 1 + ω E C T t 1 + ε 1 t  
In Equation (2), ∆ is the first-difference operator.  l n L C F l n E G , l n R E C l n N R , l n F D I , and  l n E D  are the explored variables in the log; n is the lagged optimal.  ε 1 t  denotes white noise.  β 0  is the constant term.  y 1 , y 2 , y 3 , y 4 , y 5 , y 6  represent the estimated coefficients in the short period.  1 , 2 , 3 , 4 , 5 , 6  represent the estimated coefficients in the long period.  E C T t 1  is the error-correction term, which is predicted to be “a negative and significant sign” (less than −1) to confirm the adjustment velocity from “the convergence” case to the equilibrium level [40]. The lag length optimal is selected based on the  A k a i k e   i n f o r m a t i o n   c r i t e r i o n . In this assessment model, three hypotheses will be investigated.
First, the null hypothesis  ( H 0 )  and alternative hypothesis  ( H 1   )  for the overall  F t e s t  on all variables are:
H 0 ; α 1 = α 2 = α 3 = α 4 = α 5 = α 6 = 0 H 1 ; α 1 α 2 α 3 α 4 α 5 α 6 0
Second, the  H 0  and  H 1    hypotheses for  T s t a t i s t i c  on a lagged dependent variable are:
H 0 ; α 2 = 0 H 1 ; α 2 0
Third, the  H 0  and  H 1    hypotheses for the F test on a lagged independent variable are:
H 0 ; α 2 = α 3 = α 4 = α 5 = α 6 = 0 H 1 ; α 2 α 3 α 4 α 5 α 6 0
Moreover, this paper employes the Bayer and Hanck cointegration [43] approach to enhance the AARDL findings. This approach combines cointegration techniques: Engle and Granger [44], Johansen, [45], Boswijk [46], and Banerjee [47] assessments. Additionally, this approach includes the Fisher  F s t a t i s t i c  to present powerful evidence to reinforce the level of cointegration. This approach is structured as follows:
E G t J O H t = 2 [ I N P E G t + ( P J O H t )   ]
E G t J O H t B O t B D M t = 2 I N P E G t + P J O t + P B O t + P B A t  
where    E G t J O H t B O t B D M t  are cointegration assessments. In this approach,  H 1  of cointegration level will be significantly dismissed if the Fisher  F s t a t i s t i c  values exceed the values of the Bayer and Hanck approach.
In addition, the current study employed some assessments to evaluate the stability of the tested model. In this regard, the study uses the Breusch–Pagan–Godfrey and ARCH assessments to confirm there were no serial correlations in the tested model. Additionally, this paper used the Normality and Ramsay assessments to verify the stability of tested model. In addition, the existing paper employed the fully modified (OLS) and Canonical Cointegrating Regression (CCR) as proposed by Phillips and Hansen (1990) [48] and Par (1992) [49], respectively, to affirm the ARDL findings in the long run. However, the robustness tests aim to overcome the unbiased, endogeneity, and serial correlation issues in the examined empirical models.

4. Empirical Findings

In the present study, we employed ADF and PV assessments with one date of structural break (D-SB) to determine the order of integration among the selected variables and avoid any erroneous findings. The findings of these tests are displayed in Table 3, which shows that all the selected variables are integrated and stationary after the first difference. By confirming the stationary issue, we can proceed to evaluate the cointegration issue in the empirically tested model.
We tested the association among the variables using three different models. In the first model, we used the data period from 1970 to 2021 to evaluate the relationship among (EG, REC, NRR, FDI, ED) and (LCF). In the second model, we used the data period from 1970 to 2021 to evaluate the relationship among (EG, NRR, FDI, ED) and (LCF). In the third model, we used the data period from 1990–2021 to evaluate the relationship among (EG, REC, NRR, FDI, ED) and (LCF). To evaluate the cointegration level among the tested variables, the study used the novel augmented ARDL technique. The findings of these tests as presented in Table 4 show that the  F s t a t i s t i c  value for the overall assessment and for the  T s t a t i s t i c  on a lagged dependent variable, and  F s t a t i s t i c  CV for the independent variable exceed the CV of these tests as presented by Pesaran et al. (2001) [40], Narayan [42], and Sam et al. (2019) [22], respectively. Thus, these findings present evidence indicating that the level of cointegration among the focused variables is valid.
To confirm the ARDL outcomes, we employed the Bayer and Hanck cointegration (2013) [43] approach. The outcomes of this approach (Table 5) show that the computed F-statistic value exceeded the tabulated F-statistics in both “ E G T J O T ” and “ E G T J O T - B O T B A T ”. Thus, these test findings affirm the robustness of the AARDL test.
Further, the J-B test (Table 6) affirms that the examined model has normal distribution, while the findings of the Ramsay, ARCH, and heteroskedasticity assessments (
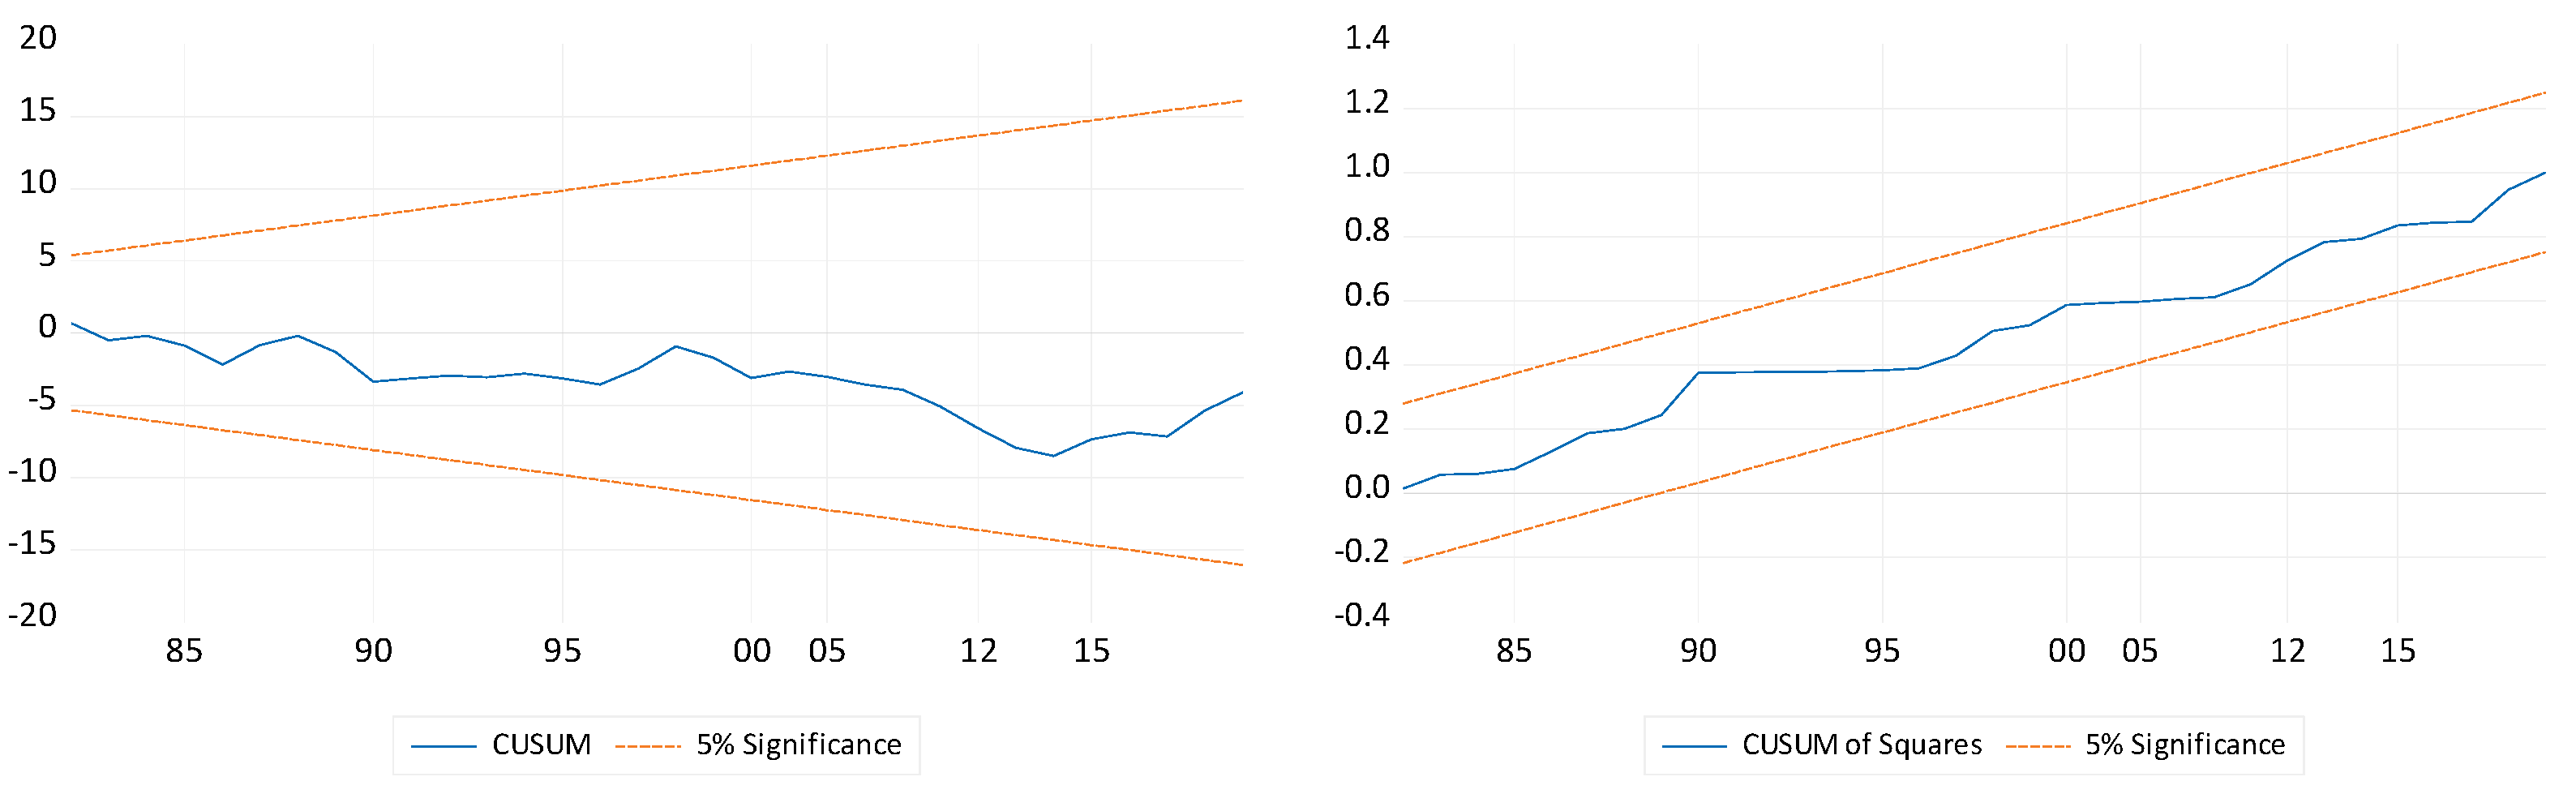
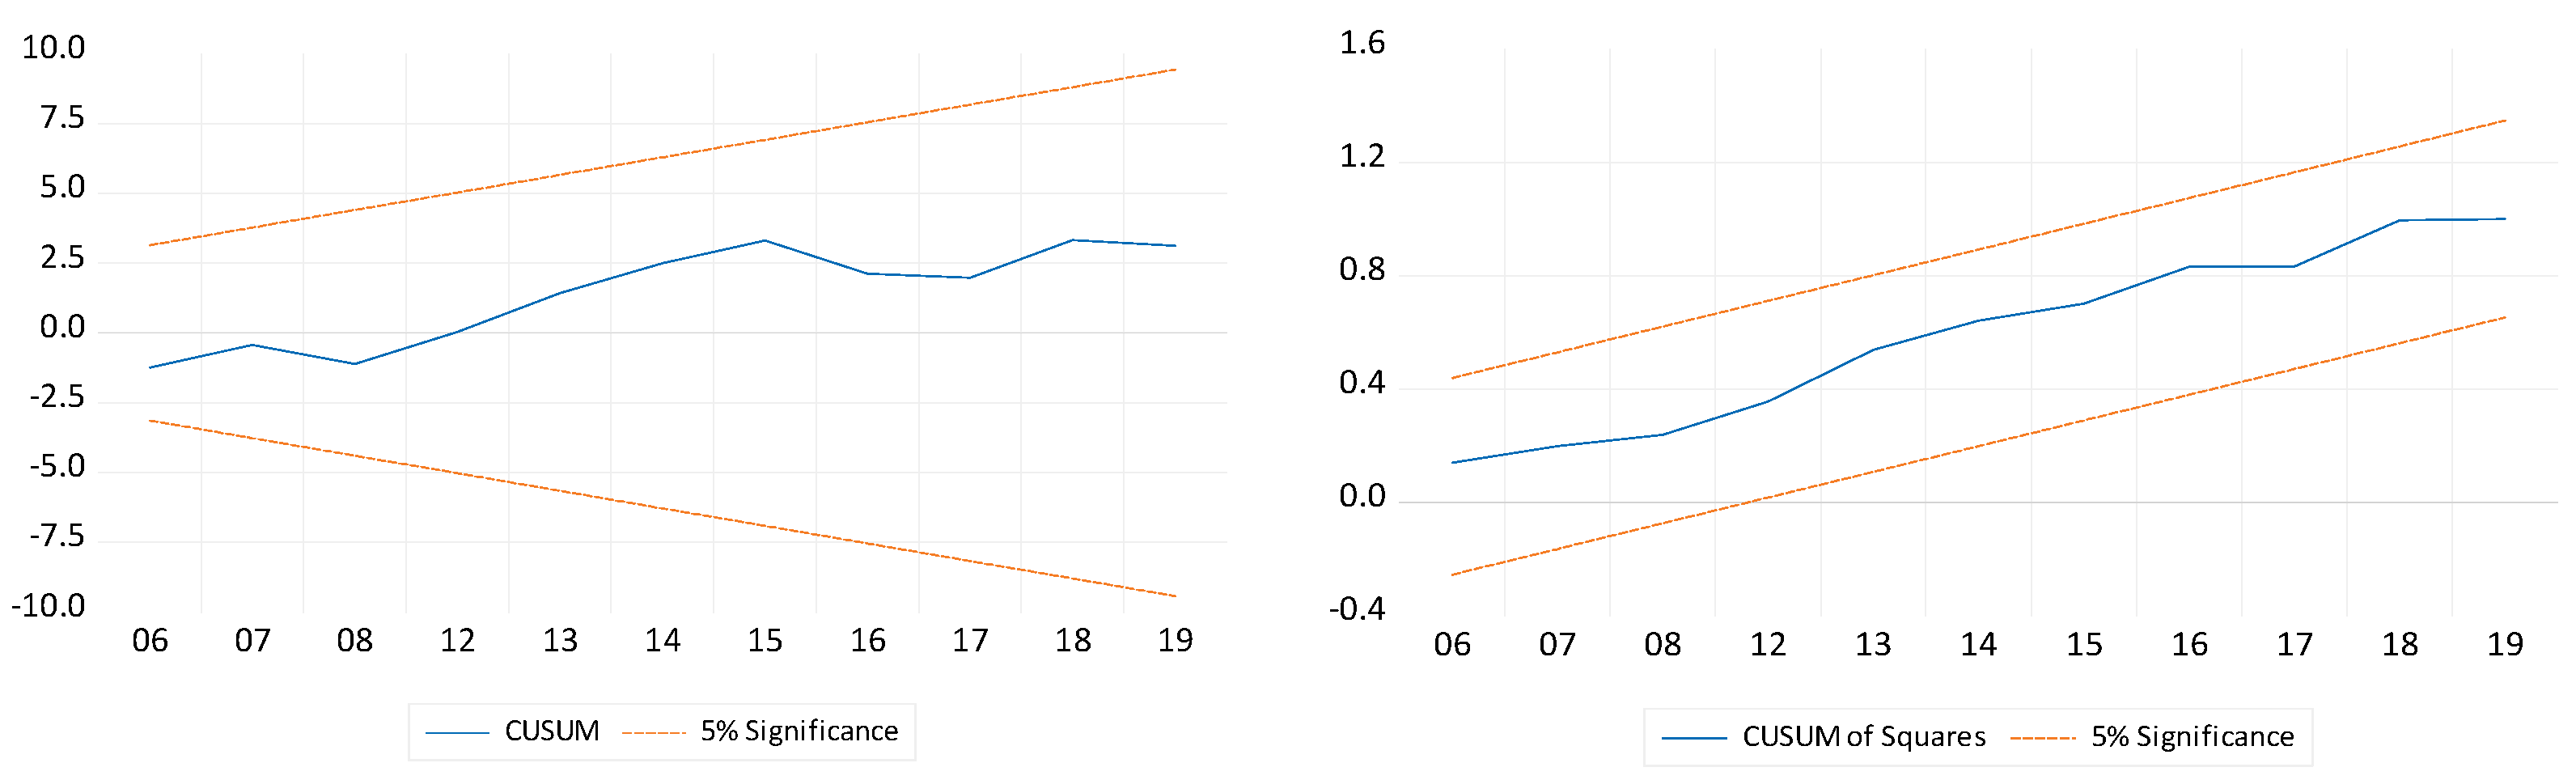
Table 6) affirm that the tested empirical models are stable and free from autocorrelation. Additionally, the CUSUM and CUSUMsq tests (Figure 3, Figure 4 and Figure 5) indicated that the tested empirical model is statistically stable.
The findings of the ARDL test are displayed in Table 7 The findings from models I, II, and III show a positive association between economic growth and LCF. The findings clearly demonstrate that an increase in GDP positively improved the environmental sustainability in Brazil over the tested period. A 1 percent improvement in economic growth in Brazil led to an upsurge in LCF by 0.238–0.418% in the short term and 0.465–0.720% in the long term. The outcomes from the robust models of    F M O L S  and  C C R  are displayed in Table 8 and Table 9. The outcomes of these tests show a positive association between EG and LCF. A one percent increase in economic expansion increases REC by 0.071–0.631%. These outcomes support the findings of the ARDL method.
In contrast, the outcomes from models I and III illustrate a positive and significant interconnection between REC and LCF. An increase in REC by 1% promotes the LCF by 0.451–0.578% in the short term and by 0.038–0.140% in the long term. These findings affirm that REC use has a positive role in enhancing ecological sustainability. Additionally, the study shows that NRR positively impacts LCF. According to the findings, a one percent improvement in the NRR promotes ecological sustainability in the country by 0.059–0.070% in the short term and 0.114–0.135% in the long term. The robustness findings from FMOLS and CCR also affirm the relations among REC, neutral resources, and LCF.
On the other hand, the outcomes of the tested models (I, II, and III) show that a significant increase in the FDI negatively influences LCF. The findings illustrated that a one percent increase reduced ecological quality by 0.023–0.036% in the short term and by 0.053–0.062% in the long term. In addition, the outcomes from the ARDL approach in models I, II, and III confirm the significant link between external debt and LCF in Brazil. An increase in the level of external debt by 1% leads to a decrease in the level of REC by 0.055–0.112% in the short term and by 0.124–0.194% in the long term.
However, the FMOLS and CCR outcomes reveal negative and significant links among FDI, external debt, and LCF. These findings present empirical evidence showing that an increase in external debt adversely affects environmental sustainability. According to these results, a one percent increase in FDI led to a decrease in the LCF by 0.006–0.025% and a one percent increase in the external debt led to a reduction in the LCF by 0.044–0.142%. 
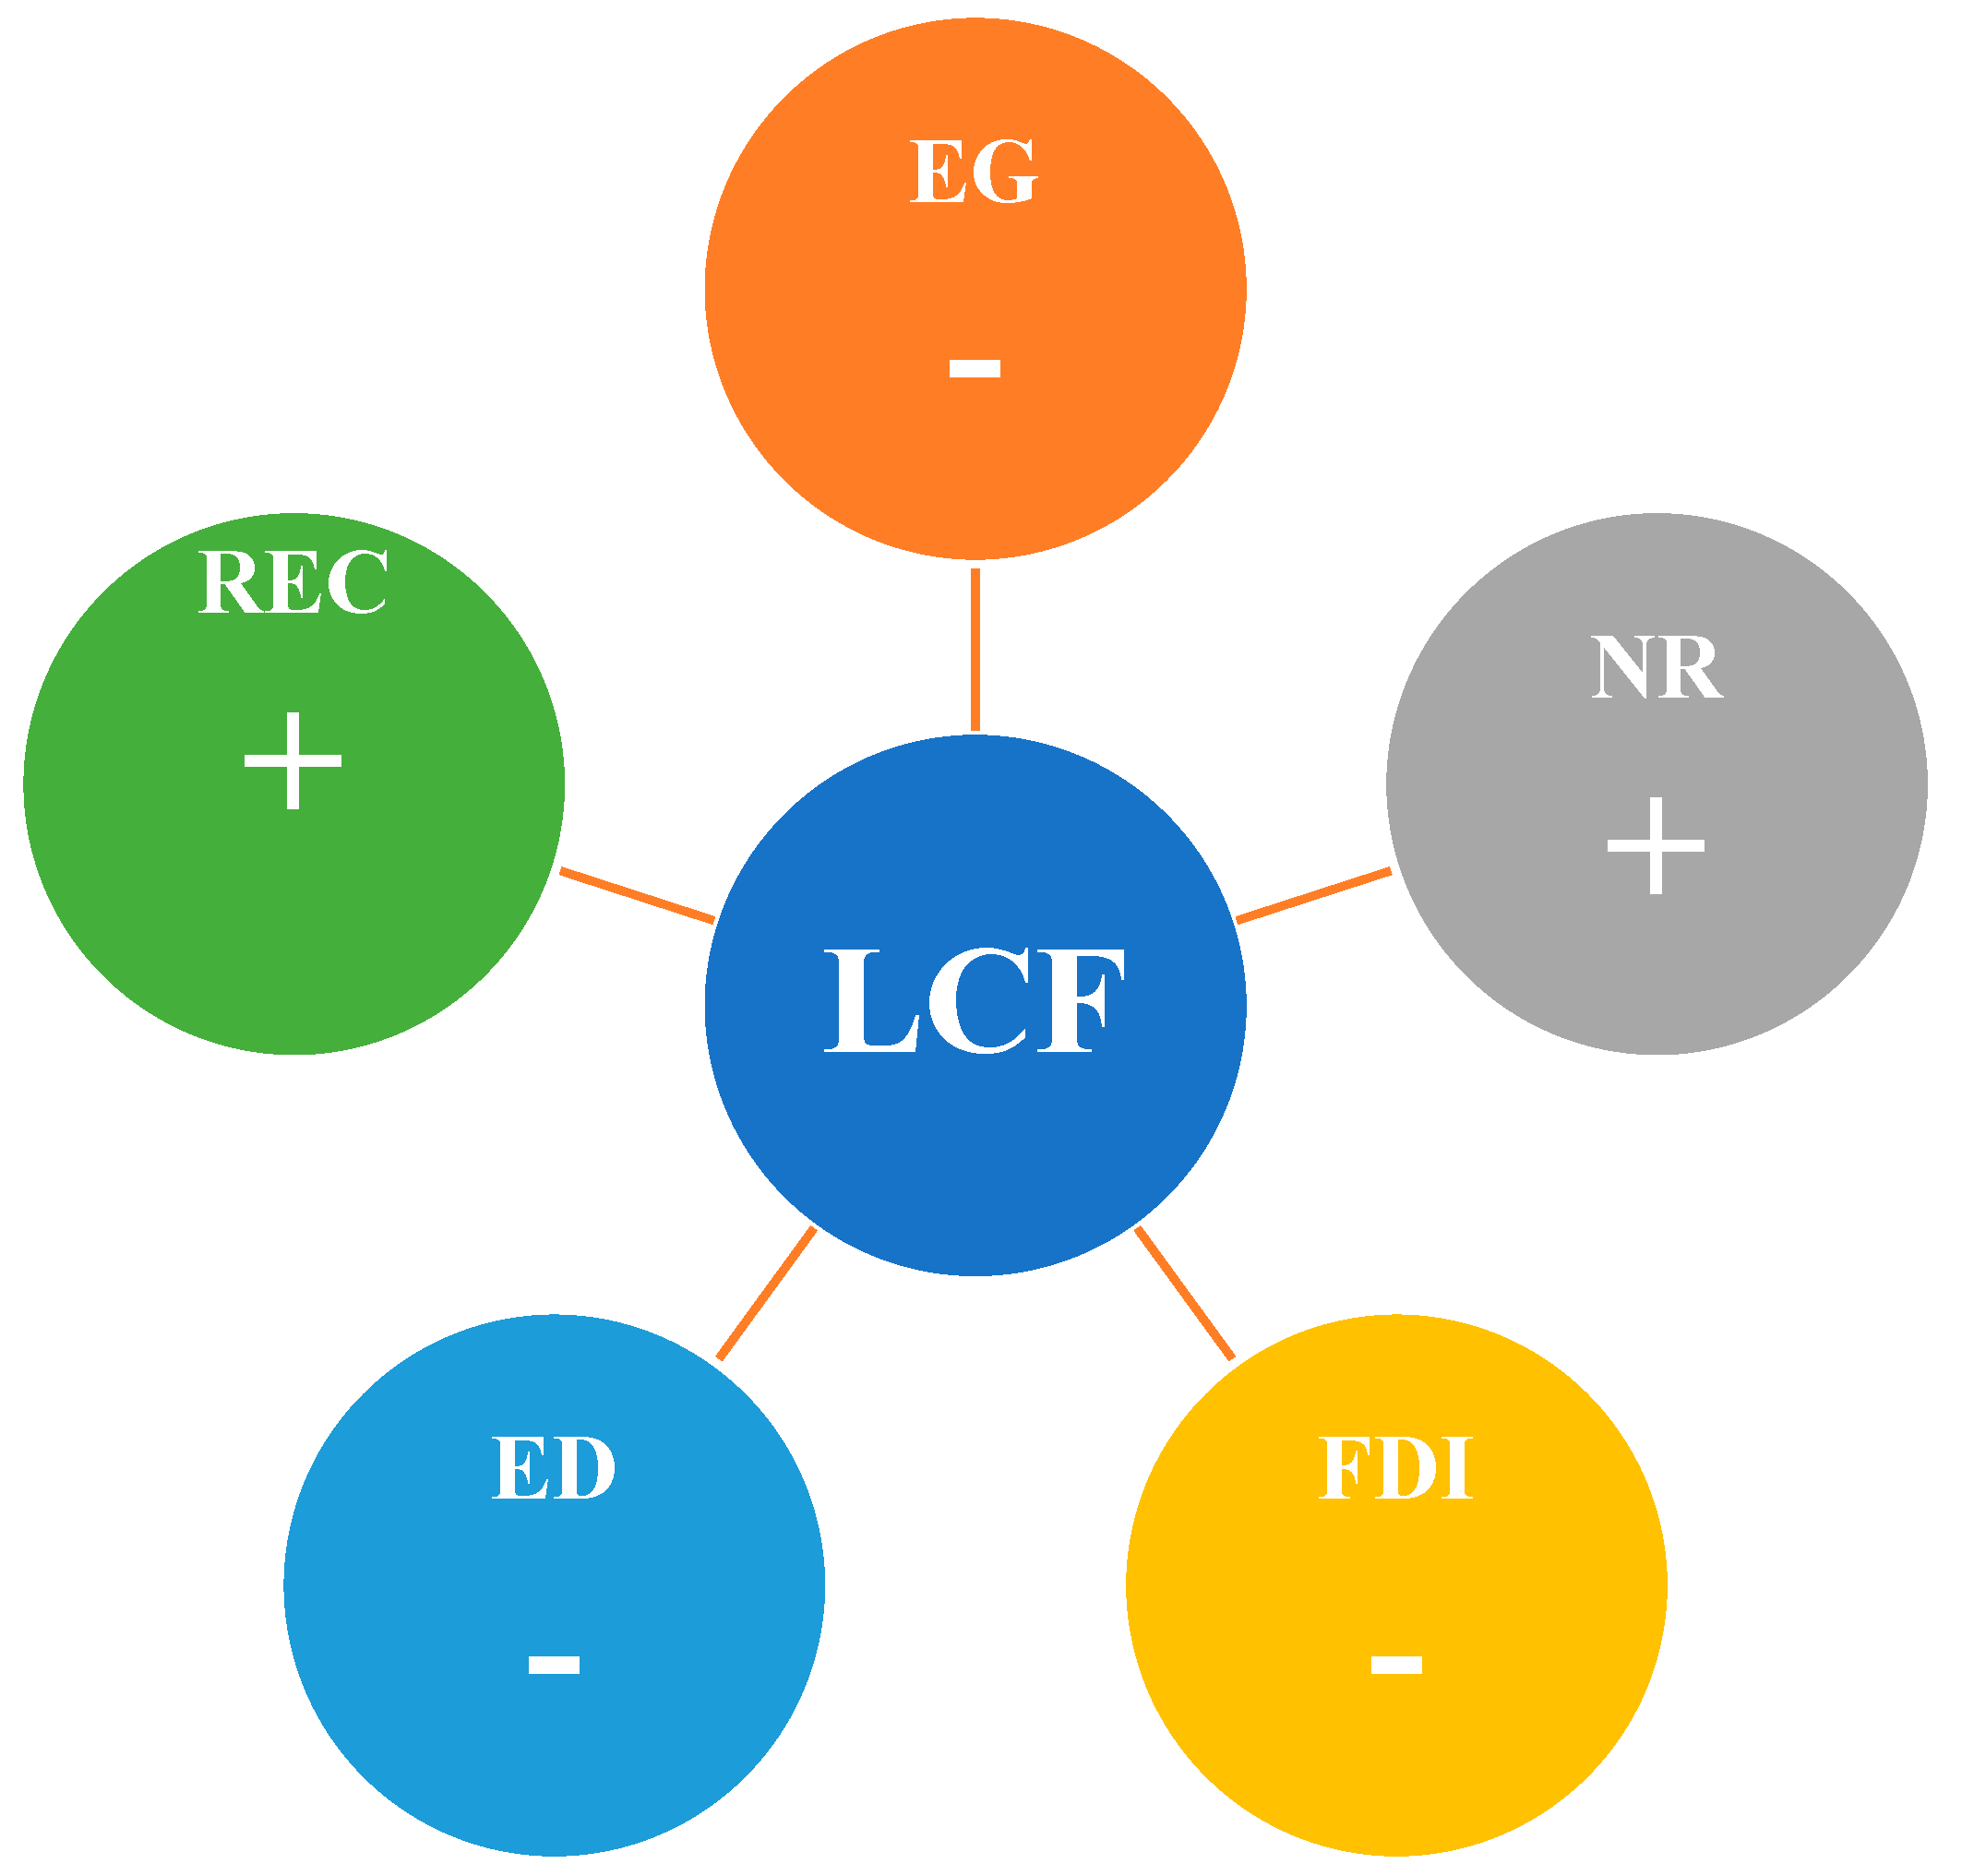
Figure 6 shows the summary of the study findings.

5. Discussion

This section presents a discussion of the findings on the interrelationships among EG, REC, NR, FDI, ED, and LCF in the case of Brazil utilizing datasets from 1970 to 2021. The present work utilized an advanced AARDL approach to assess the correlation among the focused variables. The findings illustrated that economic growth and FDI negatively affected the level of environmental sustainability by decreasing the LCF. Significant economic development results from a rise in supply and thorough energy use. This suggests that economic development policies in Brazil are not linked with the goal of ecological sustainability. However, this outcome is explained by the fact that the GDP in Brazil has increased significantly in recent decades from USD 17 billion in 1960 to USD 1.60 trillion in 2020. Additionally, these findings could be attributed to the fact that most of the foreign investment in this country is used to promote fossil fuel consumption. The paper findings affirm that the PHV hypothesis is valid in the case of Brazil, implying that an increase in FDI will lead to an increase in ecological pollution in the country by mitigating the level of LCF. These findings are in line with Adebayo and Samour [50], who assessed the connection between economic growth and LCF in the case of Brazil. The findings show that economic growth mitigates environmental sustainability while the REC promotes it. Furthermore, Doytch (2020) [51] assessed the impact of FDI on the EF in selected developing and developed economies. The authors suggested that FDI increases the EF in the tested countries and affirmed that the PHV hypothesis is valid in those countries. The findings affirm the absence of stringent environmental regulations and rules in Brazil. Hence, these findings show that the country failed to use FDI growth to promote environmental quality. The government of Brazil needs to design new policies to promote ecological quality using the economic and financial development channels.
Conversely, the findings showed that NR, REC, and LCF have a strong positive correlation over the tested period. Thus, an increase in REC positively affected the level of environmental sustainability. These findings align with Samour et al. (2023) [52] who evaluated the impact of REC on EF in the case of the BRICS economies and suggested that REC positively contributes to ecological sustainability.
Additionally, the findings showed that NR and LCF have a strong positive correlation. Thus, an expansion in natural resources utilization boosts ecological sustainability in Brazil by promoting energy-efficient and environment-friendly technologies. These outcomes align with Zhao et al. (2023) [53], who suggested that NRR has a positive effect on ecological sustainability in the case of Brazil. In contrast, the findings are not line with Li et al. (2023) [54] who used the CS-ARDL approach and found that an increase in NRR has a negative impact on LCF in the case of the BRICS countries. This finding could be attributed to the fact that Brazil is a country with an abundance of natural resources such as minerals, water, agriculture, energy, and biodiversity. Moreover, the country has the largest installed hydropower capacity, controlling around 7% of the world’s freshwater supplies. Hydropower sources primarily generate electricity in the country, accounting for around 68% of its total electricity generation in 2023. Furthermore, the country has the greatest installed wind power capacity in the Latin America region and the world’s best conditions for using this energy sources. The findings of this study suggest that the country carefully managed these sources through sustainable practices to support their long-term viability and environmental protection.
On the other hand, the outcomes demonstrate that external debt negatively affects the environmental quality in the country by decreasing the level of the LCF. These outcomes align with Bese [14] who assessed the external debt and carbon emissions in the case of China and suggested that an increase in the external debt led to decreased ecological sustainability in the tested country. However, the results are not in line with (Sadiq et al. 2022) [13], who found that external debt promoted ecological sustainability in the tested countries from 1990 to 2019. Unlike these studies, the current study presents the first empirical evidence on the linkage between external debt and LCF as a new indicator to capture ecological quality. The study outcomes may be attributed to the fact that Brazil’s external debt rose significantly over the last five decades, from USD 494.63 billion in 1970 to USD 4251 billion in 2020. However, this paper suggests that the significant increase in external debt in Brazil was used to finance non-green consumption and investment. Subsequently, this adversely affected the country’s environmental sustainability; this suggests that policymakers in Brazil must use external finance to support green energy projects to achieve environmental sustainability.

6. Conclusions and Policy Recommendations

6.1. Conclusions

Brazil is one of the most advanced countries in Latin America with respect to the development of the renewable energy sector. Despite this fact, oil and natural gas are still the country’s primary sources of energy, meeting more than 50% of energy consumption. On the other hand, the country has faced a significant increase in ecological emissions over the last six decades, while economic growth and external debt have rapidly risen during the same period. Thus, environmental sustainability is still the main challenge in the country. The main objective of this study was to assess the impact of external debt, FDI, economic growth, REC, and NRR on the LCF. To the best of the authors’ knowledge, no empirical work has assessed the link between external debt and LCF. Consequently, the present study is the first work that aims to explore this link using the augmented ARDL technique.
The findings from the ARDL approach show that GDP negatively influence ecological sustainability in Brazil by decreasing the LCF. Additionally, the findings show that FDI negatively influence LCF in the country, whereas REC positively influences LCF. Furthermore, the findings show that NRR increases the level of LCF. These findings confirm that REC and NRR positively influence environmental sustainability in the country. The country has faced a significant increase in the level of ecological emissions over the last six decades, while economic growth has rapidly increased during the same period. Conversely, the outcomes of this paper show that an increase in external debt has an adverse influence on environmental sustainability by promoting LCF. Unlike the previous empirical studies, the current work presents the first empirical evidence on the linkage between external debt and LCF as a new indicator to capture ecological quality. The findings of this study affirm that external debt has a negative influence on the ecological sustainability of the country. The external debt in Brazil increased to USD 4251 billion by the end of 2020, its highest level since 1970. The country failed to use this debt to finance green energy investment and production. Thus, it is highly important that policymakers in Brazil utilize the borrowed funds for green investment to achieve ecological sustainability.

6.2. Implications

The study presents three valuable findings and recommendations to policymakers in Brazil. First, the study shows that economic growth and FDI negatively influence the LCF. These findings suggest that the country failed to use economic growth and FDI to achieve environmental sustainability. Therefore, the country must design new policies to promote environmental policies to maintain the environment in the country. Second, the findings demonstrate that REC and NRR have a positive role in Brazil’s ecological sustainability by increasing the level of LCF. The study suggests that policymakers in Brazil should encourage research and development into low-pollution technologies. Additionally, they must use more financial incentives such as low taxes or interest rates on green energy investments. Furthermore, the country must carefully manage natural resources through sustainable practices to support their long-term viability and environmental protection. Hence, policymakers must use more new green policies to promote ecological quality using green technologies and investment. With the possible benefits of external debt on the economic development in Brazil, policymakers must use more policies to sustain the external debt. In this context, the study recommends that policymakers should design new green external policies to promote ecological quality by promoting green technologies and investment policymakers must guarantee that external debts are used to finance green energy and cleaner production. These policies would decrease the problems associated with investing in green technologies that benefit future generations and mitigate the ecological population effects.

6.3. Limitations and Future Work

This study aims to contribute to the extant literature by evaluating the effect of external debt on the LCF, specifically for Brazil. The prime study limitation is that we used data covering the period 1970 to 2021 due to the data availability of some of the tested variables. In addition, we employed the AARDL method to study the connection between the selected variables. However, future papers may use other techniques, such as nonlinear approaches, to assess the effect of external debt on the LCF.

Author Contributions

Methodology, A.S.; Software, A.S.; Formal analysis, A.S.; Writing—original draft, S.H.S.; Writing—review & editing, D.H.A. All authors have read and agreed to the published version of the manuscript.

Funding

This research received no external funding.

Institutional Review Board Statement

Not applicable.

Informed Consent Statement

Not applicable.

Data Availability Statement

The data presented in this study are openly available in Footprint Net-work 2023, World-Bank, and Our World in Data websites.

Conflicts of Interest

The authors declare no conflict of interest.

References

  1. Alam, N.; Hashmi, N.I.; Jamil, S.A.; Murshed, M.; Mahmood, H.; Alam, S. The marginal effects of economic growth, financial development, and low-carbon energy use on carbon footprints in Oman: Fresh evidence from autoregressive distributed lag model analysis. Environ. Sci. Pollut. Res. 2022, 29, 76432–76445. [Google Scholar] [CrossRef] [PubMed]
  2. Wada, I.; Faizulayev, A.; Victor Bekun, F. Exploring the role of conventional energy consumption on environmental quality in Brazil: Evidence from cointegration and conditional causality. Gondwana Res. 2021, 98, 244–256. [Google Scholar] [CrossRef]
  3. Lee, C.-C.; He, Z.-W. Natural resources and green economic growth: An analysis based on heterogeneous growth paths. Resour. Policy 2022, 79, 103006. [Google Scholar] [CrossRef]
  4. Arogundade, S.; Mduduzi, B.; Hassan, A.S. Spatial impact of foreign direct investment on ecological footprint in Africa. Environ. Sci. Pollut. Res. 2022, 29, 51589–51608. [Google Scholar] [CrossRef]
  5. Shah, M.I.; AbdulKareem, H.K.K.; Khan, Z.; Abbas, S. Examining the agriculture induced Environmental Kuznets Curve hypothesis in BRICS economies: The role of renewable energy as a moderator. Renew. Energy 2022, 198, 343–351. [Google Scholar] [CrossRef]
  6. Charfeddine, L.; Mrabet, Z. The impact of economic development and social-political factors on ecological footprint: A panel data analysis for 15 MENA countries. Renew. Sustain. Energy Rev. 2017, 76, 138–154. [Google Scholar] [CrossRef]
  7. Zafar, M.W.; Zaidi, S.A.H.; Khan, N.R.; Mirza, F.M.; Hou, F.; Kirmani, S.A.A. The impact of natural resources, human capital, and foreign direct investment on the ecological footprint: The case of the United States. Resour. Policy 2019, 63, 101428. [Google Scholar] [CrossRef]
  8. Ahmed, Z.; Zhang, B.; Cary, M. Linking economic globalization, economic growth, financial development, and ecological footprint: Evidence from symmetric and asymmetric ARDL. Ecol. Indic. 2021, 121, 107060. [Google Scholar] [CrossRef]
  9. Zaghdoudi, T. Threshold Effect in the Relationship Between External Debt and Economic Growth: A Dynamic Panel Threshold Specification. J. Quant. Econ. 2020, 18, 447–456. [Google Scholar] [CrossRef]
  10. Makun, K. External debt and economic growth in Pacific Island countries: A linear and nonlinear analysis of Fiji Islands. J. Econ. Asymmetries 2021, 23, e00197. [Google Scholar] [CrossRef]
  11. Mohsin, M.; Ullah, H.; Iqbal, N.; Iqbal, W.; Taghizadeh-Hesary, F. How external debt led to economic growth in South Asia: A policy perspective analysis from quantile regression. Econ. Anal. Policy 2021, 72, 423–437. [Google Scholar] [CrossRef]
  12. Katircioglu, S.; Celebi, A. Testing the role of external debt in environmental degradation: Empirical evidence from Turkey. Environ. Sci. Pollut. Res. 2018, 25, 8843–8852. [Google Scholar] [CrossRef]
  13. Sadiq, M.; Shinwari, R.; Usman, M.; Ozturk, I.; Maghyereh, A.I. Linking nuclear energy, human development and carbon emission in BRICS region: Do external debt and financial globalization protect the environment? Nucl. Eng. Technol. 2022, 54, 3299–3309. [Google Scholar] [CrossRef]
  14. Bese, E.; Friday, H.S.; Özden, C. The Effect of External Debt on Emissions: Evidence from China. IJEEP 2020, 11, 440–447. [Google Scholar] [CrossRef]
  15. Farooq, F.; Zaib, A.; Faheem, M.; Gardezi, M.A. Public debt and environment degradation in OIC countries: The moderating role of institutional quality. Environ. Sci. Pollut. Res. 2023, 30, 55354–55371. [Google Scholar] [CrossRef]
  16. Akam, D.; Owolabi, O.; Nathaniel, S.P. Linking external debt and renewable energy to environmental sustainability in heavily indebted poor countries: New insights from advanced panel estimators. Environ. Sci. Pollut. Res. 2021, 28, 65300–65312. [Google Scholar] [CrossRef]
  17. Kartal, M.T.; Samour, A.; Adebayo, T.S.; Depren, S.K. Do nuclear energy and renewable energy surge environmental quality in the United States? New insights from novel bootstrap Fourier Granger causality in quantiles approach. Progress. Nucl. Energy 2023, 155, 104509. [Google Scholar] [CrossRef]
  18. Pata, U.K.; Samour, A. Do renewable and nuclear energy enhance environmental quality in France? A new EKC approach with the load capacity factor. Progress. Nucl. Energy 2022, 149, 104249. [Google Scholar] [CrossRef]
  19. Pata, U.K.; Wang, Q.; Kartal, M.T.; Sharif, A. The role of disaggregated renewable energy consumption on income and load capacity factor: A novel inclusive sustainable growth approach. Geosci. Front. 2024, 15, 101693. [Google Scholar] [CrossRef]
  20. Abdulmagid Basheer Agila, T.; Khalifa, W.M.S.; Saint Akadiri, S.; Adebayo, T.S.; Altuntaş, M. Determinants of load capacity factor in South Korea: Does structural change matter? Environ. Sci. Pollut. Res. 2022, 29, 69932–69948. [Google Scholar] [CrossRef] [PubMed]
  21. Siche, R.; Pereira, L.; Agostinho, F.; Ortega, E. Convergence of ecological footprint and emergy analysis as a sustainability indicator of countries: Peru as case study. Commun. Nonlinear Sci. Numer. Simul. 2010, 15, 3182–3192. [Google Scholar] [CrossRef]
  22. Sam, C.Y.; McNown, R.; Goh, S.K. An augmented autoregressive distributed lag bounds test for cointegration. Econ. Model. 2019, 80, 130–141. [Google Scholar] [CrossRef]
  23. Shen, Y.; Su, Z.-W.; Malik, M.Y.; Umar, M.; Khan, Z.; Khan, M. Does green investment, financial development and natural resources rent limit carbon emissions? A provincial panel analysis of China. Sci. Total Environ. 2021, 755, 142538. [Google Scholar] [CrossRef] [PubMed]
  24. Wei, S.; Wei, W.; Umut, A. Do renewable energy consumption, technological innovation, and international integration enhance environmental sustainability in Brazil? Renew. Energy 2023, 202, 172–183. [Google Scholar] [CrossRef]
  25. Byaro, M.; Dimoso, P.; Rwezaula, A. Are Clean Energy Technologies a Panacea for Environmental Sustainability in Sub-Saharan African Countries? Available online: https://www.researchsquare.com (accessed on 13 January 2024).
  26. Xiaoman, W.; Majeed, A.; Vasbieva, D.G.; Yameogo, C.E.W.; Hussain, N. Natural resources abundance, economic globalization, and carbon emissions: Advancing sustainable development agenda. Sustain. Dev. 2021, 29, 1037–1048. [Google Scholar] [CrossRef]
  27. Kongbuamai, N.; Bui, Q.; Yousaf, H.M.; Liu, Y. The impact of tourism and natural resources on the ecological footprint: A case study of ASEAN countries. Environ. Sci. Pollut. Res. 2020, 27, 19251–19264. [Google Scholar] [CrossRef] [PubMed]
  28. Ahmad, M.; Jiang, P.; Majeed, A.; Umar, M.; Khan, Z.; Muhammad, S. The dynamic impact of natural resources, technological innovations and economic growth on ecological footprint: An advanced panel data estimation. Resour. Policy 2020, 69, 101817. [Google Scholar] [CrossRef]
  29. Sun, Y.; Usman, M.; Radulescu, M.; Korkut Pata, U.; Balsalobre-Lorente, D. New insights from the STIPART model on how environmental-related technologies, natural resources and the use of the renewable energy influence load capacity factor. Gondwana Res. 2023; in press. [Google Scholar] [CrossRef]
  30. Jin, X.; Ahmed, Z.; Pata, U.K.; Kartal, M.T.; Erdogan, S. Do investments in green energy, energy efficiency, and nuclear energy R&D improve the load capacity factor? An augmented ARDL approach. Geosci. Front. 2023; in press. [Google Scholar] [CrossRef]
  31. Li, X.; Sun, Y.; Dai, J.; Mehmood, U. How do natural resources and economic growth impact load capacity factor in selected Next-11 countries? Assessing the role of digitalization and government stability. Environ. Sci. Pollut. Res. 2023, 30, 85670–85684. [Google Scholar] [CrossRef]
  32. Walter, I.; Ugelow, J.L. Environmental Policies in Developing Countries. Ambio 1979, 8, 102–109. [Google Scholar]
  33. Baumol, W.J.; Oates, W.E. The Theory of Environmental Policy; Cambridge University Press: Cambridge, UK, 1988. [Google Scholar]
  34. Nathaniel, S.; Aguegboh, E.; Iheonu, C.; Sharma, G.; Shah, M. Energy consumption, FDI, and urbanization linkage in coastal Mediterranean countries: Re-assessing the pollution haven hypothesis. Environ. Sci. Pollut. Res. 2020, 27, 35474–35487. [Google Scholar] [CrossRef] [PubMed]
  35. Doytch, N. The impact of foreign direct investment on the ecological footprints of nations. Environ. Sustain. Indic. 2020, 8, 100085. [Google Scholar] [CrossRef]
  36. Sabir, S.; Gorus, M.S. The impact of globalization on ecological footprint: Empirical evidence from the South Asian countries. Environ. Sci. Pollut. Res. 2019, 26, 33387–33398. [Google Scholar] [CrossRef] [PubMed]
  37. Wei, G.; Bi, M.; Liu, X.; Zhang, Z.; He, B.J. Investigating the impact of multi-dimensional urbanization and FDI on carbon emissions in the belt and road initiative region: Direct and spillover effects. J. Clean. Prod. 2023, 384, 135608. [Google Scholar] [CrossRef]
  38. Yi, J.; Hou, Y.; Zhang, Z.Z. The impact of foreign direct investment (FDI) on China’s manufacturing carbon emissions. Innov. Green. Dev. 2023, 2, 100086. [Google Scholar] [CrossRef]
  39. Perron, P.; Vogelsang, T.J. Nonstationarity and level shifts with an application to purchasing power parity. J. Bus. Econ. Stat. 1992, 10, 301–320. [Google Scholar]
  40. Pesaran, M.H.; Shin, Y.; Smith, R.J. Bounds testing approaches to the analysis of level relationships. J. Appl. Econom. 2001, 16, 289–326. [Google Scholar] [CrossRef]
  41. McNown, R.; Sam, C.Y.; Goh, S.K. Bootstrapping the autoregressive distributed lag test for cointegration. Appl. Econ. 2018, 50, 1509–1521. [Google Scholar] [CrossRef]
  42. Narayan, P.K. The saving and investment nexus for China: Evidence from cointegration tests. Appl. Econ. 2005, 37, 1979–1990. [Google Scholar] [CrossRef]
  43. Bayer, C.; Hanck, C. Combining non-cointegration tests. J. Time Ser. Anal. 2013, 34, 83–95. [Google Scholar] [CrossRef]
  44. Engle, R.F.; Granger, C.W.J. Co-Integration and Error Correction: Representation, Estimation, and Testing. Econometrica 1987, 55, 251–276. [Google Scholar] [CrossRef]
  45. Johansen, S. Statistical analysis of cointegration vectors. J. Econ. Dyn. Control 1988, 12, 231–254. [Google Scholar] [CrossRef]
  46. Peter Boswijk, H. Testing for an unstable root in conditional and structural error correction models. J. Econom. 1994, 63, 37–60. [Google Scholar] [CrossRef]
  47. Banerjee, A.; Dolado, J.; Mestre, R. Error-correction Mechanism Tests for Cointegration in a Single-equation Framework. J. Time Ser. Anal. 1998, 19, 267–283. [Google Scholar] [CrossRef]
  48. Phillips, P.C.B.; Hansen, B.E. Statistical Inference in Instrumental Variables Regression with I(1) Processes. Rev. Econ. Stud. 1990, 57, 99–125. [Google Scholar] [CrossRef]
  49. Park, J.Y. Canonical Cointegrating Regressions. Econometrica 1992, 60, 119–143. [Google Scholar] [CrossRef]
  50. Adebayo, T.S.; Samour, A. Renewable energy, fiscal policy and load capacity factor in BRICS countries: Novel findings from panel nonlinear ARDL model. Environ. Dev. Sustain. 2023, 1–25. [Google Scholar] [CrossRef]
  51. Doytch, N. Upgrading destruction? How do climate-related and geophysical natural disasters impact sectoral FDI. Int. J. Clim. Change Strateg. Manag. 2020, 12, 182–200. [Google Scholar] [CrossRef]
  52. Samour, A.; Adebayo, T.S.; Agyekum, E.B.; Khan, B.; Kamel, S. Insights from BRICS-T economies on the impact of human capital and renewable electricity consumption on environmental quality. Sci. Rep. 2023, 13, 5245. [Google Scholar] [CrossRef]
  53. Zhao, W.X.; Samour, A.; Yi, K.; Al-Faryan, M.A. Do technological innovation, natural resources and stock market development promote environmental sustainability? Novel evidence based on the load capacity factor. Resour. Policy 2023, 82, 103397. [Google Scholar] [CrossRef]
  54. Li, S.; Samour, A.; Irfan, M.; Ali, M. Role of renewable energy and fiscal policy on trade adjusted carbon emissions: Evaluating the role of environmental policy stringency. Renew. Energy 2023, 205, 156–165. [Google Scholar] [CrossRef]
Figure 1. The LCF in the USA over the tested period.
Sustainability 16 01037 g001
Figure 2. The selected variables in plots.
Sustainability 16 01037 g002
Figure 3. Cusum and Cusum Squares model I.
Sustainability 16 01037 g003
Figure 4. Cusum and Cusum Squares model II.
Sustainability 16 01037 g004
Figure 5. Cusum and Cusum Squares model III.
Sustainability 16 01037 g005
Figure 6. The summary of the study findings.
Sustainability 16 01037 g006
Table 1. Description of the selected variables.
SignVariableMeasurementSource
  L C F Load capacity factorThe proxy was obtained from the division biocapacity (per capita) and EF (global hectares per capita)Footprint Network—2023
  E G Economic growthGDP per capita (constant 2015 USD)World Bank—2023
  R E C Renewable energy consumptionConsumption of renewable energy per capitaOur World in Data—2023
NRRNatural resourcesPer capita (constant 2015 USD)World Bank—2023
FDIForeign direct investmentFDI net inflows as a percentage of the country’s GDPOur World in Data—2023
EDExternal debtExternal debt stock as a percentage of the country’s GDPWorld Bank—2023
Table 2. Findings of descriptive statistics.
LCFEGRECNRFDED
Mean1.4428.7921.4840.833−1.790−1.325
Median1.4158.7831.6180.848−1.976−1.301
Maximum2.0729.1492.2761.5590.955−0.694
Minimum1.0588.1770.223−0.052−6.191−1.956
Std. Dev.0.2760.2230.4930.4091.3980.340
Table 3. PV and ADF test findings.
V a r i a b l e s  at Level   P V   A D F
  T e s t S t a t i s t i c s   D S B   T e s t S t a t i s t i c s
LCF−3.5451993−3.333
EG−3.6431980−2.742
REC−2.7652016−2.721
NR−3.9151998−2.148
FDI−1.6461997−1.573
ED−3.9242006−1.456
First difference
LCF−6.291 ***1979−5.379 ***
EG−5.643 ***1980−4.742 ***
REC−5.727 ***2020−4.130 ***
NR−8.666 ***1996−8.287 ***
FDI−14.419 ***2012−13.308 ***
ED−6.101 ***2005−5.233 ***
*** implies the significance of the selected variables at 1 percent. “D-SB” denotes the structural-break dates.
Table 4. The findings of A-ARDL approach.
Test Stat
  F   O v e r a l l t   D e p e n d e n t   F   I n d e p e n d e n t
Model I5.403−4.8915.391
CV1%5%10%
Statistics   I ( 0 )   I ( 1 )   I ( 0 )   I ( 1 )   I ( 0 )   I ( 1 ) Reference
  F o v e r a l l 3.414.682.623.792.263.35Narayan (2005) [42]
  T d e p e n d e n t −3.43−4.79−2.86−4.19−2.57−3.86Pesarsan (2001) [40]
  F i n d e p e n d e n t 3.055.022.243.901.863.39Sam et al. (2019) [22]
Model II4.912−3.9314.875
CV1%5%10%
Statistics   I ( 0 )   I ( 1 )   I ( 0 )   I ( 1 )   I ( 0 )   I ( 1 ) Reference
  F o v e r a l l 3.745.062.864.012.453.52Narayan (2005) [42]
  T d e p e n d e n t −3.43−4.60−2.86−3.90−2.57−3.66Pesaran (2001) [40]
  F i n d e p e n d e n t 3.585.022.394.181.963.58Sam et al. (2019) [22]
Model III 8.828 −4.834 10.465
CV1%5%10%
Statistics   I ( 0 )   I ( 1 )   I ( 0 )   I ( 1 )   I ( 0 )   I ( 1 ) Reference
  F o v e r a l l 3.414.682.623.792.263.35Narayan (2005) [42]
  T d e p e n d e n t −3.43−4.79−2.86−4.19−2.57−3.86Peseran (2001) [40]
  F i n d e p e n d e n t 3.055.022.243.901.863.39Sam et al. (2019) [22]
Table 5. The findings of the Bayer and Hanck test.
Fisher F-Statistic
MODEL IEG-JEG-J-Ba-Bo
55.264114.610
CV at 5%10.41919.888
MODEL IIEG-JEG-J-Ba-Bo
18.42835.215
CV at 5%10.57620.143
MODEL IIIEG-JEG-J-Ba-Bo
55.322106.808
CV at 5%10.41919.888
Table 6. Diagnostic tests.
Test/ModelsModel IIModel II (PV)Model II (PV)
Heteroskedasticity assessment (White test)0.977 (0.48)1.228 (0.31)0.957 (0.53)
(Breusch–Godfrey assessment)1.629 (0.20)0.003 (0.94)0.058 (0.81)
Normality assessment0.659 (0.34)1.086 (0.58)0.736 (0.69)
Ramsey Reset assessment2.112 (0.05)0.564 (0.57)0.887 (0.39)
Table 7. Outcomes of the ARDL test.
TestsModel IModel IIModel III
  V a r i a b l e s Coefficient   T   s t a t PVCoefficient   T   s t a t PVCoefficient   T   s t a t PV
Short run
EG−0.267 **−2.2120.03−0.238 **−2.1430.03−0.418 **−2.3800.03
REC0.451 **2.5230.020.578 ***3.7180.00
NR0.065 ***3.7040.000.059 ***3.4490.000.070 ***3.8810.00
FDI−0.033 ***−4.1030.00−0.023 ***−3.1630.00−0.036 ***−4.1050.00
ED−0.093 **−2.2330.03−0.055 **−2.3390.02−0.112 *−2.1840.05
Long run
EG−0.465 ***−11.190.00−0.539 **−2.6620.01−0.720 ***−16.620.00
REC 0.038 * 1.761 0.08 0.140 *2.0210.07
NR0.114 ***28.4110.000.135 ***3.9340.000.121 ***14.6010.00
FDI−0.057 ***−16.5210.00−0.053 ***−3.0410.00−0.062 ***−16.5230.00
ED−0.162 ***−7.7470.00−0.124 ***−3.3680.00−0.194 ***−7.6030.00
  E C T t 1 −0.575 ***−6.4920.00−0.441 ***−5.8740.00−0.580 ***−10.3120.00
***, ** and * imply the significance of the selected variables at 1, 5, and 10% levels.
Table 8. Outcomes of the FM-OLS test.
TestsModel IModel IIModel III
  V a r i a b l e s Coefficient   T   s t a t PVCoefficient   T   s t a t PVCoefficient   T   s t a t PV
EG−0.628 ***−16.720.00−0.567 ***−6.8640.00−0.333 ***−15.9910.00
REC0.075 *1.7680.080.136 ***6.7570.00
NRR0.058 ***10.190.000.063 ***4.6950.000.044 ***16.0740.00
FDI−0.012 ***−6.0570.00−0.008 *−1.8070.07−0.011 ***−12.5410.00
ED−0.107 ***−8.8370.00−0.138 ***−10.1220.00−0.044 ***−4.0170.00
***and * imply the significance of the selected variables at 1 and 10% levels.
Table 9. Outcomes of CCR test.
TestsModel IModel IIModel III
  V a r i a b l e s Coefficient   T   s t a t PVCoefficient   T   s t a t PVCoefficient   T   s t a t PV
EG−0.631 ***−15.6110.000.0751 *1.7680.08−0.512 ***−10.0260.00
REC0.069 *1.7400.090.277 *1.8500.08
NRR0.058 ***10.3100.000.067 ***7.2310.000.062 ***13.4410.00
FDI−0.012 ***−4.6000.00−0.006 *−1.7220.09−0.025 ***−10.0810.00
ED−0.105 ***−8.1960.00−0.1289 ***−12.300.00−0.142 ***−7.3460.00
*** and * imply the significance of the selected variables at 1, and 10% levels.
Disclaimer/Publisher’s Note: The statements, opinions and data contained in all publications are solely those of the individual author(s) and contributor(s) and not of MDPI and/or the editor(s). MDPI and/or the editor(s) disclaim responsibility for any injury to people or property resulting from any ideas, methods, instructions or products referred to in the content.

