Article

Prioritizing Pathways Based on Satisfaction of Individuals Using Mobility Aids with Urban Road Infrastructure—Application of FSE and PROMETHEE II in Saudi Arabia

Department of Civil Engineering, College of Engineering, Qassim University, Buraydah 51452, Saudi Arabia
*
Authors to whom correspondence should be addressed.
Sustainability 2024, 16(24), 11116; https://doi.org/10.3390/su162411116
Submission received: 14 November 2024 / Revised: 9 December 2024 / Accepted: 16 December 2024 / Published: 18 December 2024
(This article belongs to the Section Sustainable Transportation)

Abstract

:
The convenience of commuting for individuals using mobility aids (IMAs) depends on various features of urban road infrastructure. The present research selected different pathways based on the relevance and convenience of IMAs in three regions of Saudi Arabia, including Riyadh, Qassim, and Hail. A survey questionnaire was developed to evaluate the satisfaction of IMAs with four critical criteria of road infrastructure, including travel distance, slope, availability of footpaths, and number of junctions, using a 5-point Likert scale from very low to very high. A sufficient sample size of this exceptional proportion of the population from different genders, age groups, education levels, employment status, number of disability years, and types of mobility aid participated in the survey. The main reasons for dissatisfaction of more than 50% of the participants were inadequate infrastructure design of entrances to public facilities, pedestrian crossings, and junctions. Social stigma and inadequate assistive technology were also highlighted by around 20% of the participants. The fuzzy synthetic evaluation identified length, slope, and footpaths along the pathway as the most critical features based on the subjective opinion of the participants, of which around 65% have been using artificial limbs or manual wheelchairs. PROMETHEE II aggregated the importance of weights estimated by the participants’ opinion and performance scores of infrastructure features to effectively rank ten pathways in three major cities of the selected regions, using partial and complete outranking. The framework developed in the present study helps concerned organizations to comply with the Vision 2030 goal of a vibrant society in Saudi Arabia by identifying critical pathways and improving infrastructure design to ensure safety, convenience, and satisfaction for IMAs.

1. Introduction

The World Health Organization (WHO) statistics suggest that approximately one billion individuals worldwide experience some form of disability, accounting for almost 15% of the global population [1]. This number is expected to increase drastically in the coming years due to factors such as aging populations, an increase in road traffic accidents, and the spread of chronic diseases. Individuals with mobility aids (IMAs) have the intrinsic right of equity to public facilities and services; therefore, ensuring a user-friendly urban and social environment is essential. A significant proportion of the disabled population in the country (over 1.3 million) faces physical disability-associated challenges, as reported by the General Authority for Statistics (GAS). Among these, mobility impairments account for over 50% of the disabled population [2]. These numbers are expected to increase soon, especially with the prevalence of chronic health conditions, inactivity, and rising traffic accidents. Hence, assessing the specific needs associated with IMAs is crucial for securing accessible pathways for daily activities and public amenities.
Disability remains a significant socioeconomic concern, particularly in developing countries, including the Kingdom of Saudi Arabia [3]. As per recent statistics, over half a million individuals, accounting for 3.3% of the country’s population, are faced with some disability-related issues [4]. The government fully appreciates the situation and established the King Salman Center for Disability Research (KSCDR) in 1991 to facilitate people with disabilities in all aspects and support research on the topic [5]. In 2016, the Rights of Persons with Disabilities Act replaced the previous act of 1995 to ensure the self-respect of this special group of people and equal opportunities with dignity [6]. Vision 2023 of Saudi Arabia also protects the rights of disabled persons by improving the country’s services, care, rehabilitation, and prevention mechanisms. Nevertheless, urban road infrastructure is yet to be evaluated for uninterrupted and convenient mobility.
While commuting for routine journeys, individuals with mobility impairments face numerous obstacles, such as a lack of sidewalks, steep slopes, absence of ramps, and refuge areas at public spaces and pedestrian crossings. Even though IMAs are entitled to free movement and equal access to services, smooth accessibility remains a persistent concern. This situation requires policymakers and urban planners to prioritize accessing essential services/amenities for IMAs. Mobility aid devices such as electric or manual wheelchairs are not designed to cater to uneven surfaces or steep slopes, unlike vehicular navigation. Pathway planning is another critical issue with IMAs’ journeys, which can become quite complex due to constrained urban environments and pathway alternatives [7]. Although some prior research has been undertaken for pedestrian pathway planning, only a few studies have addressed the need for accessibility for IMAs in urban areas.
Traditional methods for pedestrian commuting are often based on consideration of travel time and distance, ignoring the unique challenges associated with wheelchair users. For instance, from the perspective of wheelchair users, longer pathways without barriers may be preferred over shorter pathways with steep slopes and obstacles [8]. Studies have reported that wheelchairs travel longer than regular pedestrians to reach identical destinations. A recent study found that compared with powered wheelchair users or scooter users, manual wheelchair users, on average, travel 35% farther than their counterparts to reach the same destinations [9]. These findings highlight the importance of identifying the specific accessibility barriers for IMAs in urban environments [10]. Improving the accessibility of IMAs could benefit them by providing access to healthcare, social interaction, and employment opportunities [11]. Historically, the transportation planning framework is based on maximizing performance and efficiency [12]; however, contemporary planning involves prioritizing accessibility as a core component of sustainable urban development [13]. Countries worldwide have legislated accessibility laws for IMAs, which mandate public infrastructure accessibility for all. For instance, the 1990 Americans with Disabilities Act (ADA) was proposed to enhance accessibility to public spaces in urban areas [14]. Despite this legislation, municipalities and local governments worldwide struggle to meet the required accessibility standards, leaving IMAs at a potential disadvantage [15]. In this regard, communities frequently face limited data on specific barrier removal, lack of infrastructure [16], and inadequate information about the sidewalks’ accessibility [13].
Travel is essential to daily life, facilitating independence and routine social interactions [17]. The concept of “accessibility” refers to the ease of reaching a destination based on multi-criteria metrics and has been the subject of widespread discussion among urban planners, geographers, and economists [18,19]. Various statistical methods are proposed for evaluating the accessibility within pedestrian networks in urban regions. Accessibility analysis involves identifying and calculating accessibility indicators tailored to the target population, travel modes, and destination types, which may be quantified in terms of cost, distance, or time to form an accessibility index [20,21]. Multi-criteria Decision Analysis (MCDA) has been widely employed for accessibility assessment [22,23], which involves assigning weights to criteria based on relative significance and handling the fuzziness of individual judgments.
A critical review of the extensive literature on urban pathway optimization for disabled users reveals several gaps. First, existing studies have predominantly focused on accessibility optimization for regular pedestrians, ignoring the specific needs and dynamics of disabled users [24,25]. Understanding the travel satisfaction and preferences of IMAs is vital for the planning and designing of disability-inclusive urban infrastructure [26]. Second, traditional pathway optimization methods are aimed at improving performance [27] and reducing travel [28] and often overlook critical indicators such as surface continuity, pathway gradients/slopes, pathway lengths, unction frequency, sidewalks, and crossing characteristics, which can significantly affect the commute, accessibility, and safety of disabled users [12]. Third, the existing model primarily relies on pathway accessibility estimated based on established guidelines and standards [29] and rarely incorporates user perceptions and perceived accessibility. Evidence from the literature suggests that user perception and satisfaction could provide valuable insights and recommendations for disability-inclusive urban infrastructure [30,31]. Lastly, while few studies have used MCDA, including AHP or TOPSIS, for pathway optimization for PWD [12,32,33], limited work has considered Fuzzy Synthetic Evaluation (FSE) coupled with Preference Ranking Organization Method for Enrichment Evaluation (PROMETHEE), specifically to accommodate the subjectivity and imprecise judgments in users’ perceptions under complex built environment factors in urban centers [34]. FSE is robust in capturing the inherent subjectivity in user preferences by accommodating the ambiguity in human judgments by transforming qualitative preferences into quantitative sets [35]. The perception of IMAs is critical when using subjective or Likert-scale ratings to prioritize built environment factors like slope, pathway length and surrounding sidewalks’ characteristics. Once these critical factors’ importance weights and performance scores are established, PROMETHEE II (i.e., a more recent version of PROMETHEE) can develop outranking relationships between different pathways, allowing for easy and useful comparisons among the alternative pathways. Integrating FSE and PROMETHEE II provides a reliable and robust MCDM framework, accounting for users’ perception of subjectivity and the physical accessibility features of the urban network.
The current research study contributes to the literature by integrating FSE and PROMETHEE II to model user perception-based optimal pathway selection for disabled individuals in urban areas. The proposed modeling framework considered the objective pathway selection criteria (e.g., pathway length, pathway slopes, number of junctions, and sidewalks characteristics) and subjective user evaluations for optimizing the pathway selection. This hybrid scheme allows for a more accurate reflection of disabled users’ preferences, minimizing the ambiguity in human judgments. By ranking and prioritizing pathways based on user perception and pathway data, this research provides meaningful insight and a decision-support model for urban and transportation planners to enhance the accessibility of this road user group. The results are expected to guide the local authorities by identifying the pathways that balance physical accessibility features and user perceptions.
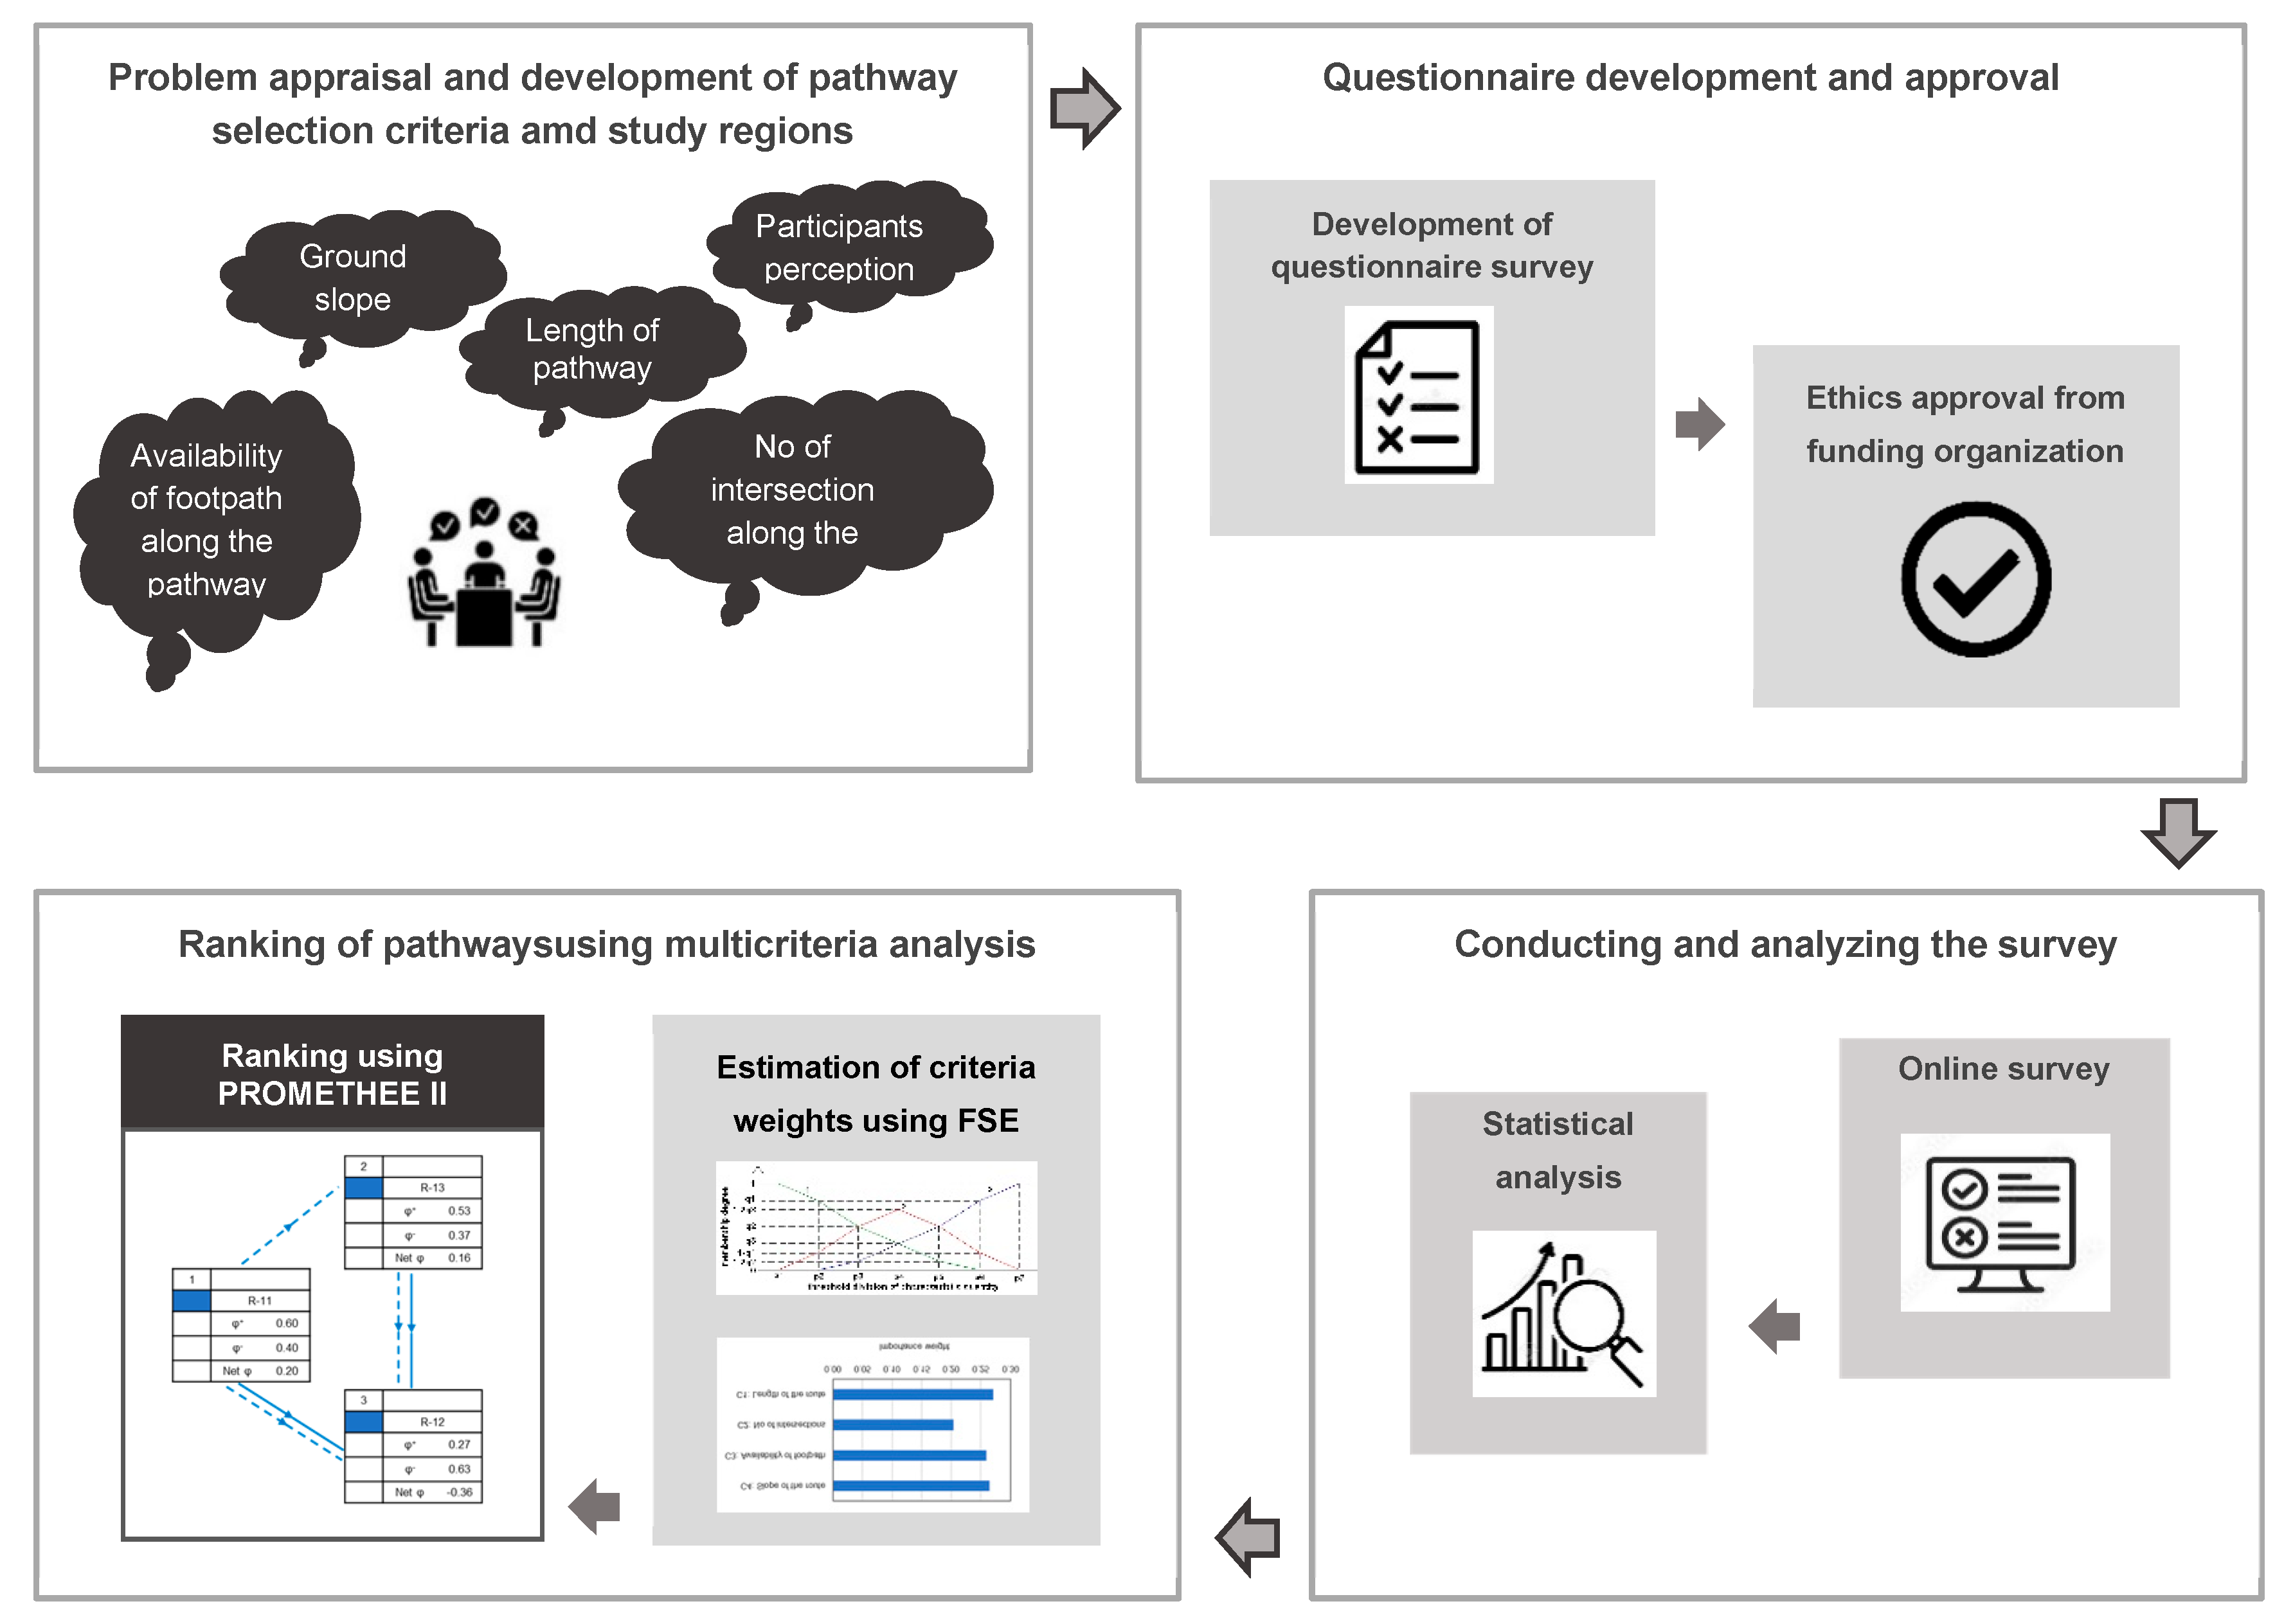
The present study has developed a framework to facilitate the pathway selection process for IMAs in different regions of Saudi Arabia, which may be adopted in urban areas in other jurisdictions. The study aims to (i) define the criteria (factors of built urban infrastructure along the pathways) that capture IMAs preferences, (ii) establish the relative significance of each criterion using FSE, (iii) determine criteria scores using Geographic Information Systems (GIS) and expert insights, and (iv) apply PROMETHEE II to establish outranking relationships among different pathways in a given region of Saudi Arabia.

2. Related Works

Urban centers are hubs of social, cultural, and economic activities. While efforts have been made to improve the sustainability and inclusivity of urban design and instruction, several mobility-related challenges are persistent for PWD [36]. These individuals face significant challenges navigating urban road infrastructure, restraining participation, and social engagement [37,38]. A recent study highlighted several critical environmental, system-social, and barriers to daily commutes among disabled people and found that these individuals make 10–30% fewer trips compared to those without disabilities [39]. Prior studies have proposed applying the shortest path algorithm to improve pedestrian social integration [40]; however, this approach may not be optimal for those with mobility impairment [41]. Instead, the best pathway is often coined, considering the necessary accommodations (such as ramps or drop curbs), allowing easy and safe navigation for IMAs [42,43]. Studies in this regard are often small-scale and have limited applicability in broader contexts. For instance, Karimi et al. [44] proposed a novel personalized accessibility map (PAM) tool that can inform PWD users about potential accessible pathways and pathway selection based on their specific needs. The developed PAM-Pitt prototype can guide wheelchair users in identifying and locating suited campus entrances and efficient internal building pathways. The proposed system was based on ADA standards, considering various indicators such as surface condition, slope, and width of street crossings [45]. Fuzzy logic was integrated with a PAM tool for locating the optimal pathways for wheelchair users, with findings suggesting that these users prioritize accessibility and comfort over short-distance travel [11]. In a recent study, Tariah et al. [46] evaluated mosque accessibility for wheelchair users in Riyadh by surveying 48 male wheelchair users. The findings revealed that participants regularly visiting the mosques faced significant accessibility issues in parking areas, which led to decreased social and religious engagement. Addressing broader mobility barriers, such as inclusive design for junctions/crossings and slopes, could improve mobility [47,48,49].
With rapid advancements in wireless networks, GPS, and GIS technologies, analyzing and disseminating accessibility data has become much more manageable. These technologies aid PWD mobility by facilitating specialized applications and services. However, existing navigation systems often lack critical information on pedestrian pathway accessibility, such as sidewalk gradients and curb ramps. An informed pathway selection for IMAs is possible when accurate pathway data, including obstacle and gradient information, is available [50].
MCDA is among the widely analytic approaches for evaluating the accessibility of pedestrians to transportation facilities. Manzolli et al. [51] and Trolese et al. [52] employed MCDA to examine the pedestrian walkability index. Manzolli evaluated walkability in Lisbon, ranking streets using the PROMETHEE method, while Trolese developed a data-driven walkability index for streets near urban hubs in Milan, Itlay. Weights assigned to each criterion under MCDA can profoundly influence the process of efficient pathway selection for PWD [53]. A recent study by Gharebaghi et al. (2020) utilized a Fuzzy approach for IMAs-specific pathway planning [12]. It was revealed that IMAs prioritize their pathways based on slopes, sidewalk conditions, and pavement surface conditions. Nosal and Solecka used MCDA and ranking methods for analyzing the accessibility of public transport by IMAs under complex urban environments [54].
AHP is another widely used tool for wheelchair users’ pathway choice selection as a function of various factors, including slope, surface quality, and slope. In their study, Kasems and Karimi [10] developed an AHP-based model using three weighting techniques to account for PWD-specific sidewalk needs in urban areas. The author highlighted the importance of pathway accessibility modeling. In other recent studies, the researchers’ impedance indices were used to evaluate the pathway accessibility for IMAs [7,55]. The proposed analytic framework was applied to the Canberra Road network in Singapore. Although the framework could effectively assess the adequacy of pedestrian infrastructure, it does not fully address the unique needs of PWD users in complex urban settings. Alzouby et al. [22] suggested applying an integrated framework consisting of MCDA and AHP to analyze the accessibility of IMAs in Jordan. Findings revealed that a large portion (52%) of streets provide poor accessibility for IMAs.
One main challenge in determining pedestrian accessibility is the lack of reliable sidewalk and crossing data [56]. In their study, Froehlich et al. [57] comprehensively identified municipalities’ issues in managing accessibility data. Henje et al. [58] studied the physical barriers wheelchair users face during urban commutes and reported that uneven road surfaces and steep gradients are the primary concerns. Ugalde et al. [59] proposed an interesting novel framework consisting of subjective evaluation and mathematical models to identify the optimal road for IMAs. Key factors were considered, including road type, width, and pathway slope. Ntakolia et al. [60] proposed a pathway optimization framework based on nonlinear programming, considering various optimization objectives such as safety, comfort, and touring experience of IMAs. Załuska et al. [61] investigated factors influencing the travel preferences of IMA in four European countries, including Cyprus, Poland, Portugal, and Greece. Results revealed that travel decisions among IMAs are influenced by factors such as gender, country of origin, and type of disability. Table 1 summarizes existing studies on route selection, planning, and optimization for IMAs. The table contained detailed information on various aspects such as study theme, geographic jurisdiction, type of disabilities and mobility aid used, accessibility barriers considered, analytic method, and key findings. GIS-based studies [9,50,62,63] primarily evaluate the routes based on the physical data. Experimental and simulations-based studies [61,64,65] capture the users’ responses to control scenarios, which might not be practical for actual applications
Proposing a comprehensive disability-inclusive framework for IMAs’ accessibility warrants consideration of driver’s criteria, such as user socio-demographics of transport services and infrastructure. Integrating GIS and fuzzy logic with MCDA effectively improves accessibility gaps and priority areas for disabled users [63]. Although few studies have developed an understanding of the dynamics of urban accessibility for wheelchair users, more research is needed to evaluate the efficacy of these analytics approaches in the context of developing countries, including Saudi Arabia.
Most of the studies in Table 1 evaluated the routes for disabled persons in developed countries using sidewalk quality and slope as the primary evaluation criteria. In most countries, traffic control signals at the junctions are well-equipped for IMAs crossing. Considering the common urban road infrastructure conditions in Saudi Arabia, the present study included pathway length, slope, availability of sidewalks, and number of junctions to evaluate the adequacy of pathways for IMAs. To the authors’ knowledge, estimating the importance of criteria based on the user’s opinion has not been adequate. The present investigation adopted the PROMETHEE II method with complete and partial outranking with obvious merit over commonly used distance-based multi-criteria analysis methods, such as TOPSIS [66], with its abilities to deal with different units without normalization step and partial ranking providing more flexibility to the decision-makers for trade-off on various criteria.
Table 1. Summary of previous studies on route planning and optimization for PWDs.
Study ThemeCountryDisability/Mobility
Aid
Accessibility CriterionMethod UsedKey FindingsReference
Mapping for Wheelchair Users: Route Navigation in Urban SpacesUKPhysical disabilities /wheelchairSurface type, route slope, surface curb types GIS-based route modeling and optimizationTailored maps for IWDs provided to improve their urban navigation [9]
User-Specific Web-Based Route PlanningAustriaVisual and physical disabilities Sidewalk obstaclesUser profile-driven route optimization algorithmProposed framework could improve the efficiency of route planning[67]
Simulating and Visualizing Sidewalk Accessibility for WayfindingUSAPhysical disabilities/different mobility aidsSidewalks and crosswalks feature, route, slope, curb surface typeSimulationThe proposed heat maps improved the understanding of the built environment for IWDs and enhanced their navigation[64]
The Route Planning Services Approach for People with DisabilityRussiaPhysical disabilitiesVarious pathway features, such as steps, ramps, slopes, and crossingsGraphHopperSuggested customized routing for IWDs supports independence and convenience in urban commutes[68]
Development of Route Accessibility Index to Support Wayfinding for People with DisabilitiesUSAPhysical disabilities/ power and manual wheelchair Curb ramps, path width, sidewalk slopesDevelopment of customized Route Accessibility IndexProposed accessibility indicators optimize route planning and navigation[68]
Utility of a Mobile Route Planning App for People Aging with DisabilityUSAVisual and physical disabilities Sidewalk conditions, curb cuts, slopesGIS-based route optimization User-friendly app design led to efficient route planning for the aging population with disabilities[62]
Efficiently Informing Crowds—Experiments and Simulations on Route Choice and Decision Making in Pedestrian Crowds with Wheelchair UsersJapanPhysical disability/wheelchair Exit type as wide, narrow, wide, sloped stairsExperiments and simulationPrioritization of information to wheelchairs enhances evacuation efficiency[65]
Personalized Accessible Wayfinding for People with DisabilitiesUSAPhysical disabilities/wheelchairsSidewalk quality, slope, width, compliance with standardsGIS-based assessment in compliance with ADA standards Advanced wayfinding tools are expected to improve accessibility in the context of smart cities[50]
User-Specific Route Planning for People with Motor Disabilities: A Fuzzy ApproachCanadaPhysical disabilities/ manual wheelchair Sidewalk conditions, surface quality slopesFuzzy rule-based modelPersonalized route planning is helpful to improve accessibility for wheelchair users[12]
Multiple-Stakeholder Perspectives on Accessibility Data and the Use of Socio-Technical Tools to Improve Sidewalk AccessibilityUSADiverse disabilities/different mobility aids Various sidewalk features, accessibility data needsProject sidewalk tool and expert evaluation Reliable data about infrastructure could help in route planning and the removal of accessibility barriers [56]

3. Materials and Methods

3.1. Conceptual Approach for Ranking Pathways for Disabled Individuals

Figure 1 illustrates this research’s conceptual approach to ranking pathways for IMAs. Group discussions and a literature review identified the most critical criteria, which are factors influencing the pathway selection decision of a disabled person. Access to data and the research team’s experience identified three well-known regions in the country: Riyadh, Qassim, and Hail. A questionnaire survey (see Appendix A for details) was used to collect the primary data for descriptive statistics and participants’ opinions about the selected criteria using a 5-point Likert scale. Fuzzy synthetic evaluation (FSE) analyzed the subjective data and estimated the importance weights of the four criteria. The criteria scores were calculated using GIS and expert judgment wherever needed. Subsequently, the PROMETHEE II multi-criteria analysis method aggregated the scores and weights to establish overall ranks of different pathways in the study regions.

3.2. Study Area and Data Collection

Study sites from three provinces, Riyadh, Qassim, and Hail, were chosen for the data collection and analysis. Figure 2 presents the locations of pathways selected across the three cities. Riyadh has a total population of 7.5 million and a corresponding % growth rate of 4%. Three pathways (Figure 2) were selected in densely concentrated urban zones. Al-Qassim, the capital city of Buraydah, is located around 350 km from Riyadh and is famous for agriculture and commercial activities. More than 50% of the population in Al-Qassim’s province resides in Buraydah, which is projected to grow significantly shortly. In Buraidah, three pathways were selected in commercial and densely populated urban zones were designated. Lastly, four pathways were identified in Hail’s region to collect the data and subsequently determine the accessibility for wheelchair users. The selected pathways were near the historical site (Hail Tower) surrounding mixed (commercial-residential) land uses. The Results section gives the characteristics and details of all the pathways considered in the three regions.
Data collection combined objective and subjective methods to minimize bias while analyzing the PWD accessibility rating for pathways selected across the three cities. Criterion such as pathway gradients, number of junctions, sidewalks, and crossing characteristics were considered in addition to detailed sociodemographic data of the respondents. In addition to field surveys, tools such as Google Earth Pro 7.3 and ArcGIS Pro 3.2.0 were utilized to obtain data about pathway lengths, slope, and sidewalk characteristics, where necessary. A questionnaire survey was organized to obtain the participants’ opinions to reflect their perceptions of the criteria. Informed consent statements were obtained from the participants, and the participation was voluntary. The surveys, consisting of 20 questions with open-ended and multi-choice responses, were disbursed via Google Forms to collect the data. Respondents rated the criteria on a five-point importance scale with five (5) importance, with ‘1’ reflecting very low importance, ‘2’ low, ‘3’ medium, ‘4’ high, and ‘5’ as very high importance. Further, the surveys were also distributed to disability support centers and sports clubs across the three cities. A total of 105 complete and valid responses were gathered.
Estimating the sample size (n) is essential in any survey. In the present study, Equation (1) estimated the sample size for a large population (1/N~0).
n = z 2 p 1 p ε 2
where z is the z-score corresponding to a 95% confidence level (commonly used for population size estimate), and ε denotes the margin of error selected as 0.1 for this study.
For simplicity, the largest sample size (n) is obtained for p = 1/2 and z = 2 (~1.96). Equation (2) can be used to estimate a conservative sample size estimate.
n = 1 ε 2

3.3. Ranking Methods

3.3.1. Fuzzy Synthetic Evaluation

The present study used FSE to estimate the importance of the weight of the criteria for pathway ranking for disabled individuals in different regions of Saudi Arabia. The approach conveniently utilizes the respondents’ subjective inputs on the importance of each criterion and integrates it with the respective portion of the sample population; for instance, the percentage of the respondents considered “high importance” for the pathway’s length, “low importance” for slope, and so on. Compared to other MCDA methods based on pairwise comparison, it is not convenient for a sample size of over 100 (see details in results) with different levels of knowledge and education.
Considering the 5-point Likert scale mapped over subjective ratings from ‘very low’ importance to ‘very high’ importance, FSE was selected as an appropriate method for estimating the importance weights of the criteria. In multi-criteria analysis, the Fuzzy set theory resolved the uncertainty issue due to limited, subjective, and imprecise information or data [69]. FSE has synthetically evaluated different alternatives or scenarios for neighborhood sustainability assessment [35], traffic safety appraisal [70], and green building [71].
The present study obtained the participants’ responses on the importance ranking of the four criteria: length of the pathway (C1), No of intersection (C2), availability of footpath (C3), and slope of the road (C4).
X i 1 × 5 = x i 1 , x i 2 , x i 3 , x i 4 , x i 5
where X i represents the relative frequency of criteria i (where i = 1, 2, 3, 4) in terms of number of responses x i 1 obtained for each rating scale divided by the total number of responses.
Next, Equation (4) estimated the overall score of each criterion based on all respondents:
C i = i = 1 5 S j × x i j
where Sj represents the five-point scale, as described above, used to capture the importance of the criteria.
Finally, Equation (5) found the relative importance weights for the criteria for evaluating different pathways for disabled individuals.
W i = C i / i = 1 n C i

3.3.2. PROMETHEE II

The PROMETHEE II method by Brans et al. (1984) is widely used for ranking alternatives. The present study applied the method for aggregating performance scores and importance weights to rank pathways (P) for disabled individuals. The method surpasses other methods, including the commonly used TOPSIS. Firstly, it can handle different units without normalization. The pairwise comparison approach evaluates an option’s dominance over the other options through all criteria. Partial ranking of the alternatives provides more insights to the decision-makers for practical trade-offs.
The method develops the preference relationships between different alternatives through the preference function, fc(Pi, Pk), as given in Equation (6) [72]
p [ f c P i , f c P k ] = p [ f c P i f c P k ]
In the subsequent step, Equation (7) outlined the degree of preference, Dh(Pi, Pk), among two alternatives (pathways).
D c P i , P k   = f c P i f c P k
where fc (Pi) is the preference function of alternative “i“ over the alternative “k”.
Then, Equation (8) establishes an explicit preference function,   p f h P i ,   f h P k , for any difference found among any two pathways concerning any criterion ‘c’ [73]:
p [ f h ( P i ) ,   f h ( P k ) ] = 0 i f D c ( P i , P k ) 0 1 i f D c ( P i , P k ) > 0
Next, Equation (9) defines the preference index, π(Pi, Pk).
π P i , P k = i n W i P c P i , P k i = 1 n w i
where Wi is the estimated importance weight of the criteria Ci in Step 1.
If Sj is the rating scheme with s j   =1, 2, 3, 4, and 5 and x i j corresponds to the degree of association of each criterion, then Equation (2) developed the matrix for the four criteria and described it in the matrix form.
Equation (10a) defines the ‘outgoing flow’ that describes how pathway Ri outranks the other pathways, and Equation (10b) explains the ‘incoming flow’ describing how the other pathways outrank pathway Ri. The ideal actions of the positive outgoing flow and the ideal action of the incoming flow are ‘1’ and ‘0’, respectively.
+ P i = x M π P i ,   x
P i = x M π x , P i
where (Ø+Pi) represents the outranking index of pathway Pi and Ø(Pi) represents the outranked index for Ri. A higher (Ø+Pi) value depicts greater dominance of the pathway Ri to other pathways, while a lower (ØPi) value reflects a smaller dominance of other pathways to the pathway Pi.
Finally, a complete ranking of all the potential pathways in a region was established from “net outranking flows” Ø(Pi) estimated using Equation (11).
P i = + P i P i
Finally, networks helped illustrate partial and complete ranking of the pathways for each region, facilitating decision-makers.

4. Results

4.1. Descriptive Statistics of Respondents’ Dissatisfaction with Infrastructure Inadequacies

4.1.1. Demographics

Considering the cumulative population of 9,570,000 for the three study regions and the 2.9% population proportion of disabled individuals [74], Equation (2) estimated a sample size of 100, with a margin of error (ε) of 0.1. In addition to disability support services centers, the survey was disseminated to sports and health clubs in the three study regions to obtain the opinion of PWD. With a high response rate, 105 respondents completed the online survey form. Table 2 presents the participants’ descriptive statistics and a summary of the frequency and percentage distribution of independent variables of PWD’s opinion regarding the adequacy of infrastructure. The data shows almost an equal participation of 51 male and 54 female participants. Around 67% of the male participants shared a negative opinion on the adequacy of infrastructure for PWD, while over 80% of the female participants shared a similar opinion. The difference can be attributed to more frequent movement of males than females, resulting in higher acquaintance with encounter difficulties.
The data shows a consistent participation of age groups between 18 and 55. On average, 77% of the participants from all age groups denied experiencing adequate infrastructure along urban pathways, with a maximum (45.83%) disagreement from the age group between 25 and 34 years, followed by 32.14% from the 35–44 years age group, and 0% from PWD above 55 years of age. These findings show that middle-aged (25 to 45 years) wheelchair (or other aids) users could be more resilient to lacking facilities than the younger and older age groups. Older adults (around 10% of total respondents) registered dissatisfaction, probability since they face amplified inaccessibility challenges due to restricted age-related mobility. The reason for higher (by 78%) dissatisfaction with infrastructure adequacy by the younger (18 years) adults can be linked to their typical teenage impatient attitude.
Considering PWD’s opinion on the adequacy of road infrastructure at the education level, around 80% of the respondents with education below the university level registered dissatisfaction with the adequacy of road infrastructure for PWD. Of the respondents who completed a diploma, university (bachelor) level, or higher education, 64.44% were unsatisfied. Therefore, an overall negative correlation between dissatisfaction with infrastructure inadequacy can be observed with increased education level, probably due to more knowledge of road safety and using mobility aids to overcome infrastructure limitations.
The descriptive statistics results in Table 2 show a higher (above 75%) dissatisfaction among employed, unemployed, and homemakers. Excluding a minimal (7.6%) number of one individual owning a business and seven retired persons, the data shows no strong relationship between employment and opinion on infrastructure adequacy for PWD.
Around 55% of the respondents’ monthly income was less than 10,000 SAR, and 72.41% were dissatisfied. The most likely reason for this trend is financial constraints restricting the affordability of mobility aids. Among the middle-income group with a monthly income between 10,000 and 20,000, 83% showed dissatisfaction. The data indicates that financial constraints exacerbate the mobility challenge for PWD.

4.1.2. Disability Duration and Mobility Aid

Around 73% of PWD with physical or sensory disabilities registered their dissatisfaction. In the present study, disability duration was a critical factor influencing dissatisfaction with infrastructure adequacy for IMAs. The data in Table 2 shows that less than 60% of participants with disability duration of less than five years showed dissatisfaction, while around 73% with a duration of 6–10 years and 81% with a duration over 10 years were dissatisfied. The findings can be attributed to high frustration levels because of prolonged exposure to infrastructure inadequacies, resulting in a high likelihood of IMAs lacking facilities in public spaces.
The survey data clearly show a relationship between the functionality level of the mobility aid and the dissatisfaction level of IMAs. Around 67% of individuals using electric wheelchairs showed dissatisfaction, while 77% of the participants who use manual wheelchairs registered dissatisfaction with the adequacy of infrastructure for IMAs in public spaces. The absence of ramps and curb cuts, steep slopes, and long distances without footpaths can significantly restrict the mobility of manual wheelchair users.

4.1.3. Travel Purpose and Challenges

The survey revealed that IMAs face challenges while traveling to the workplace (71.4%) and educational institutions (75%). Dissatisfaction levels increased when traveling for shopping (79%) and religious and social activities (81%). Data shows relatively lower dissatisfaction at health facilities by 66% of the respondents, which can be attributed to appropriate ramps, guard rails, and other infrastructure generally available at healthcare facilities.
Unsuitable pedestrian crossings (83%) and lack of disability-inclusive public spaces (81%) were highlighted as the most significant challenges IMAs face. Inappropriate entrances and social stigma were recorded by 70% and 63% of respondents as significant barriers to IMAs’ mobility in public places.
Travel distance has also been identified as a mobility challenge. Around 30% of respondents reported that they can comfortably travel less than 100 m distance with an assistive device. An exponential decrease in satisfaction can be observed in Table 2 with an increase in travel distance, 25% for 100–300 m and 9% for 300–500 m. In comparison, 100% of the IMAs registered traveling for more than 500 m is highly challenging to them.
The following section discusses the impact of pathway selection criteria on IMAs’ dissatisfaction. Overall, all the variables discussed above specify diverse insights into IMAs’ circumstances associated with urban road infrastructure.

4.2. Pathways Ranking Using FSE and PROMETHEE II

The methodology for FSE described in Section 2 estimated the importance weights of the pathway ranking criteria. Table 3 presents the opinion of 105 respondents obtained using a 5-point Likert scale translated into subjective criteria. Most respondents considered all parameters of high importance. Equation (3) estimated the relative frequencies for all the ratings for each criterion (Table 4). Table 4 shows that around 65% of the participants gave ‘high’ or ‘very high’ importance to the pathway’s length (C1), followed by 59% to the pathway’s slope (C4). Around 50% of the participants considered the availability of a footpath as a ‘high’ or ‘very high’ importance criterion, while only ~28% considered the number of intersections as of the same importance. Table 5 presents the overall score obtained by multiplying the importance scale (Si) with the relative frequencies of each criterion using Equation (4). Figure 3 presents the final weights of importance for the four criteria estimated by Equation (5). The figure shows that respondents gave the length and slope of the pathway the highest importance, followed by the availability of footpaths and the number of intersections at the end with the least importance.
In the subsequent step, PROMITHEE II was applied to rank the pathways for IMAs using the importance weights shown in Figure 3 and the performance matrix in Table 6 for all the ranking criteria. The performance matrix presents the data obtained from Google Earth maps and personal communication for each pathway. Equation (6) to Equation (8) established the performance functions for all pairs of pathways, for example, between P31 and P32, P31 and P33, and so on. The results for Hail City are given in Table 7. Considering space limitations, detailed results of the PROMETHEE II application are only provided for Hail City with the maximum number of pathways.
Table 8 presents the performance functions matrix obtained from Equation (8), and Table 9 presents the aggregated performance function matrix for all pathways using Equation (9). Table 10 presents the outgoing flow, incoming flow, and net flow using Equation (10) and Equation (11), as well as the final ranking of pathways for IMAs in Hail City. Table 11 shows the final ranking of the pathways in all three regions.
Figure 4a–c illustrates the partial and complete pathways ranking for disabled individuals in the capital cities (Riyadh, Buraydah, and Hail) of Riyadh, Qassim, and Hail regions of Saudi Arabia. Figure 4a shows that the other two pathways outranked P12 due to two junctions along 817 m (considered a very long distance by the IMAs), footpaths along only 6% of the entire pathway length, and a 7.46% slope. IMAs can only commute on such high slopes with assistance [75]. The other two pathways in Riyadh stayed identical based on partial ranking; nevertheless, based on complete ranking, P11 outperformed P13. P11 outperformed P13 on the number of junctions and slope criteria, whereas P13 superseded P11 on pathway length and the percentage (~20%) of pathway length having footpaths.
Figure 4b presents the partial and complete ranking results for Buraydah City. P23 was the top pathway based on both rankings due to the availability of footpaths and the lowest slope of the other two junctions. P22 was outperformed by the other two pathways based on partial and complete ranking due to its long pathway length (~1100 m) and steeper slope than P23. However, P22 and P23 are compared based on the slope criterion, which shows close values for both cases. These findings can be attributed to the limitation of outranking methods; in such cases, the final selection of pathways should be performed cautiously.
Figure 4c presents the partial and complete rankings of four potential pathways for IMAs in Hail City. P34 outperformed all the other pathways in the city based on complete ranking, while in the case of partial ranking, P34 and P31 remained in the same position. P34 outperformed P31 on pathway length and slope criteria, while P31 outranked P34 on the percentage of footpaths along the pathway. Both have two junctions along the pathway. P32 was the lowest rank pathway due to the shortest pathway length with footpaths and steepest slope of more than 8%.
These results demand an inclusive design of pathways and public spaces to facilitate IMAs’ independence and equivalent participation in social activities, enhancing the overall quality of life for this exceptional proportion of the country’s population.

5. Discussion

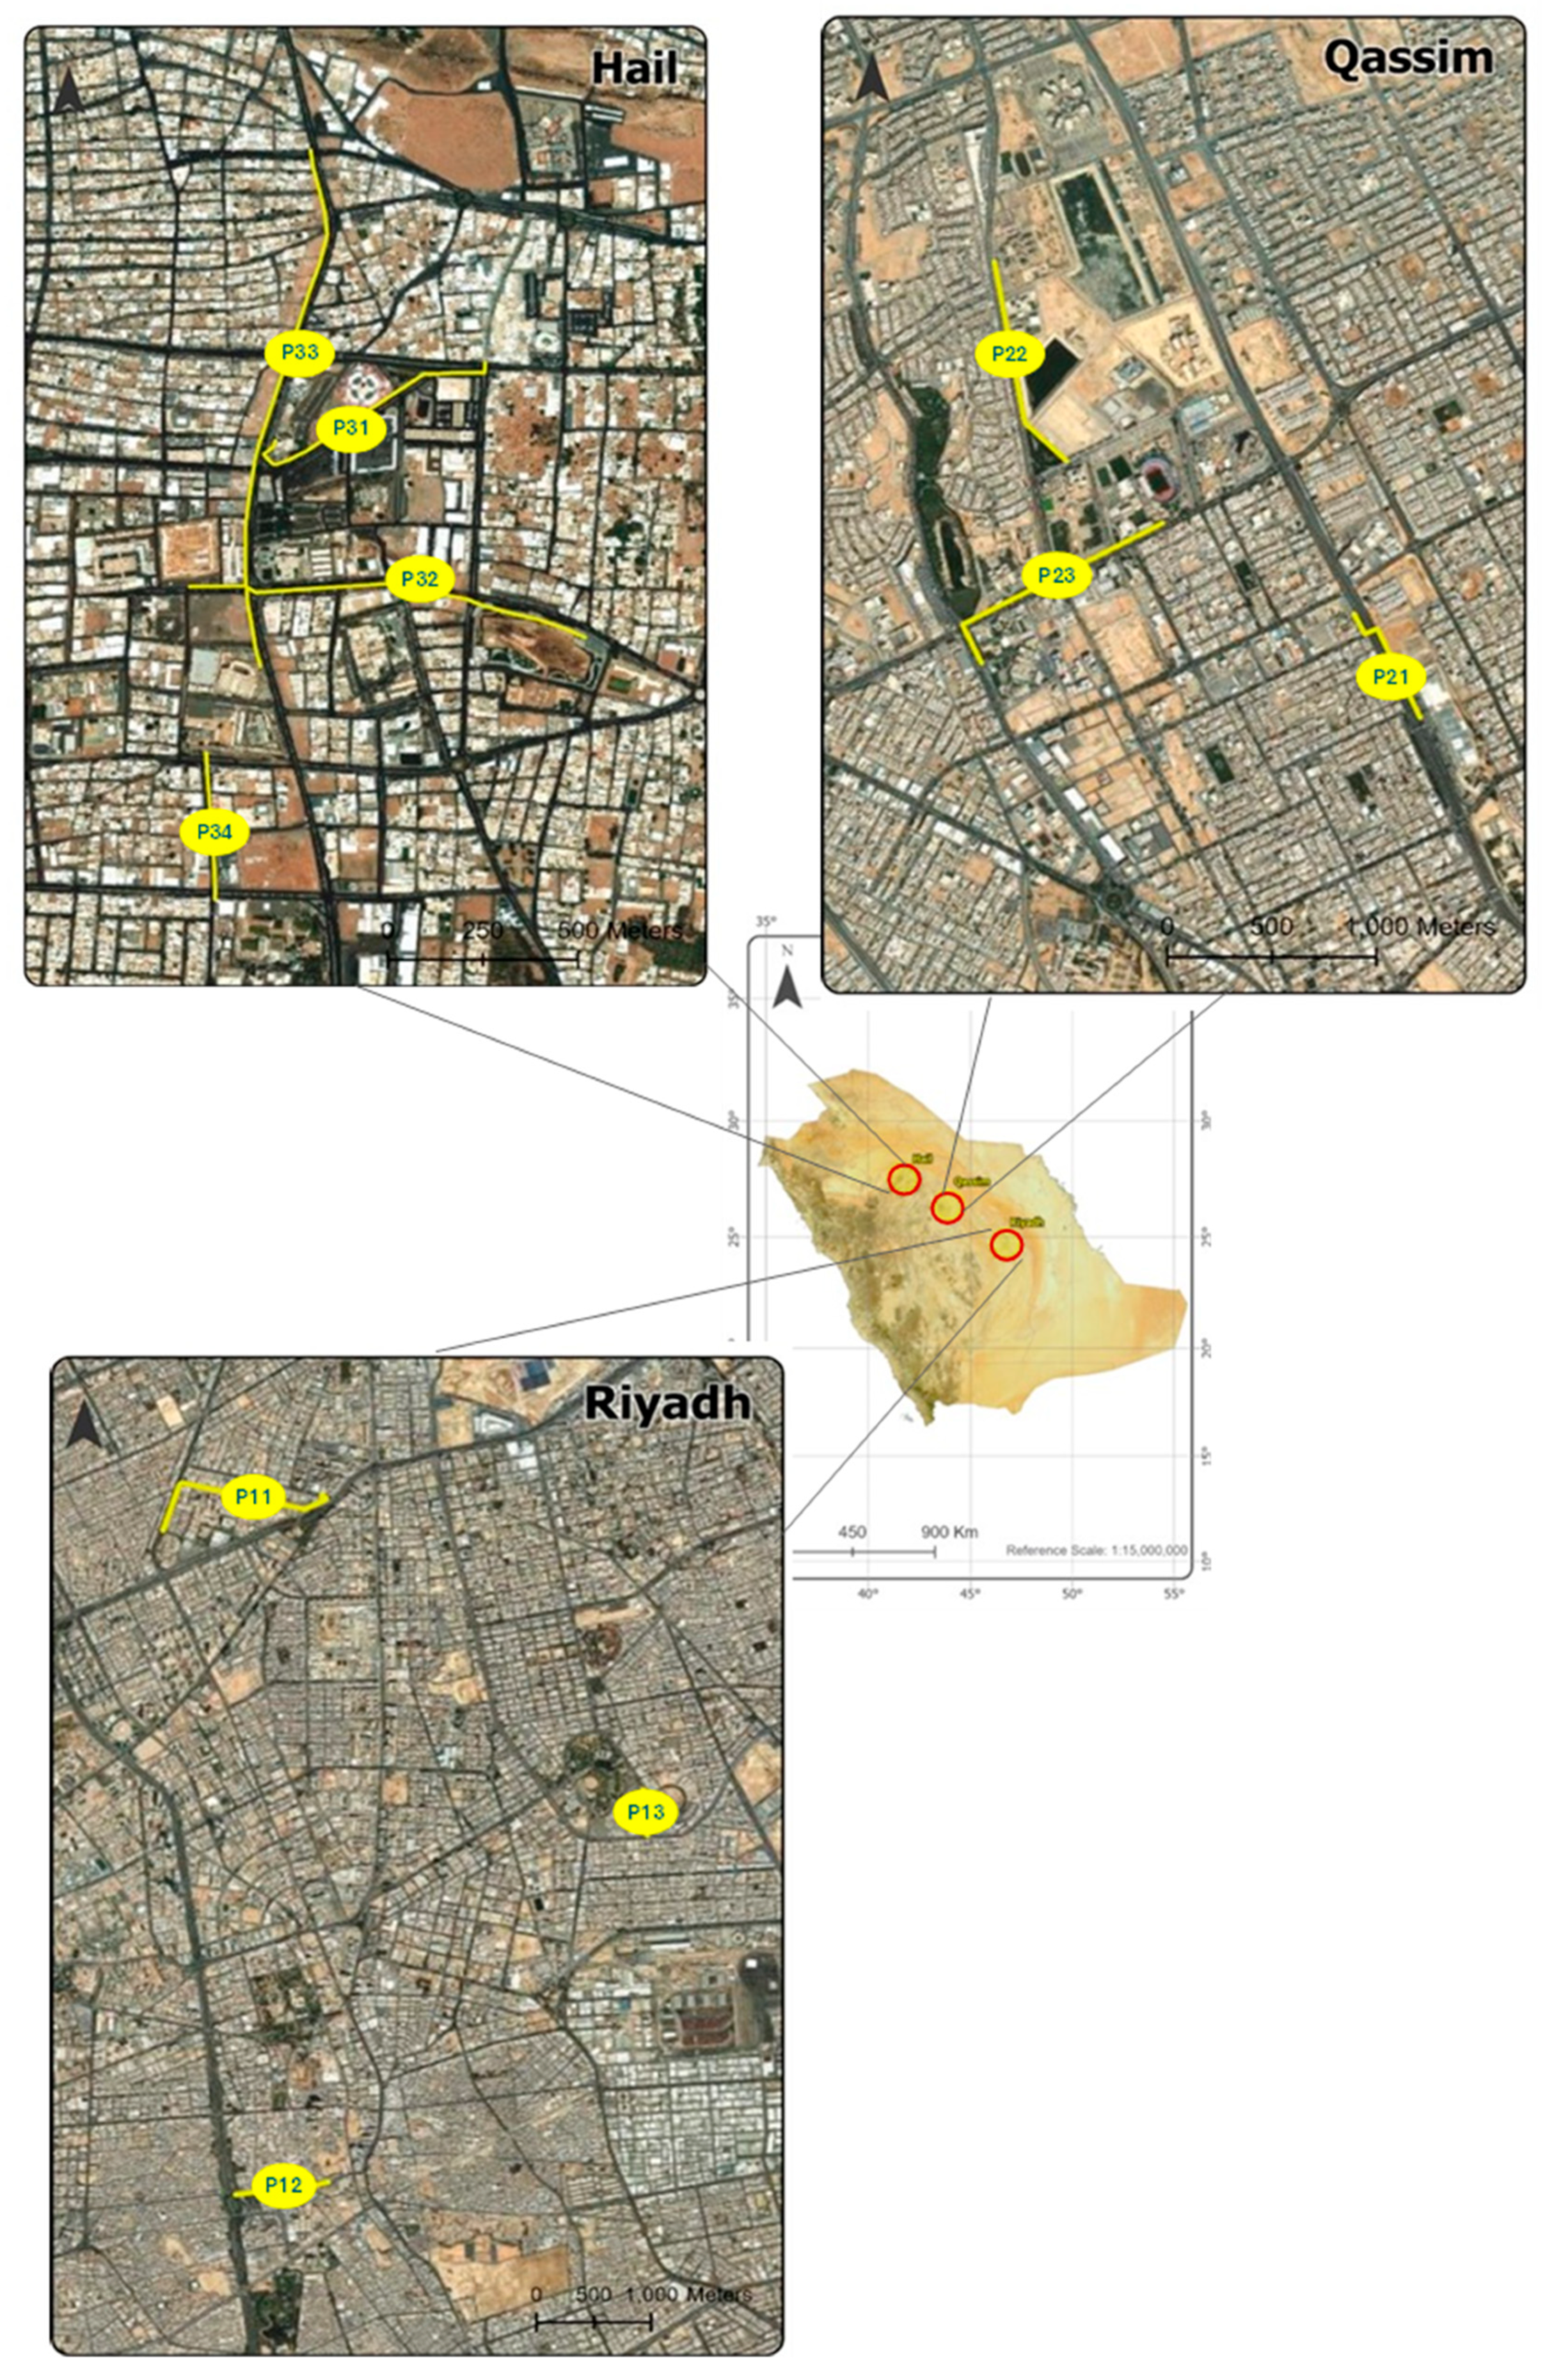
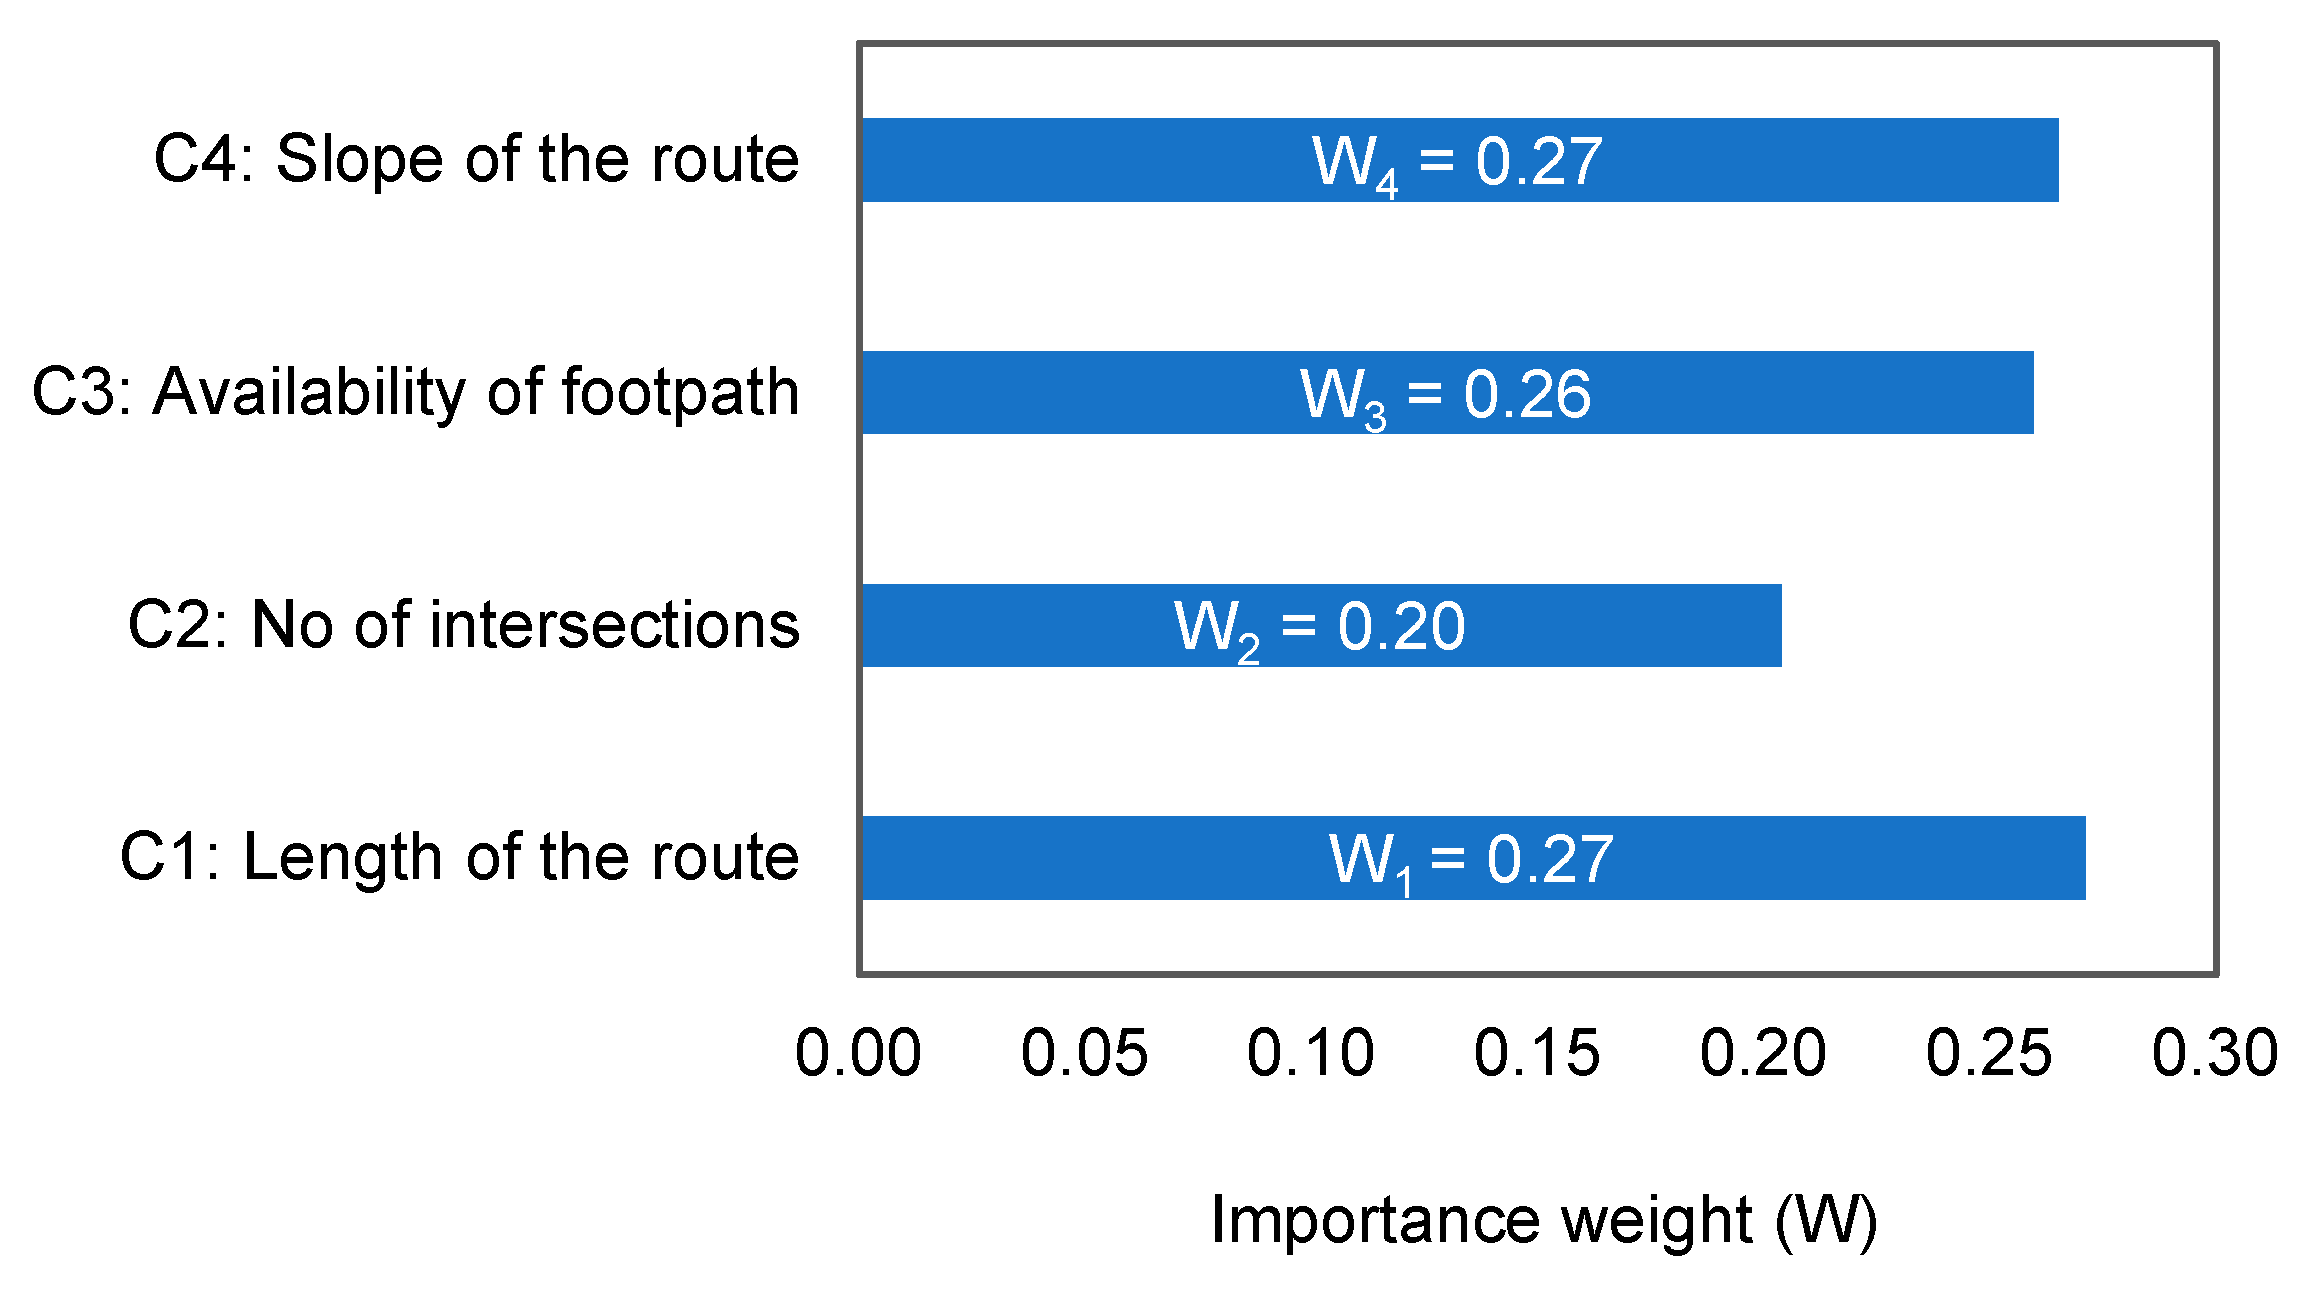
This study aimed to evaluate and rank urban pathways based on their accessibility and convenience for IMAs across three cities in Saudi Arabia. Combining FSE and PROMETHEE II, a robust multi-criteria decision-making framework offers rankings of considered pathways based on IMAs’ perception. The selected pathways are evaluated for IMAs based on four primary criteria, including pathway length, number of junctions, percentage of the pathway length with footpaths, and slope of the road. The study found length to be the most critical concern of IMAs while commuting to public places for shopping, education, work, and other social activities. Around 65% of the participants considered length a high or very high-importance criterion. It is intuitive to have lower satisfaction scores for IMAs with mobility aids over longer pathways because it will increase strain and physical fatigue and expose them to unprotected crossings and uneven terrain, which can significantly reduce accessibility, particularly for older IMAs. These findings agree with the results of past studies [16,76]. The pathway length becomes critical for the individuals using artificial limbs and manual wheelchairs, 65% of the participants in this study. An efficient urban design incorporating mix-use development with commercial and recreational facilities, shorter paths to important (cultural, educational, and religious) locations with minimal detours, wide and maintained (smooth) sidewalks and ramps, and broad curb cuts for easy wheelchair access can minimize the impact of pathway length in a compute, supporting IMAs [77].
The present survey’s results highlight the slope of the pathway as the second most critical criterion when around 67% of participants considered it of medium to very high importance. Steep slopes on urban roads are a significant barrier, particularly for manual mobility aids. It is reasonable for pathways with steep gradients to have lower satisfaction ratings since navigating steep uphill slopes requires substantial efforts to traverse through and frequently poses a higher risk of wheelchair tipping. Steeper gradients are particularly problematic for manual wheelchair users and elderly IMAs. As per the Americans with Disabilities Act (ADA), footpaths with slopes steeper than 5% (target value) require excessive PWD effort, leading to high fatigue and dependability [78]. Around 70% of the pathways in the study area have slopes steeper than the target value. A recent study by Bakhsh et al. highlighted the varying challenging slopes in five parks of Hail City, i.e., one of the study regions in the present study [79]. These findings direct towards considering slope as a significant constraint in urban infrastructure design in Saudi Arabia. Further, the findings highlight the importance of maintaining gentle slopes on frequently traveled urban pathways surrounding residential and busy commercial areas to promote safety and equity of travel for IMAs.
The length of footpaths along the pathway has been identified by ~69% of the participants as a critical barrier to their satisfaction with urban infrastructure. Longer sections of a pathway without a footpath increase the likelihood of accidents for IMAs, leading to injuries; IMAs using wheelchairs are more susceptible to such risks [80,81]. Consistent, well-designed, and separate pathways from vehicular traffic are expected to have higher satisfaction ratings of IMAs with mobility aids (wheelchairs) since they contribute to increased ride comfort and safety. In addition to the presence of sidewalks, other factors, including their width, surface quality, and obstacle-free access, are the critical pathway accessibility ranking by IMAs [82,83]. Per the Built Environment Guidelines prepared by the Prince Salman Center of Disability Research (PSCDR) in Saudi Arabia [84], a curb cut should have smooth transitions and minimal slope and be identified with detectable (textured) surfaces to avoid balance problems due to flared edges. PSCDR also recommended a minimum clear width of the footpath of 1.8 m to help with the movability of wheelchairs and scooters. Apart from design constraints, the promulgation of the law can also minimize wrong parking on footpaths and excessive growth of trees and bushes partially covering footpath space, impeding movement of IMAs more than a walking pedestrian [85]. The findings indicate the importance of providing continuous and well-designed sidewalks to ensure the smooth accessibility and safety of vulnerable IMA groups.
Almost half the participants identified the number of junctions as the least important than the above-stated criteria. Nevertheless, crossing decision is a significant risk factor associated with the safety of IMAs [86], particularly in the absence of a properly designed and equipped traffic control signal. Excluding busy downtowns, the chance of facing inadequately designed or equipped junctions increases with an increase in the number of junctions. Urban pathways with several junctions to be traversed will likely have lower satisfaction scores since wheelchair users face challenges such as frequent stops, constant attention to traffic, and traveling through uneven surfaces, particularly in the absence of ramps. According to PSCDR [84] pedestrian signals should have 100 mm colored push buttons highlighted in surroundings and mounted at 0.9 m to 1.2 m above the ground. In addition, raised crossings with 0.6 m truncated domes with warning surfaces also facilitate IMAs. More details on the design can be found in PSCDR (2010) [87]. Thus, it is crucial to minimize the number of junctions or incorporate smart crosswalk aids/technologies that will facilitate smooth and safe crosswalk travel.
Based on the study’s findings, several policy implications may be considered for promoting a disability-inclusive urban transportation system. It is apparent from the study’s findings that the demographics of IMAs play a vital role in their travel decision and pathway selection. Hence, urban transport planning should consider the diverse needs of IMAs, socioeconomic factors, and different types of disabilities. Similarly, policies should consider the provision of continuous sidewalks, adequately designed with gentle slopes and reasonable widths and ramps at entry and exit locations. The number of road crossings should be reduced as much as possible, and intelligent adaptive crossings should be implemented where mandatory. It is also essential to establish and monitor protocols for periodic inspection and retrofitting of infrastructure to ensure sustained accessibility for all residents. Finally, awareness and education among the public regarding an inclusive urban design will ensure the safe and smooth participation of IMAs in the urban economy.

6. Conclusions

Individuals with mobility aids in urban centers of different regions of Saudi Arabia face numerous obstacles associated with the design and operations of urban road infrastructure, such as long travel pathways, absence (or inadequately designed) sidewalks, steep slopes, and unequipped junctions crossing while commuting for routine journeys to educational institutions, shopping, and other social and religious activities. Fuzzy synthetic evaluation is a suitable method for estimating the importance of multiple criteria based on the subjective opinion of road users. The study found pathway length, ground slope, and availability of footpaths as the most critical factors affecting the dissatisfaction of individuals with disabilities, followed by the number of junctions along a pathway. These road infrastructure features are more relevant for manual wheelchair users, which are more than 50% (in this study) of the proportion of this unique group of population. PROMETHEE II can effectively evaluate the pathways for individuals using mobility aids using outranking relationships, mainly when the difference in performance scores between two (or more) pathways is close. To comply with the Vision 2030 goal of a vibrant society in Saudi Arabia, the concerned organizations must incorporate design constraints (e.g., maximum slope) in urban infrastructure design specific to the needs of IMAs. The operation and maintenance of sidewalks should be efficient to ensure smooth accessibility and safety. The study provides a practical framework for highlighting factors affecting the satisfaction of persons using mobility aids and ranking suitable pathways for them. The present study used a convenience sample with available resources; future studies can further validate the findings using random sampling.
The specific contributions of the research are as follows:
  • The study provides a rational and simplified approach based on the relative frequencies of participants’ responses to establish the importance of different factors (criteria) influencing the mobility of IMAs;
  • The proposed methodology applied MCDA to integrate data of different features along any pathway and establish the priority routes. This approach can also evaluate multiple route options from an origin to a destination;
  • Partial outranking of the pathways helps decision-makers appreciate their relative performance over different criteria and consider informed trade-offs;
  • The methodology provides a basis for developing a mobile application or a similar tool to evaluate the adequacy of urban pathways to facilitate IMAs for route selection.

Author Contributions

Conceptualization, H.H. and A.J.; methodology, H.H. and A.J.; validation, MA and F.A.; formal analysis, H.H. and A.J.; investigation, F.A.; resources, M.A. and F.A.; data curation, H.H. and A.J.; writing—original draft preparation, H.H. and A.J.; writing—review and editing, M.A. and F.A.; visualization, H.H. and A.J.; supervision, F.A.; project administration, M.A. and F.A. All authors have read and agreed to the published version of the manuscript.

Funding

This research is funded by the King Salman Center for Disability Research through Research Group no KSRG-2023-549.

Institutional Review Board Statement

The study was conducted in accordance with the Declaration of Helsinki and approved by the Ethics Committee of Qassim University (protocol code: 24-84-07; date of approval: 4 April 2024).

Informed Consent Statement

Informed consent was obtained from all subjects involved in the study.

Data Availability Statement

The data presented in this study are available on request from the corresponding author.

Acknowledgments

The authors extend their appreciation to the King Salman Center for Disability Research for funding this work through Research Group no KSRG-2023-549.

Conflicts of Interest

The authors declare no conflicts of interest.

Appendix A. Questionnaire Survey Statements

  • Gender:
  • Age:
  • Educational level:
  • Profession/job:
  • Monthly income:
  • What type of disability do you have?
  • What type of disabled person vehicles do you use to move around? (You can choose multiple answers)
  • The number of years you have used assistive vehicles:
  • Do you move outside your place of residence?
  • What is the purpose of your move? (You can choose multiple answers)
  • What means of transportation do you usually use to get around? (You can choose multiple answers)
  • Did you move around with any type of them during the past month?
  • If the answer is yes, then moving with any type of disabled person vehicles may have affected your participation or access to:
  • Do you face difficulties while moving around using disabled persons’ vehicles in the center of your city?
  • What is the maximum distance you can travel alone?
  • In your opinion, are the roads and corridors in the center of your city and the intersections at traffic lights suitable for people with disabilities to use disabled persons’ vehicles?
  • Do you have any suggestions?
  • Rank the following criteria based on their importance to you, from most important to least important, with ‘5’ being more important and ‘1’ being less important:
The criterion is arranged based on its importance to you, and the number must not be repeated.
  • Footpath length (total length of route)
  • Slope (inclination of the path)
  • Absence of footpath
  • The number of junctions in the route

References

  1. World Report on Disability. Available online: https://www.who.int/teams/noncommunicable-diseases/sensory-functions-disability-and-rehabilitation/world-report-on-disability (accessed on 11 November 2024).
  2. GASTAT: 1.8% of Saudi Population Experiences Some Form of Disability–Saudi Gazette. Available online: https://www.saudigazette.com.sa/article/642994 (accessed on 11 November 2024).
  3. Al-Jadid, M.S. Disability in Saudi Arabia. Saudi Med. J. 2013, 34, 453–460. [Google Scholar] [PubMed]
  4. Bindawas, S.M.; Vennu, V. The National and Regional Prevalence Rates of Disability, Type, of Disability and Severity in Saudi Arabia—Analysis of 2016 Demographic Survey Data. Int. J. Environ. Res. Public Health 2018, 15, 419. [Google Scholar] [CrossRef] [PubMed]
  5. King Salman Center for Disability Research. Available online: https://kscdr.org.sa/en (accessed on 8 December 2024).
  6. Authority for People with Disabilities. Overview of the Rights of Persons with Disabilities in the Kingdom of Saudi Arabia; Authority for People with Disabilities: Riyadh, Saudi Arabia, 2024. [Google Scholar]
  7. Hashemi, M.; Karimi, H.A. Collaborative Personalized Multi-criteria Wayfinding for Wheelchair Users in Outdoors. Trans. GIS 2017, 21, 782–795. [Google Scholar] [CrossRef]
  8. Matthews, H.; Beale, L.; Picton, P.; Briggs, D. Modelling Access with GIS in Urban Systems (MAGUS): Capturing the Experiences of Wheelchair Users. Area 2003, 35, 34–45. [Google Scholar] [CrossRef]
  9. Beale, L.; Field, K.; Briggs, D.; Picton, P.; Matthews, H. Mapping for Wheelchair Users: Route Navigation in Urban Spaces. Cartogr. J. 2006, 43, 68–81. [Google Scholar] [CrossRef]
  10. Kasemsuppakorn, P.; Karimi, H.A. Personalised Routing for Wheelchair Navigation. J. Locat. Based Serv. 2009, 3, 24–54. [Google Scholar] [CrossRef]
  11. Kasemsuppakorn, P.; Karimi, H.A.; Ding, D.; Ojeda, M.A. Understanding Route Choices for Wheelchair Navigation. Disabil. Rehabil. Assist. Technol. 2015, 10, 198–210. [Google Scholar] [CrossRef]
  12. Gharebaghi, A.; Mostafavi, M.-A.; Edwards, G.; Fougeyrollas, P. User-Specific Route Planning for People with Motor Disabilities: A Fuzzy Approach. ISPRS Int. J. Geo-Inf. 2021, 10, 65. [Google Scholar] [CrossRef]
  13. Naghdizadegan Jahromi, M.; Neysani Samany, N.; Mostafavi, M.A.; Argany, M. A New Approach for Accessibility Assessment of Sidewalks for Wheelchair Users Considering the Sidewalk Traffic. In Web and Wireless Geographical Information Systems; Mostafavi, M.A., Del Mondo, G., Eds.; Lecture Notes in Computer Science; Springer Nature: Cham, Switzerland, 2023; Volume 13912, pp. 76–92. ISBN 978-3-031-34611-8. [Google Scholar]
  14. Bick, J. Americans with Disabilities Act and the Internet. Alb. LJ Sci. Tech. 1999, 10, 205. [Google Scholar]
  15. Handy, S.L.; Niemeier, D.A. Measuring Accessibility: An Exploration of Issues and Alternatives. Environ. Plan. Econ. Space 1997, 29, 1175–1194. [Google Scholar] [CrossRef]
  16. Nicolas, A.; Kuperman, M.; Ibañez, S.; Bouzat, S.; Appert-Rolland, C. Mechanical Response of Dense Pedestrian Crowds to the Crossing of Intruders. Sci. Rep. 2019, 9, 105. [Google Scholar]
  17. Kashifi, M.T.; Jamal, A.; Kashefi, M.S.; Almoshaogeh, M.; Rahman, S.M. Predicting the Travel Mode Choice with Interpretable Machine Learning Techniques: A Comparative Study. Travel. Behav. Soc. 2022, 29, 279–296. [Google Scholar] [CrossRef]
  18. Lima, J.P.; Abitante, J.d.C.; Pons, N.A.D.; Senne, C.M. A Spatial Fuzzy Multi-criteria Analysis of Accessibility: A Case Study in Brazil. Sustainability 2019, 11, 3407. [Google Scholar] [CrossRef]
  19. Oni, A.O.; Akindele, D.B.; Akinjare, O. Graph-Theoretic Approach to Resolving the Accessibility and Site Selection Issues in Planning and Development. Mediterr. J. Soc. Sci. 2014, 5, 11–20. [Google Scholar] [CrossRef]
  20. Diepolder, S. On the Computation of Accessibility Provided by Dynamic Transportation Modes. Master Thesis, TU-Munich, München, Germany, 2023. [Google Scholar]
  21. Páez, A.; Scott, D.M.; Morency, C. Measuring Accessibility: Positive and Normative Implementations of Various Accessibility Indicators. J. Transp. Geogr. 2012, 25, 141–153. [Google Scholar]
  22. Alzouby, A.M.; Nusair, A.A.; Taha, L.M. GIS Based Multi Criteria Decision Analysis for Analyzing Accessibility of the Disabled in the Greater Irbid Municipality Area, Irbid, Jordan. Alex. Eng. J. 2019, 58, 689–698. [Google Scholar]
  23. Nalmpantis, D.; Roukouni, A.; Genitsaris, E.; Stamelou, A.; Naniopoulos, A. Evaluation of Innovative Ideas for Public Transport Proposed by Citizens Using Multi-Criteria Decision Analysis (MCDA). Eur. Transp. Res. Rev. 2019, 11, 22. [Google Scholar] [CrossRef]
  24. Delgado-Enales, I.; Molina-Costa, P.; Osaba, E.; Urra-Uriarte, S.; Del Ser, J. Improving the Urban Accessibility of Older Pedestrians Using Multi-Objective Optimization. In Proceedings of the 2022 IEEE Congress on Evolutionary Computation (CEC), IEEE, Padua, Italy, 18–23 July 2022; pp. 1–8. [Google Scholar]
  25. Hoogendoorn, S.P.; Bovy, P.H. Pedestrian Route-Choice and Activity Scheduling Theory and Models. Transp. Res. Part. B Methodol. 2004, 38, 169–190. [Google Scholar]
  26. Mogaji, E.; Nguyen, N.P. Transportation Satisfaction of Disabled Passengers: Evidence from a Developing Country. Transp. Res. Part. Transp. Environ. 2021, 98, 102982. [Google Scholar] [CrossRef]
  27. Guo, R.-Y.; Huang, H.-J.; Wong, S.C. Route Choice in Pedestrian Evacuation under Conditions of Good and Zero Visibility: Experimental and Simulation Results. Transp. Res. Part. B Methodol. 2012, 46, 669–686. [Google Scholar]
  28. Andreev, S.; Dibbelt, J.; Nöllenburg, M.; Pajor, T.; Wagner, D. Towards Realistic Pedestrian Route Planning. In Proceedings of the 15th Workshop on Algorithmic Approaches for Transportation Modelling, Optimization, and Systems (ATMOS 2015), Patras, Greece, 17 September 2015; Volume 48, pp. 1–15. [Google Scholar] [CrossRef]
  29. Murray, A.T.; Wu, X. Accessibility Trade-offs in Public Transit Planning. J. Geogr. Syst. 2003, 5, 93–107. [Google Scholar] [CrossRef]
  30. Jackson, M. Accessing the Neighbourhood: Built Environment Performance for People with Disability. Archit. MPS 2019, 16, 1–26. [Google Scholar] [CrossRef]
  31. Chiscano, M.C. Improving the Design of Urban Transport Experience with People with Disabilities. Res. Transp. Bus. Manag. 2021, 41, 100596. [Google Scholar] [CrossRef]
  32. Gupta, A. Evaluating the Factors Affecting the Selection of Sustainable Public Transport System Based on an Integrated AHP and Fuzzy TOPSIS Approach. 2020. Available online: https://ssrn.com/abstract=3922683 (accessed on 11 November 2024).
  33. Hezam, I.M.; Mishra, A.R.; Rani, P.; Alshamrani, A. Assessing the Barriers of Digitally Sustainable Transportation System for Persons with Disabilities Using Fermatean Fuzzy Double Normalization-Based Multiple Aggregation Method. Appl. Soft Comput. 2023, 133, 109910. [Google Scholar] [CrossRef]
  34. Morfoulaki, M.; Papathanasiou, J. Use of PROMETHEE MCDA Method for Ranking Alternative Measures of Sustainable Urban Mobility Planning. Mathematics 2021, 9, 602. [Google Scholar] [CrossRef]
  35. Haider, H.; Hewage, K.; Umer, A.; Ruparathna, R.; Chhipi-Shrestha, G.; Culver, K.; Holland, M.; Kay, J.; Sadiq, R. Sustainability Assessment Framework for Small-Sized Urban Neighbourhoods: An Application of Fuzzy Synthetic Evaluation. Sustain. Cities Soc. 2018, 36, 21–32. [Google Scholar] [CrossRef]
  36. Kapsalis, E.; Jaeger, N.; Hale, J. Disabled-by-Design: Effects of Inaccessible Urban Public Spaces on Users of Mobility Assistive Devices–a Systematic Review. Disabil. Rehabil. Assist. Technol. 2024, 19, 604–622. [Google Scholar] [CrossRef]
  37. Park, J.; Chowdhury, S. Towards an Enabled Journey: Barriers Encountered by Public Transport Riders with Disabilities for the Whole Journey Chain. Transp. Rev. 2022, 42, 181–203. [Google Scholar] [CrossRef]
  38. Haque, M.N.; Sharifi, A. Who Are Marginalized in Accessing Urban Ecosystem Services? A Systematic Literature Review. Land. Use Policy 2024, 144, 107266. [Google Scholar] [CrossRef]
  39. Park, K.; Esfahani, H.N.; Novack, V.L.; Sheen, J.; Hadayeghi, H.; Song, Z.; Christensen, K. Impacts of Disability on Daily Travel Behaviour: A Systematic Review. Transp. Rev. 2023, 43, 178–203. [Google Scholar] [CrossRef]
  40. Ahmed, T.; Moeinaddini, M.; Almoshaogeh, M.; Jamal, A.; Nawaz, I.; Alharbi, F. A New Pedestrian Crossing Level of Service (PCLOS) Method for Promoting Safe Pedestrian Crossing in Urban Areas. Int. J. Environ. Res. Public. Health 2021, 18, 8813. [Google Scholar] [CrossRef] [PubMed]
  41. Haber Ugalde, B.; Alcause Vinluan, A.; Torres Carpio, J. Wheelchair Navigation System Using Node Combination Technique for People with Motor Disabilities. In Proceedings of the 2021 The 13th International Conference on Computer Modeling and Simulation, ACM, Melbourne, Australia, 25 June 2021; pp. 203–209. [Google Scholar]
  42. Kish, J.E. Fixed-Route Transportation Access and Equity for People with Disabilities. Ph.D. Thesis, University of Illinois at Chicago, Chicago, IL, USA, 2022. [Google Scholar]
  43. Machingaidze, R. Road Safety and Accessibility: Facilitating the Autonomous Movement of People with Physical Disabilities in Pedestrian Environments. Master Thesis, Hasselt University, Hasselt, Belgium, 2021. [Google Scholar]
  44. Karimi, H.A.; Zhang, L.; Benner, J.G. Personalized Accessibility Map (PAM): A Novel Assisted Wayfinding Approach for People with Disabilities. Ann. GIS 2014, 20, 99–108. [Google Scholar] [CrossRef]
  45. Ding, D.; Parmanto, B.; Karimi, H.A.; Roongpiboonsopit, D.; Pramana, G.; Conahan, T.; Kasemsuppakorn, P. Design Considerations for a Personalized Wheelchair Navigation System. In Proceedings of the 2007 29th Annual International Conference of the IEEE Engineering in Medicine and Biology Society, IEEE, Lyon, France, 22–26 August 2007; pp. 4790–4793. [Google Scholar]
  46. Abu Tariah, H.; Ghasham, N.; Alolayan, M.; Alahmadi, B.; Alqarni, A. Wheelchair Accessibility of Mosques in Riyadh. Work 2018, 60, 385–391. [Google Scholar] [CrossRef] [PubMed]
  47. Bezyak, J.L.; Sabella, S.; Hammel, J.; McDonald, K.; Jones, R.A.; Barton, D. Community Participation and Public Transportation Barriers Experienced by People with Disabilities. Disabil. Rehabil. 2020, 42, 3275–3283. [Google Scholar] [CrossRef]
  48. Hammel, J.; Magasi, S.; Heinemann, A.; Gray, D.B.; Stark, S.; Kisala, P.; Carlozzi, N.E.; Tulsky, D.; Garcia, S.F.; Hahn, E.A. Environmental Barriers and Supports to Everyday Participation: A Qualitative Insider Perspective from People with Disabilities. Arch. Phys. Med. Rehabil. 2015, 96, 578–588. [Google Scholar] [CrossRef]
  49. Mani, P.; Vadivu, S.; Alshakhs, H.; Alrashed, M.; Almeaibed, A.; Almulhim, A.; Almulhim, N. Assessment of Accessibility Preparation for People with Special Needs at Al Ahsa Mosques. Int. J. Health Sci. Res. 2021, 11, 62–69. [Google Scholar] [CrossRef]
  50. Wheeler, B.; Syzdykbayev, M.; Karimi, H.A.; Gurewitsch, R.; Wang, Y. Personalized Accessible Wayfinding for People with Disabilities through Standards and Open Geospatial Platforms in Smart Cities. Open Geospatial Data Softw. Stand. 2020, 5, 2. [Google Scholar] [CrossRef]
  51. Manzolli, J.A.; Oliveira, A.; de Castro Neto, M. Evaluating Walkability through a Multi-Criteria Decision Analysis Approach: A Lisbon Case Study. Sustainability 2021, 13, 1450. [Google Scholar] [CrossRef]
  52. Trolese, M.; De Fabiis, F.; Coppola, P. A Walkability Index Including Pedestrians’ Perception of Built Environment: The Case Study of Milano Rogoredo Station. Sustainability 2023, 15, 15389. [Google Scholar] [CrossRef]
  53. Roszkowska, E. The Extention Rank Ordering Criteria Weighting Methods in Fuzzy Enviroment. Oper. Res. Decis. 2020, 30, 91–114. [Google Scholar] [CrossRef]
  54. Nosal, K.; Solecka, K. Application of AHP Method for Multi-Criteria Evaluation of Variants of the Integration of Urban Public Transport. Transp. Res. Procedia 2014, 3, 269–278. [Google Scholar] [CrossRef]
  55. Bhuiya, M.M.R.; Shao, W.; Jones, S.; Liu, J. Toward A Comprehensive Framework for Accessibility Measures for Movement-Challenged Persons. Transp. Res. Rec. J. Transp. Res. Board. 2024, 03611981241270162. [Google Scholar] [CrossRef]
  56. Labbé, D.; Eisenberg, Y.; Snyder, D.; Shanley, J.; Hammel, J.M.; Froehlich, J.E. Multiple-Stakeholder Perspectives on Accessibility Data and the Use of Socio-Technical Tools to Improve Sidewalk Accessibility. Disabilities 2023, 3, 621–638. [Google Scholar] [CrossRef]
  57. Froehlich, J.E.; Brock, A.M.; Caspi, A.; Guerreiro, J.; Hara, K.; Kirkham, R.; Schöning, J.; Tannert, B. Grand Challenges in Accessible Maps. Interactions 2019, 26, 78–81. [Google Scholar] [CrossRef]
  58. Henje, C.; Stenberg, G.; Lundälv, J.; Carlsson, A. Obstacles and Risks in the Traffic Environment for Users of Powered Wheelchairs in Sweden. Accid. Anal. Prev. 2021, 159, 106259. [Google Scholar]
  59. Ugalde, B.H.; Vinluan, A.A.; Carpio, J.T. An Optimal Route for People with Ambulant Disabilities Using Mathematical Risk Modeling and Analytic Hierarchy Process. In Smart Trends in Computing and Communications; Zhang, Y.-D., Senjyu, T., So-In, C., Joshi, A., Eds.; Lecture Notes in Networks and Systems; Springer: Singapore, 2022; Volume 286, pp. 119–129. ISBN 9789811640155. [Google Scholar]
  60. Ntakolia, C.; Iakovidis, D.K. A Route Planning Framework for Smart Wearable Assistive Navigation Systems. SN Appl. Sci. 2021, 3, 104. [Google Scholar] [CrossRef]
  61. Załuska, U.; Kwiatkowska-Ciotucha, D.; Grześkowiak, A. Travelling from Perspective of Persons with Disability: Results of an International Survey. Int. J. Environ. Res. Public Health 2022, 19, 10575. [Google Scholar] [CrossRef]
  62. Sanford, J.A.; Melgen, S.; Guhathakurta, S.; Zhang, G. Utility of a Mobile Route Planning App for People Aging with Disability. Health 2018, 5, 7. [Google Scholar]
  63. Prémont, M.-É.; Vincent, C.; Mostafavi, M.A. Geospatial Assistive Technologies: Potential Usability Criteria Identified from Manual Wheelchair Users. Disabil. Rehabil. Assist. Technol. 2020, 15, 844–855. [Google Scholar] [CrossRef]
  64. Tajgardoon, M.; Karimi, H.A. Simulating and Visualizing Sidewalk Accessibility for Wayfinding of People with Disabilities. Int. J. Cartogr. 2015, 1, 79–93. [Google Scholar] [CrossRef]
  65. Feliciani, C.; Murakami, H.; Shimura, K.; Nishinari, K. Efficiently Informing Crowds–Experiments and Simulations on Route Choice and Decision Making in Pedestrian Crowds with Wheelchair Users. Transp. Res. Part C Emerg. Technol. 2020, 114, 484–503. [Google Scholar] [CrossRef]
  66. Alharbi, F.; Alshammari, A.; Almoshaogeh, M.; Jamal, A.; Haider, H. User Perception-Based Optimal Route Selection for Vehicles of Disabled Persons in Urban Centers of Saudi Arabia. Appl. Sci. 2024, 14, 10289. [Google Scholar] [CrossRef]
  67. Pressl, B.; Mader, C.; Wieser, M. User-Specific Web-Based Route Planning. In Computers Helping People with Special Needs; Miesenberger, K., Klaus, J., Zagler, W., Karshmer, A., Eds.; Lecture Notes in Computer Science; Springer: Berlin/Heidelberg, Germany, 2010; Volume 6179, pp. 280–287. ISBN 978-3-642-14096-9. [Google Scholar]
  68. Kulakov, K.A.; Shabaev, A.I.; Shabalina, I.M. The Route Planning Services Approach for People with Disability. In Proceedings of the 2015 17th Conference of Open Innovations Association (FRUCT), IEEE, Yaroslavl, Russia, 20–24 April 2015; pp. 89–95. [Google Scholar]
  69. Deschrijver, G.; Kerre, E.E. Triangular Norms and Related Operators in L*-Fuzzy Set Theory. In Logical, Algebraic, Analytic and Probabilistic Aspects of Triangular Norms; Elsevier: Amsterdam, The Netherlands, 2005; pp. 231–259. [Google Scholar]
  70. Alharbi, F.; Almoshaogeh, M.I.; Ibrahim, A.H.; Haider, H.; Elmadina, A.E.M.; Alfallaj, I. Performance Appraisal of Urban Street-Lighting System: Drivers’ Opinion-Based Fuzzy Synthetic Evaluation. Appl. Sci. 2023, 13, 3333. [Google Scholar] [CrossRef]
  71. Zhao, X.; Hwang, B.-G.; Gao, Y. A Fuzzy Synthetic Evaluation Approach for Risk Assessment: A Case of Singapore’s Green Projects. J. Clean. Prod. 2016, 115, 203–213. [Google Scholar] [CrossRef]
  72. Abedi, M.; Torabi, S.A.; Norouzi, G.-H.; Hamzeh, M.; Elyasi, G.-R. PROMETHEE II: A Knowledge-Driven Method for Copper Exploration. Comput. Geosci. 2012, 46, 255–263. [Google Scholar] [CrossRef]
  73. Mareschal, B.; Brans, J.P.; Vincke, P. PROMETHEE: A New Family of Outranking Methods in Multi-criteria Analysis; ULB–Universite Libre de Bruxelles: Bruxelles, Belgium, 1984. [Google Scholar]
  74. GaStat: (2.9%) of Saudi Population Have Disability with (Extreme) Difficulty|General Authority for Statistics. Available online: https://www.stats.gov.sa/en/news/230 (accessed on 11 November 2024).
  75. Daff, M. Footpaths Should Be Improved for Motorised Chairs. In Proceedings of the Australian Institute of Traffic Planning and Management (Aitpm) National Conference, Melbourne, Australia, 7–8 June 2001. [Google Scholar]
  76. Stumbo, N.J.; Pegg, S. Travelers and Tourists with Disabilities: A Matter of Priorities and Loyalties. Tour. Rev. Int. 2005, 8, 195–209. [Google Scholar]
  77. Artieda, L.; Allan, M.; Cruz, R.; Shah, S.; Pineda, V.S. Access and Persons with Disabilities in Urban Areas. Access Policies Incl. TOD 2022. Available online: https://trid.trb.org/View/2027010 (accessed on 11 November 2024).
  78. Koca-Atabey, M. Re-Visiting the Role of Disability Coordinators: The Changing Needs of Disabled Students and Current Support Strategies from a UK University. Eur. J. Spec. Needs Educ. 2017, 32, 137–145. [Google Scholar] [CrossRef]
  79. Bakhsh, H.R.; Chippendale, T.; Al-Haizan, N.; Bin Sheeha, B.H. Assessment of Park Paths and Trails to Promote Physical Accessibility among Wheelchair Users in Saudi Arabia. Hong. Kong J. Occup. Ther. 2024, 37, 42–51. [Google Scholar] [CrossRef]
  80. Tannert, B.; Schöning, J. Disabled, but at What Cost?: An Examination of Wheelchair Routing Algorithms. In Proceedings of the Proceedings of the 20th International Conference on Human-Computer Interaction with Mobile Devices and Services, ACM, Barcelona, Spain, 3 September 2018; pp. 1–7.
  81. Banister, D. Unsustainable Transport: City Transport in the New Century; Routledge: London, UK, 2005. [Google Scholar]
  82. Aghaabbasi, M.; Moeinaddini, M.; Asadi-Shekari, Z.; Shah, M.Z. The Equitable Use Concept in Sidewalk Design. Cities 2019, 88, 181–190. [Google Scholar] [CrossRef]
  83. Odame, P.K.; Amoako-Sakyi, R.O. Sidewalk Accessibility and Pedestrian Safety among Students with Physical Disability in the University of Cape Coast. Curr. Res. J. Soc. Sci. Hum. 2019, 2, 109. [Google Scholar] [CrossRef]
  84. Universal Accessibility Guidelines–King Salman Center for Disability Research. Available online: http://v2.kscdr.org.sa/en/research/universal-accessibility-guidelines/ (accessed on 11 November 2024).
  85. Mohammad, A.; Al-Harbi, T.S. Design of the Built Environment and the Integration of Wheelchair Users in the Kingdom of Saudi Arabia: Commentary and Exploratory Study. J. Dev. Disabil. 2016, 22, 121. [Google Scholar]
  86. Schwartz, N.; Buliung, R.; Daniel, A.; Rothman, L. Disability and Pedestrian Road Traffic Injury: A Scoping Review. Health Place 2022, 77, 102896. [Google Scholar] [CrossRef] [PubMed]
  87. PSCDR. Universal Accessbility: Built Environment Guidelines; Prince Salman Center for Disability Research: Riyadh, Saudi Arabia, 2010; p. 312. [Google Scholar]
Figure 1. Conceptual approach for ranking of pathways for disabled individuals.
Sustainability 16 11116 g001
Figure 2. Study areas and the selected pathways in each city.
Sustainability 16 11116 g002
Figure 3. Importance weights obtained from the fuzzy synthetic evaluation.
Sustainability 16 11116 g003
Figure 4. Partial and complete ranking of pathways for disabled individuals in three cities of Saudi Arabia: (a) Riyadh, (b) Buraydah, and (c) Hail.
Sustainability 16 11116 g004
Table 2. Descriptive statistics showing frequency and percentage distribution of independent variables of PWD’s opinion regarding infrastructure inadequacy.
VariablesAttributesPWD’s Opinion on Infrastructure Inadequacy
YesNo
Frequency% DistributionFrequency% Distribution
Genderfemale3666.67%1833.33%
male4180.39%1019.61%
Age Group18–241878.26%521.74%
25–341354.17%1145.83%
35–441967.86%932.14%
45–541785.00%315.00%
>5510100.00%00.00%
Educational levelElementary1477.78%422.22%
High School3480.95%819.05%
Diploma, bachelor, or higher education2964.44%1635.56%
EmploymentBusiness150.00%150.00%
Employed2873.68%1026.32%
Housemaker375.00%125.00%
Retired763.64%436.36%
Unemployed3876.00%1224.00%
Monthly income (SAR)<10,0004272.41%1627.59%
>20,0002100.00% 0.00%
10,000–20,0002083.33%416.67%
Financially dependant1361.90%838.10%
Type of disabilityMental Health266.67%133.33%
Physical6773.63%2426.37%
Sensory872.73%327.27%
Disability Duration (Years)<1250.00%250.00%
1–51257.14%942.86%
6–101672.73%627.27%
>104781.03%1118.97%
Type of Aid usedArtificial limb466.67%233.33%
Electric wheelchair2567.57%1232.43%
Manual wheelchair4877.42%1422.58%
Encountered difficulty with assistive devicesno1260.00%840.00%
Yes6576.47%2023.53%
Frequently Travel outside your residenceno2074.07%725.93%
Yes5773.08%2126.92%
Prevalent travel purposeEducational institution1575.00%525.00%
Health Facility2565.79%1334.21%
Religious, social, and recreational activities1780.95%419.05%
Shopping1578.95%421.05%
Workplace571.43%228.57%
Difficulty encountered during travel (reasons)Inadequate assistive technology1168.75%531.25%
Inappropriate entrance facilities to public spaces2170.00%930.00%
Lack of disability-inclusive public spaces1381.25%318.75%
Pedestrian crossing is not suitable for disabled individuals1083.33%216.67%
Social Stigma763.64%436.36%
Unfriendly Pedestrian Sidewalks to accommodate disabled1578.95%421.05%
Maximum distance you can travel alone with assistive devices (meters)<1002670.27%1129.73%
100–3002475.00%825.00%
300–5001090.91%19.09%
>5006100.00%00.00%
Length of pathway (perceived importance)Very High2870.00%1230.00%
High2382.14%517.86%
Medium861.54%538.46%
Low1875.00%625.00%
Very Low0000
Number of Junctions (perceived importanceVery High1376.47%423.53%
High758.33%541.67%
Medium1066.67%533.33%
Low4777.05%1422.95%
Very Low0000
Absence of footpath (perceived importance)Very High1669.57%730.43%
High1967.86%932.14%
Medium3778.72%1021.28%
Low571.43%228.57%
Very Low0000
Slope of Pathway (perceived importance)very High2080.00%520.00%
High2775.00%925.00%
Medium2374.19%825.81%
Low753.85%646.15%
Very Low0000
Table 3. Respondent scores given to pathway ranking criteria for IMAs.
NoCriteriaLikert ScaleSUM
12345
Very LowLowMediumHighVery High
C1Length024132840105
C2No of intersections061151217105
C3Availability of footpath07472823105
C4Slope013303626105
Table 4. Relative frequencies allocated by the respondents for criteria.
NoCriteriaVery LowLowMediumHighVery HighSUM
C1Length0.0000.2290.1240.2670.3811.0
C2No of intersections0.0000.5810.1430.1140.1621.0
C3Availability of footpath0.0000.0670.4480.2670.2191.0
C4Slope0.0000.1240.2860.3430.2481.0
Table 5. Overall scores obtained for criteria.
NoCriteriaVery LowLowMediumHighVery HighSUM
C1Length0.0000.4570.3711.0671.9053.80
C2No of intersections0.0001.1620.4290.4570.8102.86
C3Availability of footpath0.0000.1331.3431.0671.0953.64
C4Slope0.0000.2480.8571.3711.2383.71
Table 6. Scoring matrix developed from GIS.
No.CityPathwayLength (m)Number of JunctionsAbsence of Footpath (%)Slope (%)
1RiyadhP-111850110.96.2
P-12817267.5
P-13568220.48.6
2QassimP-216581136.6
P-2210840104.0
P-231295214.53.8
3HailP-31737261.57.0
P-321060225.58.2
P-331479441.15.2
P-34398233.33.9
Table 7. Preference functions for all the pairs of pathways in Hail City.
P(Pi, Pk)LengthNo of
Intersections
Availability of FootpathSlope
(P-31, P-32)1011
(P-31, P-33)1110
(P-31, P-34)0000
(P-32, P-31)0000
(P-32, P-33)1100
(P-32, P-34)0010
(P-33, P-31)0001
(P-33, P-32)0011
(P-33, P-34)1111
(P-34, P-31)1011
(P-34, P-32)1001
(P-34, P-33)1111
Table 8. Preference functions for all the pathways.
p [ f h ( P i ) , f h ( P k ) ] LengthNo of IntersectionsAvailability of FootpathSlopeSum
(P-31, P-32)0.2710.0000.2600.2650.796
(P-31, P-33)0.2710.2040.2600.0000.735
(P-31, P-34)0.0000.0000.0000.0000.000
(P-32, P-31)0.0000.0000.0000.0000.000
(P-32, P-33)0.2710.2040.0000.0000.475
(P-32, P-34)0.0000.0000.2600.0000.260
(P-33, P-31)0.0000.0000.0000.2650.265
(P-33, P-32)0.0000.0000.2600.2650.525
(P-33, P-34)0.2710.2040.2600.2651.000
(P-34, P-31)0.2710.0000.2600.2650.796
(P-34, P-32)0.2710.0000.0000.2650.536
(P-34, P-33)0.2710.2040.2600.2651.000
Table 9. Aggregated preference index matrix for all the pathways.
π P i , P k P(P-31,X)P(P-32,X)P(P-33,X)P(P-34,X)
P-310.0000.7960.7350.00
P-320.0000.0000.4750.26
P-330.2650.5250.0001.00
P-340.7960.5361.0000.00
Table 10. Outgoing, incoming, and net flows, and final ranking of pathways in Hail.
FluxP-31P-32P-33P-34
φ+0.510.240.600.60
φ0.350.620.740.42
Net Flux0.16−0.37−0.140.18
Rank2431
Table 11. Final ranking of pathways for different cities.
RiyadhQassimHail
Pathway no.Net FluxRankPathway no.Net FluxRankPathway no.Net FluxRank
P-110.211P-210.012P-310.162
P-12−0.363P-22−0.063P-32−0.374
P-130.162P-230.051P-33−0.143
------P-340.181
Disclaimer/Publisher’s Note: The statements, opinions and data contained in all publications are solely those of the individual author(s) and contributor(s) and not of MDPI and/or the editor(s). MDPI and/or the editor(s) disclaim responsibility for any injury to people or property resulting from any ideas, methods, instructions or products referred to in the content.

