Article

Leveraging AI and Data Visualization for Enhanced Policy-Making: Aligning Research Initiatives with Sustainable Development Goals

by
Maicon Herverton Lino Ferreira da Silva Barros
1,†,
Leonides Medeiros Neto
1,†,
Guto Leoni Santos
2,†,
Roberto Cesar da Silva Leal
3,†,
Raysa Carla Leal da Silva
3,†,
Theo Lynn
2,†,
Raphael Augusto Dourado
1,† and
Patricia Takako Endo
1,*,†
1
Programa de Pós-Graduação em Engenharia de Computação (PPGEC), Universidade de Pernambuco (UPE), Recife 50050-000, Brazil
2
Business School, Dublin City University (DCU), D09 RFK0 Dublin, Ireland
3
Sistemas de Informação, Universidade de Pernambuco (UPE), Caruaru 55002-917, Brazil
*
Author to whom correspondence should be addressed.
These authors contributed equally to this work.
Sustainability 2024, 16(24), 11050; https://doi.org/10.3390/su162411050
Submission received: 9 October 2024 / Revised: 10 November 2024 / Accepted: 5 December 2024 / Published: 17 December 2024

Abstract

:
Scientists, research institutions, funding agencies, and policy-makers have all emphasized the need to monitor and prioritize research investments and outputs to support the achievement of the United Nations Sustainable Development Goals (SDGs). Unfortunately, many current and historic research publications, proposals, and grants were not categorized against the SDGs at the time of submission. Manual post hoc classification is time-consuming and prone to human biases. Even when classified, few tools are available to decision makers for supporting resource allocation. This paper aims to develop a deep learning classifier for categorizing research abstracts by the SDGs and a decision support system for research funding policy-makers. First, we fine-tune a Bidirectional Encoder Representations from Transformers (BERT) model using a dataset of 15,488 research abstracts from authors at leading Brazilian universities, which were preprocessed and balanced for training and testing. Second, we present a PowerBI dashboard that visualizes classifications for supporting informed resource allocation for sustainability-focused research. The model achieved an F1-score, precision, and recall exceeding 70% for certain classes and successfully classified existing projects, thereby enabling better tracking of Agenda 2030 progress. Although the model is capable of classifying any text, it is specifically optimized for Brazilian research due to the nature of its fine-tuning data.

1. Introduction

The 2030 Agenda for Sustainable Development was adopted by all United Nations members in 2015 [1]. It comprises 17 Sustainable Development Goals (SDGs), including eradicating poverty (SDG 1), ensuring health and well-being (SDG 3), targets for quality education (SDG 4), clean energy (SDG 7), sustainable cities (SDG 11), amongst others. The SDGs offer significant insights into global environmental governance overall and enables policy-makers to enact institutional policies involving civil society at large. Stevens and Karie [2] suggest that the SDGs present an opportunity to reshape the nature of development and make environmental and social sustainability integral to managing economic activities. However, implementing the SDGs presents several challenges, such as financial constraints, global inequalities in financial markets, lack of institutional capacity, and gaps in data and statistical coverage [3].
The extant literature has emphasized the importance of scientists, research institutions, funding agencies, and policy-makers in both monitoring and prioritizing research investments and outputs to support the achievement of the SDGs [4,5]. Asadikia et al. [4] suggest that such prioritization and monitoring optimizes resource allocation, thereby ensuring research funding is directed toward high-impact goals and/or ensuring adequate coverage of the SDGs. Furthermore, they suggest that by aligning with the SDGs, greater interdisciplinary collaboration can be achieved within the research sector, connecting academic research with real-world applications in particular. Notwithstanding these benefits, Smith et al. [6] observe that existing monitoring efforts are limited by manual and subjective coding and observed covariance in SDG indicator data. While some studies have developed automated SDG classification methods, they primarily rely on traditional machine learning models [5] and lack the adaptability that current Large Language Models (LLM) offer. The few studies using LLMs often rely on small, imbalanced datasets [7,8] with limited data curation which affect classification performance. Most existing studies are predominantly experimental and seldom implemented in real-world settings. This gap underscores the need for Artificial Intelligence (AI) tools specifically designed to support decision-making in public agencies.
Using AI, particularly LLMs such as Bidirectional Encoder Representations from Transformers (BERT), offers significant advantages over traditional classification methods. Its transformer architecture allows the model to understand language context and capture nuances in text, which simpler models may overlook [9]. Its pre-training on extensive datasets, which combined with the ability to fine-tune for specific tasks, facilitates the distillation of knowledge [10]. These capabilities enable the adaptation to new data aligned with the classification objectives, which improves classification performance [10]. Our approach differs from prior studies by leveraging AI to the monitor research proposals aligned with the SDGs submitted to a public research funding agency. This method improves accountability by utilizing a substantial dataset specifically aligned for with the intended purpose.
This work evaluates a deep learning model based on BERT for classifying research proposal abstracts into one of the 17 SDGs. To address data imbalances, we use a novel data augmentation technique using Generative AI based on dos Santos et al. [11]. As per Morales-Hernandez et al. [5], we compare the performance of the model on different balanced and imbalanced datasets and evaluate classification effectiveness based on specific metrics, namely F1-score, precision, and recall. Finally, we present the outputs from the model in a decision support system, using PowerBI.
To improve the practical utility of this model, we apply it to research projects funded by the Fundação de Amparo à Ciência e Tecnologia do Estado de Pernambuco (FACEPE), the primary research funding agency in Pernambuco, Brazil. By implementing this AI-driven classification tool, our study offers FACEPE and similar funding agencies with a mechanism to align research funding priorities with the SDGs. For example, these agencies can prioritize research initiatives that address SDGs most relevant to the needs of the local population. This approach represents an advancement in the application of AI for policy-making, providing a scalable model for monitoring and optimizing public investments to meet strategic policy objectives. In addition, we also present a PowerBI dashboard that allows users to explore the results through a series of visualizations. These vizualizations contextualize the SDG classification in relation to the projects’ geographical distribution, research areas, proponent institution, and graduate programs, among others. This tool can assist FACEPE, as well as potentially other funding agencies in the future, in analyzing and understanding where and how public research funding is being allocated. By providing these insights, the dashboard enables data-driven decision-making, such as formulating public policies to increase investment in projects aligned with the SDGs, promoting research on strategic SDGs, or direct resources to underdeveloped geographical areas.
To summarize, we have defined the following research questions:
  • How can BERT-based AI models be fine-tuned to classify research projects in alignment with the SDGs?
  • In what ways can AI-powered data visualization tools improve decision-making in the allocation of public research funds to projects aligned with the SDGs?
The remainder of this article is organized as follows: Section 3 provides an overview of machine learning and deep learning for text classification and is followed by a summary of related works in Section 2. Section 4 presents the data, preprocessing and data balancing methods, and the classification model. Section 5 details the results followed by a discussion in Section 6 before concluding.

2. Background

AI is a branch of computer science focused on developing systems systems capable of exhibiting intelligent behavior [12]. Machine Learning (ML) entails a methodical learning process that uses historical data to construct mathematical models for predicting outcomes or identifying classifications. ML algorithms are typically categorized into four categories-supervised, unsupervised, semi-supervised, and reinforcement learning [13]. ML is a convergence of statistical methods and computer science and is a foundational element of AI [14]. Developing ML models involves a rigorous engineering approach and requires specialized knowledge to derive valuable features for training the models [15]. Types of traditional ML algorithms include Multi-layer Perceptron (MLP), Support Vector Machines (SVM), Naive Bayes (NB), Random Forests (RF) and others.
Deep Learning (DL) models employ a structured sequence of layers that excel in identifying specific attributes, thereby enhancing the feature selection process and delivering robust performance with complex data structures. Lecun et al. [15] highlight that “deep-learning methods are representation-learning methods with multiple levels of representation, obtained by composing simple but non-linear modules that each transform the representation at one level (starting with the raw input) into a representation at a higher, more abstract level. With sufficient such transformations, very complex functions can be learned”. A key distinction between ML and DL is that in DL, the feature layers are not predefined by experts but are instead derived from data through a universal learning process [15]. The most common types of deep learning involve models known as Convolutional Neural Networks (CNN) and Long Short-Term Memory (LSTM).
Natural Language Processing (NLP) is a subfield of AI focused on processing human language; NLP is considered a type of ML [12]. Initially, NLP relied on methods like Bag-of-Words (BoW) and Term Frequency-Inverse Document Frequency (TF-IDF), utilizing traditional ML techniques such as SVM, NB, and RF for text classification and sentiment analysis [5,16]. However, the limitations of these methods spurred the development and adoption of DL models such as LSTM and CNN, which have been extensively used in NLP tasks. Despite their advantages, these DL models often struggle with understanding word relationships and maintaining temporal coherence in longer texts [16].
The domain of NLP has undergone a profound shift with the advent of transformer architectures and pre-trained models. Termed Large Language Models (LLMs), these systems are trained on extensive text, such as the Wikipedia and Google Books datasets [10]. Utilizing unsupervised learning techniques, these models have exhibited exceptional language comprehension abilities [17]. They are adaptable for fine-tuning on specific tasks, even when only limited data are available, which has established them as the norm across a variety of NLP applications [10].

2.1. Large Language Models

LLMs such as Google’s BERT and OpenAI’s GPT, have garnered significant attention in recent years in both industry and academia [18] due to their versatitility and application across various domains. LLMs have the capability to solve general and domain-specific natural language tasks and are increasingly being used. However, the use of LLMs, such as ChatGPT and BERT, requires careful consideration. A recent study highlights the necessity of advancing AI models, and specifically LLMs, while also acknowledging their limitations in various tasks, especially in reasoning and robustness [18]. Notwithstanding this, there are numerous factors that require careful consideration when when training or using LLM models [19]. For example, issues related to the data on which the model is trained can arise. One such issue involves near-duplicate data [20], which, unlike fully duplicated data, is difficult to identify and address. Another issue is data contamination [21], where the training dataset includes elements from test or evaluation datasets. This contamination can lead to biased performance metrics, as the model may merely repeat memorized information instead of demonstrating genuine learning. Additionally, datasets used for training LLMs may contain personally identifiable information (PII) [22], such as phone numbers, personal identification, and email addresses, leading to privacy breaches.
Another issue associated with LLM models is tokenization, which has several drawbacks. For instance, the representation of the same information can vary significantly across different languages. Furthermore, discrepancies between the data used for training and the tokenized data can result in glitch tokens [19].

2.2. Bidirectional Encoder Representations from Transformers (BERT)

To understand BERT, it is important to acknowledge that pre-training linguistic models has significantly improved across various NLP tasks [10]. These tasks include natural language inference and paraphrasing, which involve analyzing sentence-level and token-level relationships to determine connections between sentences [10]. According to Devlin et al. (2018) [10], two main approaches emerged for incorporating pre-trained linguistic representations into downstream tasks: the feature-based approach, which extracts fixed contextual embeddings as features, and the fine-tuning approached, where pre-trained model’s parameters are adjusted for each specific task. The OpenAI GPT is illustrative of the generative pre-trained transformer approach, introducing minimal task-specific parameters and primarily relying on the fine-tuning of all pre-trained parameters for subsequent tasks. It is important to models like BERT, many pre-training methods used unidirectional contexts to learn general language representations. This approach can limit the capacity of pre-trained representations and the effectiveness of subsequent fine-tuning. Consequently, more advanced bidrectional models have been developed to address these limitations.
The transformer architecture has been pivotal in NLP, introducing an attention mechanism that allows models to focus on specific parts of the input for more accurate predictions [9]. Transformers use encoders to transform input data into vector representations and decoders to generate output data from these representations, Some models, such as BERT, rely only on encoders, while others like OpenAI’s GPT, use only decoders [23].
BERT, developed by Google, adopts a bidirectional approach and can be adapted for a wide range of NLP tasks. It employs two main training objectives: Masked Language Modeling (MLM), in which it predicts randomly masked tokens, and Next Sentence Prediction (NSP), where it determines whether one sentence logically follows another. These techniques help BERT learn word relationships bidirectionally, thereby enhancing language understanding [10].

3. Related Works

Pukelis et al. [24] introduced OSDG, an open-source tool designed to classify texts (e.g., scientific research and technological projects) and align them with specific SDGs. OSDG achieves this by extracting key text features, constructing an ontology, and mapping these items onto fields of study within the Microsoft Academic Graph (MAG). Through TF-IDF vectorization and cosine similarity, OSDG associates relevant MAG fields with input text. Subsequently, Pukelis et al. [25] extended this work with OSDG 2.0, which includes multi-language support through neural machine translation models, an enhanced user interface, and refinements to the classification methodology. OSDG 2.0 combines its keyword-based approach with machine learning model predictions, though the specific model used remains unspecified, and no experimental results are reported for either version.
Guisiano and Chiky [26] present a BERT model fine-tuned to classify texts into SDGs. They initially created a dataset of 169 lines from the official description of the UN Agenda 2030. To address its small size, they expanded it using the Natural Language Toolkit (NLTK) library for synonym-based augmentation, added texts from UN expert-supplied PDFs, and generated 300 synthetic samples per SDG using a Markov chain, reaching a final dataset of 6017 texts. The dataset was split 80% for training and 20% for validation. The model was fine-tuned for multi-label classification; no fine-tuning parameters were provided. Despite achieving a 94.21% validation accuracy, this result alone is insufficient to fully assess the model’s performance.
Matsui et al. [27] present a BERT-based model fine-tuned to classify Japanese texts into one or more SDGs. They created a dataset by manually extracting 1604 sentences from 41 documents published by the UN, the Japanese government, and the private sector. This dataset was expanded to 3758 sentences by splitting longer ones for compatibility with BERT’s input length. The authors applied nested cross-validation using five folds for inner validation to optimize hyperparameters and ten folds for outer validation to evaluate performance. The fine-tuned model achieved macro precision, recall, and F1-scores of 95%, 94%, and 95%, respectively. Moreover, each class-wise metric exceeded 90%.
Although the classification of the SDGs has been explored in previous research, it remains an area warranting further investigation. Our work differs from that of Pukelis et al. [24] through our use of LLMs. Furthermore, while Pukelis et al. [24] use ML techniques, they do not provide experimental results, making a direct comparison with our work impossible. We cannot compare our performance with that of Guisiano et al. [26] because the authors did not report any results for their BERT model beyond accuracy and their model was trained with an imbalanced dataset. Finally, the work presented by Matsui et al. [27] is similar to ours, but those authors focused on the Japanese language and employed a very small dataset for both training and evaluation. While Matsui et al. [27] approached the task as a multi-label problem, we developed a multiclass BERT model specifically tailored to the Brazilian context. By using abstracts from research projects at the top 25 Brazilian universities, we curated a dataset aligned with our specific classification objectives. This approach enabled a more comprehensive evaluation of our model, thus ensuring its applicability in a more generalized context.
By focusing on FACEPE-funded projects, our model’s evaluation gains relevance to both local development needs and global sustainability goals. This alignment ensures that the research outcomes not only contribute to global sustainability but also address specific local challenges. Our study addresses a key research gap by developing automated methods to monitor how scientific work aligns with the SDGs. This approach provides decision-makers with valuable insights, enabling them to better adjust policies and processes to meet the Agenda 2030 targets. Furthermore, our tool surpasses manual classification methods by improving accuracy, lowering costs, and reducing inherent biases. As a result, stakeholders can more comprehensively assess of scientific contributions toward specific SDGs, enabling stakeholders to identify and respond to gaps in SDG coverage more efficiently.
Although our study focuses on the Brazilian research context, our methodology can serve as a valuable framework for other countries interested in creating tailored LLMs for SDG classification. By adapting our approach, future work can improve the monitoring and alignment of national research efforts with Agenda 2030, potentially inspiring further localized applications on a global scale.

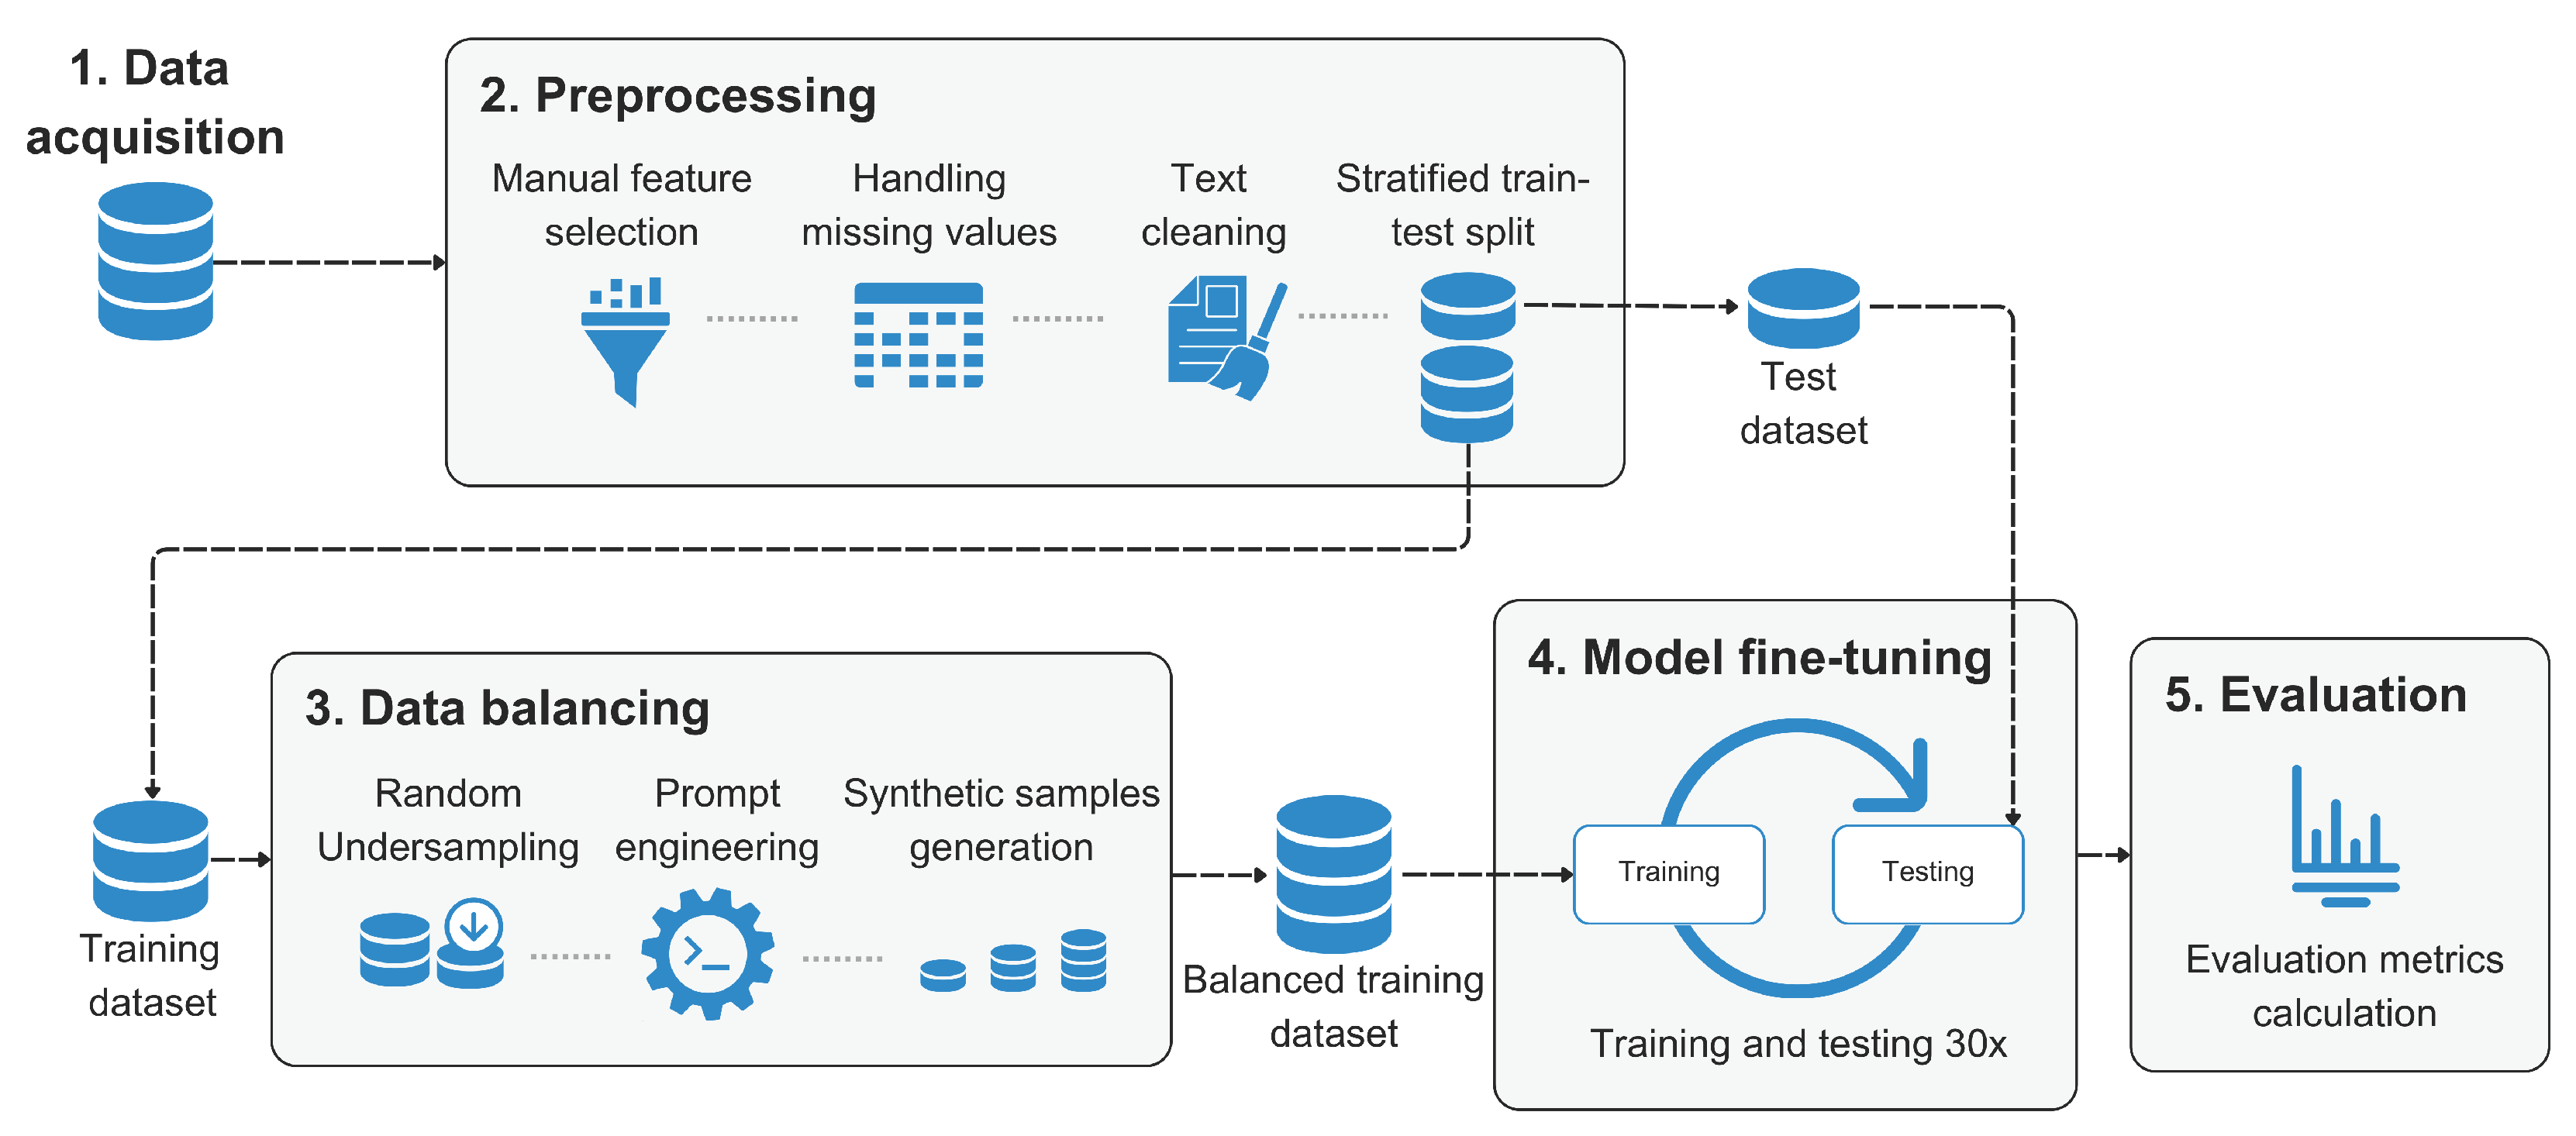
4. Material and Methods

Figure 1 summarizes the methodology used in this study. First, we compiled a dataset consisting of abstracts, as described in Section 4.1. Next, we preprocessed the data, which involved manual feature selection, addressing missing values, cleaning the text, and splitting the dataset into training and testing subsets. In Step 3, we balanced the dataset using a generative model to create new samples for the minority classes, following the approach of dos Santos et al. [11]. Step 4 the LLM model was fine-tuned using the augmented training dataset. Finally, we evaluated the model’s performance using the test dataset and developed a dashboard to visualize the distribution of research projects across the SDGs.

4.1. Data Acquisition

As the target texts to classify in our study were abstracts of Brazilian research projects written in Portuguese, we used abstracts of scholarly articles written in Portuguese by Brazilian researchers as proxy data for training and testing our model. This is consistent with the approach used by Morales-Hernandez et al. [5]. Abstracts of scholarly papers published by researchers from the top 25 Brazilian universities listed in the 2023 Center for World University Rankings [28] were collected from the Scopus database via Scival.
As described in Table 1, the dataset initially consisted 15,488 abstracts of scientific articles authored by Brazilian researchers, each classified into one of the 17 SDGs, covering the period from 2013 to 2023. After preprocessing, the dataset was reduced to 13,789 samples. The training subset contained 11,030 samples, while the balanced training subset comprised 5100 samples. The testing subset included 2759 samples. The original, pre-processed, and balanced datasets are publicly available on Mendeley Data and can be accessed through the following link: https://doi.org/10.17632/hzgs5kz2bc.1 accessed on 5 October 2024). Following the steps outlined in our methodology, we applied additional preprocessing steps to prepare the data for fine-tuning to ensure compatibility with our model.

4.2. Preprocessing

In the preprocessing step (step 2 of Figure 1), we prepared the data for model training by selecting relevant features and removing samples with missing values and duplicates. Records with missing values were excluded because the model cannot process them, and duplicates were removed to prevent bias. The initial dataset included records associated with both single and multiple SDGs. Since we approached this as a multiclass classification problem—where each record should belong to only one class—we retained only the records associated with a single SDG. This ensured that each sample had a clear and singular label, simplifying the model’s task of distinguishing between classes.
To classify texts into one of the SDGs, the model required only the abstract text and its corresponding SDG label. As the model learns patterns from the text itself to predict the correct SDG classification, additional columns were deemed redundant or irrelevant. Retaining only these two essential columns minimized the risk of introducing noise. The original dataset included several columns: a string column indicating the SDG number (e.g., “SDG n”), Boolean columns for each SDG with True for the relevant SDG and False for others, and a numerical column encoding SDGs as integers. These columns provided no new information beyond what was already captured in the label column, so they were excluded. We retained only the abstract and its corrsponding label for further analysis. The text was then cleaned to improve consistency and readability. This incvolved normalizing text to lowercase, removing non-letter characters, numbers, URLs, stop words, and extra spaces. For stop word removal, we used the default English stop word dictionary from the NLTK library [29].
The final task in the preprocessing phase was splitting the dataset into training and testing subsets. We allocated 80% of the data for training and 20% for testing, balancing the trade-off between maximizing training data and adhering to the commonly accepted splitting practices. A stratified split was performed to ensure that the proportion of each class label in the training and testing subsets mirrored their distribution in the original dataset. This step is particularly important for imbalanced datasets, as it ensures that the testing subset accurately reflects the overall class distribution, enabling the model to generalize effectively. In contrast, a random split could lead to discrepancies in class proportions, potentially compromising the model’s performance on unseen data. With the data prepared, we proceeded to the next step of our methodology: data balancing.

4.3. Data Balancing

Step 3, as illustrated in Figure 1, involves using a generative model to balance the dataset as per [11]. To ensure data leakage was avoided when training our models [30], this process was performed on the training data only, the testing set remained unchanged with real samples only. The dataset was imbalanced, with the majority class SDG 3 (Good Health and Well-being) having 7771 samples and the minority classes having three samples.
Since the generative model requires substantial computational power and time, we aimed to generate as few samples as necessary. The classification results using the imbalanced training subset indicated that approximately 300 samples were sufficient to achieve metrics exceeding 70%. To achieve this, we applied a random undersampling technique to reduce the majority class to 300 samples. For the minority classes, we used a generative model to create new samples. The resulting balanced training subset was then used to fine-tune BERT.

Synthetic Sample Generation

Generative models have been widely used in NLP tasks, such as text generation, translation, question answering, and summarization. These tasks are essentially text generation tasks, where the model generates text based on a prompt. This generation capability can be leveraged to create new samples to balance a text classification dataset and improve the classification model’s performance [11,31]. In this work, we utilize a methodology for data balancing using generative pre-trained LLMs to balance the dataset based on dos Santos et al. [11].
We use real abstracts as examples to guide the generative model in producing new samples. To accomplish this, we calculate the number of samples needed to match the majority class and divide this number by the total number of real abstracts. The generative model then generates approximately the same number of synthetic samples for each real abstract. If the division is not exact, the model generates a extra samples from randomly selected real abstracts with the same label.
The first step in using the pre-trained generative model is to engineer a clear and concise prompt to guide the model. This is crucial, especially for data balancing, as the outputs should maintain the same structure as the original data while using different words to avoid direct duplication. We aimed to generate abstracts with a basic structure of context, objectives, methods, results, and conclusions. We designed a prompt with instructions to generate a new abstract based on an existing real one. Providing a real example improved the coherence of the generated samples and significantly reduced hallucinations. By including a concrete example the model’s responses more closely following the desired structure and content flow. Our tests revealed that generations produced without an example were less coherent and more prone to hallucinations.
Prompt engineering is subjective and often involves trial and error but general guidelines can improve sample quality. We followed techniques from OpenAI [32], including the following: (a) Include details in your query to obtain more relevant answers; (b) Use delimiters to clearly indicate distinct parts of the input; (c) Provide examples. Figure 2 shows our prompt engineering process, highlighting the importance of each component for guiding the generative model’s output and improving consistency.
The prompt itself is a dictionary with keys “role” and “content” where “role” indicates who is sending the message in the chat, in this case, the user, and “content” is the actual message sent to the model. The content includes instructions composed of a base directive to instruct the model on what to generate, details to obtain more relevant results, and an indication of delimiters where the example abstract will be inserted. The base directive specifies that the model should “generate a new abstract”, and details further clarify that the output should align with scientific writing conventions while maintaining fidelity to the structure of the example. After that, we provide the opening delimiter, the abstract text inside it, and the closing delimiter. We chose this delimiter because it is not present inside any real abstract in our database. Table 2 shows examples of a real and a generated abstract.
The generated abstract closely resembled the original, adhering to the same structure with an introduction, objective, methodology, results, and conclusions but varies in word choice, sentence structure, and size. We manually reviewed over 30 randomly selected samples, confirming the consistent pattern and providing qualitative validation of the model’s output. This approach ensured that the generated abstracts preserved the original format and thematic elements, reinforcing the reliability of our model’s outputs for downstream tasks. However, the generative model occasionally produced some irrelevant information, such as starting the abstract with “Abstract:” or attempting to include a word count at the end. This issue was observed in the majority of generated samples and was addressed by removing such elements using regular expressions.
Overall, the quality of the generated samples was satisfactory, with coherent text and a similar structure to the real abstracts. The model was able to generate new samples for the minority classes, which were then used to balance the dataset.
The generative model we selected was Mixtral-8x7B-Instruct-v0.1, obtained from the Hugging Face Hub with model ID: “mistralai/Mixtral-8x7B-Instruct-v0.1” [33] using the transformers library. We also used its corresponding tokenizer with the same ID to convert the input data into a numerical vector representation comprehensible by the model.
Mixtral-8x7B is a generative Sparse Mixture-of-Experts (MoE) model that uses a router network to choose 2 out of 8 groups of parameters (experts) for each token, combining their outputs [34]. This approach increases the model’s parameter count without significantly raising computational costs. Pretrained with multilingual data and a 32k token context size, Mixtral surpasses larger models like Llama 2 (70B parameters) and GPT-3.5 (175B parameters) in tasks requiring mathematical reasoning, code generation, and multilingual understanding [34].
The Mixtral-8x7B-Instruct is a variant fine-tuned for instruction-following, optimized for conversational use, such as in chat applications. Despite using only 13B active parameters per token, the model matches or outperforms other state-of-the-art instruction-folowing models available at the time, such as Chat GPT-3.5 Turbo, Claude-2.1, and Google’s Gemini Pro, each of which employs over 70B parameters. Human evaluation benchmarks affirm this performance, making Miztral-8x7B the first open-source MoE (Mixture of Experts) model to achieve state-of-the-art performance.
To optimize the model’s performance and reduce computational costs, we applied quantization techniques. Quantization is the process of reducing the precision of the model’s weights and activations by representing them with integers instead of, for example, floating points. Floating points can lead to lower memory usage and faster computation with minimal impact on performance. We used the quantization techniques present in the Hugging Face framework, implemented with the Python library bitsandbytes. For our experiments, we utilized lower precision parameters, as detailed in Table 3.
As shown in Table 3, we used the following non-default quantization parameters: load_in_4bit set to True; this parameter ensures the model is loaded with 4-bit precision. Also, bnb_4bit_use_double_quant was set to True; this enables double quantization, which helps in reducing the quantization error.
The parameter bnb_4bit_quant_type set “nf4” specifies the type of quantization. NF4 is a non-uniform quantization type that often provides better performance than uniform quantizations. The last parameter, defined by bnb_4bit_compute_dtype was set to torch.bfloat16; it specifies the computation data type as bfloat16, which is a floating-point format efficient for training and inference on modern hardware accelerators.
With the quantization process described above, we were able to run and load the model using an AWS EC2 instance with 4x Nvidia L4 24 GB Tensor Core GPUs and generate samples in 43 s on average.
In the process of sample generation, we configured a GenerationConfig object with the generation parameters, which was applied each time a new sample was generated. We chose the parameters empirically to ensure the generated samples were coherent and varied. The parameters used for the generation configuration are detailed in Table 4.
As shown in Table 4, the first two parameters define the range of new tokens in the generated output; we set the min_new_tokens to 264, the average token size of a real paper abstract in our dataset, and max_new_tokens was set to 280 to give some room for the model to finish the last sentences.
The do_sample parameter, set to True, enables the sampling of tokens, which is crucial for generating diverse outputs.
To introduce variability in the generated data, we varied the temperature between 0.5 and 0.7 to adjust the randomness of the token sampling process. This range achieved a balance between randomness and coherence: lower values make the generation more deterministic, while the moderate values we chose allow for diversity without sacrificing grammatical and semantic relevance. We also varied top_k between 5 and 20, which limits the sampling pool to a small set of the top k most likely tokens at each step, maintaining focus and coherence in the generated text by avoiding overly random or nonsensical outputs.
Additionally, top_p was set to 1, disabling nucleus sampling, which aligns with our approach to generating text with consistent structure and thematic focus. We also set exponential_decay_length_penalty to 264, starting after 10 tokens; this penalizes longer sequences exponentially after 10 tokens, which forces the model to start finishing the last few sentences when it reaches the average abstract length that we set in min_new_tokens. We found that this configuration ensures that the model generates text that aligns with the expected format.
An encoder_repetition_penalty of 0.9 was applied to discourage repetitive sentences. Finally, the pad_token_id, bos_token_id, and eos_token_id parameters were obtained directly from the tokenizer to ensure appropriate handling of special tokens across all stages of text generation. Following the completion of the data balancing phase, we now turn our attention to the subsequent fine-tuning process, outlining the parameters employed to fine-tune the model.

4.4. Model Fine-Tuning

We used Hugging Face’s Transformer library to obtain a BERT model with id ‘bert-base-uncased’. The model parameters were selected based on empirical observations of training metrics across epochs and are summarized in Table 5. Specifically, we set the learning rate to 5 × 10 6 , allowing gradual adjustments to model weights without causing oscillations. A batch size of 4 was selected to enhance generalization, as smaller batch sizes are known to help prevent overfitting and improve the model’s adaptability. The model was trained for 10 epochs to ensure sufficient exposure to the data without excessive training.
The optimizer was configured as AdamW, with beta parameters set to 0.9 and 0.999, providing a balance between momentum and stabilization during training. The epsilon (EPS) was set to 1 × 10 6 to improve numerical stability by preventing division by zero. Weight decay was set to 0, as the dataset size and model configuration did not necessitate regularization. At the end of each epoch, the model was saved, and the best-performing model was identified by selecting the model from the epoch with the lowest validation loss. With the model training complete and key parameters optimized, we proceeded to evaluate its performance using the metrics outlined in the following section.

4.5. Evaluation

In the final step, the model’s performance metrics were computed using the test subset, which contained only real samples (i.e., not those generated during the data balancing step). To evaluate the model’s performance, we adopted a method similar to repeated random sub-sampling [35]. Specifically, the model was trained and tested 30 times, with the data shuffled for each iteration, and the mean of the metrics calculated. Unlike traditional repeated random sub-sampling, which typically divides data into subsets, our approach used the entire training subset in every iteration. This ensured consistent representation of all classes, thereby mitigating potential class imbalance issues that could arise from randomly sub-sampling smaller test sets. Performance was assessed using common classification metrics: f1-score, precision, and recall. For both experiments, the metrics were calculated on a per class basis.
In this section, we present the evaluation metrics used to assess the performance of the predictive model. These metrics are fundamental to understanding how well the model distinguishes between different classes and handles both positive and negative predictions. The primary metrics discussed include Precision, Recall, F1-Score, and F1-macro average. Each of these metrics offers a unique perspective on the model’s performance and effectiveness, ensuring a comprehensive evaluation. Below, we provide detailed explanations and the mathematical formulations for each metric.

4.5.1. Precision

Precision metric evaluates whether the model correctly predicted the TP cases and is calculated with the number of TP divided by the sum of TP and FP, as shown in Equation (1)
p r e c i s i o n = T P T P + F P

4.5.2. Recall

Recall is the metric that evaluates whether the model correctly predicted the cases of TP, calculating the number of TP by the sum of TP and FN, as show in Equation (2).
R e c a l l = T P T P + F N

4.5.3. F1-Score

F1-score metric is the harmonic mean between the precision and Recall metrics, being calculated as shown in Equation (3)
F1-score = 2 × p r e c i s i o n × R e c a l l p r e c i s i o n + R e c a l l

4.5.4. F1-Macro Average

The F1-macro average (F1-macro) is a variant of the F1-score, composed of the average of the F1-score of the positive class and the F1-score of the negative class (Equation (4)). The more the model hits the prediction in both classes (positive and negative), the F1-macro tends to indicate, in general, a degree of model correctness without bias by a balanced or imbalanced dataset.
F1-macro = 1 m i = 1 m F1-score i

5. Results

To assess the model’s performance, we followed a method similar to repeated random sub-sampling [35]. Specifically, we trained and tested the model 30 times, shuffling the data each time, and calculated the mean of the performance metrics. We evaluated the model using common classification metrics: F1-score, Precision, and Recall, defined in Section 4.5. For both experiments, these metrics were calculated per class. The results, presented in Table 6, compare the performance of the model trained on the original imbalanced dataset with that of the model trained on the augmented dataset.
To balance the data, we randomly undersampled the majority classes to 300 samples. As previously mentioned, the imbalanced experiment indicated that approximately 300 samples were sufficient to achieve metrics exceeding 70%. This approache was necessaru to minimize computational costs. To further balance the dataset, we generated synthetic samples using an LLM, as discussed in Section 4.3.
In Table 6, the SDGs are described as follows: 1—No Poverty; 2—Zero Hunger; 3—Good Health and Well-being; 4—Quality Education; 5—Gender Equality; 6—Clean Water and Sanitation; 7—Affordable and Clean Energy; 8—Decent Work and Economic Growth; 9—Industry, Innovation, and Infrastructure; 10—Reduced Inequality; 11—Sustainable Cities and Communities; 12—Responsible Consumption and Production; 13—Climate Action; 14—Life Below Water; 15—Life on Land; 16—Peace, Justice, and Strong Institutions; 17—Partnerships for the Goals. These goals aim to address urgent global challenges to foster a better and more sustainable world.
In Table 6, the first column presents the model’s performance when trained on the original imbalanced dataset, while the second column shows its performance when trained on the balanced dataset. The results are presented for each of the 17 SDGs, using the F1-score, Precision, and Recall metrics. The last column indicates the number of samples used for training in each case.
As observed in Table 6, the model trained on the augmented dataset outperformed the model trained on the imbalanced dataset in most cases, particularly with respect to recall. It achieved higher recall in 11 out of 17 SDGs, whereas the imbalanced dataset produced higher recall in 6 out of 17 SDGs.
When analyzing the results, significant improvements were noted in recall, precision, and F1-score for SDGs such as SG5 and SDG8, which initially showed no effective results with the imbalanced dataset. The real samples in these cases lacked sufficient representation for the model to capture key patterns. However, synthetic data augmentation appears to have successfully enhanced these these patterns, enabling better recognition. For SDG5, recall increased dramatically from 0% to 96.67%, illustrating the efficacy of synthetic samples in addressing underrepresented edge cases. Other SDGs did not exhibit similar improvements, likely due to an already adequate representation in the original dataset or limitations in the synthetic samples’ ability to replicate the complexity of these SDGs.
When considering the trade-offs between precision and recall, we observed that while recall improved significantly for SDG5 and SDG8, this often came at the expense of precision. This is because the model, when increasing its sensitivity to identify relevant samples, also tended to classify some unrelated samples as belonging to the SDG. These trade-offs are critical to evaluate, as improving recall can sometimes result in reduced precision, depending on the characteristics of the dataset and the class distribution.
To better understand the results in Table 6, we analyzed standard deviations (SDs) to assess model stability. Lower SDs generally indicate more reliable and consistent performance. In the imbalanced model, five SDGs had SDs exceeding 5% for F1-score, while precision remained stable with SDs below 1%. However, recall exhibited greater instability, with some SDs exceeding 20%. The balanced model demonstrated overall lower SDs, with most below 1% for precision and 5% for F1-scores. Although SDG5 and SDG8 displayed higher recall variability, the balanced model was more stable compared to its more imbalanced counterpart.

5.1. Classification of FACEPE Research Projects

We used the model to classify 7537 FACEPE research projects into one of the 17 SDGs. Since there is no predefined “unrelated class”, the model assigns each project to one of the 17 classes, even when a project may not aligned wih any SDG. To address this limitation, we introduced a new “unrelated” class. Projects were classified as unrelated if the model’s maximum prediction probability was below 80%. Table 7 presents the distribution of the projects classified by the model, comparing results with and without applying the 80% threshold for the “unrelated” class.
In Table 7, the model classified 6137 projects as unrelated to any SDG, accounting for 81.3% of the total. The remaining 1400 projects were categoized into one of the 17 SDGs. Among these, the most frequently represented were SDG3 (Good Health and Well-being), SDG4 (Quality Education), and SDG11 (Sustainable Cities and Communities), with 288, 232, and 274 projects, respectively. Conversely, the least represented SDGs were SDG1 (No Poverty), SDG8 (Decent Work and Economic Growth), and SDG17 (Partnerships for the Goals), with 0, 7, and 0 projects, respectively. As FACEPE did not collect self-reported SDG categories, we cannot calculate metrics for FACEPE projects’ classification due to the absence of a ground truth.
Table 7 shows that many research projects previously classified under specific SDGs are now categorized as “unrelated”. This shift reflects their predicted probabilities fell below the 80% threshold, making it difficult to confidently assign them to an SDG. A manual review revealed that “unrelated” projects are are highly theoretical, lacking a specific practical focus that aligns with any SDG. Although quantitative metrics for this class cannot be calculated due to the absence of a ground truth, the inclusion of this category improves overall classification quality by preventing ambiguous or forced categorizations. This approach ensures clearer SDG relevance in the results.

5.2. Dashboard

To facilitate the visualization and exploration of the model classification results by end users, we developed an interactive dashboard, which is presented in Figure 3 and available online at the following link: https://bit.ly/facepe-ods (accessed on 9 December 2024). We built the dashboard using Microsoft Power BI (https://www.microsoft.com/power-platform/products/power-bi) (accessed on 9 December 2024), a data analysis and visualization platform that offers a range of interactive visual representation options. We selected this platform primarily to facilitate the technology transfer process to FACEPE’s IT staff. PowerBi dashboards are easier to maintain and deploy compared to other code-based solutions such as Plotly Dash (https://dash.plotly.com (accessed on 9 December 2024)) and Streamlit (https://streamlit.io (accessed on 9 December 2024)).
The dashboard currently enables users to explore projects from two FACEPE funding programs, PBPG and PIBIC, classified by our model according to the UN SDGs. Figure 3 displays the results for the PBPG program. Users can switch to the PIBIC program via the menu bar at the top of the page (Figure 3A). For each program, the dashboard provides two tabs for data exploration: “Visão Geral” (Overview) and “ODS” (SDG) (Figure 3B). The contents these tabs are shown in the left and right panels of Figure 3, respectively. The Overview tab provides general information about the projects, while the SDG tab focuses on the classification of these projects according to the SDGs.
At the top of the Overview tab (Figure 3C), the dashboard offers six filtering options year, city, proponent institution, region, knowledge area, and graduate program. Additionally, it displays five key performance indicators (KPIs) (Figure 3D). Below the KPIs panel, visualizations are presented in this order: a line chart with the number of projects per year, two bar charts for the number of projects by course level (MSc or PhD) and by knowledge area, a choropleth map representing the geographical distribution of projects across the state, and two bar charts detailing the number of projects broken down by graduate program and proponent institution. At the bottom of the panel, a table lists the details of all projects shown in the charts. Cross-filtering is enabled in all charts, allowing users to refine their analysis by interacting with the charts in addition to using the the filter panel (Figure 3C). These interactions dynamically update the other vizualisations and the table.
Similarly, the SDG tab includes a filter panel with additional functionality for filtering based specific SDGs, styled with the UN official icons for easy recognition). It also features a KPI panel (Figure 3F and Figure 3G, respectively) and a table listing project details. At the top of this tab, a line chart provides an overview of the number of projects by year classified as related (blue line) and unrelated (red line) to SDGs. This chart offers a fixed global view of SDG adherence in the fundeded projects and for this reason, remains unaffected by filters.
Below the KPI panel (Figure 3G), the dashboard provides three additional charts for exploring project alignment with SDGs: a bar chart with the distribution of projects by SDG, a choropleth map illustrating the geographical distribution of projects across the state, and a line chart with the number of projects for each SDG over time. Cross-filtering is also enabled in this tab, allowing users to select one or more SDGs to analyze their geographical distribution in the choropleth map and their temporal trends in the line chart.
The visualizations in the dashboard facilitate the identification of patterns, trends, and gaps in current research initiatives. From a policy-makers’ perspective, the tool can help direct efforts and allocate resources more strategically to areas of greater need, thereby promoting a more targeted approach to achieving global objectives. For FACEPE, this dashboard serves as a vital mechanism for transparency and accountability to the public, given that the resources originate from state taxpayers.
From the general public’s point of view, the tool enables citizens to monitor how public funds are allocated to research projects, assess whether these projects align with SDGs, and examine the geographical distribution of investments across the state. This information empowers citizens to better understand the state’s efforts toward fostering SDG-aligned research and to influence policy-making by advocating for investments in underfunded areas or regions.
This version of the dashboard has been presented to FACEPE’s executive team. Feedback from FACEPE indicated that the tool could be valuable in drafting new funding calls and in monitoring the impact of incentives aimed at prioritizing projects aligned with the SDGs. Additionally, the dashboard is being integrated into FACEPE’s website, where it will be accessible to both internal staff and the general public.

6. Discussion

By automating the classification of research projects into SDGs and visualizing the data in a user-friendly dashboard, this initiative aids government agencies in making informed decisions more efficiently. The data available through the dashboard helps policy-makers to identify research gaps, monitor progress toward achieving the SDGs, and ensure that public funds are effectively allocated to high-impact research areas. Moreover, the transparency afforded by the public availability of the dashboard enhances accountability and fosters public trust in government-sponsored research.
The dashboard’s underlying model is an LLM (see Figure 3). Initially, we fine-tuned BERT with an imbalanced dataset and observed promising performance for SDGs with just under 300 samples or more. However, its performance deteriorated for SDGs with fewer samples. To address this, ee undersampled the majority classes to 300 samples and explored generative models for data balancing. After fine-tuning with 300 samples per class, we compared the results. The use of generative AI as a data augmentation technique for balancing the dataset as per [11] is state-of-the-art among open-source models. This technique demonstrates comparable performance with recent closed-source models while consuming less computational power [34]. Nonetheless, quantization was necessary, and the model generated samples in an average time of 46 seconds.
To guide the model in generating new samples for data balancing, we crafted a prompt that incorporated an example and empirically tested instructions. Despite the abstract nature of this process, we followed a structured approach based on guidelines provided by OpenAI [32]. This involved instructing the model to generate new samples modeled on real ones. The generated samples exhibited a similar textual structure to the real samples, providing synthetic diversity to the dataset.
While the balanced model showed potential, it did not achieve our goal surpassing 80% in most performance metrics. The imbalanced model performed better for some classes, but the balanced model exhibited greater consistency, as evidence by lower SDs. This suggests that balancing alone was insufficient to enhance model performance with only 300 samples per class, highlighting the need for further data augmentation Generative models were chosen for their ability to provide more diverse synthetic samples compared to data duplication methods. This method proved effective in increasing recall.
SDG5 (Gender Equality) and 8 (Decent Work and Economic Growth) scored 0 in all metrics when trained with the imbalanced dataset, indicating no true positives were found in at least one of the 30 train-test repetitions (see Table 6). However, with the balanced model, these metrics improved, demonstrating the model’s ability to identify true positives in at least one of the 30 train-test repetitions (see Table 6). These SDGs, which had only 11 and 30 real samples, respectively, illustrate that the model can classify the real testing samples even when trained predominantly on synthetic data. Most SDGs exhibited higher recall with the balanced model, indicating that the model was able to identify more true positives and fewer false negatives. However, a slight drop in precision was observed for some classes, reflecting an increase in false positives. This finding underscores the trade-ff between recall and precision when implementing data balancing techniques.
Our findings provide further evidence supporting the effectiveness of generative models for data balancing building on the work of dos Santos et al. [11]. While additional data augmentation could further improve performance, it woould require significant time and computational resources, given the expense of generative models. Nonetheless, this approach offers an alternative to traditional data augmentation methods, providing a more diverse dataset rather than relying on simple duplication or noise addition.
From a practical perspective, this study offers a valuable tool for policy-makers and research funding agencies, extending beyond FACEPE. By implementing AI-driven classification models, agencies can ensure a closer alignment between funded research projects and the SDGs, optimizing the impact of public investments. Furthermore, the deployment of data visualization platforms such as PowerBI facilitates real-time monitoring and enhances decision-making, allowing managers to make informed choices regarding future funding calls and resource allocation.

Limitations and Future Directions

This study has several key limitations that should be acknowledged. First, the use of synthetic data for balancing may have introduced biases into the model. Although the generated data were designed to resemble real samples closely, its representativeness may still fall short of covering the diversity found in the original dataset, potentially limiting the model’s generalizability when applied to real-world data. The reliance on synthetic samples, especially in classes with very few real examples, could lead to overfitting on the synthetic features rather than capturing the true patterns within the data.
Another important limitation is the computational cost involved. Generating synthetic samples took an average of 46 s per sample, representing a significant burden in training processes that involve larger datasets. Additionally, quantization was necessary to reduce resource demands, underscoring the approach’s high computational requirements, which may limit its practical application in resource-constrained settings. While the balanced model exhibited greater consistency, its performance in some classes—particularly those with few real examples, such as SDGs 5 and 8—remained below target levels, suggesting that further efforts, such as increasing real data samples or exploring more robust balancing techniques, may be needed to achieve optimal results.
Additionally, we did not mention exploring alternative data balancing techniques or different model architectures, which could be valuable for other researchers looking to build on this work. To address this, we utilized one model to augment the dataset and a separate model for classification, which may pave the way for future investigations on how to effectively combine different modeling and data balancing approaches.
In conclusion, this study highlights the significant impact of using generative models for data balancing in the classification of research projects aligned with the SDGs. Our findings reveal that the balanced model successfully identified true positives for SDGs 5 and 8 in all 30 repetitions, demonstrating its capability to classify real testing samples despite being predominantly trained on synthetic data. This advancement not only improves the model’s overall recall but also addresses critical research gaps identified in these underrepresented SDGs. Furthermore, the creation of a dashboard facilitates informed decision-making by policy, enabling them to allocate public funds effectively and monitor progress toward the SDGs. By establishing a framework that leverages AI for enhancing data representation, this research contributes valuable methodologies that can be adapted by other researchers and policymakers aiming to improve the alignment of research initiatives with sustainable development objectives.

7. Conclusions

This study introduces a novel method for classifying research projects against the UN’s SDGs, using a dataset composed of paper abstracts, which are similar to the text intended to be classified. The dataset was highly imbalanced, with some SDGs having significantly more samples than others. To address this, we employed a generative model to balance the data, offering a fresh approach compared to traditional methods, such as duplication or undersampling, by creating a more representative and diverse set of synthetic samples.
The balanced model achieved notable improvements, with recall increasing in 11 out of 17 SDGs, achieving substantial gains in recall and F1-score for classes such as SDG 5 and SDG 8, which initially had no effective results on the imbalanced dataset. For example, SDG 5’s recall rose from 0% in the imbalanced dataset to 96.67% with balanced augmentation, underscoring the effectiveness of the generative approach (see Table 6). Overall, the balanced model achieved better consistency in performance across classes, with lower SDs in the F1-score and precision across most SDGs, indicating greater model stability. Results indicated that the balanced model generally outperformed the imbalanced model in recall. While the balanced model displayed potential, it did not reach metrics surpassing 80% for most classes, indicating the necessity for additional data.
Our research encountered several key challenges that shaped the implementation process. First, the available dataset for fine-tuning was highly imbalanced, which risked skewing the model’s learning. To address this, we balanced the data by generating synthetic samples using a text generation LLM. While the prompt engineering was straightforward, using the selected LLM, a state-of-the-art open-source model with over 56 billion parameters, was computationally intensive. As a result, we relied on a pre-trained state of it to generate balanced samples. Generating each sample took 46 s on average, making it infeasible to fine-tune this large model for text generation.
This work utilized a method that uses generative models to balance datasets during LLM fine-tuning for classification tasks, which is similar to the approach introduced by dos Santos et al. [11]. While in this work, 300 samples proved insufficient for achieving metrics over 80%, additional augmentation could improve performance at the cost of increased computational resources. Nevertheless, this method offers a fresh approach for dataset enhancement, providing a more varied dataset compared to traditional methods. More investigation is needed to better analyze and compare the effectiveness of using generative models with other data augmentation techniques.
Future work will focus on improving the model’s performance by further augmenting the dataset with generative models. We also suggest the use of other generative models and fine-tuning strategies to enhance the model’s performance. Additionally, we aim to expand the dashboard’s analytical capabilities, incorporating more detailed visualizations and refining the front end.
Adopting artificial intelligence and visualization technologies transforms how government agencies manage and direct research funding, thus ensuring alignment with global sustainability goals. This strategy not only streamlines administrative processes but also amplifies the impact of research funding toward achieving substantial progress in sustainability. Initiatives like the present work will help track the progress of SDGs toward sustainability. This is a crucial step for ensuring that the world is on track to achieve the 2030 Agenda.
While this study focused on classifying projects according to the SDGs, the use of generative models for data balancing has potential applications beyond this context. This method could benefit fields with highly imbalanced datasets, such as healthcare, where balancing data can enhance predictions for rare conditions, or public policy analysis, where sampling biases impact feedback analysis. Thus, this research not only contributes to the alignment of research funding with sustainability goals but also sets a foundation for applying generative synthetic data in various sectors where data imbalance hinders robust analysis.
To facilitate the practical adoption of these findings, we suggest that government agencies use the recommendations from this study in public policy formulation and resource allocation. The implementation of AI tools, such as this classification method, allows for a strategic analysis of funded projects based on the SDGs, promoting greater transparency, a more efficient allocation of resources to underrepresented SDGs, and increased accountability from public entities regarding sustainability commitments. Efforts like these not only support tracking progress toward the achievement of the 2030 Agenda but also encourage a cycle of sustainable innovation, enabling more careful planning for achieving global sustainability goals.

Author Contributions

Conceptualization, M.H.L.F.d.S.B., L.M.N. and P.T.E.; methodology, M.H.L.F.d.S.B., L.M.N. and P.T.E.; software, L.M.N., G.L.S., R.C.L.d.S. and R.C.d.S.L.; validation, G.L.S., T.L., R.A.D. and P.T.E.; data curation, M.H.L.F.d.S.B., L.M.N., R.C.L.d.S. and R.C.d.S.L.; writing—original draft preparation, M.H.L.F.d.S.B., L.M.N. and P.T.E.; writing—review and editing, M.H.L.F.d.S.B., L.M.N., P.T.E. and T.L.; L.M.N., R.C.L.d.S., R.C.d.S.L., R.A.D. and P.T.E.; supervision, T.L., R.A.D. and P.T.E.; project administration, P.T.E.; funding acquisition, P.T.E. All authors have read and agreed to the published version of the manuscript.

Funding

This research was funded by Fundação de Amparo à Ciência e Tecnologia do Estado de Pernambuco (FACEPE), grant number APQ-1696-1.03/22.

Institutional Review Board Statement

Not applicable.

Informed Consent Statement

Not applicable.

Data Availability Statement

The original, pre-processed, and balanced dataset are publicly available on Mendeley Data and can be accessed through the following link: https://doi.org/10.17632/hzgs5kz2bc.1.

Acknowledgments

We would like to thank the Conselho Nacional de Desenvolvimento Científico e Tecnológico (CNPq), Fundação de Amparo à Ciência e Tecnologia do Estado de Pernambuco (FACEPE), Secretaria de Ciência, Tecnologia e Inovação do Estado de Pernambuco (SECTI), and Universidade de Pernambuco (UPE).

Conflicts of Interest

The authors declare no conflicts of interest.

References

  1. United Nations. United Nations Sustainable Development Goals. 2024. Available online: https://sdgs.un.org/goals (accessed on 24 April 2024).
  2. Stevens, C.; Kanie, N. The Transformative Potential of the Sustainable Development Goals (SDGs). 2016. Available online: https://ideas.repec.org/a/spr/ieaple/v16y2016i3d10.1007_s10784-016-9324-y.html (accessed on 9 December 2024).
  3. The Sustainable Development Goals Report 2023: Special Edition Towards a Rescue Plan for People and Planet. 2023. Available online: https://unstats.un.org/sdgs/report/2023/ (accessed on 8 December 2024).
  4. Asadikia, A.; Rajabifard, A.; Kalantari, M. Navigating sustainability: Key factors in prioritising Sustainable Development Goals. Sustain. Sci. 2024, 19, 2041. [Google Scholar] [CrossRef]
  5. Morales-Hernández, R.C.; Jagüey, J.G.; Becerra-Alonso, D. A Comparison of Multi-Label Text Classification Models in Research Articles Labeled With Sustainable Development Goals. IEEE Access 2022, 10, 123534–123548. [Google Scholar] [CrossRef]
  6. Smith, T.B.; Vacca, R.; Mantegazza, L.; Capua, I. Natural language processing and network analysis provide novel insights on policy and scientific discourse around Sustainable Development Goals. Sci. Rep. 2021, 11, 22427. [Google Scholar] [CrossRef] [PubMed]
  7. Guisiano, J.E.; Chiky, R.; De Mello, J. SDG-Meter: A deep learning based tool for automatic text classification of the Sustainable Development Goals. In Proceedings of the Asian Conference on Intelligent Information and Database Systems, Ho Chi Minh City, Vietnam, 28–30 November 2022; pp. 259–271. [Google Scholar]
  8. Sashida, M.; Izumi, K.; Sakaji, H. Extraction SDGs-related sentences from Sustainability Reports using BERT and ChatGPT. In Proceedings of the 2023 14th IIAI International Congress on Advanced Applied Informatics (IIAI-AAI), Koriyama, Japan, 8–13 July 2023; pp. 742–745. [Google Scholar]
  9. Vaswani, A.; Shazeer, N.; Parmar, N.; Uszkoreit, J.; Jones, L.; Gomez, A.N.; Kaiser, Ł.; Polosukhin, I. Attention is all you need. Adv. Neural Inf. Process. Syst. 2017, 30, 6000–6010. [Google Scholar]
  10. Devlin, J.; Chang, M.W.; Lee, K.; Toutanova, K. Bert: Pre-training of deep bidirectional transformers for language understanding. arXiv 2018, arXiv:1810.04805. [Google Scholar]
  11. dos Santos, V.G.; Santos, G.L.; Lynn, T.; Benatallah, B. Identifying Citizen-Related Issues from Social Media Using LLM-Based Data Augmentation. In Advanced Information Systems Engineering: CAiSE 2024; Lecture Notes in Computer Science; Springer: Berlin/Heidelberg, Germany, 2024; pp. 531–546. [Google Scholar]
  12. Chowdhary, K.; Chowdhary, K. Natural language processing. In Fundamentals of Artificial Intelligence; Springer: Berlin/Heidelberg, Germany, 2020; pp. 603–649. [Google Scholar]
  13. Kang, M.; Jameson, N.J. Machine Learning: Fundamentals. In Prognostics and Health Management of Electronics: Fundamentals, Machine Learning, and the Internet of Things; John Wiley & Sons: Hoboken, NJ, USA, 2018; pp. 85–109. [Google Scholar]
  14. Das, K.; Behera, R.N. A survey on machine learning: Concept, algorithms and applications. Int. J. Innov. Res. Comput. Commun. Eng. 2017, 5, 1301–1309. [Google Scholar]
  15. LeCun, Y.; Bengio, Y.; Hinton, G. Deep learning. Nature 2015, 521, 436–444. [Google Scholar] [CrossRef] [PubMed]
  16. Khurana, D.; Koli, A.; Khatter, K.; Singh, S. Natural language processing: State of the art, current trends and challenges. Multimed. Tools Appl. 2023, 82, 3713–3744. [Google Scholar] [CrossRef]
  17. Wang, A.; Singh, A.; Michael, J.; Hill, F.; Levy, O.; Bowman, S.R. GLUE: A multi-task benchmark and analysis platform for natural language understanding. arXiv 2018, arXiv:1804.07461. [Google Scholar]
  18. Chang, Y.; Wang, X.; Wang, J.; Wu, Y.; Yang, L.; Zhu, K.; Chen, H.; Yi, X.; Wang, C.; Wang, Y.; et al. A survey on evaluation of large language models. ACM Trans. Intell. Syst. Technol. 2024, 15, 1–45. [Google Scholar] [CrossRef]
  19. Kaddour, J.; Harris, J.; Mozes, M.; Bradley, H.; Raileanu, R.; McHardy, R. Challenges and applications of large language models. arXiv 2023, arXiv:2307.10169. [Google Scholar]
  20. Peng, Z.; Wang, Z.; Deng, D. Near-Duplicate Sequence Search at Scale for Large Language Model Memorization Evaluation. Proc. ACM Manag. Data 2023, 1, 1–18. [Google Scholar] [CrossRef]
  21. Wei, J.; Bosma, M.; Zhao, V.Y.; Guu, K.; Yu, A.W.; Lester, B.; Du, N.; Dai, A.M.; Le, Q.V. Finetuned language models are zero-shot learners. arXiv 2021, arXiv:2109.01652. [Google Scholar]
  22. Lukas, N.; Salem, A.; Sim, R.; Tople, S.; Wutschitz, L.; Zanella-Béguelin, S. Analyzing leakage of personally identifiable information in language models. In Proceedings of the 2023 IEEE Symposium on Security and Privacy (SP), San Francisco, CA, USA, 22–25 May 2023; pp. 346–363. [Google Scholar]
  23. Wolf, T.; Debut, L.; Sanh, V.; Chaumond, J.; Delangue, C.; Moi, A.; Cistac, P.; Rault, T.; Louf, R.; Funtowicz, M.; et al. Transformers: State-of-the-art natural language processing. In Proceedings of the 2020 Conference on Empirical Methods in Natural Language Processing: System Demonstrations, Online, 16–20 November 2020; pp. 38–45. [Google Scholar]
  24. Pukelis, L.; Puig, N.B.; Skrynik, M.; Stanciauskas, V. OSDG–Open-Source Approach to Classify Text Data by UN Sustainable Development Goals (SDGs). arXiv 2020, arXiv:2005.14569. [Google Scholar]
  25. Pukelis, L.; Bautista-Puig, N.; Statulevičiūtė, G.; Stančiauskas, V.; Dikmener, G.; Akylbekova, D. OSDG 2.0: A multilingual tool for classifying text data by UN Sustainable Development Goals (SDGs). arXiv 2022, arXiv:2211.11252. [Google Scholar]
  26. Guisiano, J.; Chiky, R. Automatic classification of multilabel texts related to Sustainable Development Goals (SDGs). In Proceedings of the TECHENV EGC2021, Montpellier, France, 26 January 2021. [Google Scholar]
  27. Matsui, T.; Suzuki, K.; Ando, K.; Kitai, Y.; Haga, C.; Masuhara, N.; Kawakubo, S. A natural language processing model for supporting sustainable development goals: Translating semantics, visualizing nexus, and connecting stakeholders. Sustain. Sci. 2022, 17, 969–985. [Google Scholar] [CrossRef]
  28. Center for World University Rankings. Center for World University Rankings. 2024. Available online: https://cwur.org/about.php (accessed on 8 October 2024).
  29. Bird, S. NLTK: The natural language toolkit. In Proceedings of the COLING/ACL 2006 Interactive Presentation Sessions, Sydney, Australia, 17–18 July 2006; pp. 69–72. [Google Scholar]
  30. Rosenblatt, M.; Tejavibulya, L.; Jiang, R.; Noble, S.; Scheinost, D. Data leakage inflates prediction performance in connectome-based machine learning models. Nat. Commun. 2024, 15, 1829. [Google Scholar] [CrossRef] [PubMed]
  31. Cai, X.; Xiao, M.; Ning, Z.; Zhou, Y. Resolving the imbalance issue in hierarchical disciplinary topic inference via llm-based data augmentation. In Proceedings of the 2023 IEEE International Conference on Data Mining Workshops (ICDMW), Shanghai, China, 1–4 December 2023; pp. 1424–1429. [Google Scholar]
  32. OpenAI. Prompt Engineering. 2022. Available online: https://platform.openai.com/docs/guides/prompt-engineering/six-strategies-for-getting-better-results (accessed on 15 May 2024).
  33. MistralAI. mistralai/Mixtral-8x7B-Instruct-v0.1. 2024. Available online: https://huggingface.co/mistralai/Mixtral-8x7B-Instruct-v0.1 (accessed on 5 June 2024).
  34. Jiang, A.Q.; Sablayrolles, A.; Roux, A.; Mensch, A.; Savary, B.; Bamford, C.; Chaplot, D.S.; Casas, D.d.l.; Hanna, E.B.; Bressand, F.; et al. Mixtral of experts. arXiv 2024, arXiv:2401.04088. [Google Scholar]
  35. Xu, Q.S.; Liang, Y.Z. Monte Carlo cross validation. Chemom. Intell. Lab. Syst. 2001, 56, 1–11. [Google Scholar] [CrossRef]
Figure 1. Methodology used in this work.
Sustainability 16 11050 g001
Figure 2. Prompt engineering.
Sustainability 16 11050 g002
Figure 3. The developed dashboard interface, divided in tabs for overview (left) and ODS-based analysis (right). The main components are (A) menu for funding program selection (B) tab selector (C) overview tab filters panel (D/G) KPIs panel (E) proportion of projects related/unrelated with SDGs (F) SDG tab filters panel.
Sustainability 16 11050 g003
Table 1. Dataset description.
SamplesLabelsTimeframeSource
Total15,488172013–2023Scopus
Preprocessed13,789
Training11,030
Balanced
Training
5100
Testing2759
Table 2. Comparison of real and generated abstracts.
LabelAbstract
RealWe studied the population dynamics of producers and parasites in a developing economy through the Lotka–Volterra model. Our baseline model found a cyclical equilibrium between these two groups of agents. When the equilibrium output is low, we propose that the economy is in a poverty trap, such that the only way to achieve superior equilibrium is through improvements in the institutional parameters (e.g., property rights). By adding expectations and time delays, the cyclical result may no longer hold. Nevertheless, institutional improvements promote development through an increase in the level of producers and a decrease in parasites. Still, such improvements positively affect the stability of the modified model.
GeneratedThis study investigates the population dynamics of producers and parasites in a developing economy using the Lotka-Volterra model. The baseline model indicates a cyclical equilibrium between the two agent groups. In conditions of low equilibrium output, the economy is suggested to be in a poverty trap, with the potential for superior equilibrium attainable solely through enhancements in institutional parameters, such as property rights. Incorporating expectations and time delays into the model disrupts the cyclical outcome, although institutional improvements continue to foster development by increasing producers and decreasing parasites. Notably, such improvements also positively impact the stability of the modified model. Further research is recommended to explore additional factors influencing the intricate relationship between producers, parasites, and institutional parameters in developing economies.
Table 3. Quantization parameters.
ParameterValue
load_in_4bitTrue
bnb_4bit_use_double_quantTrue
bnb_4bit_quant_typenf4
bnb_4bit_compute_dtypetorch.bfloat16
Table 4. Generation configuration parameters.
ParameterValue
max_new_tokens280
min_new_tokens264
do_sampleTrue
temperatureRandom (0.5, 0.7)
top_kRandom (5, 20)
top_p1
exponential_decay_length_penalty(264, 10)
encoder_repetition_penalty0.9
pad_token_idtokenizer.eos_token_id
bos_token_idtokenizer.bos_token_id
eos_token_idtokenizer.eos_token_id
Table 5. Model parameters.
ParameterValue
Learning rate 5.00 × 10 6
Batch size4
Eval batch size4
Epochs10
Save strategy“epoch”
Evaluation strategy“epoch”
Load best model at endTrue
OptimizerAdamW
betas0.9, 0.999
EPS 1.00 × 10 6
Weight decay0
Correct biasTrue
Table 6. Model performance. The results show the mean and standard deviation of 1-vs-rest metrics over 30 repetitions per class.
ImbalancedTrain
Records
BalancedTrain
Records
SDG F1-Score Precision Recall F1-Score Precision Recall
10.00 (0.00)0.00 (0.00)0.00 (0.00)20.00 (0.00)0.00 (0.00)0.00 (0.00)300
260.87 (5.27)60.57 (0.06)61.86 (8.20)23840.77 (2.05)29.66 (0.02)65.71 (4.99)
396.30 (0.46)95.80 (0.01)96.82 (0.62)621788.05 (1.29)93.95 (0.00)82.89 (2.55)
464.14 (9.23)65.09 (0.14)65.21 (9.53)6536.55 (3.87)22.87 (0.03)93.33 (5.17)
50.00 (0.00)0.00 (0.00)0.00 (0.00)115.98 (2.00)3.09 (0.01)96.67 (18.26)
678.79 (3.99)76.54 (0.07)81.87 (5.28)29375.25 (2.07)70.54 (0.04)80.82 (1.65)
788.99 (1.82)87.26 (0.03)90.92 (2.09)104565.94 (2.64)84.02 (0.02)54.32 (3.08)
80.00 (0.00)0.00 (0.00)0.00 (0.00)304.24 (1.64)2.48 (0.01)15.42 (7.10)
971.40 (4.27)70.26 (0.07)73.29 (5.78)27759.29 (2.44)63.53 (0.04)56.04 (4.38)
1044.22 (21.47)75.79 (0.33)34.29 (19.35)2618.30 (4.09)10.67 (0.03)70.95 (2.61)
1161.89 (7.25)66.90 (0.10)59.46 (11.23)12356.12 (2.69)41.54 (0.03)86.77 (0.98)
1216.21 (17.97)33.73 (0.33)11.85 (14.57)7019.55 (2.63)12.04 (0.03)56.30 (6.64)
1345.17 (23.37)72.35 (0.24)38.38 (24.24)13843.24 (3.61)29.06 (0.03)85.33 (1.80)
1475.74 (3.79)74.48 (0.04)77.42 (6.14)32063.49 (1.85)49.68 (0.02)88.04 (1.76)
1569.19 (3.95)75.65 (0.07)64.24 (5.38)23442.35 (1.43)29.36 (0.02)76.33 (3.03)
1634.69 (28.98)56.27 (0.43)27.27 (24.58)4523.27 (2.69)14.52 (0.02)59.70 (5.17)
1783.86 (1.13)82.21 (0.02)85.72 (3.25)189619.49 (3.82)85.10 (0.02)11.08 (2.65)
Total11,030Total5100
Bold values indicate the highest metric for each class when comparing imbalanced and balanced datasets.
Table 7. Distribution of FACEPE research projects classified by our model, both with and without applying the 80% threshold for the “unrelated” class. Here, 0 indicates “unrelated”, and 1–17 correspond to each specific SDG.
SDGWithout
Threshold
With
Threshold
0-6137
160
2107449
31282288
4692232
5401
6490140
74455
81207
937321
1020010
11603274
1229527
1318529
14324139
1536181
1649697
175510
Total7537
Disclaimer/Publisher’s Note: The statements, opinions and data contained in all publications are solely those of the individual author(s) and contributor(s) and not of MDPI and/or the editor(s). MDPI and/or the editor(s) disclaim responsibility for any injury to people or property resulting from any ideas, methods, instructions or products referred to in the content.

