Article

The Analysis and Validation of the Measured Heating Energy Consumption of a Single-Family Residential Passive House in Lithuania

by
Rimvydas Adomaitis
1,
Kęstutis Valančius
2 and
Giedrė Streckienė
2,*
1
Lithuanian Energy Institute, LT-44403 Kaunas, Lithuania
2
Department of Building Energetics, Vilnius Gediminas Technical University, LT-10223 Vilnius, Lithuania
*
Author to whom correspondence should be addressed.
Sustainability 2024, 16(24), 10798; https://doi.org/10.3390/su162410798
Submission received: 22 October 2024 / Revised: 1 December 2024 / Accepted: 5 December 2024 / Published: 10 December 2024
(This article belongs to the Topic Indoor Air Quality and Built Environment)

Abstract

:
To build a sustainable building, we need to assess a range of sustainability aspects and design them correctly, which is why building performance simulation (BPS) at an early stage of project development is critical and relevant for many professionals. This paper presents an extended analysis of the monitoring results of the first single-family Passive House (LT-PH3) in Vilnius, Lithuania, certified by the German Passive House Institute in 2015 for 2016–2020. It was based on measured data on heat pump electricity consumption and outdoor and indoor air temperature. This study evaluated the seasonal performance (SCOP) of the heat pump using the Passive House Design Package 8.5 (PHPP 8.5) and Aquarea Designer Online Simulation Software Tool 2013 (Aquarea 2013) and compared the performance of the building with the PHPP 8.5 designed in 2013 and Swegon ESBO Light 2.4.0.3 (Swegon 2.4.0.3), Aquarea 2013, and the results obtained using the Lithuanian National Building Energy Performance Certification Programme NRGsert edition 3 (NRGsert 3). The analysis showed that the heat consumption of the building modelled during the design process is close to the operational heat consumption, which increases the confidence in the BPS modelling software, the modelling process itself, and the results.

1. Introduction

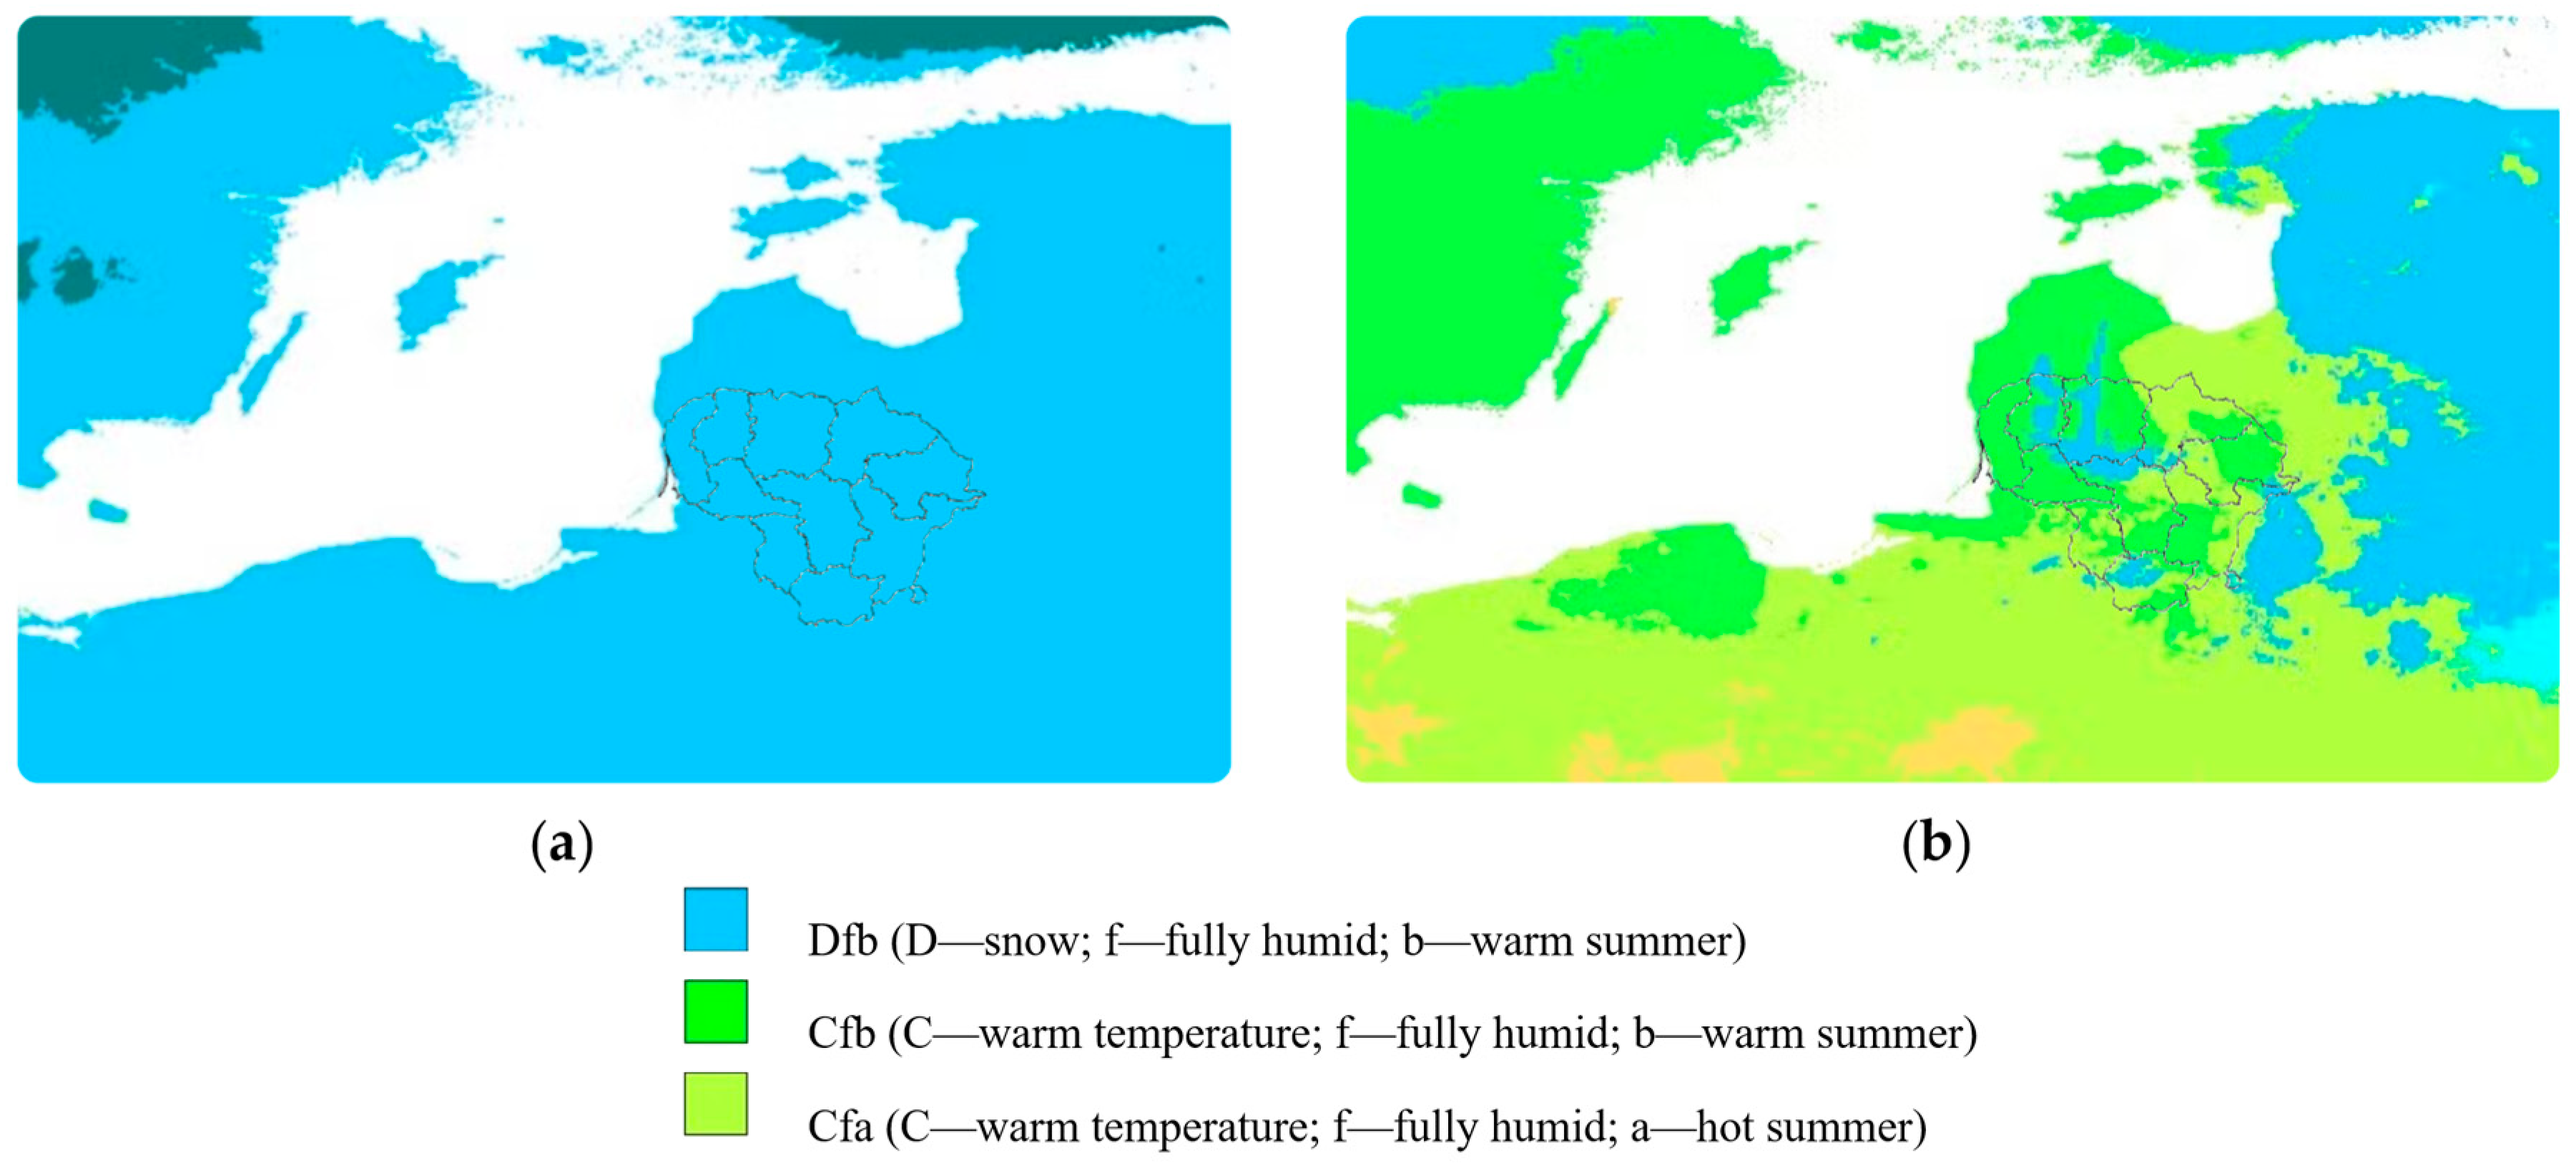
Climate change is happening [1,2], and we do not just hear about it in weather forecasts [3] but we also see its consequences through our windows. The challenge for humanity is no longer to stop the change but to at least to adapt to it. The global Köppen–Geiger climate classification maps with a precedent resolution of 1 km for current (1980–2016) and projected future (2071–2100) conditions, taking climate change into account, also predict obvious changes in Lithuania and other countries [4]. In Lithuania, all three climate zones are projected to have warm temperatures and hot summers in addition to each other, instead of just one, in fifty years (Figure 1).
In December 2019, Europe’s Green Deal—the European Union (EU)’s commitment to become the first climate-neutral continent by 2050—was launched for the first time. Buildings are responsible for over one-third of the greenhouse gas emissions in the EU. Reducing these emissions—either through greater energy efficiency or reduced energy consumption—is crucial to achieve climate neutrality by 2050 [5]. Buildings in the EU, as in Lithuania, account for about 40% of the total energy use [6] and 36% of energy-related greenhouse gas emissions, which is why the 2023 update of Directive (EU) 2023/1791 of the European Parliament and of the Council of 13 September 2023 provides wider energy efficiency standards [7]. Similarly, Directive (EU) 2024/1275 of the European Parliament and of the Council of 24 April 2024 on the energy performance of buildings states that by 2030 all new buildings, and by 2050 all buildings in the EU as a whole, should be zero-emission. The average primary energy consumption of all residential buildings should be reduced by 16% by 2030, and by 20–22% by 2035, and the renovation of the worst-performing buildings is foreseen to achieve a reduction in energy consumption of 55%. Almost 75% of existing buildings are energy-inefficient, which is why Lithuania’s long-term renovation strategy involves large-scale renovation to improve their energy performance across Europe [8,9]. In line with the National Energy Independence Strategy [10], Lithuania has set targets for renewable energy sources to account for 45% of final energy consumption by 2030.
Alongside the rapid growth of the renewable energy sector, the reduction in energy consumption, including for the operation of buildings, needs equal attention. In addition to the energy needed to heat the building, the energy needed to cool the building must also be taken into account in order to make buildings sustainable. To create sustainable buildings, even today, in new and renovated houses, including Passive House (PH) projects, we need to include solutions that can absorb the scenarios mentioned in climate change projections. To model future scenarios with climate variability, we need to know that we are designing and building correctly in today’s climate and that our design parameters are within the performance limits set by monitoring. We need to understand the limits of the tools we have today and improve them, and the best way to conduct this is through long-term monitoring and the analysis of the data.
This study found that single-family dwellings occupy a significant share of the residential building stock in Lithuania and thus have a significant impact on the overall energy consumption of buildings nationwide. The analysis revealed that Lithuanian architects designing single-family dwellings do not use the BPS national tool NRGpro and are not legally obliged to carry out such modelling, which results in blind designing in terms of the energy efficiency of buildings. One of the reasons for this is the lack of trust in NRGpro. The aim of this paper is to increase the confidence of architects designing single-family dwellings in building performance simulation (BPS) software. For this purpose, the five-year monitoring data of the first single-family house LT-PH3, built in Lithuania and certified by the German Passive House Institute, were used and analysed. This paper also analyses the Lithuanian construction sector and the algorithm for the development of single-family residential projects. This paper shows that for the design of a compact single-family dwelling, the energy performance and comfort parameters modelled by BPS are close to the performance parameters, and the basic comparative data provided increase the applicability of the results and conclusions of this study for the design of energy-efficient buildings not only in Lithuania but also in other Dfb climate zones around the world. This study also showed that in order to assess the performance of a single-family residential building in operation and to maintain the designed comfort criteria under changing conditions of use and climate change, each building needs a basic monitoring system for its main systems and elements, which should be installed during the construction of the building. If intelligently designed, it would not only record the performance of the systems but could also contribute to their management, including in combination with artificial intelligence. The monitoring results analysed in this paper contribute to the increased relevance of the topic of building sustainability and provide practical insights for architects, engineers, and researchers in the field.

1.1. Lithuanian Building Sector

Lithuania’s National Energy Independence Strategy also sets ambitious targets for energy efficiency, reducing primary and final energy intensity by a factor of 1.5 by 2030 and 2.4 by 2050 [10]. The question is as follows: what is the right way to carry out this work so that 100 years from now homes renovated and newly built in 2024 will still be energy-efficient, comfortable, and sustainable? When designing houses, only multi-year climate data are considered, so we must include solutions in the design of new and renovated houses that can buffer the scenarios mentioned in the climate change projections and reflect today’s climate reality. Unfortunately, building renovation in Lithuania is largely limited to multi-family dwellings and only to reducing their heating costs, focusing on improving the heat transfer coefficient (U-value) of the building’s thermal envelope and modernising the heating system. Controlling overheating, reducing energy consumption for cooling, and ensuring hygienic air quality are rarely included in the design of renovation and new building projects.
In line with the obligations of the EU Directive, Lithuania has adopted a system of energy performance requirements, and energy performance design and the certification of buildings has been regulated by STR 2.01.02:2016 [11]. The NRGsert programme has been in operation since 1 January 2007 for the certification of constructed houses. Until 2016, there was no national tool for the design and energy performance modelling of buildings, so there was neither the possibility nor the obligation to check the energy performance of projects during the design process. The transition from one energy performance class to a higher one has been challenging for a significant part of the Lithuanian building sector, and the process has been met with widespread resistance, which has led to a softening of conditions. Insufficient communication, a lack of informed judgement, and a lack of understanding by a critical section of the public of the benefits of the higher energy class requirements for buildings have shaped the public’s, including the architectural community’s, negative attitudes towards improving the energy efficiency of buildings and distrust of the system itself. Today, all new buildings in Lithuania are designed for energy performance class A++, but there are still no monitoring studies in Lithuania to confirm the compliance of the designed energy performance indicators with the performance ones. In 2016, the national energy efficiency modelling software NRGpro 4 for building design and modelling was launched [12]. In 2023, it had up to 120 active users, but there are no statistics on how many of the 1379 certified architects in Lithuania use it. Energy performance modelling for building design, including single- and two-family dwellings, is not popular among architects. In the case of multi-family dwellings, energy performance assessment is carried out by certified engineers, but there are no such requirements for the preparation of single- and two-family dwellings.
Currently, residential buildings account for 64% of the total building stock in Lithuania, while apartment buildings account for 29% and detached houses for 34% of the total area of the building stock. According to the estimates of the Lithuanian Centre of Registers, during 2021–2022, about 23,000 new houses—single- and two-family residential buildings—were registered in Lithuania, almost 1000 per month [13]. According to the Official Statistics Portal of Lithuania, from 2014 to 2024, out of the total 13 million m2 of living space built, 10 million m2 was single- and two-family dwellings, which is 77% of the total built residential space in the decade (Figure 2). Thus, the single-dwelling house is an important unit of the city and the country, with a significant impact on the overall energy efficiency performance of buildings in the whole country.
The design technology for residential buildings differs for different uses. When designing sustainable buildings, the design process itself must be sustainable. In Lithuania, when designing single-family or semi-detached dwellings, the architect—the project manager—is in most cases the only specialist who, from the beginning of the project preparation to the obtaining of the building permit (SLD), guides the design and determines all the main comfort criteria of the future house [15] including its energy efficiency and operating costs for heating and domestic hot water (DHW). In the design of single- and two-family dwellings, there is no energy efficiency and comfort modelling part of the design, and in the absence of the possibility to check the rationality of the solutions for the specific architecture of the building to be designed in the specific environment from the energy efficiency and comfort point of view, the designs are developed blind. This problem is compounded by the fact that the specialists preparing the spatial planning documents also lack competence and, in the formulation of plots, development zones, access roads, and other decisions, often create conditions that prevent the construction of an energy-efficient house on the plot. Heating, ventilation, and air conditioning (HVAC) and building energy performance certification (PENS) engineers, who could influence the architect’s decisions and lead to a higher level of comfort in time for the design phase, are involved in the construction of single-family houses. After the SLD has been obtained and/or after the building has been constructed, modifications become costly, or there is no time left.

1.2. Building Design Process and Passive House Concept

Architecture is an art. Building design is a complex interdisciplinary process [16]. It involves professionals with different professions and competencies, with the architect striving for the uniqueness of the building each time [17]. The design of a building is influenced by many individual and interrelated external environmental and internal factors, and a slight change in one of them can change the final result beyond recognition. Therefore, when designing a building, it is difficult for an architect to use research that, by selecting only a few criteria, produces theoretical template solutions [15]. It is necessary to be familiar with the template and the boundary conditions of the study and to trust the findings of the study, so the likelihood of an architect designing a house in this way is low. They need an inexpensive, easy-to-use BPS tool that they can operate independently. The use of such a tool would be most effective at an early stage in the analysis of the design environment and concept development.
Many BPS programmes have been developed. These include the national building energy performance modelling programme NRGpro, developed in Lithuania based on the current building technical regulations [12], and the Passive House Planning Package (PHPP) [18], EnergyPlus™ [19], TRNSYS [20], COMFIE [21], IDA ICE [22], and others. Managing these applications is complex and requires competencies that architects lack. To involve architects more in the BPS process, the German Passive House Institute has developed a simplified version of the PHPP, EasyPH, for the modelling of single-family houses, which should facilitate the BPS process. The use of these tools could be accelerated by monitoring-based evidence showing that the comfort and energy efficiency design criteria of the building modelled in the BPS programme meet the performance criteria.
Some of the key aspects of assessing a building’s sustainability are its comfort and human well-being, its energy efficiency, the durability of the solutions adopted in its design and construction, and its resilience to the challenges of economic and climate change.
Even the most energy-efficient house can be uncomfortable [23]. The understanding of building comfort as the combined, synchronised performance of all parts of a building, exterior and interior, structure and engineering systems, use and sustainability of the functional scheme, and others, is only just beginning to develop in Lithuania. Lacking interdisciplinary knowledge and experience, comfort criteria are still understood in a very narrow way and are either not taken into account at all, or they are not assessed and designed as a whole but individually. In each different climate zone, with different sizes, orientations, shading situations, U-values of the thermal envelope, thermal capacities of buildings, numbers of inhabitants, and, most importantly, comfort perceptions of the inhabitants, amongst other indicators, the composition of the elements of a Passive House and their meanings will vary. In each different country and family, the economically sound solution will be different [24]. Therefore, step one in the development of a comfortable building of any purpose and size is the Design Task. The energy performance of a building is only one of more than twenty criteria for building comfort, and the comfort of a building is one of many aspects of its sustainability. All of them need to be designed, modelled, coordinated, and implemented without errors. A wide variety of factors determine the comfort of a house, including the deposition of particulate matter on the building walls [25], wind [26,27,28], the materiality of the façade [29], etc.
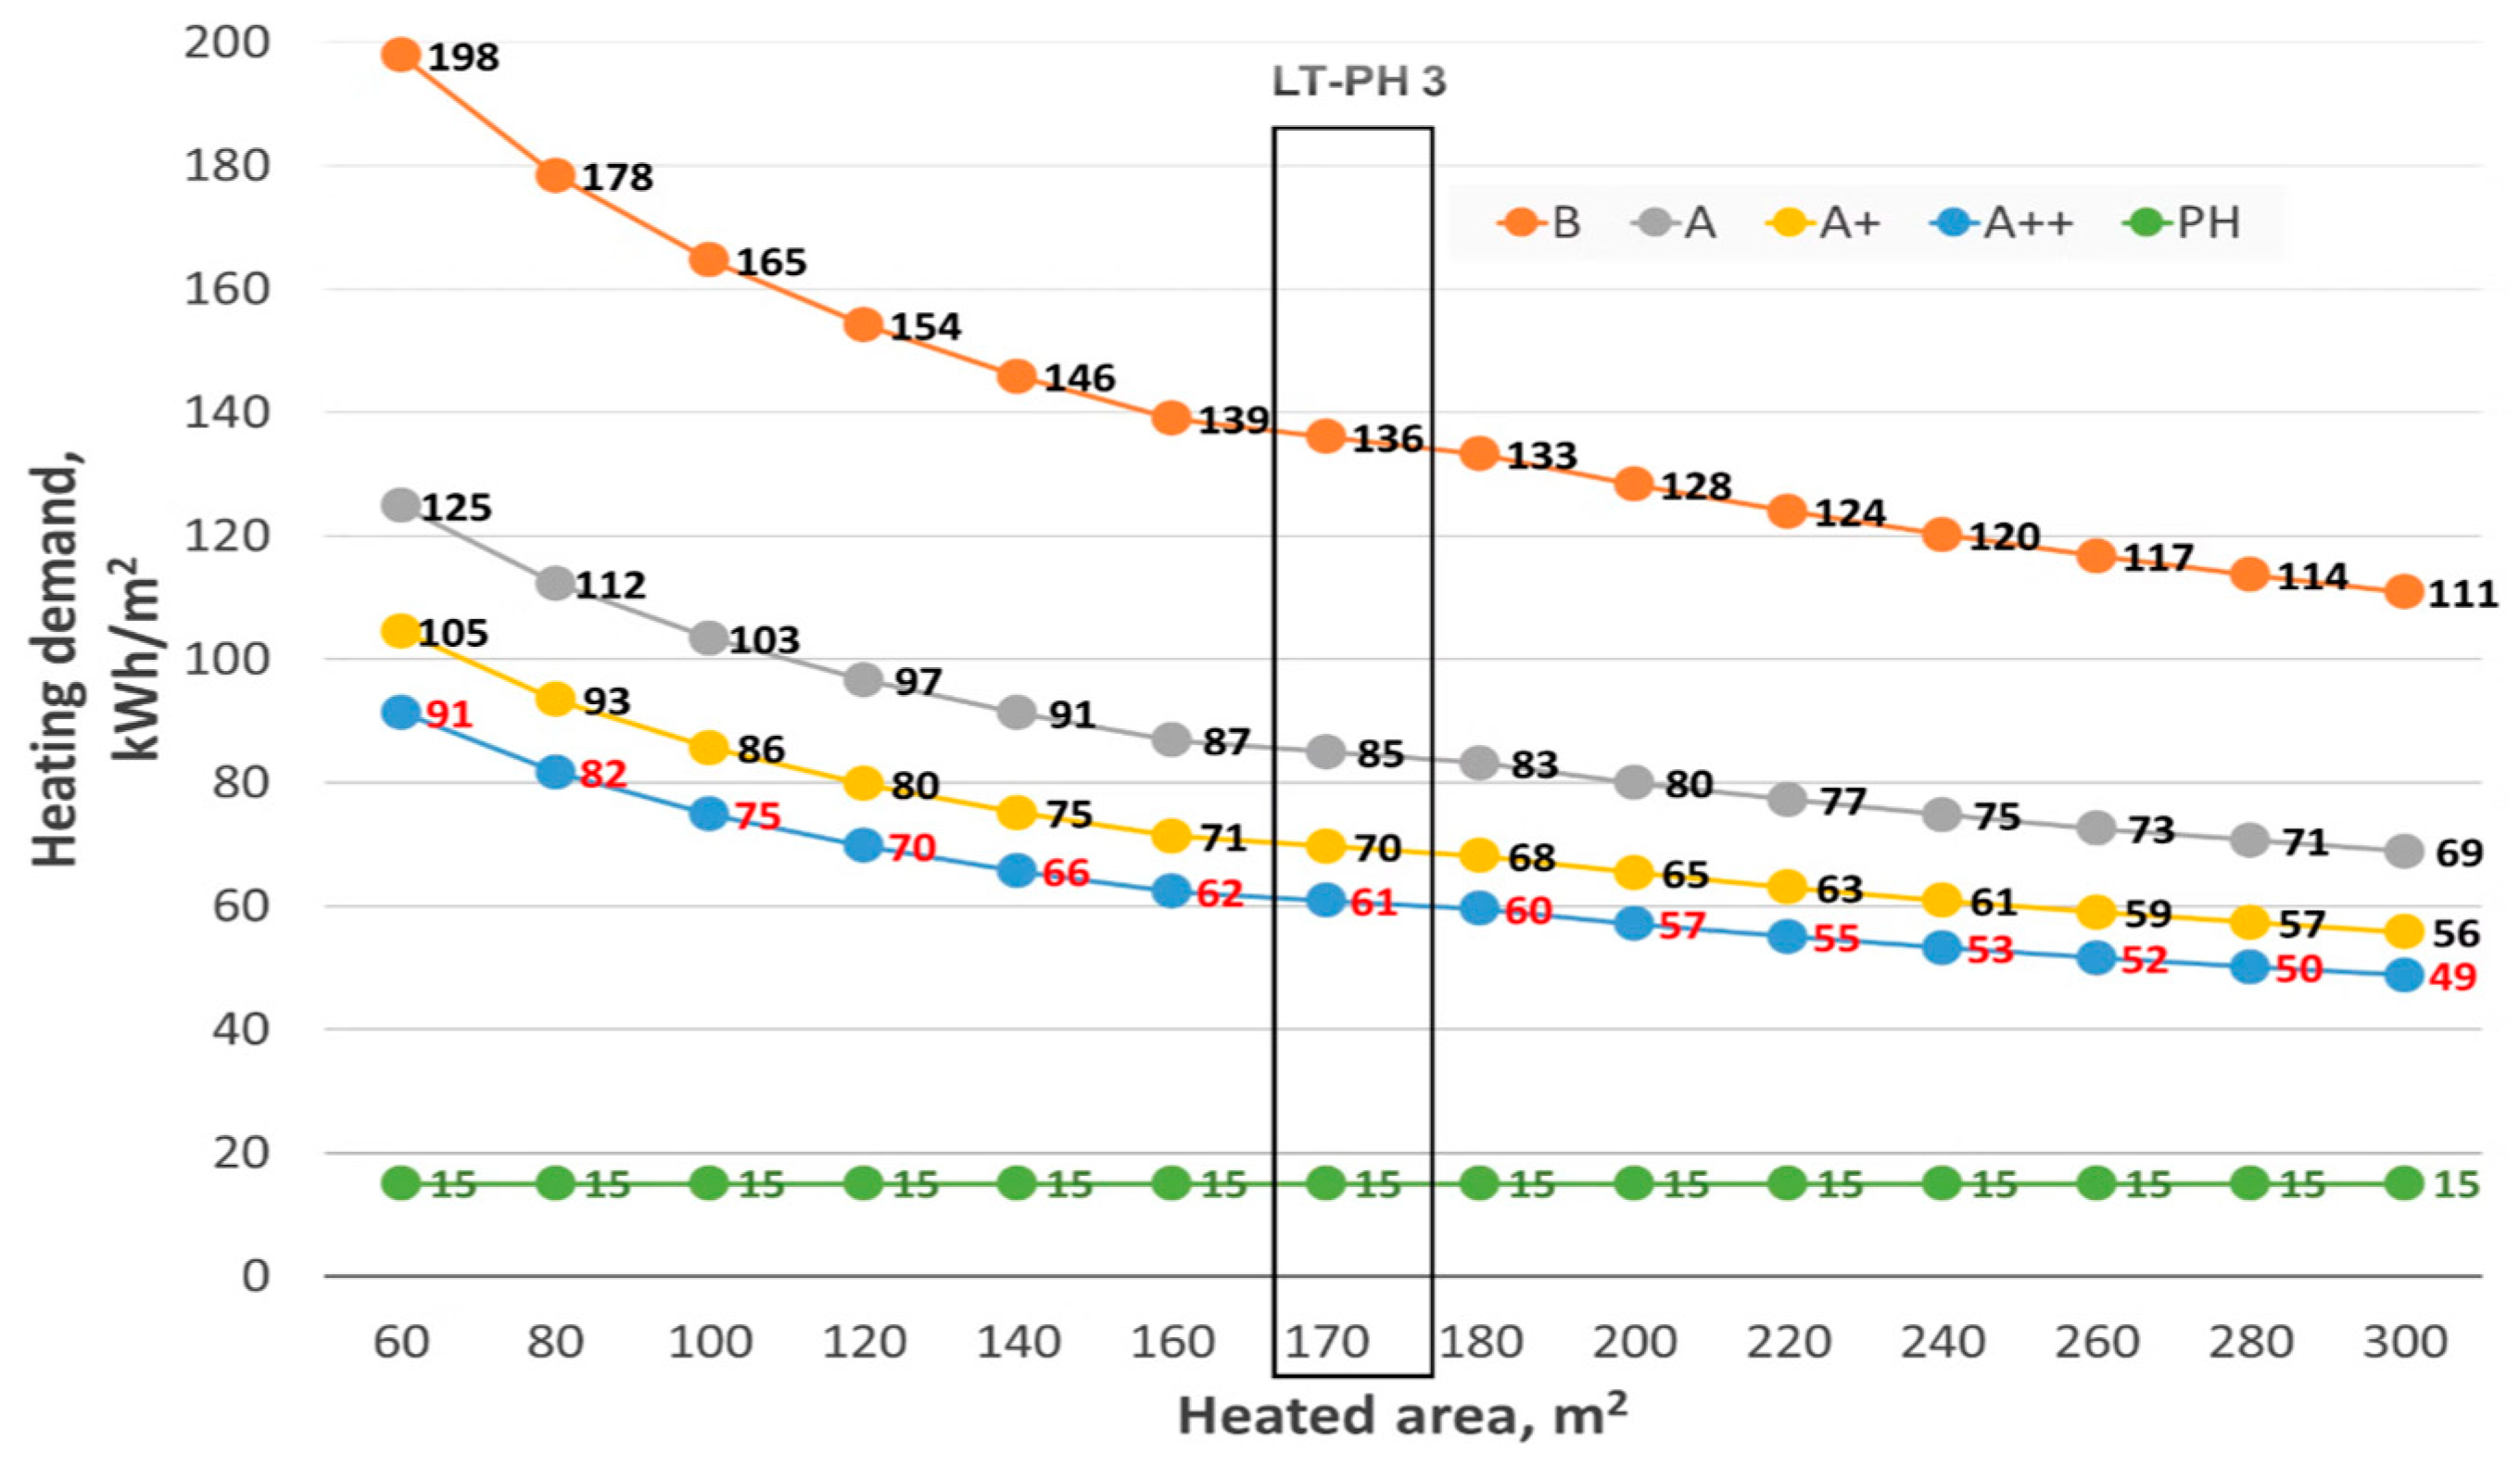
The climate, house-building best practices and experience, building usage patterns, and many other important factors that determine the design of a comfortable house can vary significantly even within the same country. It is therefore very important to study and monitor the use, comfort, and engineering systems of Passive Houses and energy-efficient houses. Since 2011, Lithuania has also started designing and building the Passive House standard developed by the German Passive House Institute [30]—Passive House (PH). Figure 3 shows the maximum permissible thermal demand requirements for a Passive House and the energy performance classes of Lithuanian buildings and their evolution [11].
A Passive House is an energy-efficient house that meets the builder’s expectations and offers the highest level of comfort building [31]. Its quality is based on the combination of several carefully coordinated building elements (envelope and engineering systems and equipment). It is created by the Passive House Planning Package (PHPP) [18] examining the digital building model, the economic feasibility of architectural, structural, and engineering solutions, and their impact on the energy efficiency of the building [32]. The Passive House design algorithm is based on a two-stage modelling process, the design proposal and the Technical Working Design, which produces a house with some significant benefits [33]. According to the Passive House Institute database, a total of six Passive Houses had been certified in Lithuania by 2024 [34].
The Passive House concept was developed by Prof. Dr. W. Feist. Passive House monitoring, which began in 1991 with the construction of the world’s first Passive House in Darmstadt-Kranichstein, Germany, today covers thousands of Passive Houses on different continents [35] and in every climate zone on the planet [15,36,37]. The data collected through monitoring are evaluated [38,39,40], and their results are used to improve the Passive House design algorithm and the digital modelling and certification tool PHPP. This research also aims to determine the accuracy of the Passive House design process by comparing the results modelled by the PHPP 8.5 with those measured during operation [41,42]. This will be conducted using existing and new methodologies and modelling tools [43], including in Lithuania [44]. The Passive House system does not constrain the architect’s decisions, the architectural expression, style, and materiality of the house. These houses can also be built of straw [45]. The PH algorithm only adds to the evaluation of the architectural solutions’ important criteria such as building comfort, energy efficiency, and affordability. The renovation of both multi-family and single-family dwellings according to the EnerPHit standard has been shown to perform as designed in different countries and climates [46,47]. In Passive House modelling, small inaccuracies in the sensitive parameters can significantly affect the results [48], so it is important to be aware of the conditions under which the data were collected and the study was carried out. Also, due to the influence of the use of the building on its energy performance results, it is not possible to compare and evaluate buildings of the same size but with different uses.
The design of passive and low-energy buildings is based on a climate zone analysis, a carefully considered functional layout, a detailed assessment of the building orientation and the environmental impact on the building, a balance of the building’s thermal envelope losses and solar and internal heat gains, the optimisation of the thermal envelope’s U-values to reduce the heating demand, the use of high-efficiency engineering equipment, and the use of renewable energy sources. The cooling demand is reduced by using external solar control systems, increasing the thermal capacity and inertness of the building, using night ventilation, and selecting the correct values for glazing parameters [49]. This careful, precise Passive House design algorithm automatically solves many aspects of building sustainability.
The increase in confidence in the design system is driven by the availability and easy accessibility of monitoring-based evidence of the performance of the designed parameters, as well as the openness of data. Research in the energy-efficient buildings sector is extensive, but its applicability in practice is difficult. When looking at the research evaluating Passive Houses, it is difficult to find buildings that are 100% complete and 100% PH-compliant, with construction, engineering, and other equipment and their use throughout the study as designed, and most of all with design parameters that are consistent with the performance parameters as modelled by monitoring. Studies have compared Passive Buildings of different sizes, with an unspecified building use algorithm, located in different climatic zones, at different stages of construction completion and operating conditions [37], monitored in PHs, whose occupants complain of overheating due to the lack of blinds [23], assessing PHs with a 50% deviation of heating costs from the design [42]. It is therefore difficult to understand the conditions under which the results presented in these studies are obtained and what the results would be in the absence of these defects or errors.
To make research more applicable in practice, it would be useful to systematise and unify the basic comparative data to enable the researcher to identify buildings suitable for analysis more quickly. In this way, at an early stage of project development, the energy efficiency and comfort perspectives of a newly designed building could be quickly assessed using comparative analysis, Embodied Carbon in Construction, and Life Cycle Assessment [15]. When researching Passive House projects, there are many relevant factors, such as the climate, building size, etc., which would be useful to be able to sort through in an advanced search of the PHI database [34], and, once several datasets have been selected, the different houses generated by the basic comparative data template could be collated and compared.
The impact of building use on performance is controversial [50] and differs for different energy efficiency levels [51]. Studies show that if the house has very good insulation, the parameters ranked by the biggest impact are the (1) occupation mode, (2) thermostat, and (3) heated area. Also, the actual occupancy algorithm of a building, or its mismatch with the designed one, can influence the performance in the context of energy efficiency by up to 50% [42] or determine the prospects of the study [52].
Studies and research on energy-efficient homes have also been carried out in Lithuania: studies have been conducted to determine the heating load of low-energy buildings [53,54], the Passive House model has been developed [44], and studies on building energy consumption have been carried out, which have been limited to the application of calculation methods without analysing the actual energy consumption in the building [53]. In 2009, a study was carried out on the first single-family dwelling house in Lithuania that complies with the Passive House concept. Unfortunately, there is no comparison of the real operating costs of this building with the planned ones. This shows the need to know and analyse the performance of energy-efficient buildings in appropriate climatic conditions using long-term data.
2. Materials and Methods

2.1. Subject of This Study and the Research Process

This is the first such study of a single-family house in Lithuania, based on monitoring data collected over five years, from 2016 to 2020. The house was fully built and furnished before the monitoring started (see Figure 4). The building’s site plan, floor plans, sections, and examples of preventive thermal bridges and airtight assemblies can be found in the Supplementary File as well as in the database of the German Passive House Institute (https://passivehouse-database.org/index.php?lang=en#d_4676, accessed on 6 December 2024.
It was continuously occupied by a family of four throughout the monitoring period, and no changes were made to its structure or engineering systems during the entire data collection period, i.e., it followed the design and the PHPP 8.5 numerical model. The LT-PH3 building was certified by the German Passive House Institute. It has a design heat demand of 15.43 kWh/m2 a and a calculated annual thermal energy demand of 2612 kWh. In 2016, the building was also certified in Lithuania with an A+ energy performance class. Basic comparative data on the LT-PH3 building are presented in Table 1.
Long-term monitoring can lead to a situation where heat pumps that only provide data on electricity consumption for heating and hot water have to be assessed. In this situation, the SCOP of the heat pump needs to be determined to determine the heat consumption of the building for heating. This is particularly relevant for Passive Houses (PHs), where one of the key indicators in the design and certification process is the building’s heat consumption for heating in kWh/(m2 a).
To assess the correspondence of the heat consumption of the building modelled during the building design with the measured performance data, the following steps were required:
  • Collect five years of electricity consumption data for the heat pump.
  • Identify electricity consumption for the heating system only, minus hot water electricity consumption, based on the monthly consumption of electricity for hot water production in the non-heating period.
  • Based on the measured annual average indoor air temperatures for the heating season, the PHPP 8.5 simulates the design heat consumption for heating the building.
  • Develop and validate Swegon’s 2.4.0.3 digital building model for PHPP 8.5 compliance.
  • Based on the measured annual average indoor air temperatures, Swegon 2.4.0.3 simulates the design heat consumption for heating the building.
  • Determine the average SCOP of the heating system using Aquarea 2013 (SCOP1) and the PHPP 8.5 (SCOP2).
  • Using the PHPP 8.5 and Aquarea 2013, calculate the operational heat consumption for heating the building using the measured electricity consumption for heating.
  • Compare the Swegon- and PHPP-designed building heating consumption with the PHPP- and Aquarea-programmed performance. Also, since the building was built and certified in Lithuania as A+, compare all the results obtained with the result for the heating consumption of the building as determined by the Lithuanian national certification programme NRGsert 3.
  • Evaluate the results in the context of measured outdoor and indoor air temperatures.

2.2. Survey Tools and Method

The results of the monitoring carried out in 2016–2020 are compared with the results obtained with the help of numerical simulation software: the Passive House Design Package 8.5 (PHPP), the simulation tool for building design optimisation Swegon ESBO Light 2.4.0.3, and the heat pump manufacturer Aquarea Designer Online Simulation Software Tool 2013. This study also included data on the energy consumption of the building for heating obtained from the NRGsert 3 programme of the Lithuanian National Certification Scheme for comparison.
The PHPP [18] is a Passive House Design Package. It is a mandatory tool for Passive House design and certification. At the design proposal stage, it contains all the information about the house and its surrounding environment that can influence its energy efficiency and comfort: from the Psi-value of the glass unit frame to trees growing or houses standing 300 m away. In this way, a digital model of the Passive House is created, the peak of which is the amount of thermal energy needed to heat the building, expressed in kWh/(m2 a). During the design process, when looking for the optimum orientation of the building, changing the area or volume of the building, the shading solution, the division of the window frames, the value of any feature of the glass unit or its installation unit, heat pump, or recuperation, at least one of the components of the thermal envelope, or the value of the thermal bridge or specifying its changed length will show the impact of this action on the heating demand of the building. The confidence in this Passive House modelling and certification tool is increased by the fact that, from the first day of the construction of the first Passive House, thanks to the monitoring and data evaluation of hundreds of demonstration objects, its algorithms are constantly refined and improved. Monitoring the buildings made it possible to verify the validity of the practical application of digital solutions. The PHPP modelling allows the selection of the most optimal element of the house, assessing its impact on the main comfort criteria of the building and the cost of its construction.
One of the objectives of this study was to test the performance of another simple, potentially free, and easily adopted BPS modelling software, in addition to the PHPP, which is in line with architects’ current expertise. Swegon ESBO Light 2.4.0.3 (Swegon 2.4.0.3) was thus chosen as an alternative that performs dynamic modelling similar to EnergyPlus [55]. As HVAC system designs for single-family dwellings are usually not developed, and their selection is determined by the tools available to the manufacturer’s sales representative, the third tool considered in this study was the Aquarea Designer Online Simulation Tool 2013, developed by the manufacturer of the LT-PH3 heat pump, Panasonic [56]. Aquarea 2013 calculates the project’s energy costs in terms of domestic hot water, heating, and cooling demand. It furthermore shows the total heat consumption by the operation mode and the calculated SCOP. As the house was built in Lithuania and was certified as A+ according to the national certification system NRGsert 3, we have also included these data in the comparison of the building’s costs measured during design and operation [57].
This study consists of three main phases: phase 1—LT-PH3 monitoring; phase 2—development and validation of simulation models; and phase 3—simulation and data analysis. These phases are illustrated in the LT-PH3 study methodological flowchart in Figure 5.
In the case of Passive Houses built in the past, as in our case, it is common to encounter a situation where heat pumps only record the amount of electricity consumed, and no separate heat meters have been installed [58]. Our data collection aimed to assess the indoor thermal comfort of the building and to determine whether, in the design of the Passive House, the PHPP 8.5 [18] modelled its parameters in accordance with the actual operational parameters. This study analysed five years of data collected on indoor and outdoor temperatures and the electricity consumption of the Renovent Excellent 300 ventilation unit and the Panasonic WH-SDC05E3E5 air-to-water heat pump.

2.2.1. Study Phase 1 [LT-PH3 Monitoring]

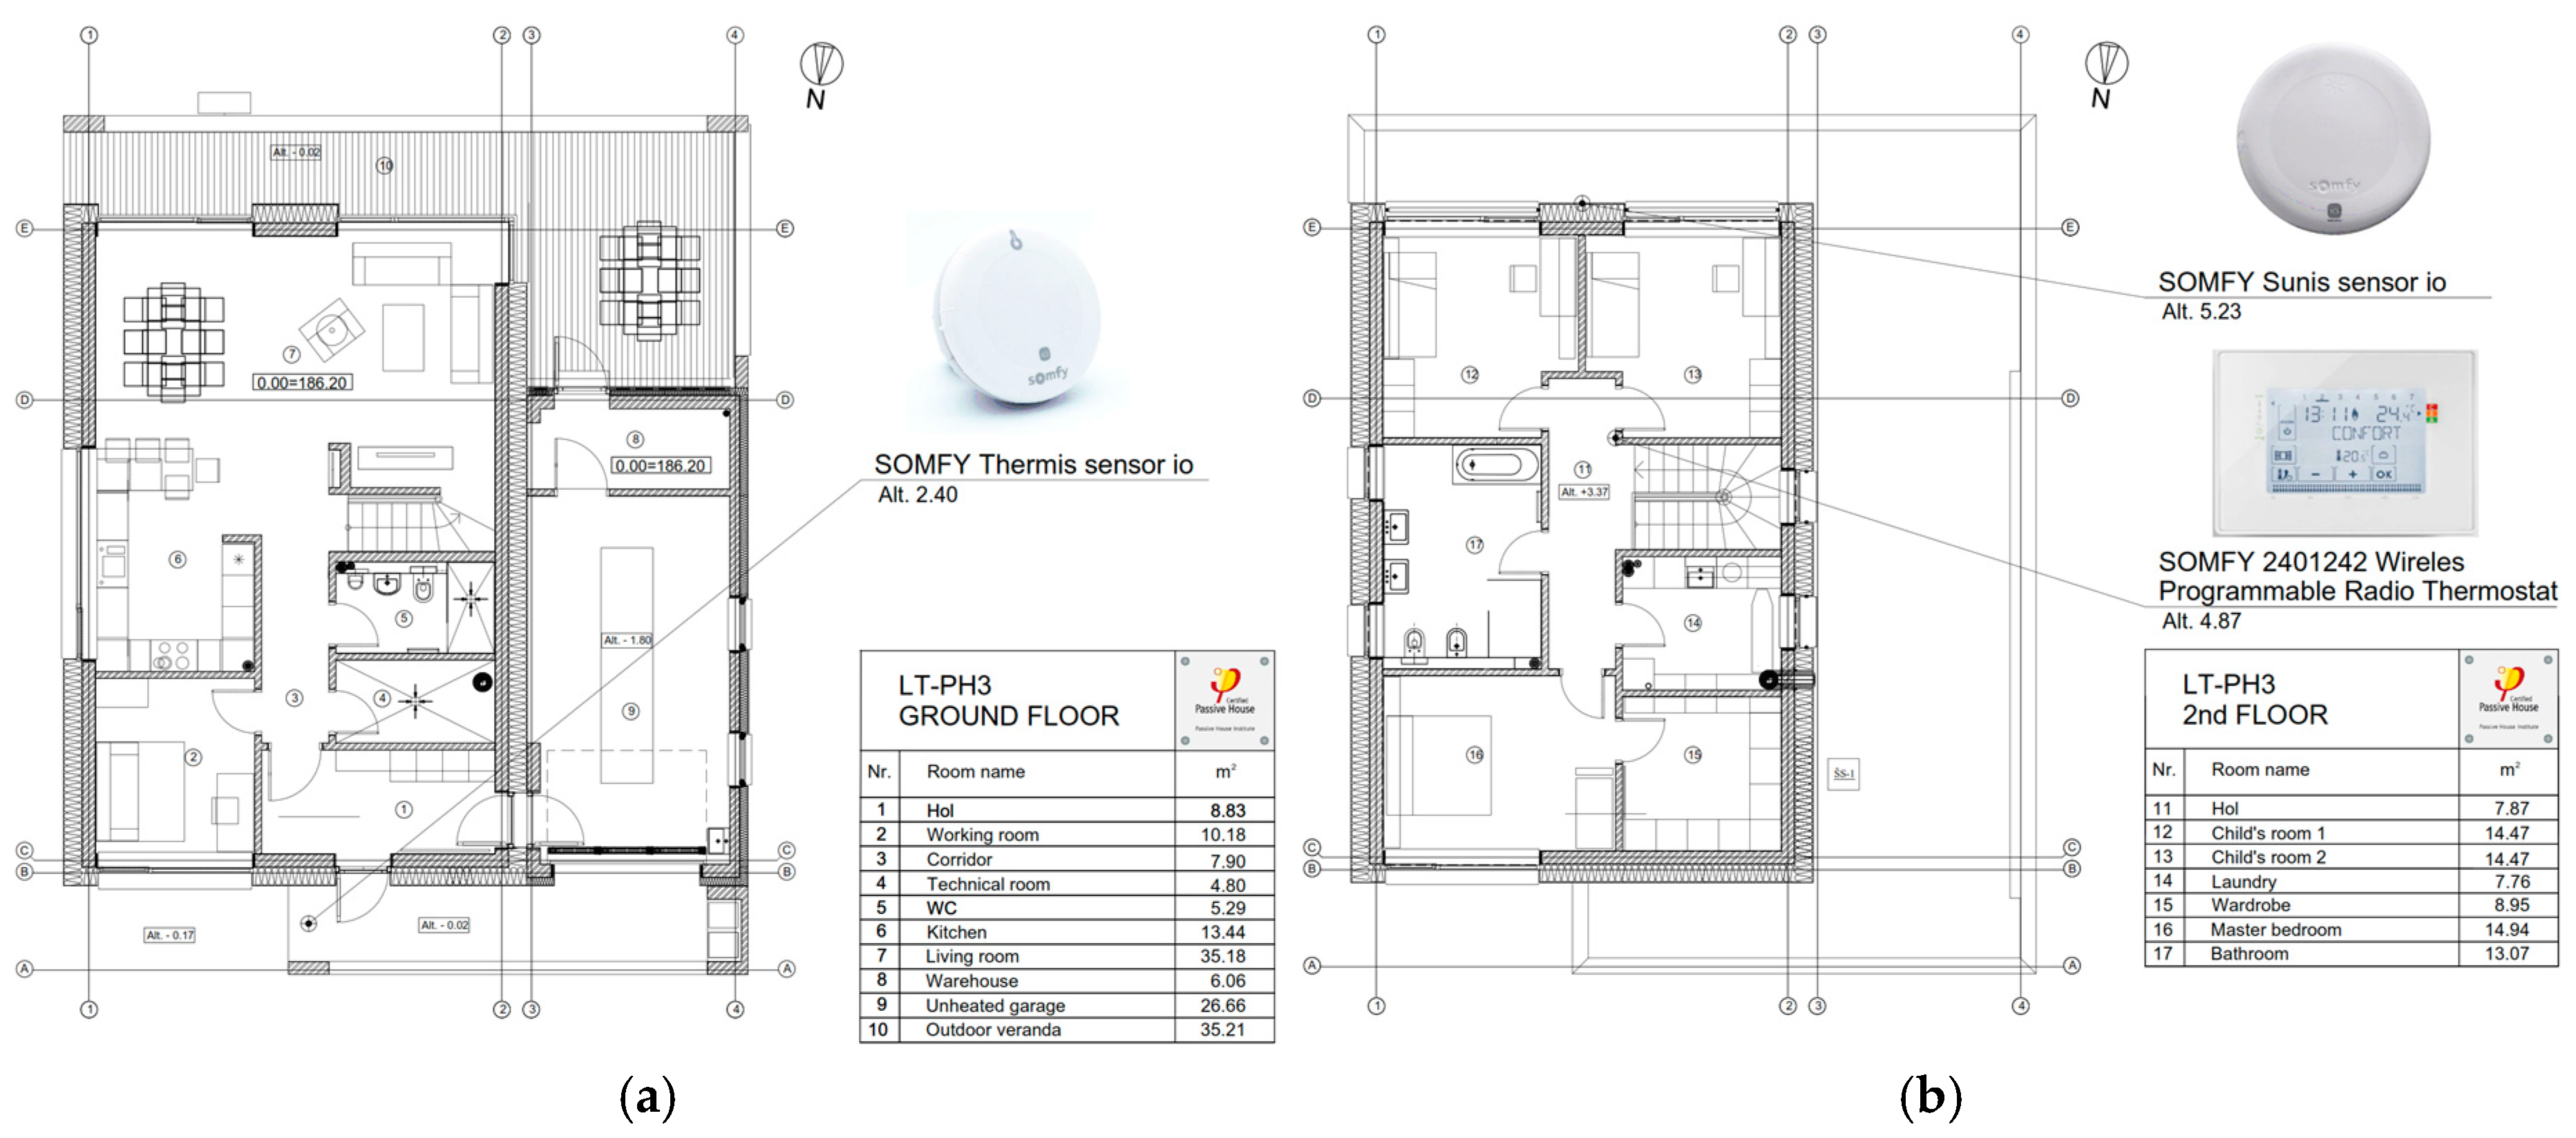
The total electricity consumption in the building was measured by an input subscriber meter and by separately installed sub-subscriber meters for the heat pump and the heat recovery ventilator. The heat pump’s installed electricity meter measured the total electricity consumed for heating and hot water production in the building. The outdoor air temperature was measured by a Somfy Thermis sensor (Somfy Activités SAF, 74 300 CLUSES, France) installed on the north side of the building, and its location is shown on the ground-floor plan in Figure 6a. The indoor temperature was measured with a Somfy 2401242 wireless programmable radio thermostat (Somfy Activités SAF, 74 300 CLUSES, France). It was chosen because of its ability to control the heat pump by adjusting the temperature in 0.1 °C increments. The location of the thermostat is shown on the second-floor plan of the house in Figure 6b. The collectors of the heating system are installed on the ground and first floors, but no automatic control of the individual collector zones was installed. The temperature in the individual rooms was adjusted by balancing. At the beginning of the operation of the house, the temperatures in the living rooms were measured with a thermometer and were generally in line with the temperature at the thermostat site. The only room where the heating is switched off all the time to achieve the desired comfort is the Master bedroom 16, where the temperature fluctuates around 19 °C. The measurement data were collected in a Somfy Box (Somfy Activités SAF, 74 300 CLUSES, France).
Since the start of and throughout the monitoring period, no changes or improvements were made to the house, i.e., it has been studied as designed, with no changes in shading and other environmental situations and a family of four living permanently in the house. Their living habits, such as holiday, guest, and weekly outing patterns, food production, and the use of hot and cold water, remained essentially unchanged throughout the monitoring period. Therefore, it can be assumed that the algorithm of building use was constant during the study period.

2.2.2. Study Phase 2 [Development and Validation of PHPP 8.5 and Swegon ESBO Light 2.4.0.3 Simulation Models]

The PHPP 8.5 model was developed during the design of the 2013 building. Following the approval of the design proposal (DP) by the builder, the required and available building data were fed into the PHPP 8.5, and the modelling of the building thermal envelope and the performance and economic feasibility of the main engineering systems was carried out. Once the desired results were achieved, the architectural solutions of the PP and the results of the initial modelling of the PHPP 8.5 were approved, and the preparation of the Technical Working Design (TWD) of the building started. It included the detailing of the structures, structural units, HVAC and other engineering components, thermal bridging calculations, and thermal bridging preventive solutions and the preparation of the airtightness part of the design, without altering the geometry of the building. After the completion of the TDP, all the additional design information was consolidated into the PHPP 8.5, the final result was balanced, and the final version of the PHPP 8.5 was approved (Figure 7a). Thanks to the balanced building orientation, the thermal envelope U-values, the thermal bridges (Figure 7b), and the efficiency of the heating and ventilation equipment, the designed building annual heating demand, at an indoor temperature of 20 °C, was 2612 kWh/a (Figure 7c).
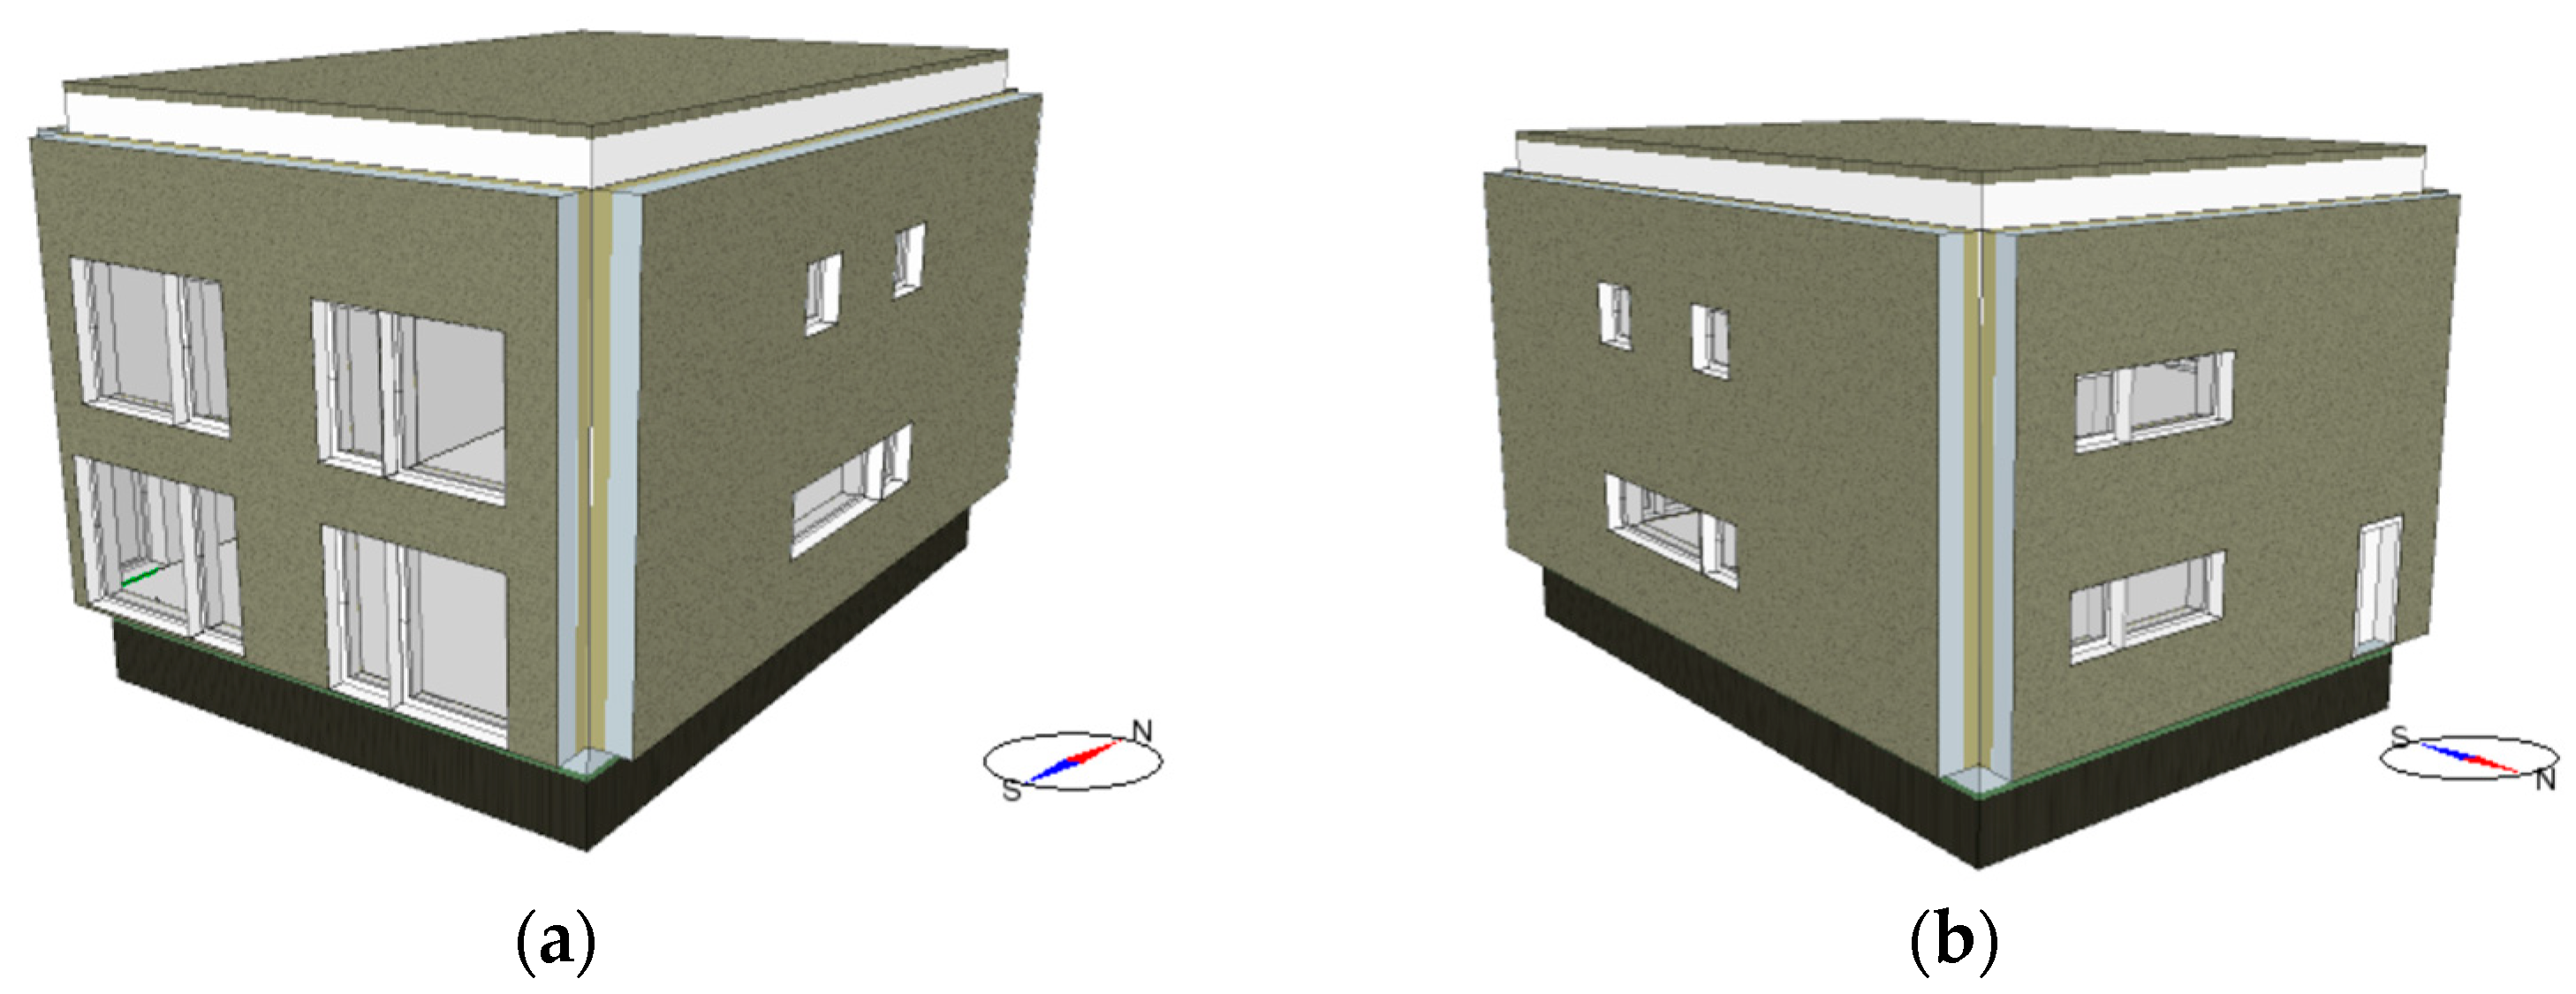
The Swegon ESBO Light 2.4.0.3 model was developed in order to have an alternative numerical building model to compare with the PHPP 8.5 and to check the consistency of the building heating energy consumption it generates with the results obtained from monitoring. To this end, the geometry described in the PHPP 8.5 was used to build a geometric model of the building, as shown in Figure 8.
To align the thermal envelope U-values with the approved PHPP 8.5, the Swegon ESBO Light 2.4.0.3 programme used a wall U-value of 0.087 W/(m2 K), a roof U-value of 0.063 W/(m2 K), a floor U-value of 0.098 W/(m2 K), and a window U-value of 0.78 W/(m2 K). The result was that the values of the Ug and g, Uw for all windows, and U-values for opaque structures were the same in both applications, and these results are shown in Table 2.
A simulation of the PHPP 8.5 heat consumption was carried out based on the average measured indoor air temperatures during the heating season. The simulation carried out by Swegon ESBO Light 2.4.0.3, looking at annual average indoor air temperatures for the heating season, is presented in Table 3.
To reduce the tolerance of the annual heat consumption, the Swegon ESBO Light 2.4.0.3 2019 minimum differential heat consumption was compared to the PHPP 8.5 by modifying the Swegon ESBO Light 2.4.0.3 “equipment” value shown in Table 4.
After the validation of the 2019 heat consumption with Swegon ESBO Light 2.4.0.3, the 2019 equipment value was used to recalculate the heat consumption for all other years, reaching a maximum discrepancy of 2.72%. The results are shown in Figure 9.

2.2.3. Study Phase 3 [Simulation and Data Analysis]

The essence of this phase was the conversion of the measured electricity consumption data into heat consumption and their comparison with the data expected at the time of the project preparation and determined by the Lithuanian certification programme NRGsert 3. The following steps were carried out:
  • The five-year electricity consumption of the heat pump, total heat and DHW, minus the hot water consumption measured during the summer, was used to calculate the annual electricity consumption to heat the building, as shown in Table 5.
2.
Based on the measured annual average indoor air temperatures for the heating season, the design heat consumption for heating the building was modelled in the PHPP 8.5 and Swegon 2.4.0.3 and is shown in Table 6 and Table 7. Table 8 shows the average SCOP1 of the heating system as determined by Aquarea 2013.
3.
The PHPP SCOP2 was calculated based on the annual heat demand for heating the building, as determined in Table 6, and the annual electricity consumption for heating the building, as calculated in Table 5, and is presented in Table 9. Based on the data obtained, the average SCOP2 is 1.70.
4.
On the basis of the measured annual electricity consumption for heating the building and SCOP1, the operational heat consumption for heating the building was determined by Aquarea 2013 and is shown in Table 10.
5.
Based on the SCOP2, determined by the PHPP 8.5 programme, the operational heat costs for heating the building are shown in Table 11.
The Swegon- and PHPP-designed heat loads for heating the building and the PHPP 8.5 and Aquarea 2013 programmes’ operational heat loads for heating the building were compared with each other and with the results obtained by the Lithuanian national certification programme NRGsert 3. The results of the heat consumption for heating the building measured by the heat pump were also evaluated, as well as the measured outdoor and indoor air temperatures.

3. Results

One of the most well-known and understood criteria for patio comfort is the indoor temperature or, more precisely, the dynamics of the indoor temperature according to the preferences of the occupants. In energy-efficient buildings, due to their airtightness and the efficiency of the thermal envelope, the ΔT is usually 3 °C. This is even more difficult to achieve with the most popular model of the ventilation system, where the air is supplied to the living rooms and extracted through the ancillary rooms. The indoor and outdoor ambient temperatures of the building were measured during this study and are shown in Figure 10. The five-year variation in the average outdoor temperature ranges from 7.58 °C to 8.85 °C and confirms the warming trend of the climate, which has had an impact on the dynamics of the building’s heating costs. The annual average temperature curves show that, while summer temperatures are similar, there is a greater change in the cold season. The average temperature of −15 °C in 2016–2018 is below −5 °C in 2020. Measurements of the internal temperature of the building show that during the cold months, due to the large thermal capacity of the building, the weather-station-controlled external blinds, and the well-functioning heating and ventilation systems, the internal temperature varies by between 1 and 1.5 °C. In order to make the most of the solar gain in winter, it would be appropriate to incorporate weather forecasting and artificial intelligence into the control algorithm of the heating system for setting the indoor comfort temperature thresholds.
Out of 1807 days, only 99 days had an indoor temperature above 25 °C, which is 5.42% of the days in a year. The highest indoor temperature recorded was 26.39 °C, and only 9 days in the entire 5-year period were above 25 °C. On these days, the outdoor temperature did not exceed 23 °C, and it can therefore be concluded that this is due to the circumstances of the building’s operation, such as the presence of guests in the house, cooking, and the intensive use of other heat-emitting electrical appliances.
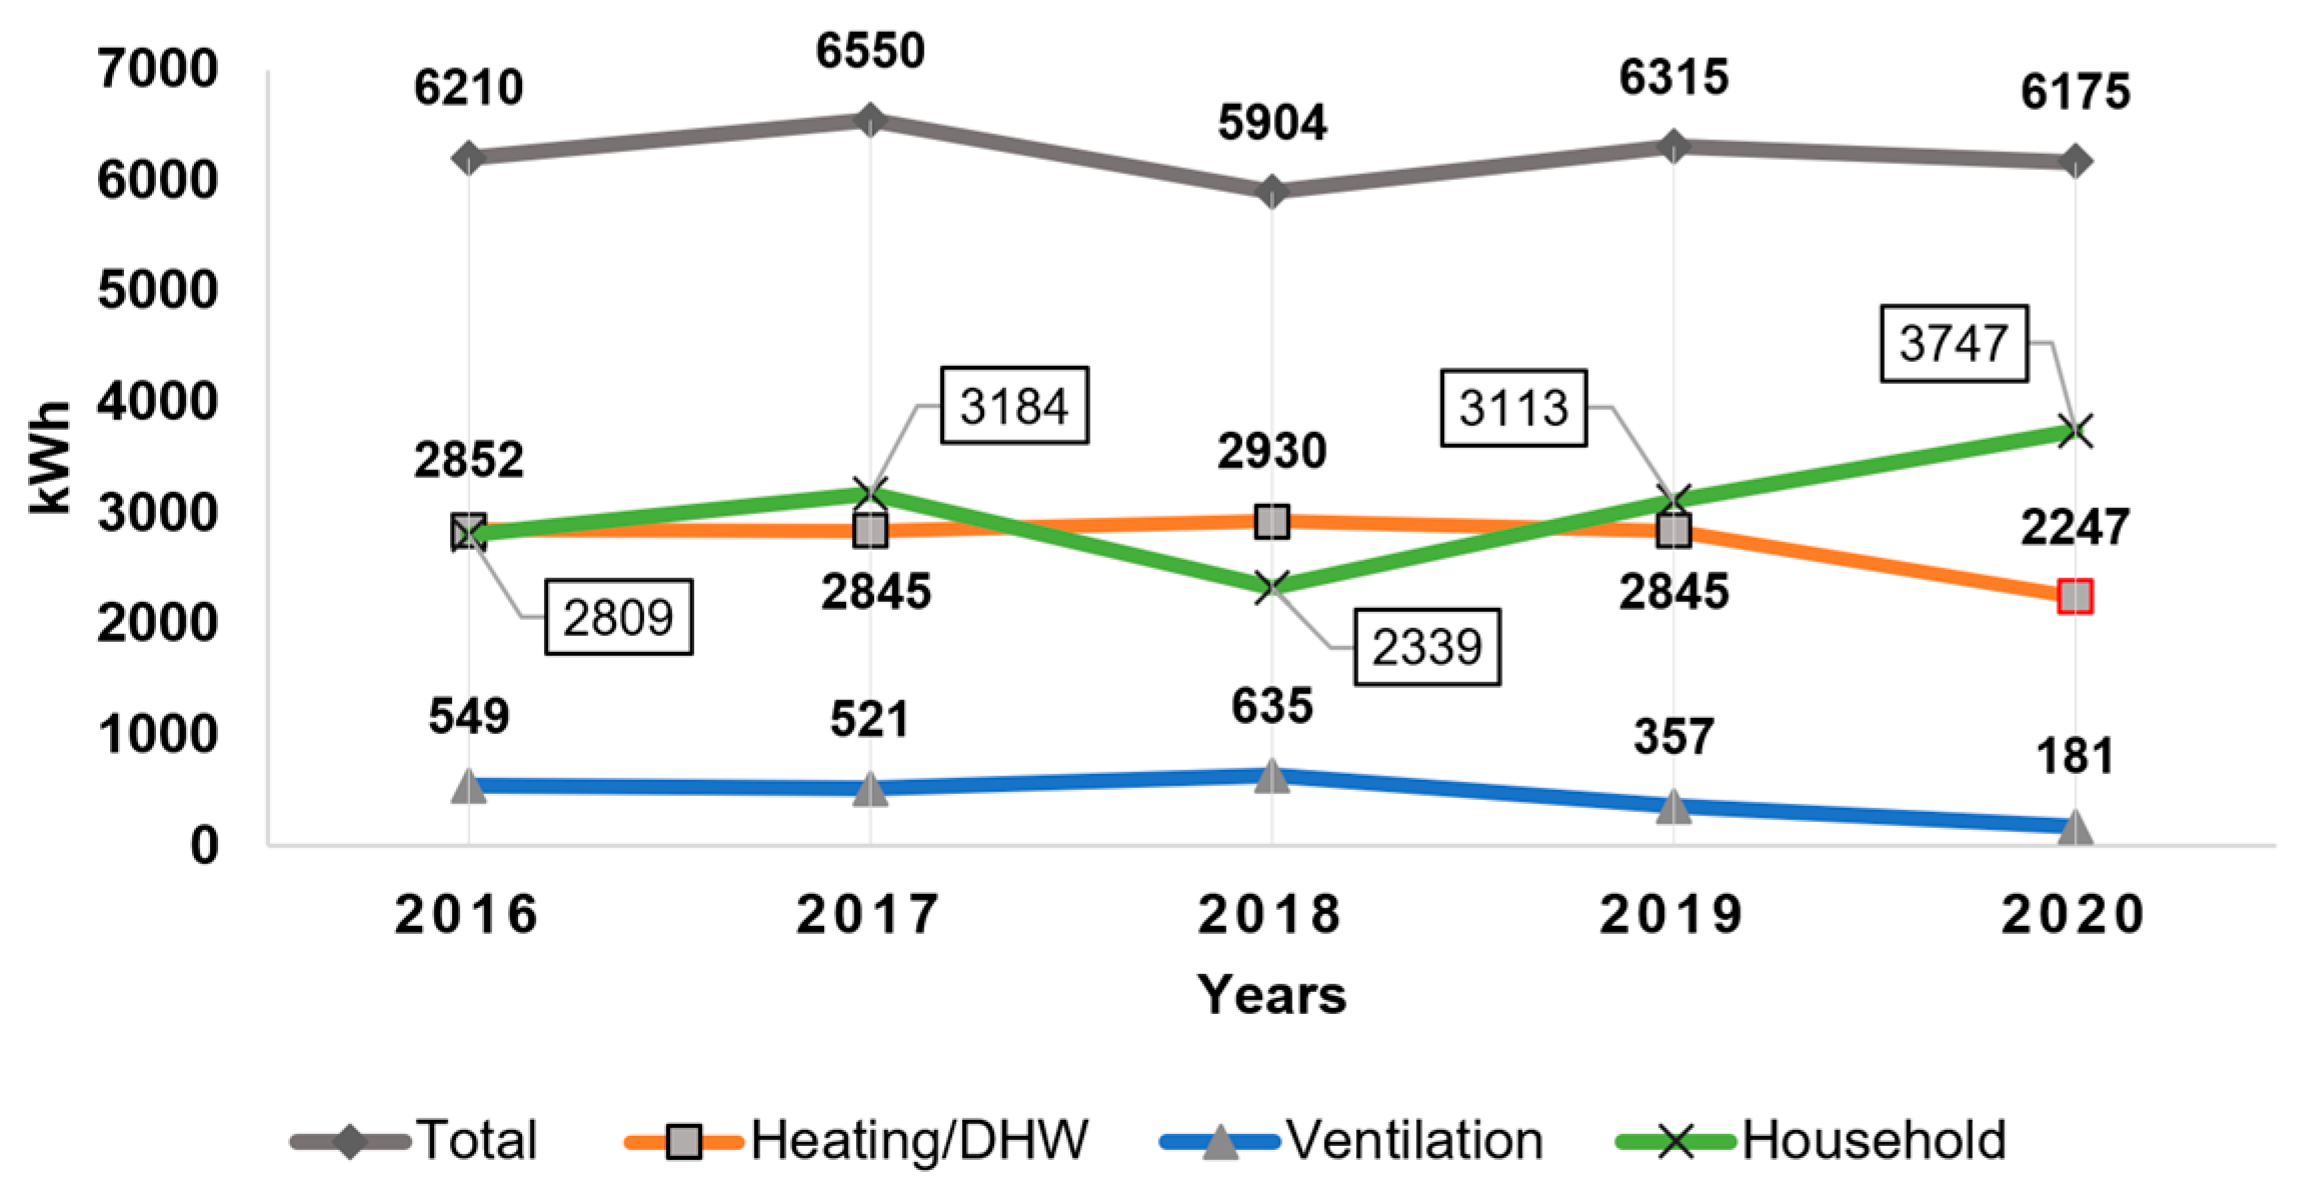
The measured total electricity consumption is shown in Figure 11. The analysis shows that the electricity demand for heating and hot water accounts for about half of the total electricity consumption and is similar to the consumption of domestic electrical appliances in the house.
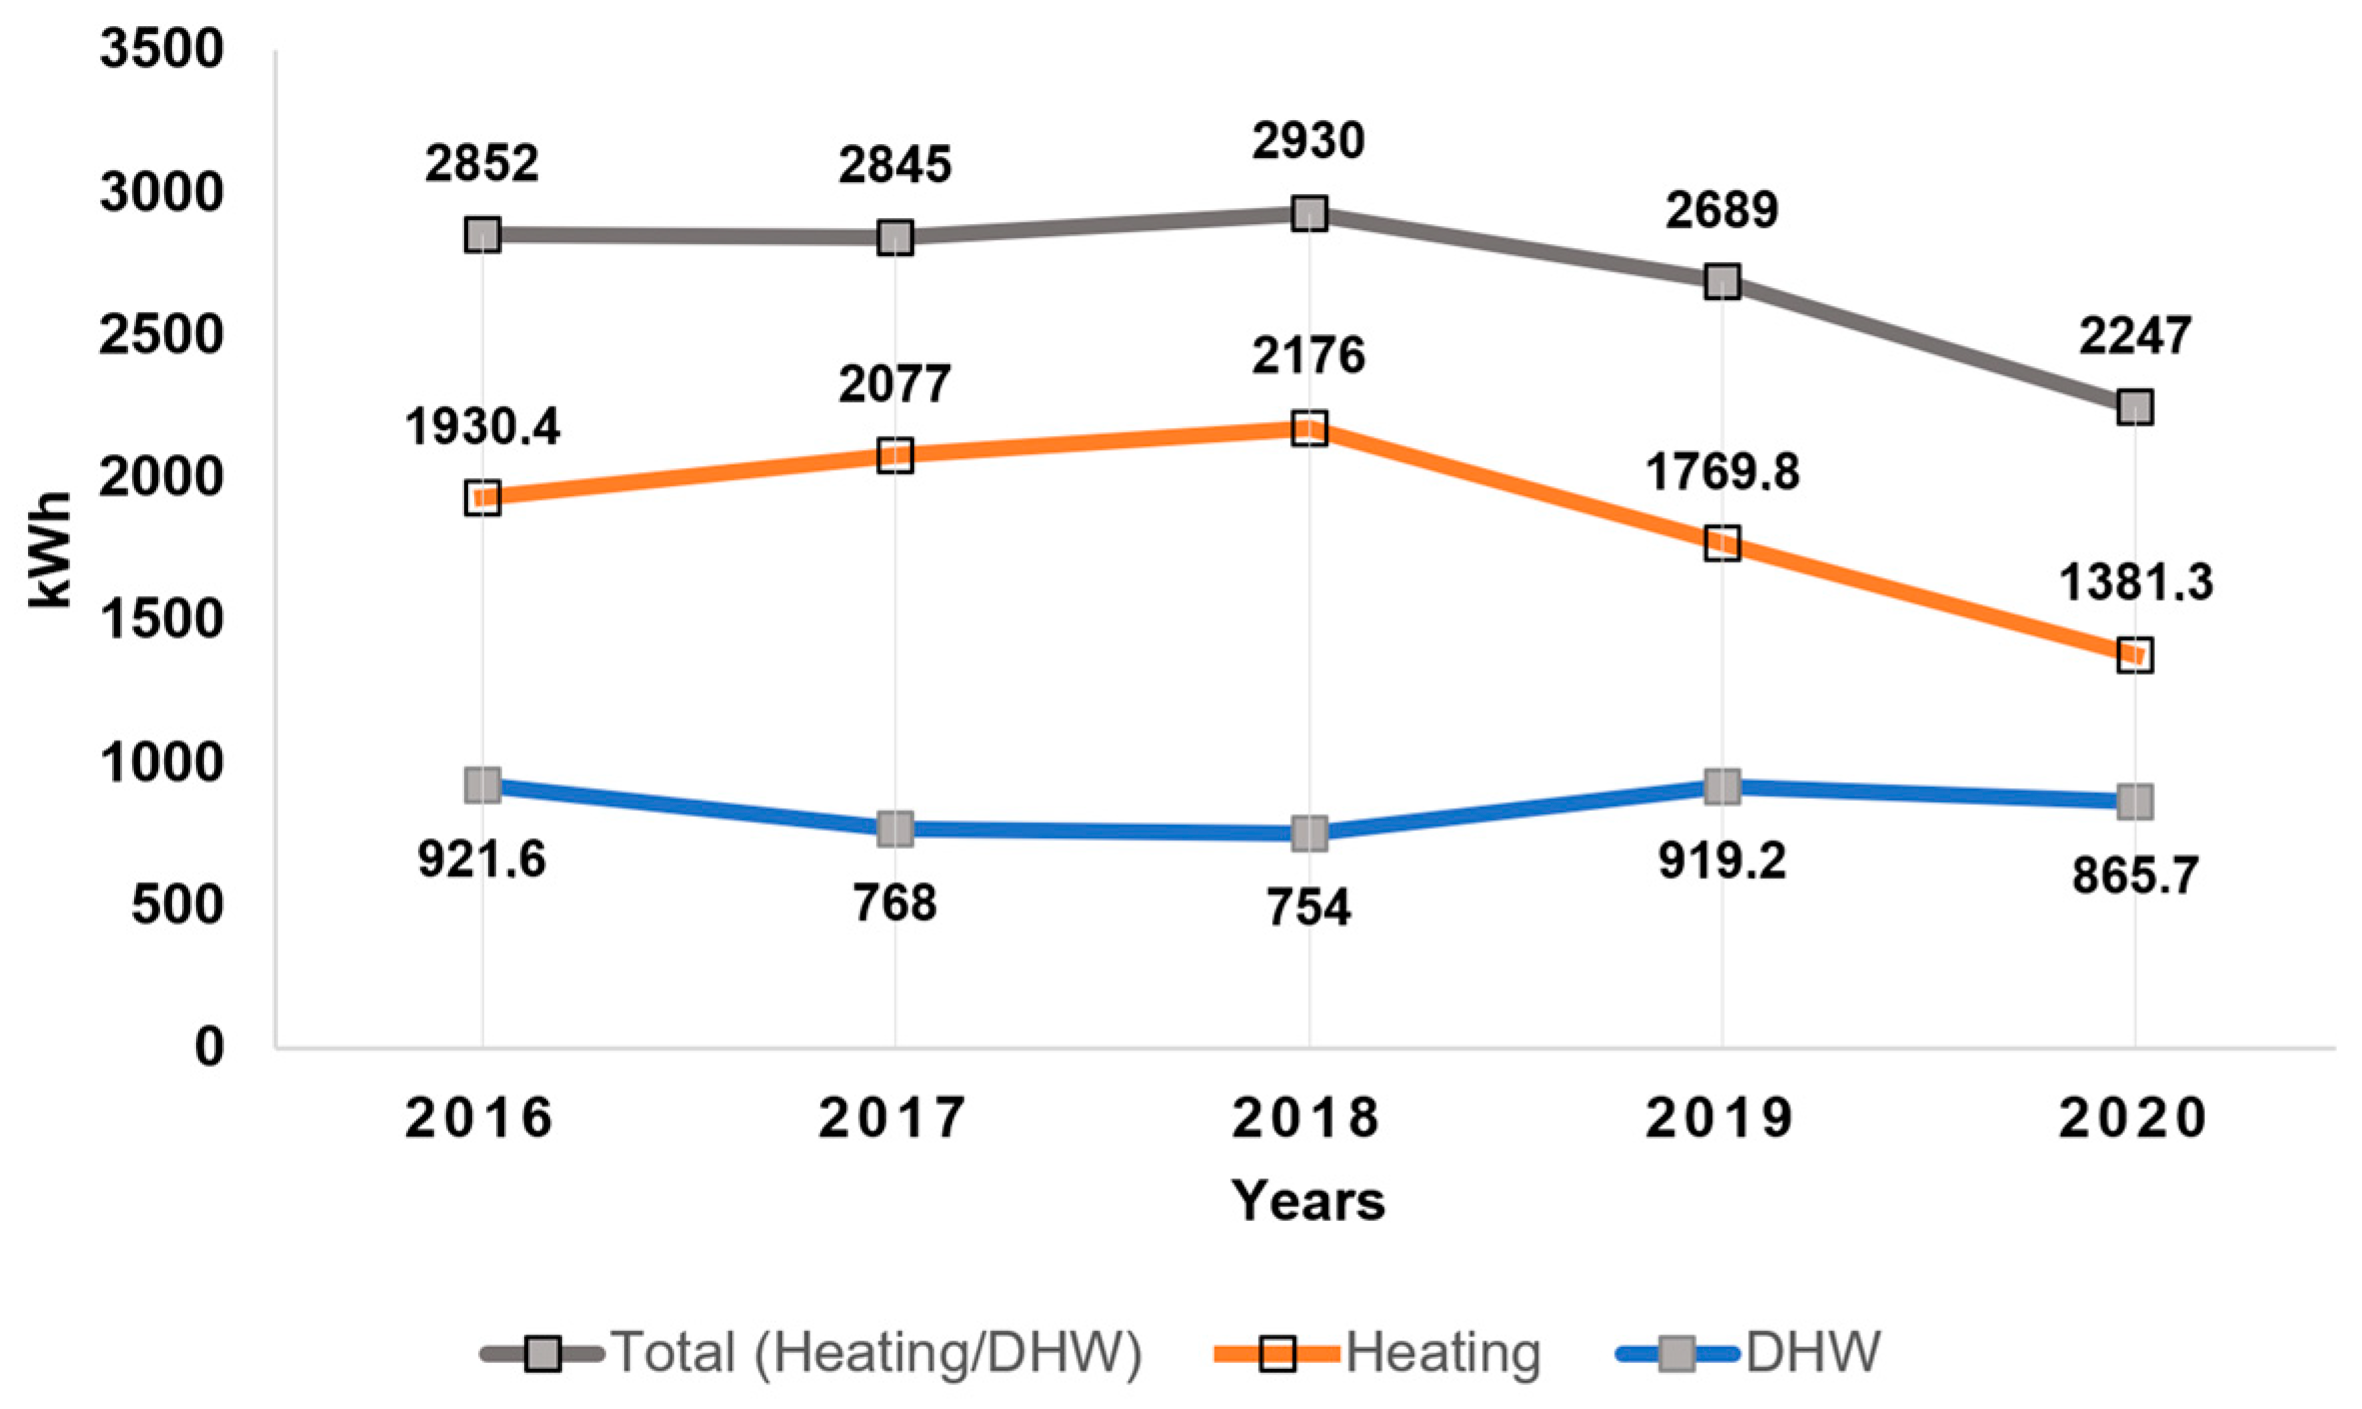
The electricity demand for DHW preparation outside the heating season allowed us to decompose the total amount of electricity consumed by the heat pump for heating and hot water separately, as shown in Figure 12. The electricity consumption for heating the 169.20 m2 house did not exceed 2200 kWh/year for five years. Compared to 2016, the electricity consumption for heating the building was 7.6% higher in 2017, 12.7% higher in 2018, 8.3% higher in 2019, and 28.4% lower in 2020. In the case of the use of the constant algorithm, the reasons for this decrease could be the approach of the U-values of the building structures to the design values due to their drying out, as well as the increase in the annual average outdoor air temperature. Looking at the energy consumption for heating and DHW preparation, it can be seen that the biggest challenge in finding further cost reduction measures will be their payback.
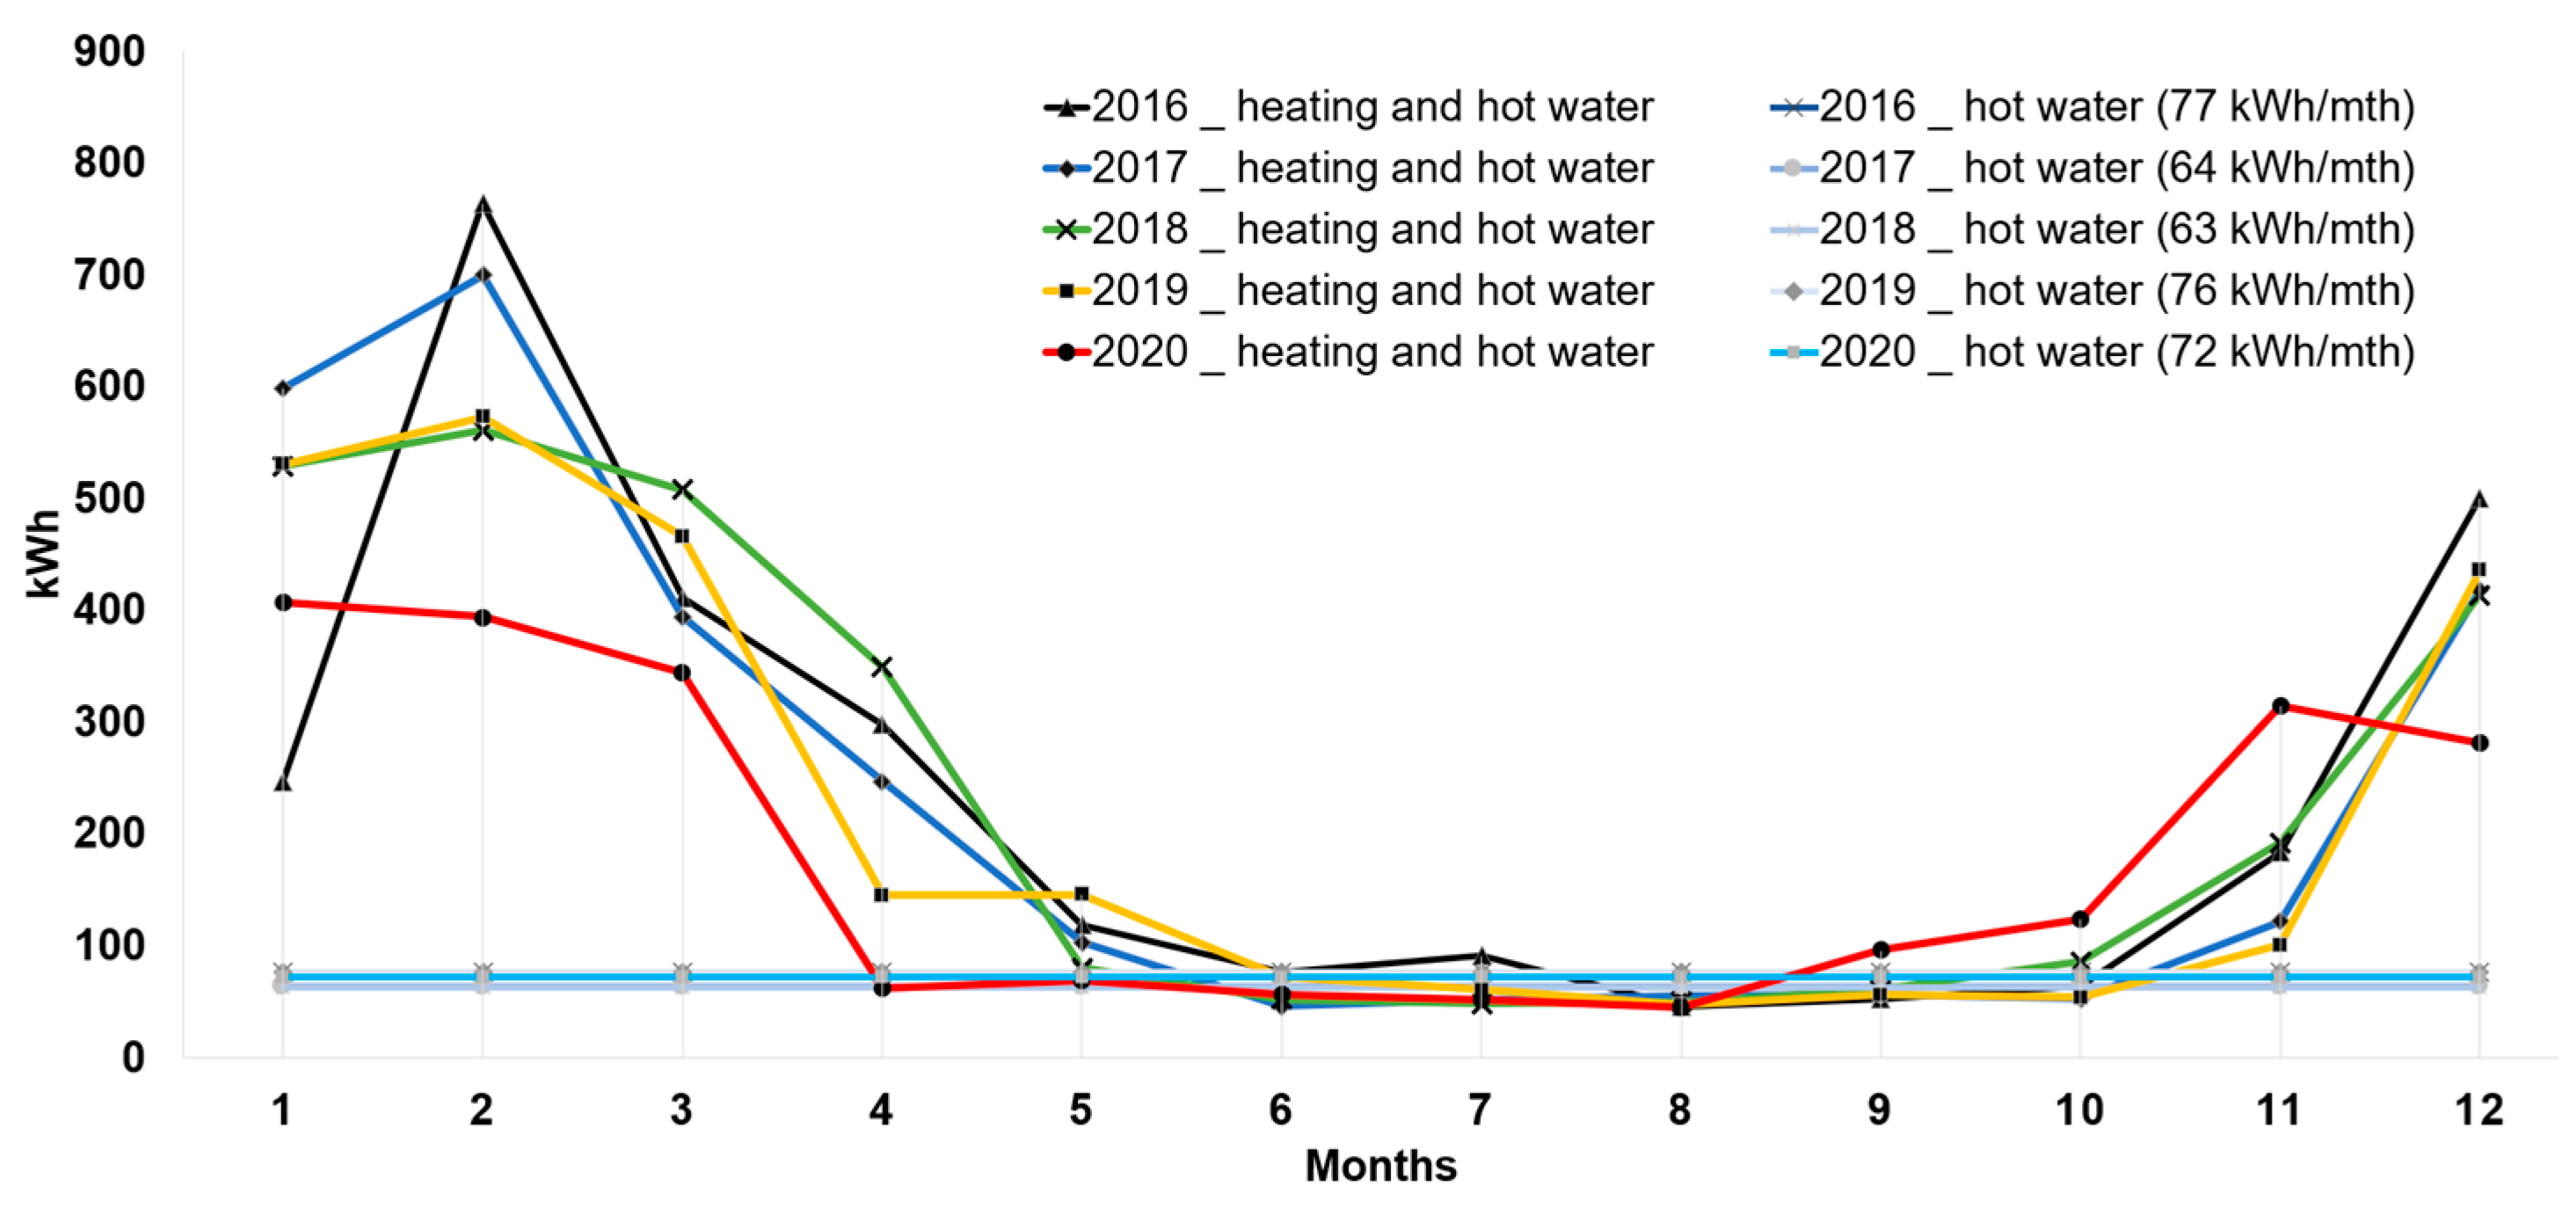
Figure 13 shows the five-year trends in monthly electricity consumption for heating and DHW for the building, which remained similar between years. The highest consumption was in December and February. At the same time, the electricity consumption for DHW preparation remained similar throughout the measurement period, averaging around 845 kWh/a.
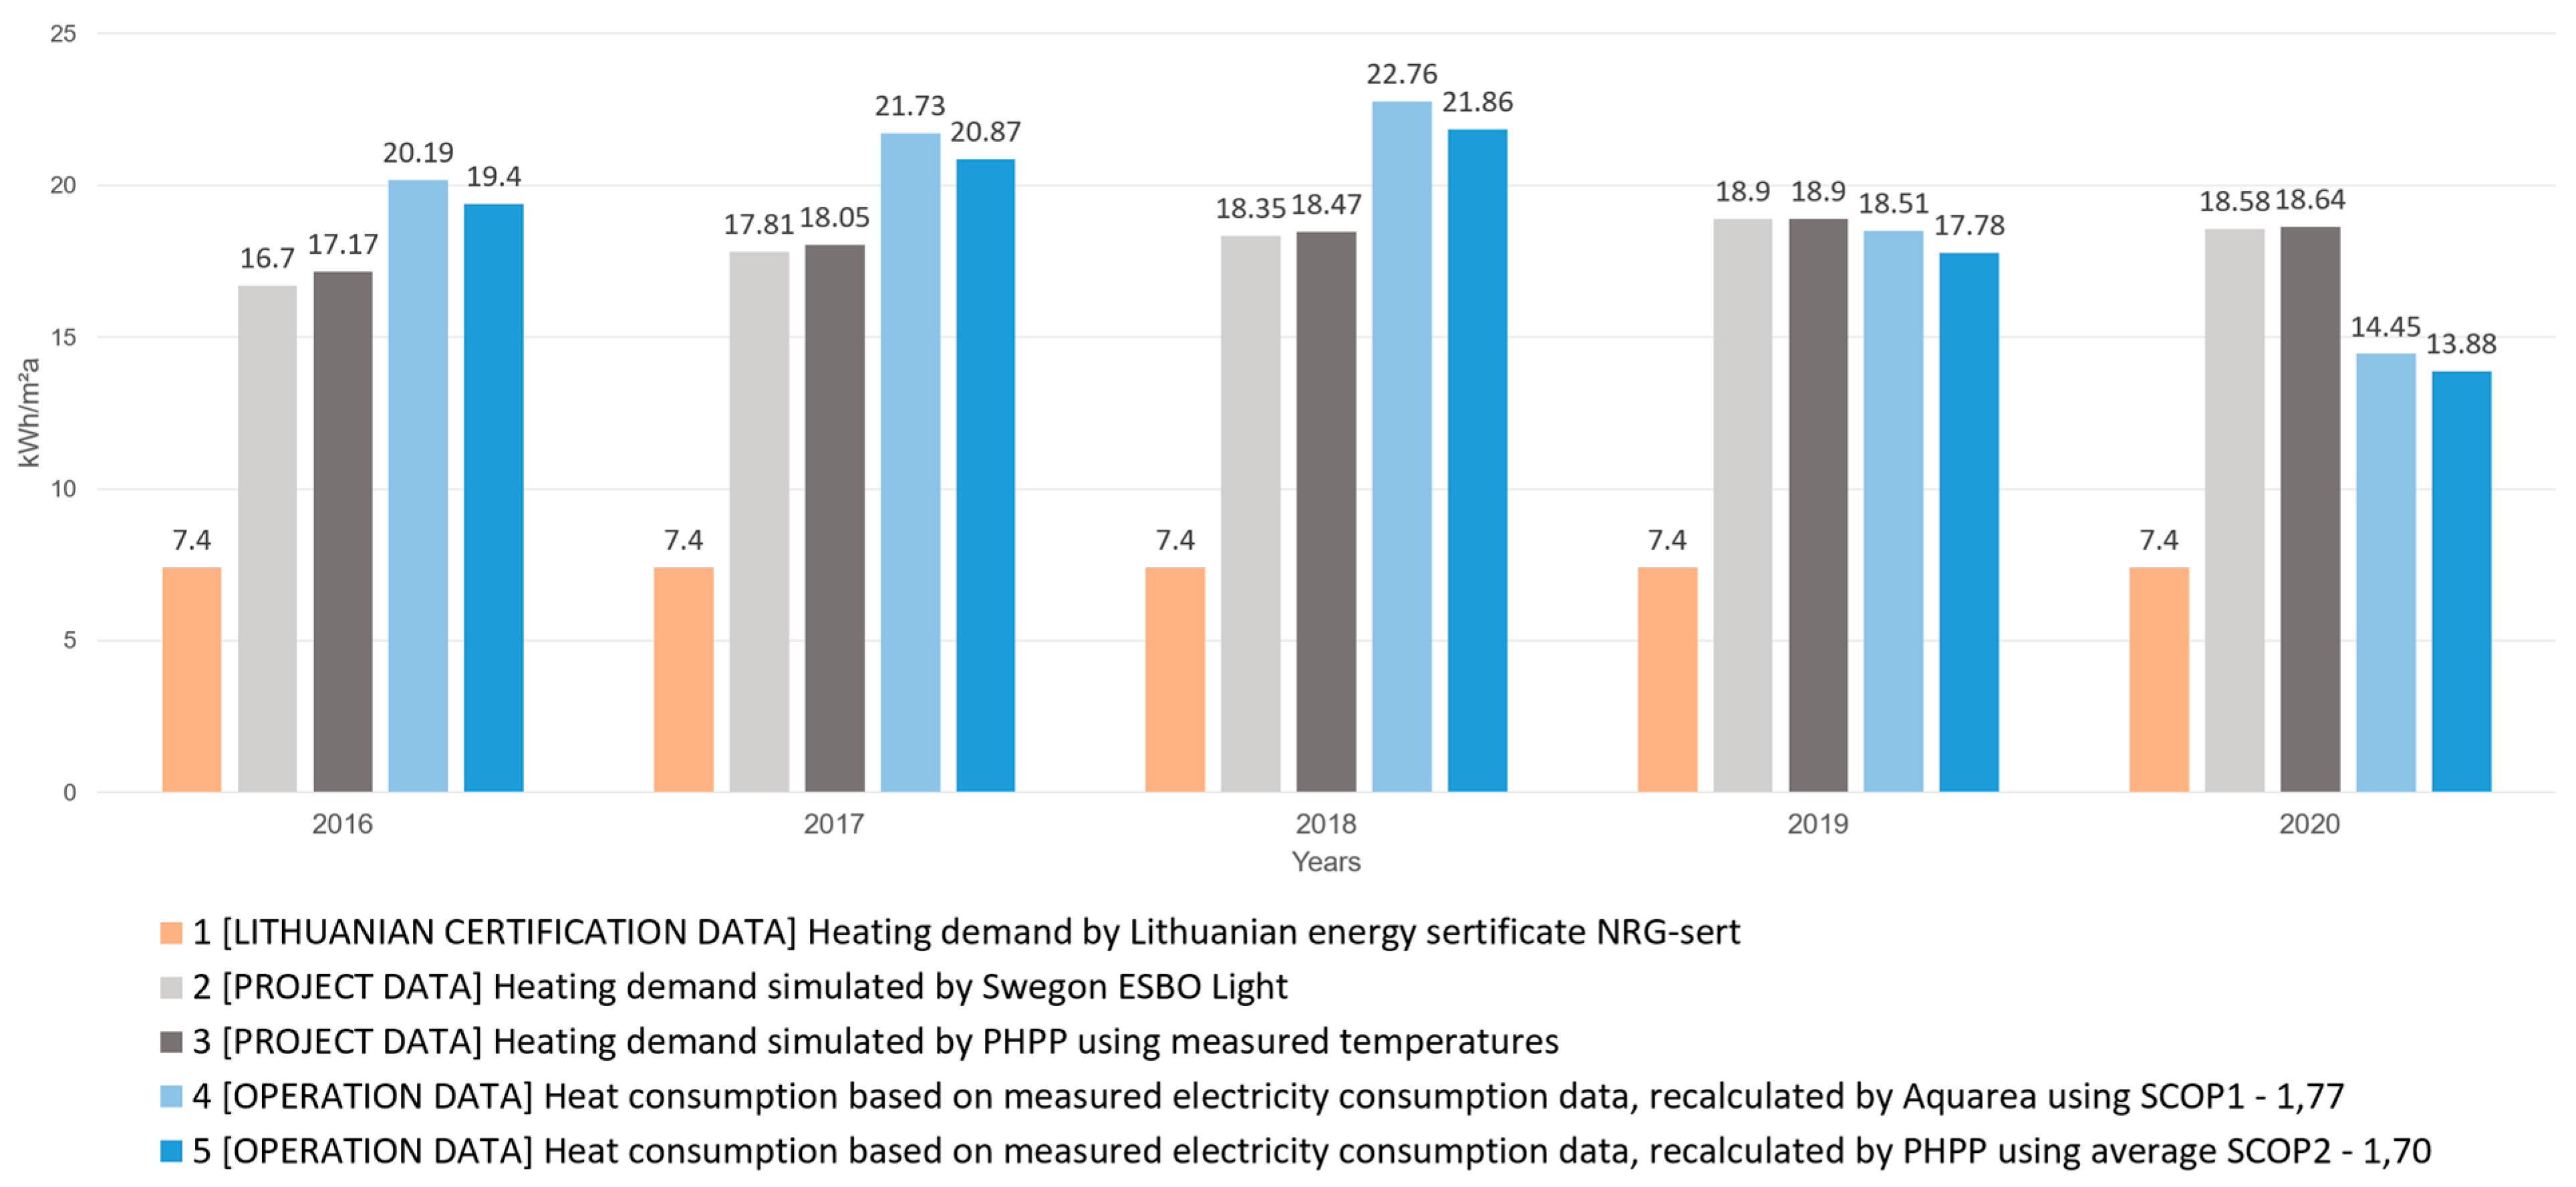
This study compared the Swegon- and PHPP-designed thermal energy consumption for building heating with the PHPP- and Aquarea-designed operational results for building heating consumption, which can be seen in Figure 14. The results were also compared with the heat consumption for building heating determined by the Lithuanian national certification programme NRGsert 3.
Figure 14 shows the following:
Column 1 [LITHUANIAN CERTIFICATION DATA]: the Lithuanian energy performance certification programme NRGsert 3 produced the same heat demand value of 7.4 kWh/m2 a for all years.
Column 2 [PROJECT DATA]: Swegon ESBO Light 2.4.0.3, simulating the measured average indoor temperatures of the heating season for each year of this study, obtained the heating demand for the building.
Column 3 [PROJECT DATA]: in the PHPP 8.5, by simulating the measured average indoor temperatures for the heating season for each year of this study, the heating demand for the building was obtained.
Column 4 [OPERATION DATA]: SCOP1 = 1.77 was set in the heat pump simulation program Aquarea 2013. The heating consumption was then calculated from the SCOP1 and the measured electricity consumption for heating the building.
Column 5 [OPERATION DATA]: From the results of the PHPP 8.5 simulation of the building heating demand and the measured data of the electricity consumption for heating the building, an average SCOP2 = 1.70 was calculated. From the SCOP2 and the measured electricity consumption for heating the building, the heating consumption was calculated.
The average indoor temperature for the heating season was 21.00 °C in 2016, 21.48 °C in 2017, 21.70 °C in 2018, 21.92 °C in 2019, and 21.79 °C in 2020, and the design heating costs for both Swegon (column 2) and the PHPP (column 3) were recalculated accordingly. In contrast, the Lithuanian energy performance certification programme NRGsert 3 does not correlate the space heating demand with the changing indoor temperature of the building but considers it to be 20 °C.
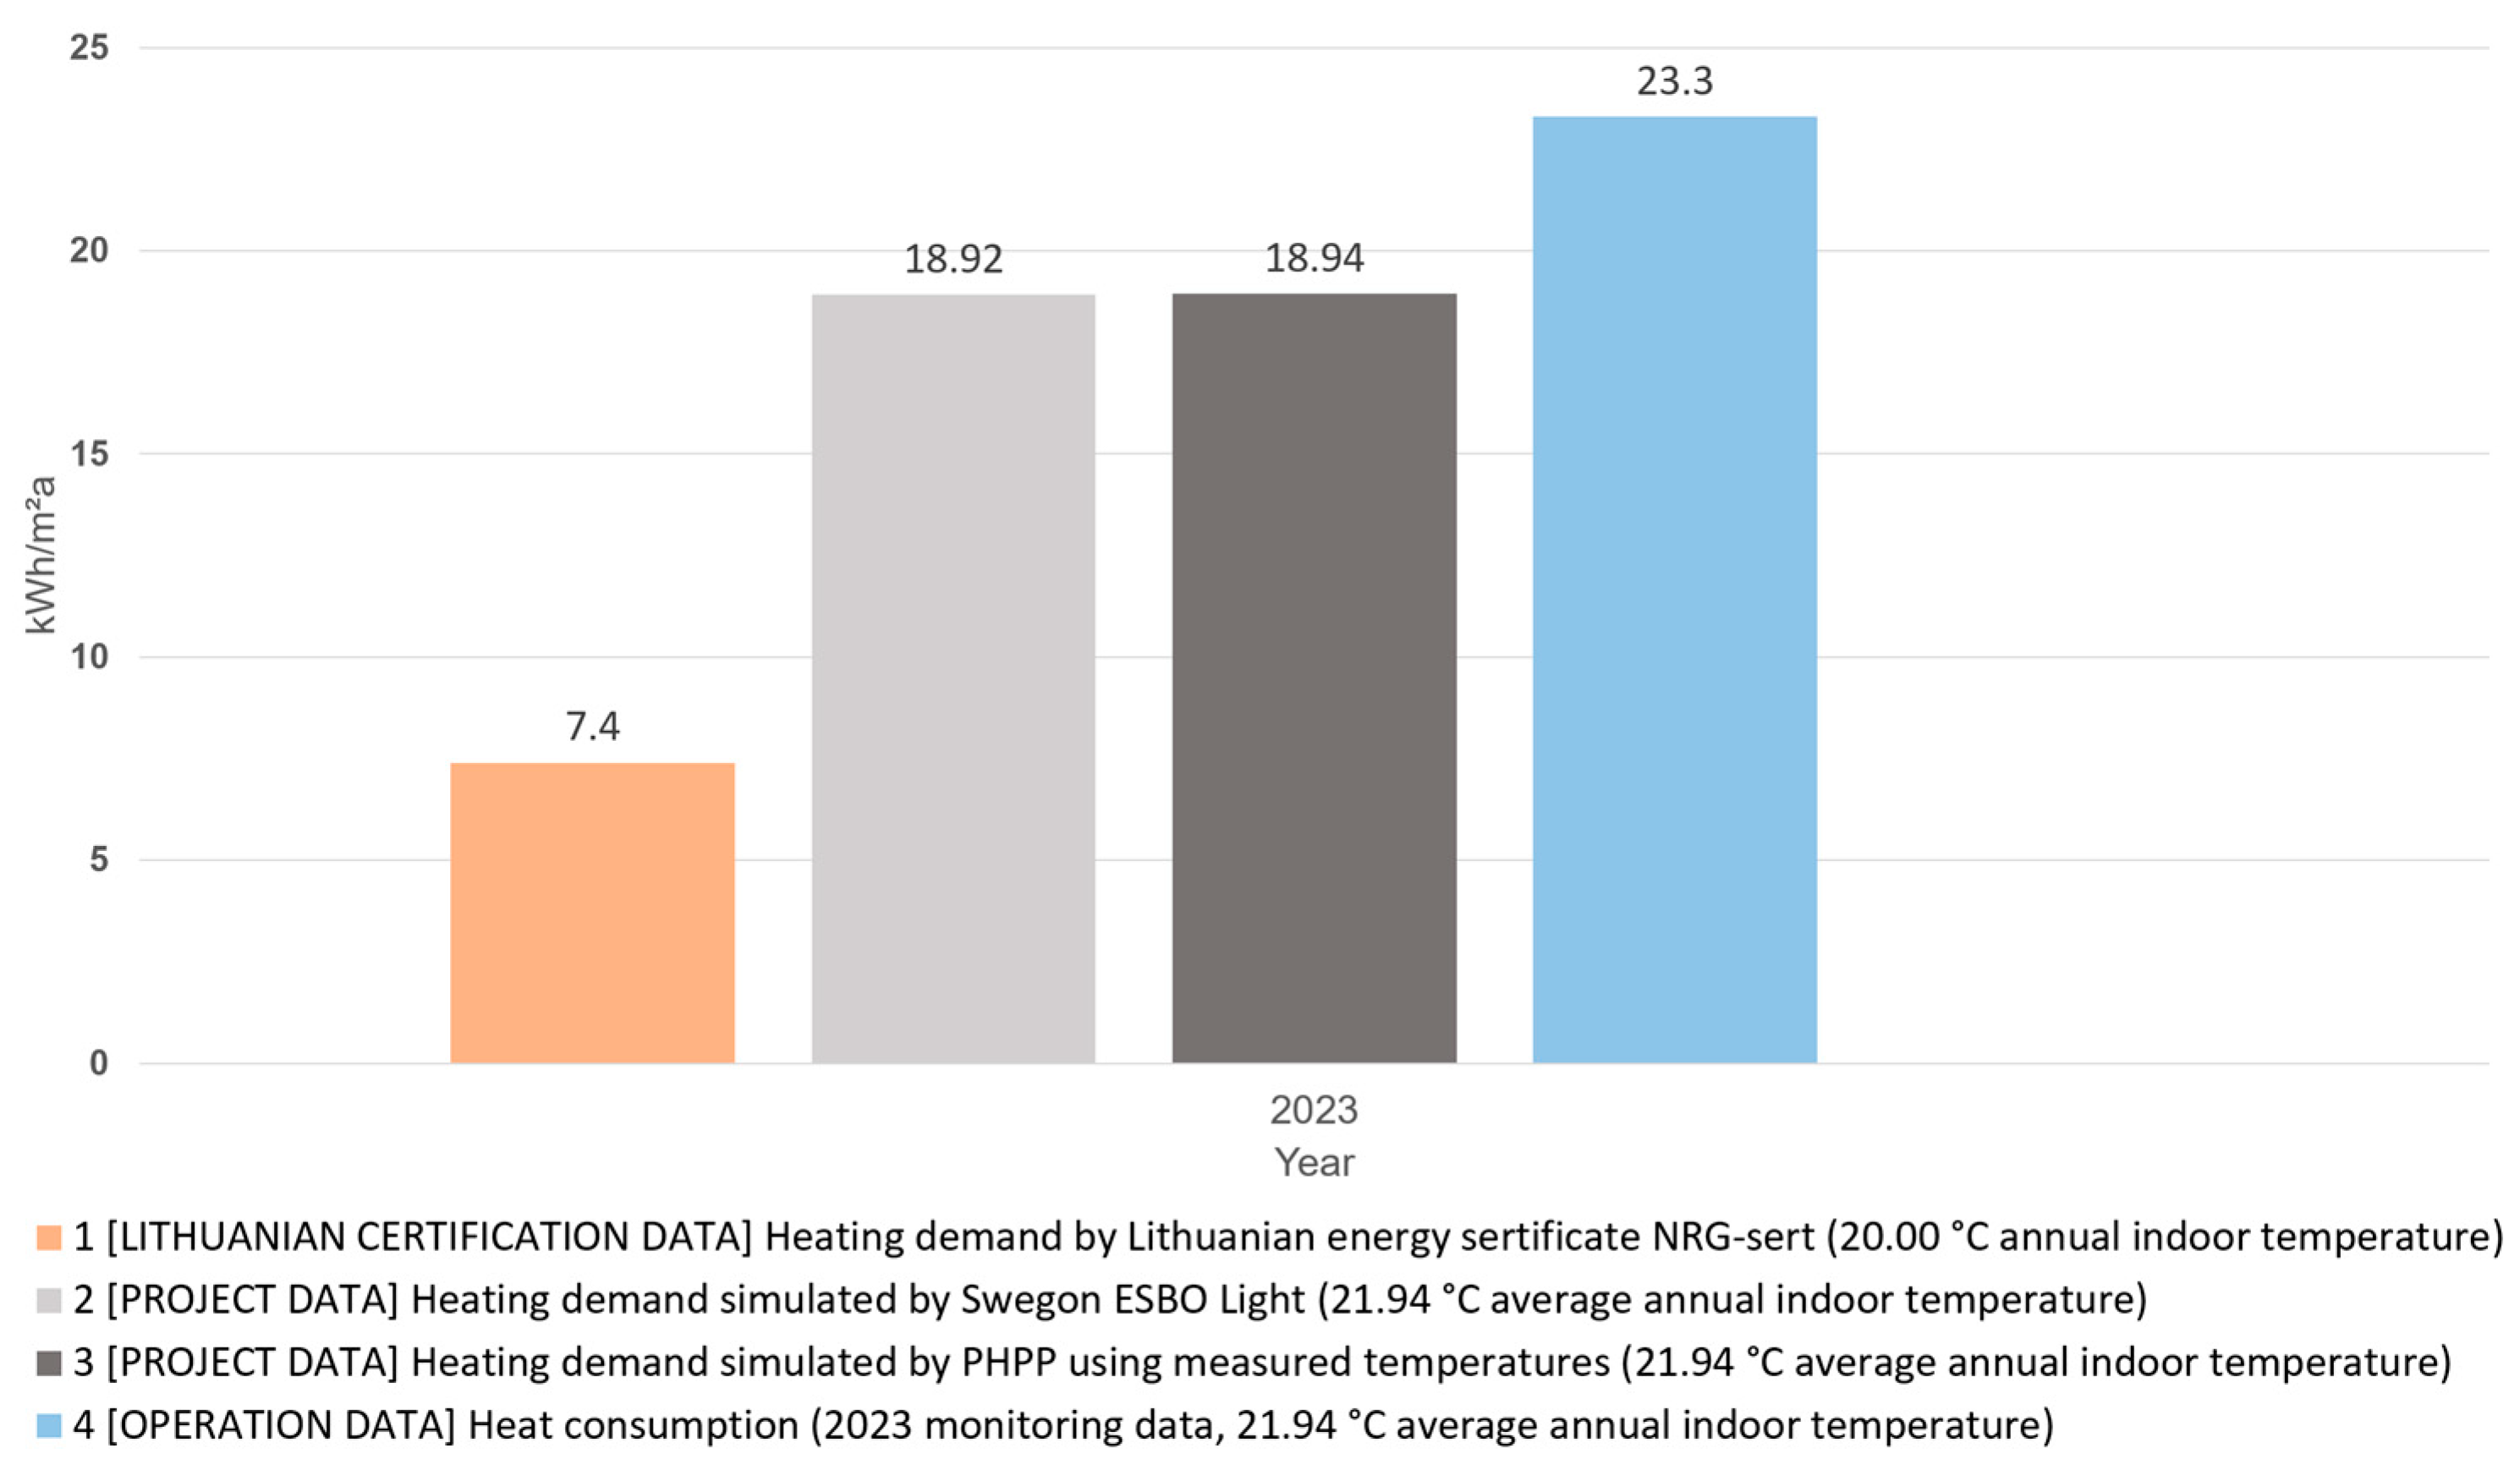
In 2023, LT-PH3 was equipped with a QALCSONIC E3 ultrasonic meter from UAB Axioma Metering to measure the thermal energy used to heat the building. From 1 June 2023 to 31 May 2024, the heat consumption of the LT-PH3 building measured by the heat meter was 3942 kWh/m2 or 23.30 kWh/(m2 a). The measurements showed that the heating of the patio took place over a period of six months, with a peak heat consumption of 1084 kWh in January 2024. The heat consumption measured by the heat meter to heat LT-PH3 is shown in Figure 15.
The average indoor air temperature for the heating season during this monitoring period was 21.94 °C. The comparison of the measured heat consumption and the design heat demand results for the building as modelled by the PHPP 8.5 and Swegon ESBO Light 2.4.0.3 based on the actual average indoor temperature in Figure 16 shows that the building uses 4.38 kWh/(m2 a) more for heating than predicted by the PHPP 8.5 and Swegon ESBO Light 2.4.0.3, which is 19 per cent of the modelled results. The result of this one-year monitoring is similar to the results obtained in 2016–2018. The reasons for the difference between the values predicted by the design and those measured during operation should be sought in the evaluation of the variation in the building use algorithm during the monitoring year, as well as in the outdoor average temperature and solar gain.
This study showed that the uncompromising, precise algorithm of the Passive House design system and the principle of “Efficiency NOW!” resulted in a house built in 2015 being several times more energy efficient than the highest energy efficiency class, A++, houses of this size being built in Lithuania today. Today, LT-PH3, designed ten years ago, still illustrates the energy efficiency and comfort of the building, the optimum construction cost, and the highest level of occupant satisfaction throughout its lifetime.

4. Discussion

This study showed that there is a need for the continuous monitoring of houses of different energy performance classes, different certification schemes, and different constructions. By observing actual use and assessing the changing climatic conditions in different locations, it is appropriate to analyse the rationality of the solutions adopted in buildings and to improve national modelling and certification tools. There is also a need for the continuous monitoring of the dynamically changing environment, the climate, the economy, the building users’ behaviour, the level of education in the construction sector, and other factors affecting the building, as the correct conclusions drawn two years ago may no longer be valid today.
Focusing only on the beauty of the building or only on energy efficiency will not lead to a comfortable building. The algorithm for designing buildings for different purposes, the role of the architect in it, the characteristics of the use of buildings and the challenges it poses, the climatic, economic, social, cultural conditions, and many other elements are different. Therefore, in order to develop an algorithm for the design of an energy-efficient and CO2-neutral single-family dwelling, we need to look at a single-family dwelling that has been designed, constructed, and actually used in accordance with best practice. To increase the applicability of Passive House research and the attractiveness of the PH system, it is necessary to improve the database of constructed houses to facilitate finding a building that is as close as possible to the basic comparative data (BCD).
This study showed that the correlation between the indoor temperature and energy costs for heating a compact building using the PHPP 8.5 and Swegon 2.4.0.3 modelling did not exceed 3.0%, 2.72% in 2016, 1.31% in 2017, 0.67% in 2018, 0.00% in 2019, and 0.35% in 2020, as shown in Figure 9b. In the future, it would be appropriate to test this in buildings with different compactness indexes—A/V ratios. The analysis of indoor and outdoor temperatures in LT-PH3 showed that the engineering systems and the overheating control solutions today provide the comfort required for Passive House requirements, as well as the satisfaction of the building occupants. However, the rising annual average outdoor air temperature and the increasing number of days per year when the building overheats make it necessary to consider the need to use future climate data from climate projections to model overheating.
To increase the accuracy of the modelling, the building use algorithm should be considered in addition to the climate, the internal heat gains should be evaluated, and the single-dwelling house should be tested for different future scenarios, for example, for the period of its lifetime when the children grow up and the house is once again occupied by only two people.
Due to the size of the investment required, in Lithuania, a builder with no experience in this field usually builds a single-family house for his family once in his lifetime. Once a house is built, during its life cycle, most people no longer have the savings to carry out significant structural changes to improve the quality of life or energy efficiency and simple repairs. In addition, the effective renovation of an existing house is often not technically feasible and cannot be economically justified in terms of the logic of the return on investment. In order to design a sustainable single-family house from scratch, there is a need for a straightforward algorithm for a sustainable, comfortable, and energy-efficient house that is understandable to both the building sector and the builder and for educational templates that all can quickly and easily use to acquire the interdisciplinary knowledge needed to make the right steps and decisions.

5. Conclusions

The conclusions of this study are as follows:
  • Comparing the PHPP- and Swegon-designed heat consumption for heating the building with the measured heat consumption, we can see that compared to 2016, the electricity consumption for building heating was 7.6% higher in 2017, 12.7% higher in 2018, 8.3% higher in 2019, and 28.4% lower in 2020. Meanwhile, the data reported in the national certificate differ by a factor of two to three from the monitoring results obtained. This discrepancy requires a separate study.
  • This study shows the consistency of the BPS tools used during validation and confirms that modelling the thermal energy demand of a compact single-family dwelling with the PHPP 8.5 or Swegon 2.4.0.3 can reasonably be expected to produce similar results to those during its operation. This leads to more confidence in the building performance simulation (BPS) process, and to build on this confidence, a coordinated monitoring of the unified algorithm is needed, as well as research and the publication of the results and their use in the development of the national energy efficiency modelling tool NRGpro 4.
  • The SCOP calculation using the heat pump manufacturer’s modelling software Aquarea 2013 resulted in (SCOP1) 1.77, and the SCOP calculated with the PHPP 8.5 (SCOP2) was 1.70. This resulted in similar results for the operational heat consumption to heat the building but showed a lower SCOP than declared by the heat pump manufacturers.
  • The conditions in and around the house are constantly changing throughout its lifetime. The complexity and necessity of the LT-PH3 heat meter installation has made it necessary to foresee solutions for the collection of baseline monitoring data for one- and two-family dwellings and to integrate it into the relevant engineering systems already at the project design stage. Heat meters for heating and DHW preparation, electricity sub-meters for the main utilities and power supply zones, and sensors for indoor and outdoor temperature, solar insolation, indoor humidity, and CO2 would not only show the real situation but would also help to effectively adapt not only to changes in the building’s use scenarios but also to climate change.
  • No changes were necessary during the nine years of the building’s life and intensive use, which confirms the sustainability of the building as a whole and of the development process itself.
  • Single-family and semi-detached dwellings occupy a significant part of the Lithuanian residential building stock, and in order to improve the comfort and quality of newly designed and renovated buildings, it is essential that the use of building performance simulation (BPS) tools is mandatory and regulated and that energy efficiency modelling becomes a mandatory part of the project.

Supplementary Materials

The following supporting information can be downloaded at https://www.mdpi.com/article/10.3390/su162410798/s1. Project Documentation. Gebäude-Dokumentation.

Author Contributions

Conceptualisation, R.A. and K.V.; methodology, R.A. and K.V.; software, R.A.; validation, R.A. and K.V.; formal analysis, R.A. and K.V.; investigation, R.A.; resources, R.A.; data curation, R.A.; writing—original draft preparation, R.A., K.V. and G.S.; writing—review and editing, R.A., G.S. and K.V.; visualisation, R.A.; supervision, K.V. All authors have read and agreed to the published version of the manuscript.

Funding

This research received no external funding.

Institutional Review Board Statement

Not applicable.

Informed Consent Statement

Not applicable.

Data Availability Statement

There are restrictions on the datasets. The datasets contained in this article are not readily accessible due to the protection of private personal data. Requests for access to the datasets should be sent to rimvydas.adomaitis@lei.lt.

Acknowledgments

The authors are grateful to the family of the house builders from its beginning in 2016 until today. Additionally, the authors acknowledge AXIOMA SERVISAS UAB and Dorteksa UAB.

Conflicts of Interest

The authors declare no conflicts of interest.

Nomenclature

Abbreviations
Aquarea 2013Aquarea Designer Online Simulation Software Tool 2013
BPSBuilding performance simulation
DHWDomestic hot water
EnerPHitPassive-House-oriented set of requirements for retrofits
EUEuropean Union
HVACHeating, ventilation, and air conditioning
LT-PH3Lithuania’s first single-room Passive House
NRGpro 4Lithuanian national building energy performance modelling programme, edition 4
NRGsert 3Lithuanian National Energy Performance of Buildings Certification Programme, edition 3
PENSEnergy Performance of Buildings Certification Methodology used in Lithuania
PH Passive House—a house certified by the German Passive House Institute
PHPPPassive House Design and Certification Programme
SCOPSeasonal Coefficient of Performance
SLDBuilding permit in Lithuania
Swegon 2.4.0.3Swegon ESBO Light 2.4.0.3—building performance simulation software
Symbol
g Transmittance of solar gain through glazing
U Overall heat transfer coefficient of structures
Ug Thermal transmittance of glass

References

  1. Sousa, M.L.; Dimova, S.; Athanasopoulou, A.; Dyngeland, T.; Pinto, A.; Rianna, G.; Mercogliano, P.; Villani, V.; Nogal, M.; Gervasio, H.; et al. Expected Implications of Climate Change on the Corrosion of Structures; EUR 30303 EN; Publications Office of the European Union: Luxembourg, 2020; ISBN 978-92-76-20782-5. [Google Scholar] [CrossRef]
  2. Climate Change. Klimato Kaitos Laiko Juosta/Climate Change Timeline. Available online: https://klimatokaita.lt/visuomenei/klimato-kaitos-laiko-juosta/ (accessed on 30 September 2024).
  3. Gamtos paveldo fondas. Studija, Nustatanti Atskirų Sektorių Jautrumą Klimato Kaitos Poveikiui, Rizikos Vertinimą ir Galimybes Prisitaikyti Prie Klimato Kaitos/Study on Sectoral Vulnerability to Climate Change, Risk Assessment and Adaptation Options; Gamtos Paveldo Fondas: Vilnius, Lithuania, 2015; Available online: https://am.lrv.lt/uploads/am/documents/files/Klimato_kaita/jautrumo_studija.pdf (accessed on 30 September 2024). (In Lithuanian)
  4. Beck, H.E.; Zimmermann, N.E.; McVicar, T.R.; Vergopolan, N.; Berg, A.; Wood, E.F. Present and Future Köppen-Geiger Climate Classification Maps at 1-Km Resolution. Sci. Data 2018, 5, 180214. [Google Scholar] [CrossRef] [PubMed]
  5. Council of the EU. Fit for 55: Making Buildings in the EU Greener. Available online: https://www.consilium.europa.eu/en/infographics/fit-for-55-making-buildings-in-the-eu-greener/ (accessed on 30 September 2024).
  6. ADEME. Energy Efficiency Trends and Policies. Available online: https://www.odyssee-mure.eu/publications/efficiency-trends-policies-profiles/lithuania.html (accessed on 7 October 2024).
  7. The European Parliment and the Council of the European Union. Directive (EU) 2023/1791 of the European Parliament and of the Council of 13 September 2023 on Energy Efficiency and Amending Regulation (EU) 2023/955 (Recast). Off. J. Eur. Union 2023, 2023, 1–231. [Google Scholar]
  8. Government of the Republic of Lithuania. Long-Term Renovation Strategy of Lithuania; Vilnius, Lithuania. 2021. Available online: https://energy.ec.europa.eu/system/files/2021-08/lt_2020_ltrs_en_0.pdf (accessed on 30 September 2024).
  9. Hirvonen, J.; Heljo, J.; Jokisalo, J.; Kurvinen, A.; Saari, A.; Niemelä, T.; Sankelo, P.; Kosonen, R. Emissions and Power Demand in Optimal Energy Retrofit Scenarios of the Finnish Building Stock by 2050. Sustain. Cities Soc. 2021, 70, 102896. [Google Scholar] [CrossRef]
  10. Parliament of the Republic of Lithuania. National Energy Policy Strategy for Energy Independence; Parliament of the Republic of Lithuania: Vilnius, Lithuania, 2024; p. 72. [Google Scholar]
  11. Minister for the Environment of the Republic of Lithuania. STR 2.01.02:2016. Design and Certification of Energy Performance of Buildings. Lithuania; 2016; p. 279. Available online: https://e-seimas.lrs.lt/portal/legalAct/lt/TAD/15767120a80711e68987e8320e9a5185/asr (accessed on 30 September 2024). (In Lithuanian).
  12. SSVA. Building Energy Performance Design Software NRGpro. Available online: https://www.ssva.lt/cms/paslaugos/pastatu-energetinis-naudingumas/pastatu-energetinio-projektavimo-programa-nrgpro (accessed on 21 September 2024).
  13. State Enterprise Centre of Registers. Registration of Newly Built Detached and Semi-Detached Houses. Available online: https://www.registrucentras.lt/naujienos/index.php?mod=news&act=view&id=53767 (accessed on 19 December 2023). (In Lithuanian).
  14. Official Statistics Portal. Comparison of the Area of the New Buildings Completed in Lithuania. Available online: https://osp.stat.gov.lt/statistiniu-rodikliu-analize#/ (accessed on 13 October 2024).
  15. Fernandez-Antolin, M.M.; del Río, J.M.; Costanzo, V.; Nocera, F.; Gonzalez-Lezcano, R.A. Passive Design Strategies for Residential Buildings in Different Spanish Climate Zones. Sustainability 2019, 11, 4816. [Google Scholar] [CrossRef]
  16. Alabi, O.A.; Alabi, A.S. An Analytic Discussion on Architecture as an Art. J. Art Archit. Stud. 2020, 9, 01–04. [Google Scholar] [CrossRef]
  17. Ola, M.; Taiwo, A. Assessment of an Architectural Masterpiece in the World: Case Study of Hearst Tower, New York City. Int. J. Adv. Eng. Manag. Res. 2023, 8, 170–178. [Google Scholar] [CrossRef]
  18. Passive House Institute. Passive House Planning Package (PHPP). Available online: https://passivehouse.com/04_phpp/04_phpp.htm#PH9ip (accessed on 5 September 2024).
  19. Wang, L.; Gwilliam, J.; Jones, P. Case Study of Zero Energy House Design in UK. Energy Build. 2009, 41, 1215–1222. [Google Scholar] [CrossRef]
  20. Biaou, A.-L.; Bernier, M.A.; Ferron, Y. Simulation of Zero Net Energy Homes. In Proceedings of the IBSA France; 2006; Volume 21, p. 8. Available online: http://ibpsa.fr/jdownloads/Conferences_et_Congres/IBPSA_France/2006_journeeIBPSA_SFT/12_mbernier.pdf (accessed on 13 November 2024).
  21. Thiers, S.; Peuportier, B. Thermal and Environmental Assessment of a Passive Building Equipped with an Earth-to-Air Heat Exchanger in France. Sol. Energy 2008, 82, 820–831. [Google Scholar] [CrossRef]
  22. Mazzeo, D.; Matera, N.; Cornaro, C.; Oliveti, G.; Romagnoni, P.; De Santoli, L. EnergyPlus, IDA ICE and TRNSYS Predictive Simulation Accuracy for Building Thermal Behaviour Evaluation by Using an Experimental Campaign in Solar Test Boxes with and without a PCM Module. Energy Build. 2020, 212, 109812. [Google Scholar] [CrossRef]
  23. Rohdin, P.; Molin, A.; Moshfegh, B. Experiences from Nine Passive Houses in Sweden—Indoor Thermal Environment and Energy Use. Build. Environ. 2014, 71, 176–185. [Google Scholar] [CrossRef]
  24. Moreno-Rangel, A. Passivhaus. Encyclopedia 2021, 1, 20–29. [Google Scholar] [CrossRef]
  25. Chahardoli, S.; Khakzand, M.; Faizi, M.; Siavashi, M. Numerical Analysis of the Effect of Roof Types and Porch on Particle Dispersion and Deposition around a Low-Rise Building. J. Build. Eng. 2022, 53, 104533. [Google Scholar] [CrossRef]
  26. Kabošová, L.; Katunský, D.; Kmet, S. Wind-Based Parametric Design in the Changing Climate. Appl. Sci. 2020, 10, 8603. [Google Scholar] [CrossRef]
  27. Guirguisa, N.M.; Abd El-Aziz, A.A.; Nassief, M.M. Study of Wind Effects on Different Buildings of Pitched Roofs. Desalination 2007, 209, 190–198. [Google Scholar] [CrossRef]
  28. Huang, P.; Peng, X.; Gu, M. Aerodynamic Devices to Mitigate Rooftop Suctions on a Gable Roof Building. J. Wind Eng. Ind. Aerodyn. 2014, 135, 90–104. [Google Scholar] [CrossRef]
  29. Roslan, N.H.; Ismail, M.R. Influence of Building Shapes on Thermal and Energy Performances in Glass Façade High-Rise Buildings: A Review. MATEC Web Conf. 2018, 250, 06006. [Google Scholar] [CrossRef]
  30. Passive House Institute. Passive House Requirements. Available online: https://passivehouse.com/02_informations/02_passive-house-requirements/02_passive-house-requirements.htm (accessed on 30 September 2024).
  31. Kaklauskas, A. Passive House Model for Quantitative and Qualitative Analyses and Its Intelligent System. In Biometric and Intelligent Decision Making Support. Intelligent Systems Reference Library; Springer: Berlin/Heidelberg, Germany, 2015. [Google Scholar]
  32. Adomatis, R.; Valančius, K. Passive House Design Aspects and Analysis in Lithuania. In Proceedings of the 12th International Conference “Environmental Engineering”, Vilnius, Lithuania, 27–28 April 2023; Vilnius Gediminas Technical University: Vilnius, Lithuania; p. 11. [Google Scholar]
  33. Passivhaus Trust. Passivhaus Benefits. 2021. Available online: https://easyfairsassets.com/sites/242/2022/02/PHT_PH-Benefits-Summary_Full-report_5.0_Double-Page.pdf (accessed on 30 September 2024).
  34. Passive House Database. Database. Available online: https://passivehouse-database.org/index.php?lang=en (accessed on 23 September 2024).
  35. Passive House Accelerator. Interview with Dr. Wolfgang Feist, Founder of Passive House Institute. Available online: https://passivehouseaccelerator.com/articles/interview-with-dr-wolfgang-feist-founder-of-passive-house-institute (accessed on 1 October 2024).
  36. Schnieders, J.; Feist, W.; Rongen, L. Passive Houses for Different Climate Zones. Energy Build. 2015, 105, 71–87. [Google Scholar] [CrossRef]
  37. Schnieders, J.; Eian, T.D.; Filippi, M.; Florez, J.; Kaufmann, B.; Pallantzas, S.; Paulsen, M.; Reyes, E.; Wassouf, M.; Yeh, S.C. Design and Realisation of the Passive House Concept in Different Climate Zones. Energy Effic. 2020, 13, 1561–1604. [Google Scholar] [CrossRef]
  38. Peper, S.; Failla, M.-C.; Streicher, W.; Ilmer, A. Comparison of Measured and Calculated Energy Demand and Assessment of the Results Innsbruck. 2021. Available online: https://passiv.de/downloads/05_sinfonia_monioring_innsbruck_final_report.pdf (accessed on 1 October 2024).
  39. Ridley, I.; Clarke, A.; Bere, J.; Altamirano, H.; Lewis, S.; Durdev, M.; Farr, A. The Monitored Performance of the First New London Dwelling Certified to the Passive House Standard. Energy Build. 2013, 63, 67–78. [Google Scholar] [CrossRef]
  40. Suárez-Ramón, I.M.; Ruiz, C.; Duque, I.; Zamora, A.; Fernández, F.J.; Díaz, J. Experimental Assessment of the Thermal Performance and Energy Consumption of a Single-Family Passive House. In Proceedings of the 18th International Conference on Renewable Energies and Power Quality (ICREPQ’20), Granada Spain, 1–2 April 2020; pp. 615–620. [Google Scholar]
  41. Rehab, I.; Andre, P.; Aparecidia Silva, C.; Massy, G.; Hannay, J.; Lebrun, J. Verification of the Energy Balance of a Passive House by Combining Measurements and Dynamic Simulation. Energy Procedia 2015, 78, 2310–2315. [Google Scholar] [CrossRef]
  42. Johnston, D.; Siddall, M.; Ottinger, O.; Peper, S.; Feist, W. Are the Energy Savings of the Passive House Standard Reliable? A Review of the as-Built Thermal and Space Heating Performance of Passive House Dwellings from 1990 to 2018. Energy Effic. 2020, 13, 1605–1631. [Google Scholar] [CrossRef]
  43. Wang, R.; Lu, S.; Feng, W. A Three-Stage Optimization Methodology for Envelope Design of Passive House Considering Energy Demand, Thermal Comfort and Cost. Energy 2020, 192, 116723. [Google Scholar] [CrossRef]
  44. Kaklauskas, A.; Rute, J.; Zavadskas, E.K.; Daniunas, A.; Pruskus, V.; Bivainis, J.; Gudauskas, R.; Plakys, V. Passive House Model for Quantitative and Qualitative Analyses and Its Intelligent System. Energy Build. 2012, 50, 7–18. [Google Scholar] [CrossRef]
  45. Lubyk, A. Evaluating the Use of Straw Bales in Achieving Passive House Certification (PHIUS+ 2015) in Western Canada. Master’s Thesis, Toronto Metropolitan University, Toronto, ON, Canada, 2021. [Google Scholar] [CrossRef]
  46. Piccardo, C.; Dodoo, A.; Gustavsson, L. Retrofitting a Building to Passive House Level: A Life Cycle Carbon Balance. Energy Build. 2020, 223, 110135. [Google Scholar] [CrossRef]
  47. Ekström, T.; Blomsterberg, Å. Renovation of Swedish Single-Family Houses to Passive House Standard—Analyses of Energy Savings Potential. Energy Procedia 2016, 96, 134–145. [Google Scholar] [CrossRef]
  48. Burhenne, S.; Jacob, D.; Henze, G.P. Uncertainty Analysis in Building Simulation With Monte Carlo Techniques. In Proceedings of the Fourth National Conference of IBPSA-USA, New York, NY, USA, 11–13 August 2010; pp. 419–426. [Google Scholar]
  49. Thomsen, K.E.; Schultz, J.M.; Poel, B. Measured Performance of 12 Demonstration Projects—IEA Task 13 “Advanced Solar Low Energy Buildings. ” Energy Build. 2005, 37, 111–119. [Google Scholar] [CrossRef]
  50. Blight, T.S.; Coley, D.A. Sensitivity Analysis of the Effect of Occupant Behaviour on the Energy Consumption of Passive House Dwellings. Energy Build. 2013, 66, 183–192. [Google Scholar] [CrossRef]
  51. De Meester, T.; Marique, A.F.; De Herde, A.; Reiter, S. Impacts of Occupant Behaviours on Residential Heating Consumption for Detached Houses in a Temperate Climate in the Northern Part of Europe. Energy Build. 2013, 57, 313–323. [Google Scholar] [CrossRef]
  52. Venckus, N.; Bliudžius, R.; Endriukaityte, A.; Parasonis, J. Research of Low Energy House Design and Construction Opportunities in Lithuania. Balt. J. Sustain. 2010, 16, 541–554. [Google Scholar] [CrossRef]
  53. Monstvilas, E.; Banionis, K.; Stankevičius, V.; Karbauskaite, J.; Bliudžius, R. Heat Gains in Buildings—Limit Conditions for Calculating Energy Consumption. J. Civ. Eng. Manag. 2010, 16, 439–450. [Google Scholar] [CrossRef]
  54. Venckus, N.; Bliudžius, R.; Poderyte, J.; Burlingis, A. The Heating Load Determination of Low Energy Buildings in Northern Climate. J. Civ. Eng. Manag. 2012, 18, 828–833. [Google Scholar] [CrossRef]
  55. Swegon Swegon Esbo Light. Available online: https://blog.swegon.com/en/how-do-we-choose-the-right-systems-early-in-the-buildingprocess (accessed on 2 September 2024).
  56. Panasonic Marketing Europe GmbH Panasonic. Aquarea Designer Online Tool. Available online: https://www.aircon.panasonic.eu/GB_en/news/new/panasonic-introduces-new-aquarea-designer-online-tool-for-heating-and-cooling-professionals/ (accessed on 4 September 2024).
  57. Construction Sector Development Agency Energy. Performance Certificates for Buildings. Available online: https://www.ssva.lt/registrai/pensreg/pensert_list.php?goto=2 (accessed on 4 September 2024).
  58. Tronchin, L.; Manfren, M.; James, P.A. Linking Design and Operation Performance Analysis through Model Calibration: Parametric Assessment on a Passive House Building. Energy 2018, 165, 26–40. [Google Scholar] [CrossRef]
Figure 1. Present and future Köppen–Geiger climate classification maps at 1 km resolution: (a) projections for years 1980–2016; (b) projections for years 2071–2100 [4].
Sustainability 16 10798 g001
Figure 2. Comparison of the area of new residential buildings completed in Lithuania, 2014–2024 [14].
Sustainability 16 10798 g002
Figure 3. The energy performance classes of the building technical regulation in Lithuania [11] and LT-PH3.
Sustainability 16 10798 g003
Figure 4. The first single-family house in Vilnius, Lithuania, LT-PH3, certified by the German Passive House Institute in 2015 (ID 4676): (a) south façade; (b) north façade. Architect: R. Adomaitis.
Sustainability 16 10798 g004
Figure 5. Methodological scheme of the LT-PH3 study.
Sustainability 16 10798 g005
Figure 6. LT-PH3 plans of installed indoor and outdoor measuring instruments: (a) ground floor, outdoor air temperature sensor; (b) 2nd floor, wireless programmable radio thermostat for indoor air temperature.
Sustainability 16 10798 g006
Figure 7. Extracts from the thermal bridges’ calculation report: (a) PHPP 8.5 sheet—verification; (b) extract from the thermal bridges’ calculation report; (c) PHPP 8.5 sheet—heating.
Sustainability 16 10798 g007aSustainability 16 10798 g007bSustainability 16 10798 g007c
Figure 8. Geometric model of the building by Swegon ESBO Light 2.4.0.3: (a) southeast view; (b) northeast view.
Sustainability 16 10798 g008
Figure 9. Annual design heat consumption of LT-PH3 for heating the building: (a) before validation; (b) after validation.
Sustainability 16 10798 g009
Figure 10. Comparison of measured outdoor and indoor temperatures and annual average temperature.
Sustainability 16 10798 g010
Figure 11. Comparison of data measured with LT-PH3 electricity meters.
Sustainability 16 10798 g011
Figure 12. Comparison of LT-PH3 total electricity consumption with electricity consumption for heating and hot water.
Sustainability 16 10798 g012
Figure 13. LT-PH3 five-year monthly comparison of electricity consumption for heating and hot water.
Sustainability 16 10798 g013
Figure 14. Comparison of LT-PH3 modelled building heating demand with monitoring results.
Sustainability 16 10798 g014
Figure 15. Heat consumption for heating LT-PH3 measured by a heat meter from 1 June 2023 to 31 May 2024.
Sustainability 16 10798 g015
Figure 16. LT-PH3 five-year monthly comparison of electricity consumption for heating and hot water.
Sustainability 16 10798 g016
Table 1. Basic comparative data on the LT-PH3 building.
No.CategoryLT-PH3
1Energy standard/building typePassive House new build
2Construction typeMasonry construction
3Annual heating demand15.43 kWh/(m2 a)
4Heating load14 W/m2
5PE demand (non-renewable primary energy)117 kWh/(m2 a)
6Frequency of overheating2%
7Climate zoneDfb
8Building envelope area Atotal/treated floor area ATFA559 m2/169.20 m2
9Heated area/volume169.24 m2/863.70 m3
10The compactness of the building—A/V ratio 0.65
11Window area/percentage/transmission losses47 m2/8.4%/3828 kWh/a
12Specific solar aperture2.5%
13Passive solar heating mode5546 kWh/a
14Airtightness0.21 h−1
15U-value average of the thermal envelope 0.146 W/(m2 K)
16U-value roof/wall/floor/windows/ext. door0.063/0.087/0.098/0.781/0.71 W/(m2 K)
17Window area/window area percentage47 m2/8.4%
18Compliance of the monitored building with the design100%
19Year of construction/price2014–2015/750 (EUR/m)2
Table 2. Unified U-values for Swegon ESBO Light 2.4.0.3 and PHPP 8.5 building elements.
Building ElementSwegon
Entered/Visible in the Report
PHPP
Walls0.087/0.087 W/(m2 K)0.087 W/(m2 K)
Roof0.063/0.063 W/(m2 K)0.063 W/(m2 K)
Flooring0.098/0.098 W/(m2 K)0.098 W/(m2 K)
Windows0.078/0.078 W/(m2 K)0.078 W/(m2 K)
Table 3. Validation of Swegon ESBO Light 2.4.0.3 and PHPP 8.5 annual heat consumption for heating LT-PH3.
YearAverage
Temperature
SwegonPHPPDiscrepancyDiscrepancy %
°CkWh/(m2 a)kWh/(m2 a)kWh/(m2 a)
201621.00 266129052448.40
201721.48 284430542106.88
201821.70 293231251936.18
201921.92 302431981745.44
202021.79 296931541855.87
Table 4. Validation of Swegon ESBO Light 2.4.0.3 and PHPP 8.5 annual heat consumption for heating LT-PH3.
Swegon
Equipment Unit
Swegon PHPP Discrepancy
kWh/(m2 a)kWh/(m2 a)kWh/(m2 a)
1430243198174
210195731981241
3136263198−428
4332213198−23
53.132013198−3
63.12319831980
Table 5. Calculation of the measured electricity consumption for heating the building.
YearHeating and DHWDHWElectricity for Heating
kWh/akWh/akWh/a
20162852 921.601930.40
20172845 768.002077.00
20182930 754.002176.00
20192689 919.201769.80
20202247 865.701381.30
Table 6. Design of annual heat consumption for heating LT-PH3 calculated by PHPP 8.5.
YearRoom Temperature *Heating m2 AnnualTotal Heating Annual
°CkWh/(m2 a)kWh/a
201621.00 17.172905.16
201721.48 18.053054.06
201821.70 18.473125.13
201921.9218.903197.88
202021.79 18.643153.88
* Average annual indoor temperature for the heating season measured during monitoring.
Table 7. Design of annual heat consumption for heating LT-PH3 calculated by Swegon.
YearRoom Temperature *Heating m2 AnnualTotal Heating Annual
°CkWh/(m2 a)kWh/a
201621.00 16.702826.00
201721.48 17.813014.00
201821.70 18.353104.00
201921.9218.903198.00
202021.79 18.583143.00
* Average annual indoor temperature for the heating season measured during monitoring.
Table 8. Calculation of the SCOP 1 setting in Aquarea 2013.
Heat Withdrawal from Heat Source for Space Heating.Power Consumption:
SCOP1
- 
Heat Pump for Space Heating;
- 
Heating Elements for Space Heating;
- 
Auxiliary Components.
kWh/akWh
1720.00970.001.77
Table 9. Calculation of the SCOP 2 setting in PHPP 8.5.
YearTotal Heating AnnualElectricity for HeatingSCOP2
kWh/akWh/a
20162905.161930.401.51
20173054.062077.001.47
20183125.132176.001.44
20193197.881769.801.81
20203153.881381.302.28
Table 10. Annual operational heat consumption calculated with Aquarea 2013.
YearElectricity for HeatingSCOP1Heating m2 Annual
kWh/akWh/(m2 a)kWh/(m2 a)
20161930.401.7720.19
20172077.001.7721.73
20182176.001.7722.76
20191769.801.7718.51
20201381.301.7714.45
Table 11. Annual operational heat consumption calculated by PHPP 8.5.
YearElectricity for HeatingSCOP2Heating m2 Annual
kWh/akWh/(m2 a)kWh/(m2 a)
20161930.401.7019.40
20172077.001.7020.87
20182176.001.7021.86
20191769.801.7017.78
20201381.301.7013.88
Disclaimer/Publisher’s Note: The statements, opinions and data contained in all publications are solely those of the individual author(s) and contributor(s) and not of MDPI and/or the editor(s). MDPI and/or the editor(s) disclaim responsibility for any injury to people or property resulting from any ideas, methods, instructions or products referred to in the content.