Article

Multivariate Analysis of the Sustainable Development of the Silver Economy in the European Union Countries

by
Beata Bieszk-Stolorz
1,*,
Krzysztof Dmytrów
1 and
Ewa Frąckiewicz
2
1
Institute of Economics and Finance, University of Szczecin, 71-101 Szczecin, Poland
2
Institute of Management, University of Szczecin, 71-004 Szczecin, Poland
*
Author to whom correspondence should be addressed.
Sustainability 2024, 16(23), 10703; https://doi.org/10.3390/su162310703
Submission received: 29 October 2024 / Revised: 28 November 2024 / Accepted: 4 December 2024 / Published: 6 December 2024
(This article belongs to the Special Issue Healthy Aging and Sustainable Development Goals)

Abstract

:
The ageing of societies is one of the biggest challenges of the modern world. The response to this new reality is the development of the silver economy. It is a multidimensional concept that is an extremely important factor in sustainable development. The aim of this article is to compare EU countries according to selected aspects of the development of the silver economy. This study covered the years 2009–2021. It was conducted on the basis of data from the Eurostat database. This study used multivariate statistical analysis methods: k-means, COmplex PRoportional ASsessment (COPRAS) in a dynamic approach, Dynamic Time Warping (DTW) and hierarchical clustering. EU countries differ in terms of the studied aspects of the silver economy in a north–south direction. In the period under study, there were significant changes in the country rankings and these changes were not the same for the EU countries. Also, most EU countries indicated improvements in terms of analyzed aspects of the silver economy. An innovative approach is the use of the COPRAS method in a dynamic approach, thanks to which it is possible to develop not only country rankings, but also to analyze the dynamics of changes.

1. Introduction

One of the biggest challenges of the modern world is the process of ageing societies. Projections of the United Nations suggest that the global population could increase to approximately 8.5 billion in 2030, and 9.7 billion in 2050. However, the percentage of people aged 65 and over is growing faster than that of those under that age. This means that the percentage of the world’s population aged 65 and over is expected to increase from 10% in 2022 to 16% in 2050 [1]. All European countries are facing the same phenomenon: ageing populations and changes in household and family structures [2]. There are estimates predicting that in the age structure of the population in the European Union in 2050 the share of people over 65 years of age will reach 28.5%, and the share of people aged 80 and over will reach 11.1% and will continue to grow [3]. Population ageing could become one of the most important societal transformations. It will affect almost all sectors, including the labor and financial markets, demand for goods and services such as housing, social protection and transport, as well as family structures and intergenerational bonds. If the world does not rise to this challenge in all areas, the ageing of societies will become a problem of the modern world.
Rapid population growth and high fertility are challenges to sustainable development. In countries where this is the case, achieving the Sustainable Development Goals (SDG) is likely to accelerate the transition towards lower fertility and slower population growth. However, the reverse process of declining population and low fertility observed in developed economies may cause problems in achieving the Sustainable Development Goals. These goals include parallel efforts to boost economic growth and make decisions on a range of issues including education, health, social protection and employment. Achieving the Sustainable Development Goals also involves addressing the economic and social challenges that come with an ageing population [4]. Ageing populations create new challenges for achieving sustainable development [5].
The basic problem related to the ageing process is to ensure economic growth while increasing public spending on meeting the specific needs of older people. The lack of interest in the relationship between demography and the economy may lead to a loss of competitiveness of a given country or region in favor of demographically younger areas. However, economists’ views on the impact of the ageing process on the economy are not clear.
On the one hand, the threats resulting from such a significant scale of population ageing are indicated, primarily for the social sphere, health and public finances. The unequivocally negative assessment of the effects of extending life in old age with a simultaneous decrease in the share of young people is associated with the concept of apocalyptic demography [6]. On the other hand, the significant improvement in the health of older people compared to their peers from years ago, the increased awareness of social rights, professional rights and education are emphasized [7]. The critique of the apocalyptic approach (also called the demographic tsunami) resulted in the creation of a completely different reference platform, leading to the creation of a new term: the silver economy (SE). It is indicated that the term originates from the Japanese market, which was the first among highly developed countries to experience the effects of the rapid pace of population ageing [8].
The silver economy represents that part of the economy that is related to demographic changes caused by the ageing population and includes all those economic activities, products and services that are intended to meet the needs of older people [9]. The silver economy is driven by the emergence of new consumer markets and by the need to improve the sustainability of public spending associated with an ageing population [10]. The silver economy can be considered from an economic perspective or from the point of view of conducting social policy [11]. In the literature, there are attempts to create a synthetic measure that would allow for the assessment of the degree of development of the silver economy [12,13]. This is a very difficult task due to the interdisciplinary nature of the issue. It seems that this concept depends on too many variables. The selection of such variables for the construction of a synthetic measure describing the phenomenon in its entirety would therefore be debatable. Additional problems are access to appropriate data and the need to use different registers at the central and local levels. In each country, data can be collected at a different level of detail. This specificity makes it impossible to construct a single measure and use it for international analyses. A good solution to this challenge is to focus on selected aspects of the silver economy and compare countries only in such a limited area.
The aim of our study is to make a multivariate comparison of European Union countries according to selected aspects of the development of the silver economy. This study was conducted for the years 2009–2021 and used data from the Eurostat database. Unfortunately, the lack of data did not allow for the extension of the research period. This study was conducted in three stages using multivariate statistical analysis methods.
The bibliometric review shows that the issue of population ageing is discussed quite often in the scientific literature [14,15,16]. This also applies to the silver economy. However, few articles compare countries in terms of various aspects of the silver economy in a statistical approach. This approach presented in our study is a contribution to the literature. The added value of this study is also the use of the COPRAS method in the dynamic approach in the analysis of time series. This approach allows both the construction of country rankings in individual years and the analysis of the dynamics of the created synthetic variable.
The rest of this article is organized as follows: Section 2 presents a description of the silver economy. Section 3 presents the research methods and data used. Section 4 presents the results of the empirical analysis. Section 5 presents a discussion of the results in the context of similar studies conducted in the past. Section 6 is a summary of the entire study.

2. Silver Economy

The official definition of the silver economy adopted by the European Union is as follows:
“The silver economy is considered part of the general economy that are relevant to the needs and demands of older adults. Consistent with the earlier Oxford Economics definition, EU defines silver economy as the sum of all economic activity that serve the needs of people aged 50 and over, including the products and services they purchase directly and the further economic activity this spending generates. Thus silver economy encompasses a unique cross-section of economic activities related to production, consumption and trade of goods and services relevant for older people, both public and private, and including direct and indirect effects”.
The silver economy is closely linked to a change in the proportion of population shares between different cohorts. In particular, this applies to the pre-working, working and post-working age groups. The decline in the proportion of people of working age and the increase in the post-working age creates a major challenge for individual countries, their labor markets, social policies, health systems, housing, transport, etc. [17]. On the one hand, the silver economy has clearly positive overtones. Its development shows that it has been possible to eliminate or reduce some of the risks that had a direct impact on the standard and quality of life of elderly people. Consequently, extending life expectancy and maintaining health can be an opportunity to remain economically and socially active for longer. On the other hand, societies have been confronted with significant problems in securing the diverse and growing needs of an increasingly large subpopulation of older people. The solution may lie in technological innovations (e.g., automation, robotization) or migration policies aimed at attracting desirable worker profiles from outside the country. Above all, however, it is desirable that the process of demographic ageing and its consequences (effects) are taken into account in the development strategy of a given country and group of countries (EU).
In a narrow sense, the main idea of the silver economy is to provide goods and services for the growing sector of older consumers. In a broad sense, the goal of the silver economy is to ensure the longest possible professional activity, independence, time management of seniors, care for one’s own health and image, ensure social integration, and offer age-sensitive financial services [18]. In this sense, it can stimulate economic growth and create new jobs [19]. It does not represent one sector of the economy or one type of consumer or product. The silver economy aims at directing supply in line with the changing needs of different groups of older people, so that they become a source of economic activation [20].
From a supply perspective, the silver economy creates a great opportunity for the development of new and existing businesses. This development could be based on innovative activities using new or improved products, services, markets or processes [21,22,23,24,25]. However, research by McGuirk et al. [26] indicates poor awareness of businesses regarding the possibility of benefiting from the silver economy. Seniors represent a very important purchasing power in the economy. In 2017, the average annual income of a senior citizen worldwide was USD 14.5 thousand and was almost 20% higher than the average income overall (USD 12.3 [27]. Seniors are therefore an important consumer group. At the same time, there is a lack of awareness, training or other forms of public support for businesses at the regional level in the European Union.
The development of the silver economy varies regionally even within a single EU member state. It depends not only on the overall policy of the state, but also on the implementation of this policy at local government level. In their article, Przywojska et al. [28] developed an original indicator showing the willingness of the self-government of a voivodeship to support SE development. The authors put forward two interesting research hypotheses: H1—the higher the growth rate of the voivodeship population potential in terms of SE, the higher the indicator of the regional government policy willingness to support the SE; H2—in voivodeships which reported a higher (IPWSSE) indicator, municipalities’ interest in supporting the SE will also be higher. Both hypotheses were verified negatively.
Griva et al. [29] analyzed the role of companies in the development of the silver economy. Based on their research, companies that want to benefit from older people should think about the following. Companies need to offer products and services that are accessible, useful and convenient for older people. New developments and innovations should be used to offer alternative and innovative services and experiences tailored to older people. In particular, companies in the health care sector can benefit from the growing demand for their products and services.
Elderly people can be a valuable workforce resource. Chen [30] proved that the positive impact of elderly re-employment on the economy and society in China, as well as the willingness and satisfaction associated with it. It is particularly important to develop entrepreneurship among older people willing to run their own businesses. To this end, their needs and skills should be analyzed [31]. On the other hand, enterprises should be supported in their management of the increasing average workforce age [32].
The literature suggests that the main solution to the problem of ageing societies is the development of new technologies. They play a key role in realizing the economic promises of the silver economy [33]. ICT offers a wide range of solutions to meet the needs of the silver generation, such as health care, independent living, accommodation, e-governance, and assistive technologies [34]. Of course, full use of the services available through ICT will be made possible through the education of older people. Such education should lead to mentally and physically active seniors. Research conducted by Qi et al. [35] indicated that 66.6% of elderly people think that the participation of seniors in education may strengthen their bodies and minds.
The SDGs are directly related to older people and their quality of life [36]. When analyzing the silver economy in the context of sustainable development, we should mention the Vera-Sanso study [37]. The author emphasizes that social policy is often dominated by ageist assumptions about what older people should do, rather than recognizing older people’s right to and involvement in development. Elderly people are largely invisible in the development discourse and institutionally marginalized in national statistics. This negative ageist approach causes policy makers to overlook the role of older people in development, poverty reduction and education. The author makes the claim that Sustainable Development Goals include older people in a stereotypical and potentially harmful way. For example, the SDG Goal 8 on employment and decent work mentions ‘young people and persons with disabilities’, ‘child labor’ and ‘migrant workers’ but not older workers.
The development of the silver economy will only be possible if the entire socio-economic system is properly adapted to it, and governments act consistently for its benefit. The potential of the silver economy is enormous, especially in combination with a sustainable ecosystem of innovation [38]. The idea of the European silver economy began to grow rapidly and attract attention as a separate policy area in 2014 [39]. The idea came about after a report by Bank of America Merrill Lynch (BofAML) titled “The Silver Dollar” [40]. The European silver economy is based on the assumption that older people have specific needs that distinguish them, as a special type of consumers, from younger social groups. The silver economy can be defined as the economic opportunities resulting from public and consumer spendings related to the ageing population and the special needs of the population over 50 years of age [10]. An example of European public and private initiative is The European Innovation Partnership on Active and Healthy Ageing (EIP on AHA). The EIP on AHA aims to promote healthy and active ageing. The main goals of this initiative are [41]:
  • Improving the health and quality of life of Europeans with a focus on older people;
  • Supporting the long-term sustainability and efficiency of health and social care systems;
  • Enhancing the competitiveness of EU industry through business and expansion in new markets.
These objectives cover various spheres of socio-economic life. In order to become a member of the European Union, countries have to reach certain thresholds (indicators) for full membership. However, despite this, there are still differences between individual EU member states. These differences concern both the social and economic spheres. Due to the socio-economic characteristics analyzed, some studies point to differences between eastern and western Europe, northern and southern Europe. However, differences are also found in the group of old EU countries, as well as in the group of the post-communist ones [42,43,44,45]. There is a research gap regarding differences in the development of the silver economy in EU countries. The analysis conducted in our article is an attempt to answer the following research questions:
Q1. Do EU countries show differences in terms of the examined aspects of the silver economy in the north–south and “old” EU and “new” EU directions?
Q2. Have there been any significant changes in the rankings of countries in terms of the aspects of the silver economy studied? Has the consistency of the rankings changed over time?
Q3. Do all EU countries show improvement in selected aspects of the silver economy?

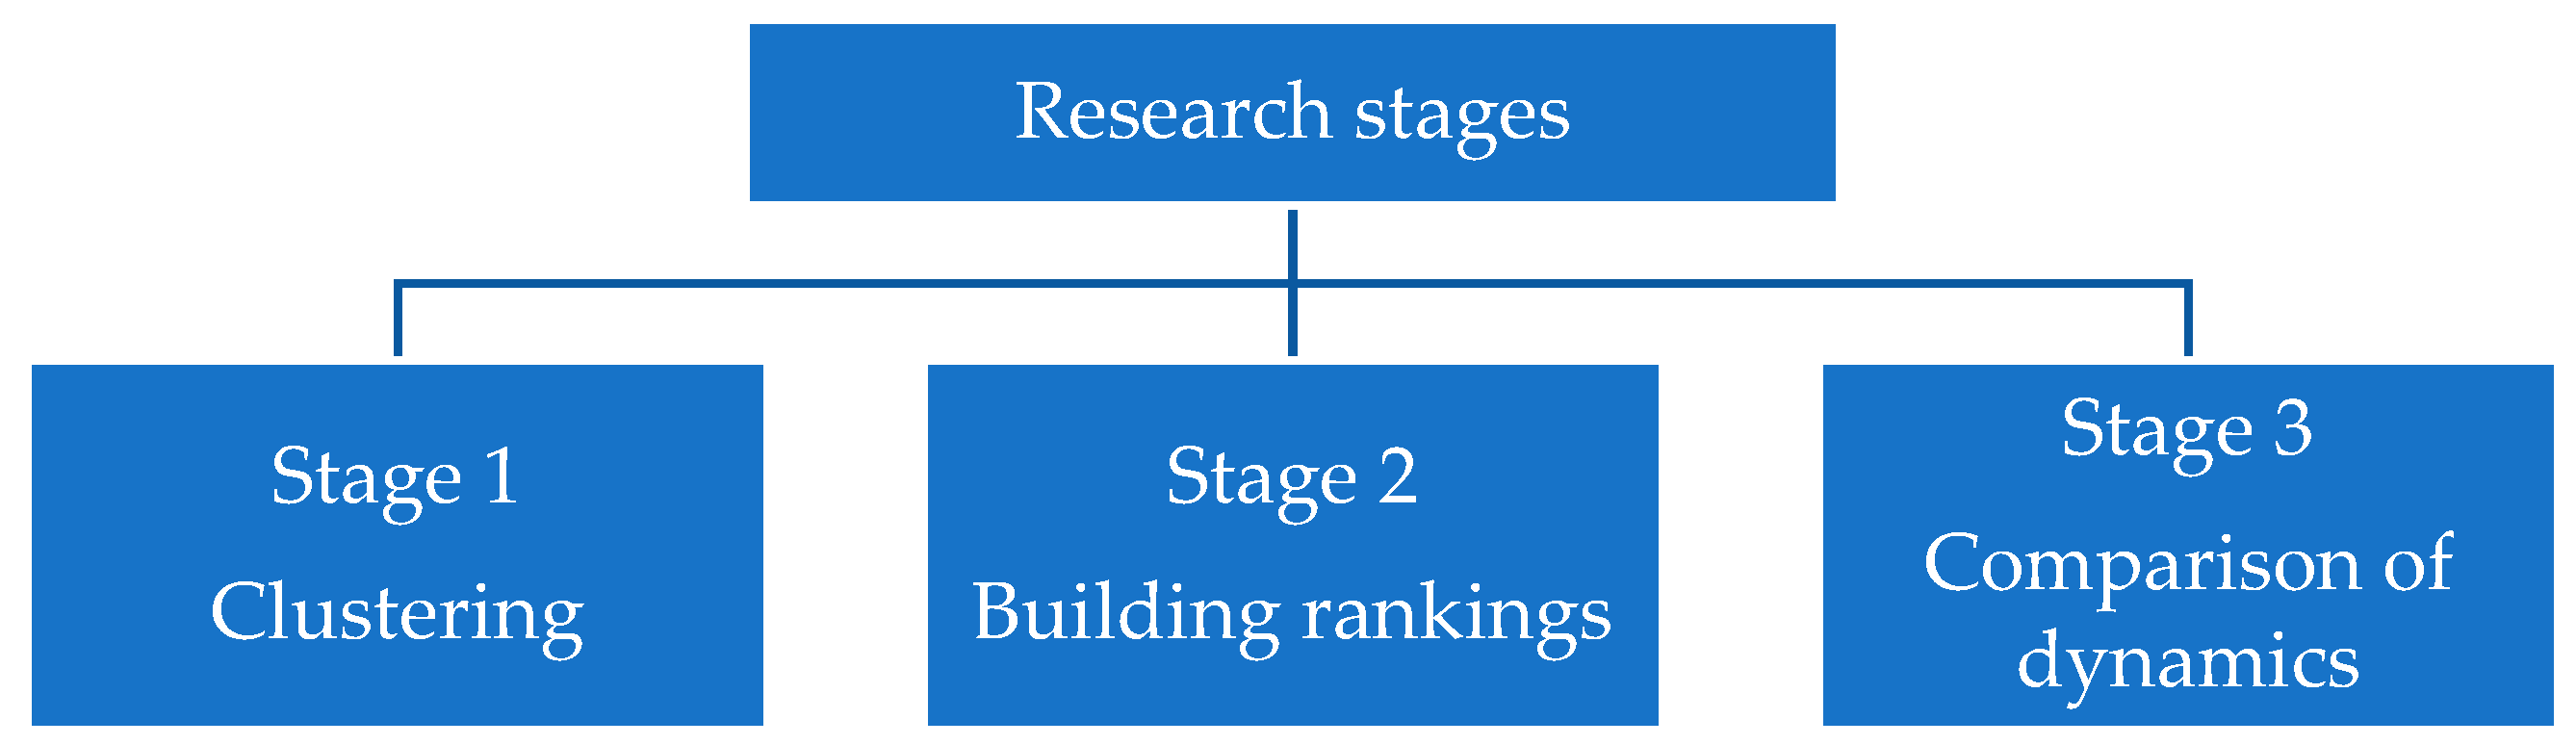
3. Research Methodology and Data

This study was conducted in three stages (Figure 1). They were distinguished due to the research questions. In each stage, different methods were used in the analysis. They are to help answer the questions posed.
In stage I, the EU countries were clustered using the k-means method in selected years: 2009, 2015, 2019, 2021. The k-means method, a cluster analysis technique, was proposed by MacQueen [46]. It belongs to the group of methods that optimize the initial division of objects and is often used in the analysis of socio-economic phenomena [47,48,49,50,51].
In stage II, EU country rankings were constructed using a synthetic variable constructed using the COPRAS method (COmplex PRoportional ASsessment) [52]. The COPRAS method was created for the needs of the decision theory and belongs to the group of Multiple-Criteria Decision-Making (MCDM) methods. This study proposes a dynamic version of this method. The rankings covered the years 2009–2021. Then, the obtained rankings were compared.
In stage III, the dynamics of the constructed synthetic variable was compared in the period 2009–2021 using the DTW method (Dynamic Time Warping). The DTW is an algorithm for measuring similarity between two temporal sequences that utilizes dynamic programming to find an optimal alignment between them with respect to a given scoring function. It was invented by Bellman and Kalaba [53]. It is used to evaluate the similarity of time series [54,55,56,57,58,59,60,61,62,63,64]. In our paper, the values of the DTW distance between the time series analyzed are computed using the DTW package (version 1.22-3) for R [65]. The calculated distances have a simple application in hierarchical clustering and classification [66]. They are widely used in general and spatial economics research [67,68,69,70,71,72,73,74].

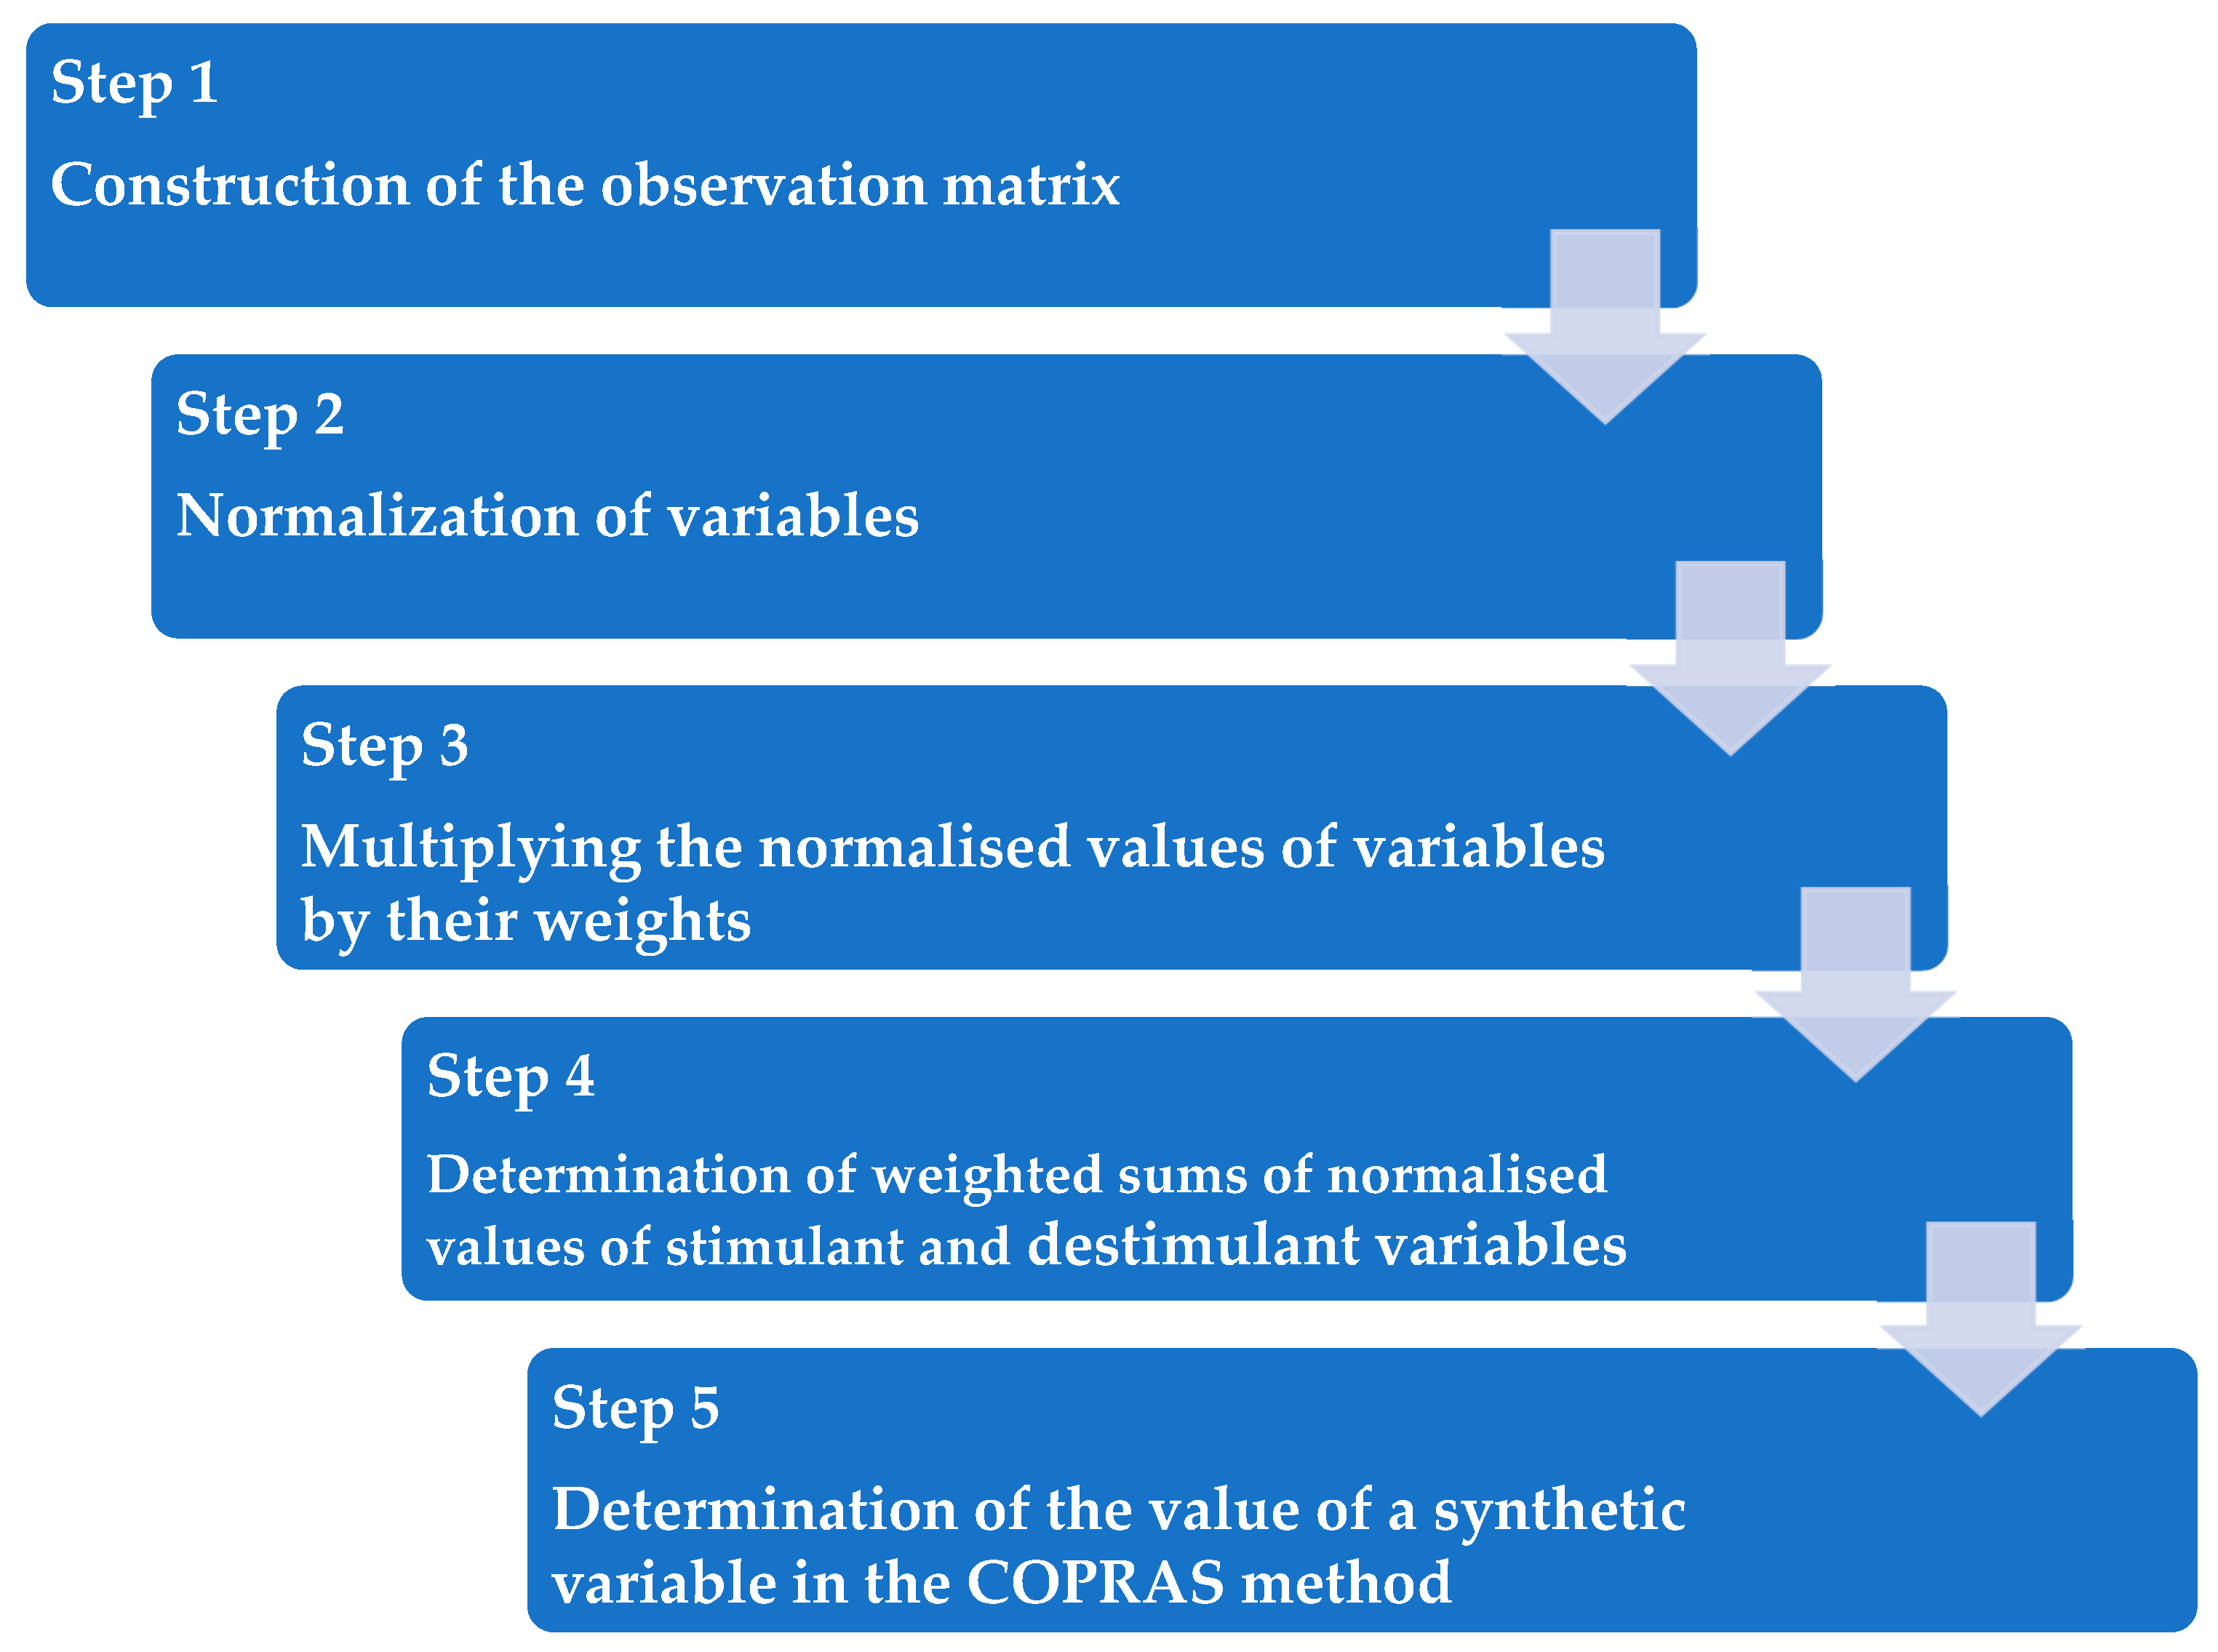
3.1. The COPRAS Method in a Dynamic Approach

The COPRAS method in the dynamic approach was used to build rankings of EU countries in terms of selected aspects of the silver economy and enabled the analysis of the dynamics of the created synthetic variable. This stage of the analysis was carried out in five steps, the scheme of which is presented in Figure 2.
  • Step 1
The first step consisted in constructing an observation matrix for each year under study. It has the following form:
X ( t ) = x i j t = x 11 t x 12 t x 1 m t x 21 t x 22 t x 2 m t x n 1 t x n 2 t x n m t
where
xijt—value of j-th variable in i-th object for t-th year (i = 1, …, n, j = 1, …, m, t = 1, …, T),
m—number of variables,
n—number of objects, and
T—number of years.
  • Step 2
In the second step, the variables were normalized using the formula:
z i j t = x i j t i = 1 n t = 1 T x i j t 2
where z i j t is a normalized value of j-th variable in i-th object for t-th year (i = 1, …, n, j = 1, …, m, t = 1, …, T).
  • Step 3
The third step is to multiply the normalized values of the variables by their weights:
t i j t = w j z i j t
where w j are weights of variables that meet the conditions: w j = 1 m , j = 1 m w j = 1 .
  • Step 4
In the fourth step, weighted sums of normalized values of stimulant ( S i t + ) and destimulant ( S i t ) variables were determined:
S i t + = j J + t i j t , i = 1 , , n , t = 1 , , T
S i t = j J t i j t , i = 1 , , n , t = 1 , , T
where
J + , j = 1 , , m —stimulant variables and
J , j = 1 , , m —destimulant variables.
Stimulants are the variables for which the highest possible values are desired, and destimulants are the variables with the lowest possible values desired.
  • Step 5
Step five consists of determining the value of the synthetic variable in the COPRAS method:
q i t = S i t + + i = 1 n t = 1 T S i t S i t i = 1 n t = 1 T 1 S i t , i = 1 , , n , t = 1 , , T
The synthetic variable created in this way has the following properties:
  • q i t [ 0,1 ] ;
  • max i q i t —the best object in period t, for t = 1, …, T;
  • min i q i t —the worst object in period t, for t = 1, …, T.
The higher the value of the composite measure, the better the situation of analyzed object. It is worth noting that the composite measure does not have direct interpretation. It represents the situation of an object with respect to a certain criterion, which cannot be measured directly.

3.2. Analysis of the Dynamics of the Synthetic Variable—The DTW Method

The composite COPRAS measures obtained on the basis of the dynamic normalization are the basis of the final step of the analysis—comparison of dynamics of selected aspects of the silver economy in the EU countries. We conduct this comparison by means of the Dynamic Time Warping (DTW) method. It was first proposed by Bellman and Kalaba [53]. At its beginnings, it was applied to the speech recognition [54]. Later the technique was applied in many fields of technical sciences [75]. The DTW algorithm was also applied in comparisons of time series of energy commodities [63] or in the field of the sustainable energy [64].
Let us assume that we have the two time series, denoted by X = ( x 1 , . . . , x N ) and Y = ( y 1 , . . . , y M ) . We find the match between them by minimizing the total cost function c p X , Y , obtained by means of the formula:
c p X , Y = l = 1 L c ( x n l , y m l ) = l = 1 L x n l y m l
where p = ( p 1 , , p L ) is the time warping path with p l = n l , m l 1 , , N × 1 , , M . It satisfies the three conditions:
  • Boundary, meaning that the first (last) element of the first sequence must be matched with the first (last) element of the second one;
  • Monotonicity, meaning that warping path can move only right or up or right-up of its current position;
  • Step size, meaning that every index from the sequence X must be matched with at least one index from the sequence Y.
We find the optimal match between the two analyzed time series with the use of the following formula:
D T W X , Y = c p * X , Y = m i n { c p X , Y | p P }
where P is the set of all possible warping paths.
The optimal path is found by the application of the dynamic programming. The D T W ( X , Y ) is the minimal distance between the two compared time series, which will be further called the DTW distance.
We use the DTW pairwise comparisons between all compared time series as the dissimilarity matrix in the hierarchical clustering. By its means we distinguish the homogeneous clusters of EU countries with respect to the dynamics of the selected aspects of silver economy in the EU countries. We use the Ward’s method to build the tree [76].

3.3. Data Used in This Study

The silver economy is a multidimensional issue and covers several areas related to the socio-economic life of society. The multitude of issues and the need to use different data sources means that creating a single synthetic measure for the entire silver economy is currently impossible. In each country, key data are collected in different institutions and are sometimes defined differently. This study used annual data from the Eurostat database covering the years 2009–2021. The data referred to 27 European Union countries, as of the last year of the analysis. Therefore, this study included Croatia, which had joined the EU in 2013 and excluded the United Kingdom, which had left the EU in 2020. In selecting the variables, we were guided by the main issues affecting the development of the silver economy. These are the ageing population, economic activity and employment of older people, poverty levels among seniors, benefits for older people. These are factors influencing the demand and supply side of the silver economy. Initially, the set of variables included eight of them expressed in %. For some of them, the highest possible value is desirable (stimulants). For others, the lowest possible value is desirable (destimulants). These are:
  • x1—share of population aged 65+ in total population—destimulant;
  • x2—old-age dependency ratio—destimulant;
  • x3—activity ratio of persons aged 65+—stimulant;
  • x4—employment ratio of persons aged 55–64—stimulant;
  • x5—share of old age pensions in GDP—destimulant;
  • x6—share of inactive persons aged 55–74 willing to work, but not seeking employment—destimulant;
  • x7—at-risk-of-poverty rate for pensioners aged 65+—destimulant;
  • x8—share of social protection benefits for elderly persons in GDP—destimulant.
The correlation between these variables was examined. Finally, two variables were removed from this study: x1 because of its strong correlation with variable x2, x8 because of its strong correlation with variable x7. For remaining variables in every analyzed year the basic descriptive statistics were calculated. They are presented in Table A1 in Appendix A. In the further part of this study, equal weights were assumed for all variables.

4. Results of Empirical Analysis

The empirical analysis using multivariate statistical analysis methods was conducted in three stages. Each stage of this study is an attempt to answer the research questions.

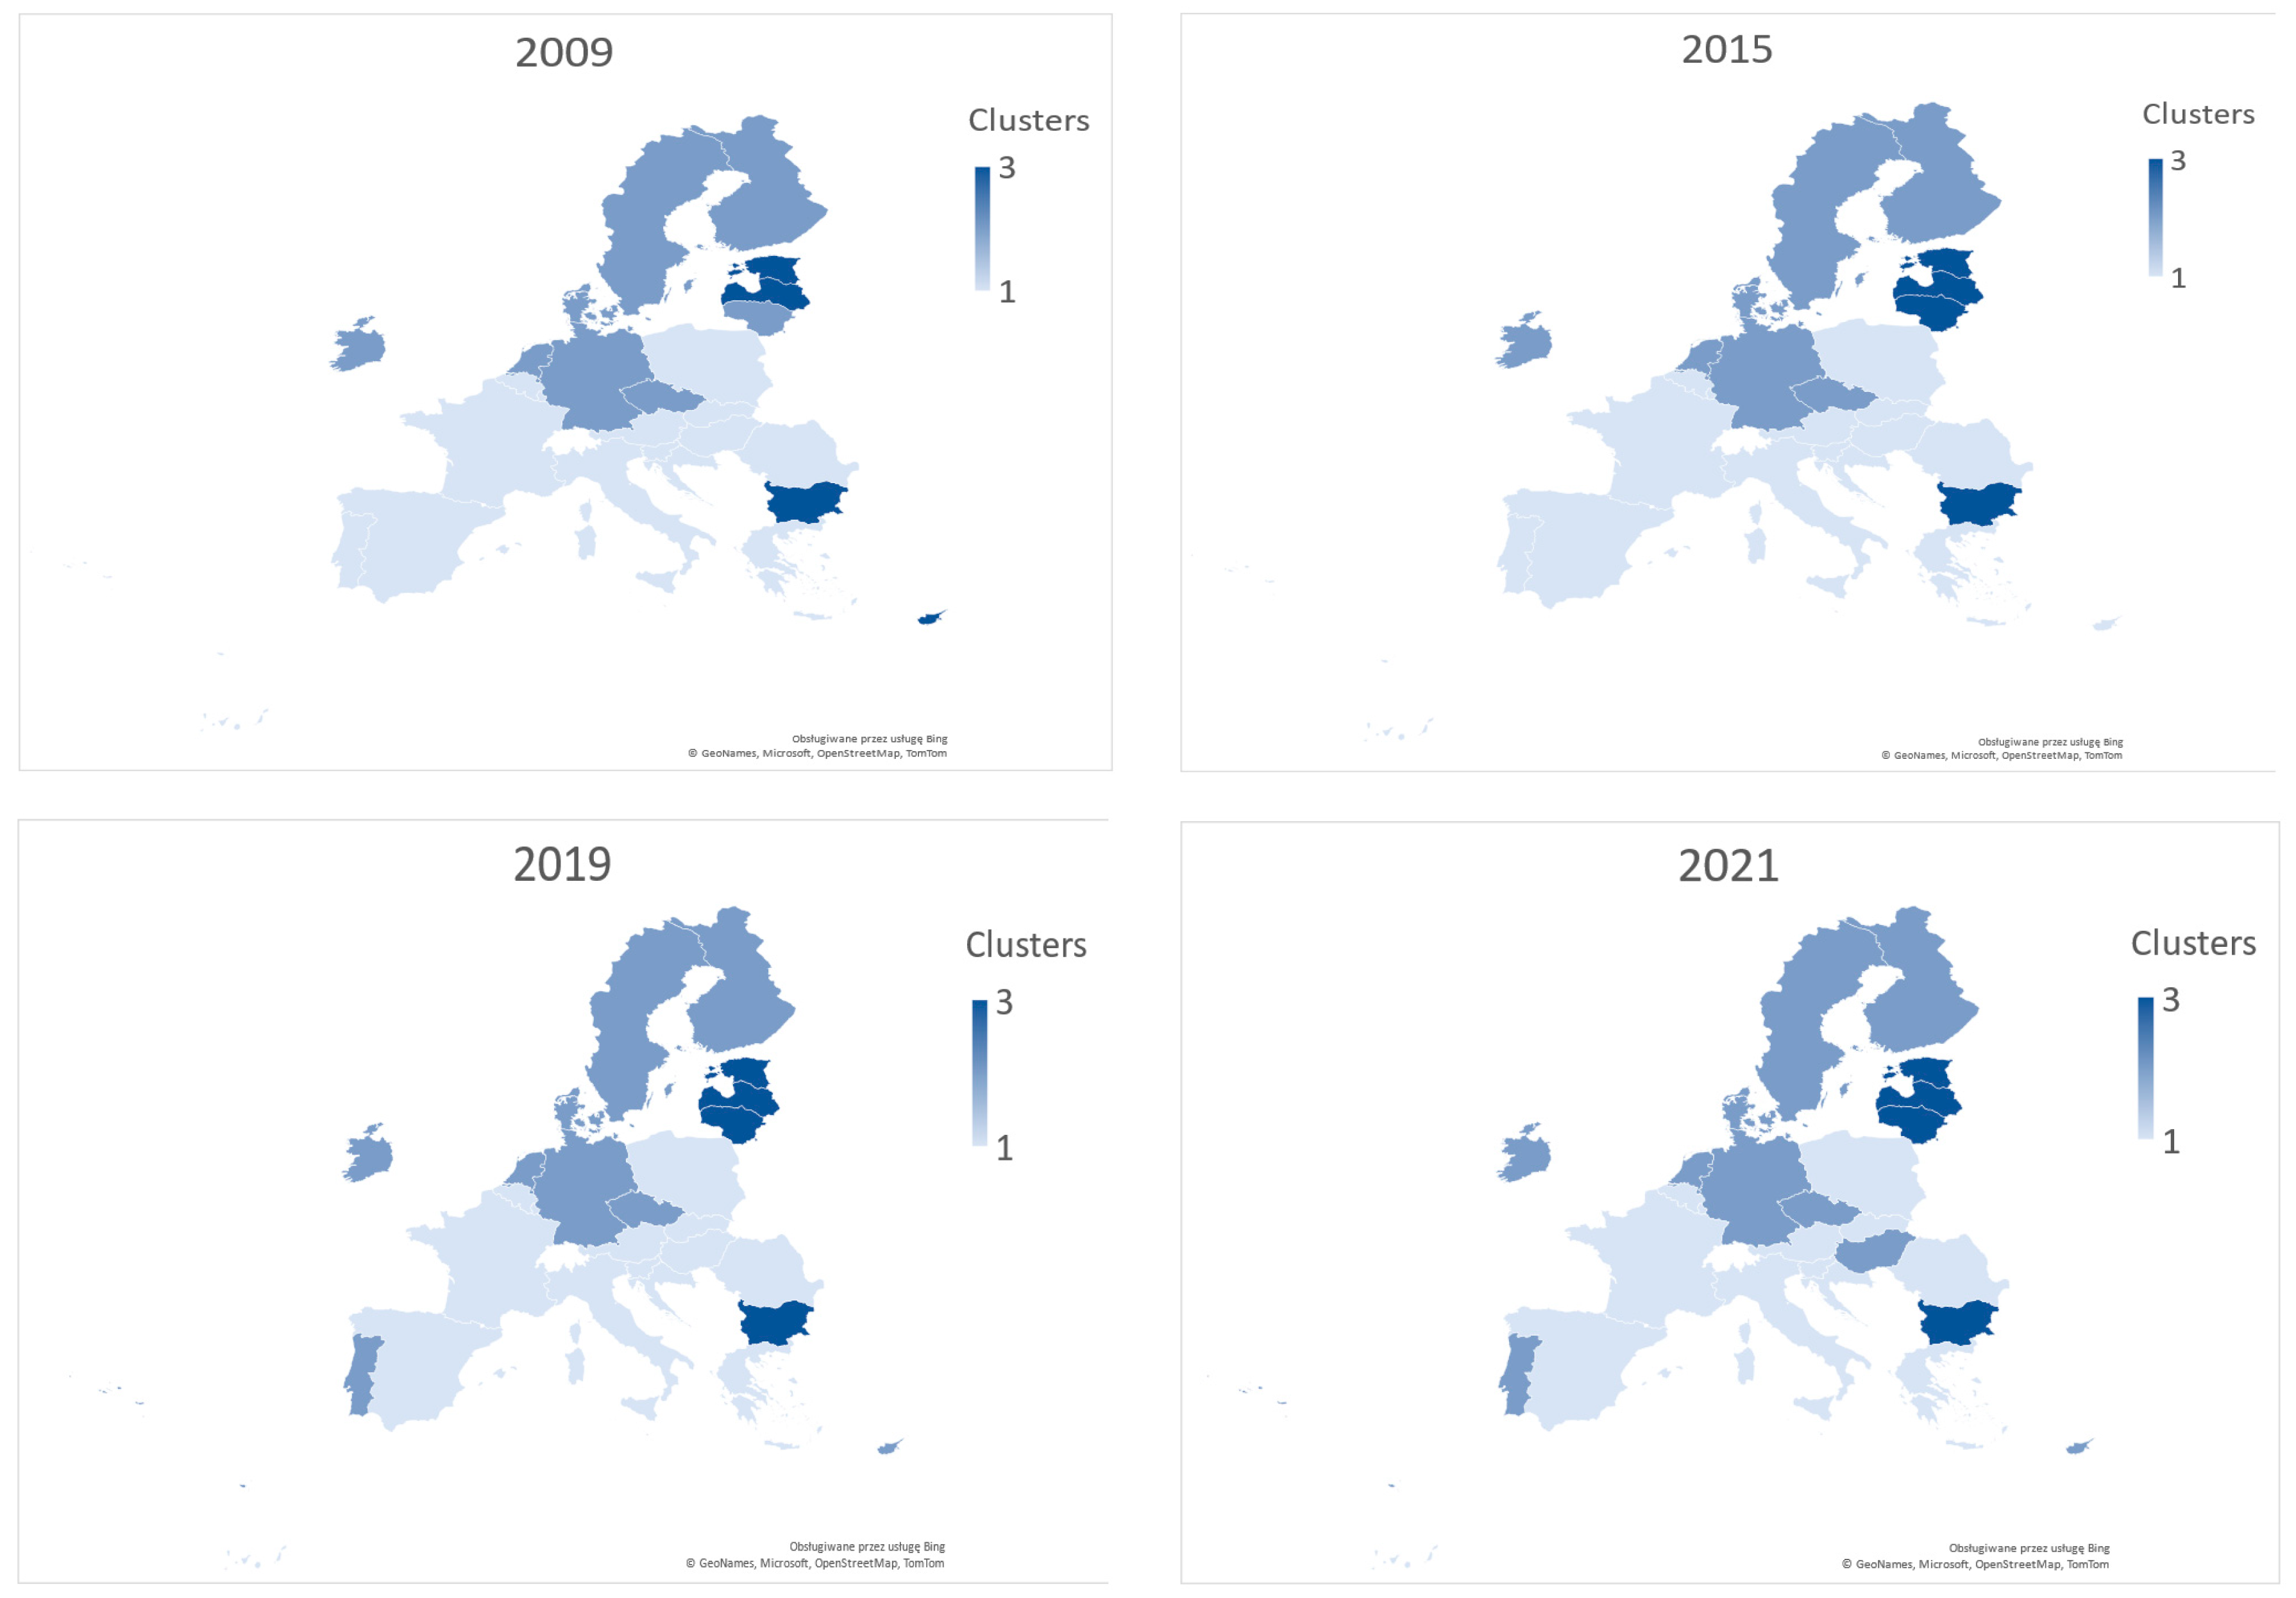
4.1. Results of Cluster Analysis in 2009, 2015, 2019, 2021

In the first stage of the research, cluster analysis was conducted. It was used to answer the first research questions Q1. The applied k-means method allowed for finding and distinguishing clusters of homogeneous objects. In this case, these are EU countries with similar values of the analyzed variables describing selected aspects of the silver economy. Figure 3 presents the results of this study for the years: 2009 (the beginning of the analysis period), 2015 (the middle of the period under review), 2019 (the year before the COVID-19 pandemic), 2021 (the end of the analysis period). Table 1 presents the average values of the analyzed features in the obtained clusters. The most desirable values are marked in bold. For stimulants (x3, x4), this is the highest value of the average, and for destimulants (x2, x5, x6, x7)—the lowest value of the average.
As a result of cluster analysis, three homogeneous clusters of countries with similar values of the analyzed variables were distinguished. The stable core of the three clusters consisted of the following countries:
  • Czechia, Denmark, Finland, Germany, Ireland, The Netherlands, and Sweden.
  • Austria, Belgium, Croatia, France, Greece, Italy, Luxembourg, Malta, Poland, Slovakia, Slovenia, Spain, and Romania.
  • Bulgaria, Estonia, and Latvia.
The remaining countries joined various clusters of countries (Cyprus, Hungary, Lithuania, and Portugal).
This division does not allow for an unambiguous assessment of countries in terms of selected aspects of the development of the silver economy. Analyzing the values in Table 1, it can be seen that the best average values were found in different clusters of countries. Therefore, we decided to conduct the second stage of this study and prepare country rankings.

4.2. Rankings of the EU Countries (2009–2021)

The aim of the second stage of this study was to prepare rankings of EU countries according to the value of the obtained synthetic variable. The COPRAS method was used for this purpose. The rankings for the years 2009–2021 are presented in Table 2. The rankings prepared are an attempt to answer the second research question Q2. The higher the value of the synthetic variable, the better the position of the country in the ranking. Countries with a high value of the synthetic variable, occupying positions 1, 2, 3 in the ranking are highlighted in bold. Countries with a low value of this variable, occupying positions 25, 26, 27 are marked in Table 2 with underlining.
Analyzing the rankings in Table 2, the following conclusions can be drawn:
  • The following countries were in the best situation in terms of selected variables compared to other EU countries in the period 2009–2021: Estonia (2011–2021), Cyprus (2009–2011), Portugal (2009–2014), Ireland (2015–2021), Romania (2009), and Sweden (2010, 2012–2021).
  • The worst situation in terms of selected variables compared to other EU countries in the period 2009–2021 was observed in the following countries: Belgium (2009–2012, 2021), Greece (2012–2018), Spain (2013–2015), France (2009–2010), Croatia (2016–2021), Luxembourg (2016–2020), Hungary (2009–2015), Romania (2021), Slovenia (2019–2020), and Slovakia (2011).
The rankings obtained deviate from certain intuitive expectations that highly developed European countries should have a high value of the synthetic variable. However, this is not the case. It seemed that the problem would be explained by including in this study the variable, the at-risk-of-poverty rate of pensioners aged 65+. However, in many cases this variable had unfavorable values, e.g., for Austria or Germany, compared to the countries of the former “Eastern Bloc”. It seems that the rankings should be made again based on an extended set of variables and by assigning expert weights to these variables. However, there is a problem of missing data. Such an approach would reduce the number of countries for which the analysis can be carried out. A more detailed analysis of the values of the data used indicates that the low positions in the rankings of highly developed European countries may be influenced by:
  • High percentage of elderly people,
  • High burden on GDP with pensions, and
  • Lower professional activity due to potentially higher pensions.
The consistency of the rankings was examined using Spearman’s rank correlation coefficient. The results are presented in Table 3. The values of the correlation coefficient are high and decrease over time. The greater the difference in time, the less compatible the rankings are, thus the lower the correlation coefficient is. This indicates differences in the pace of development of the silver economy due to the analyzed aspects.

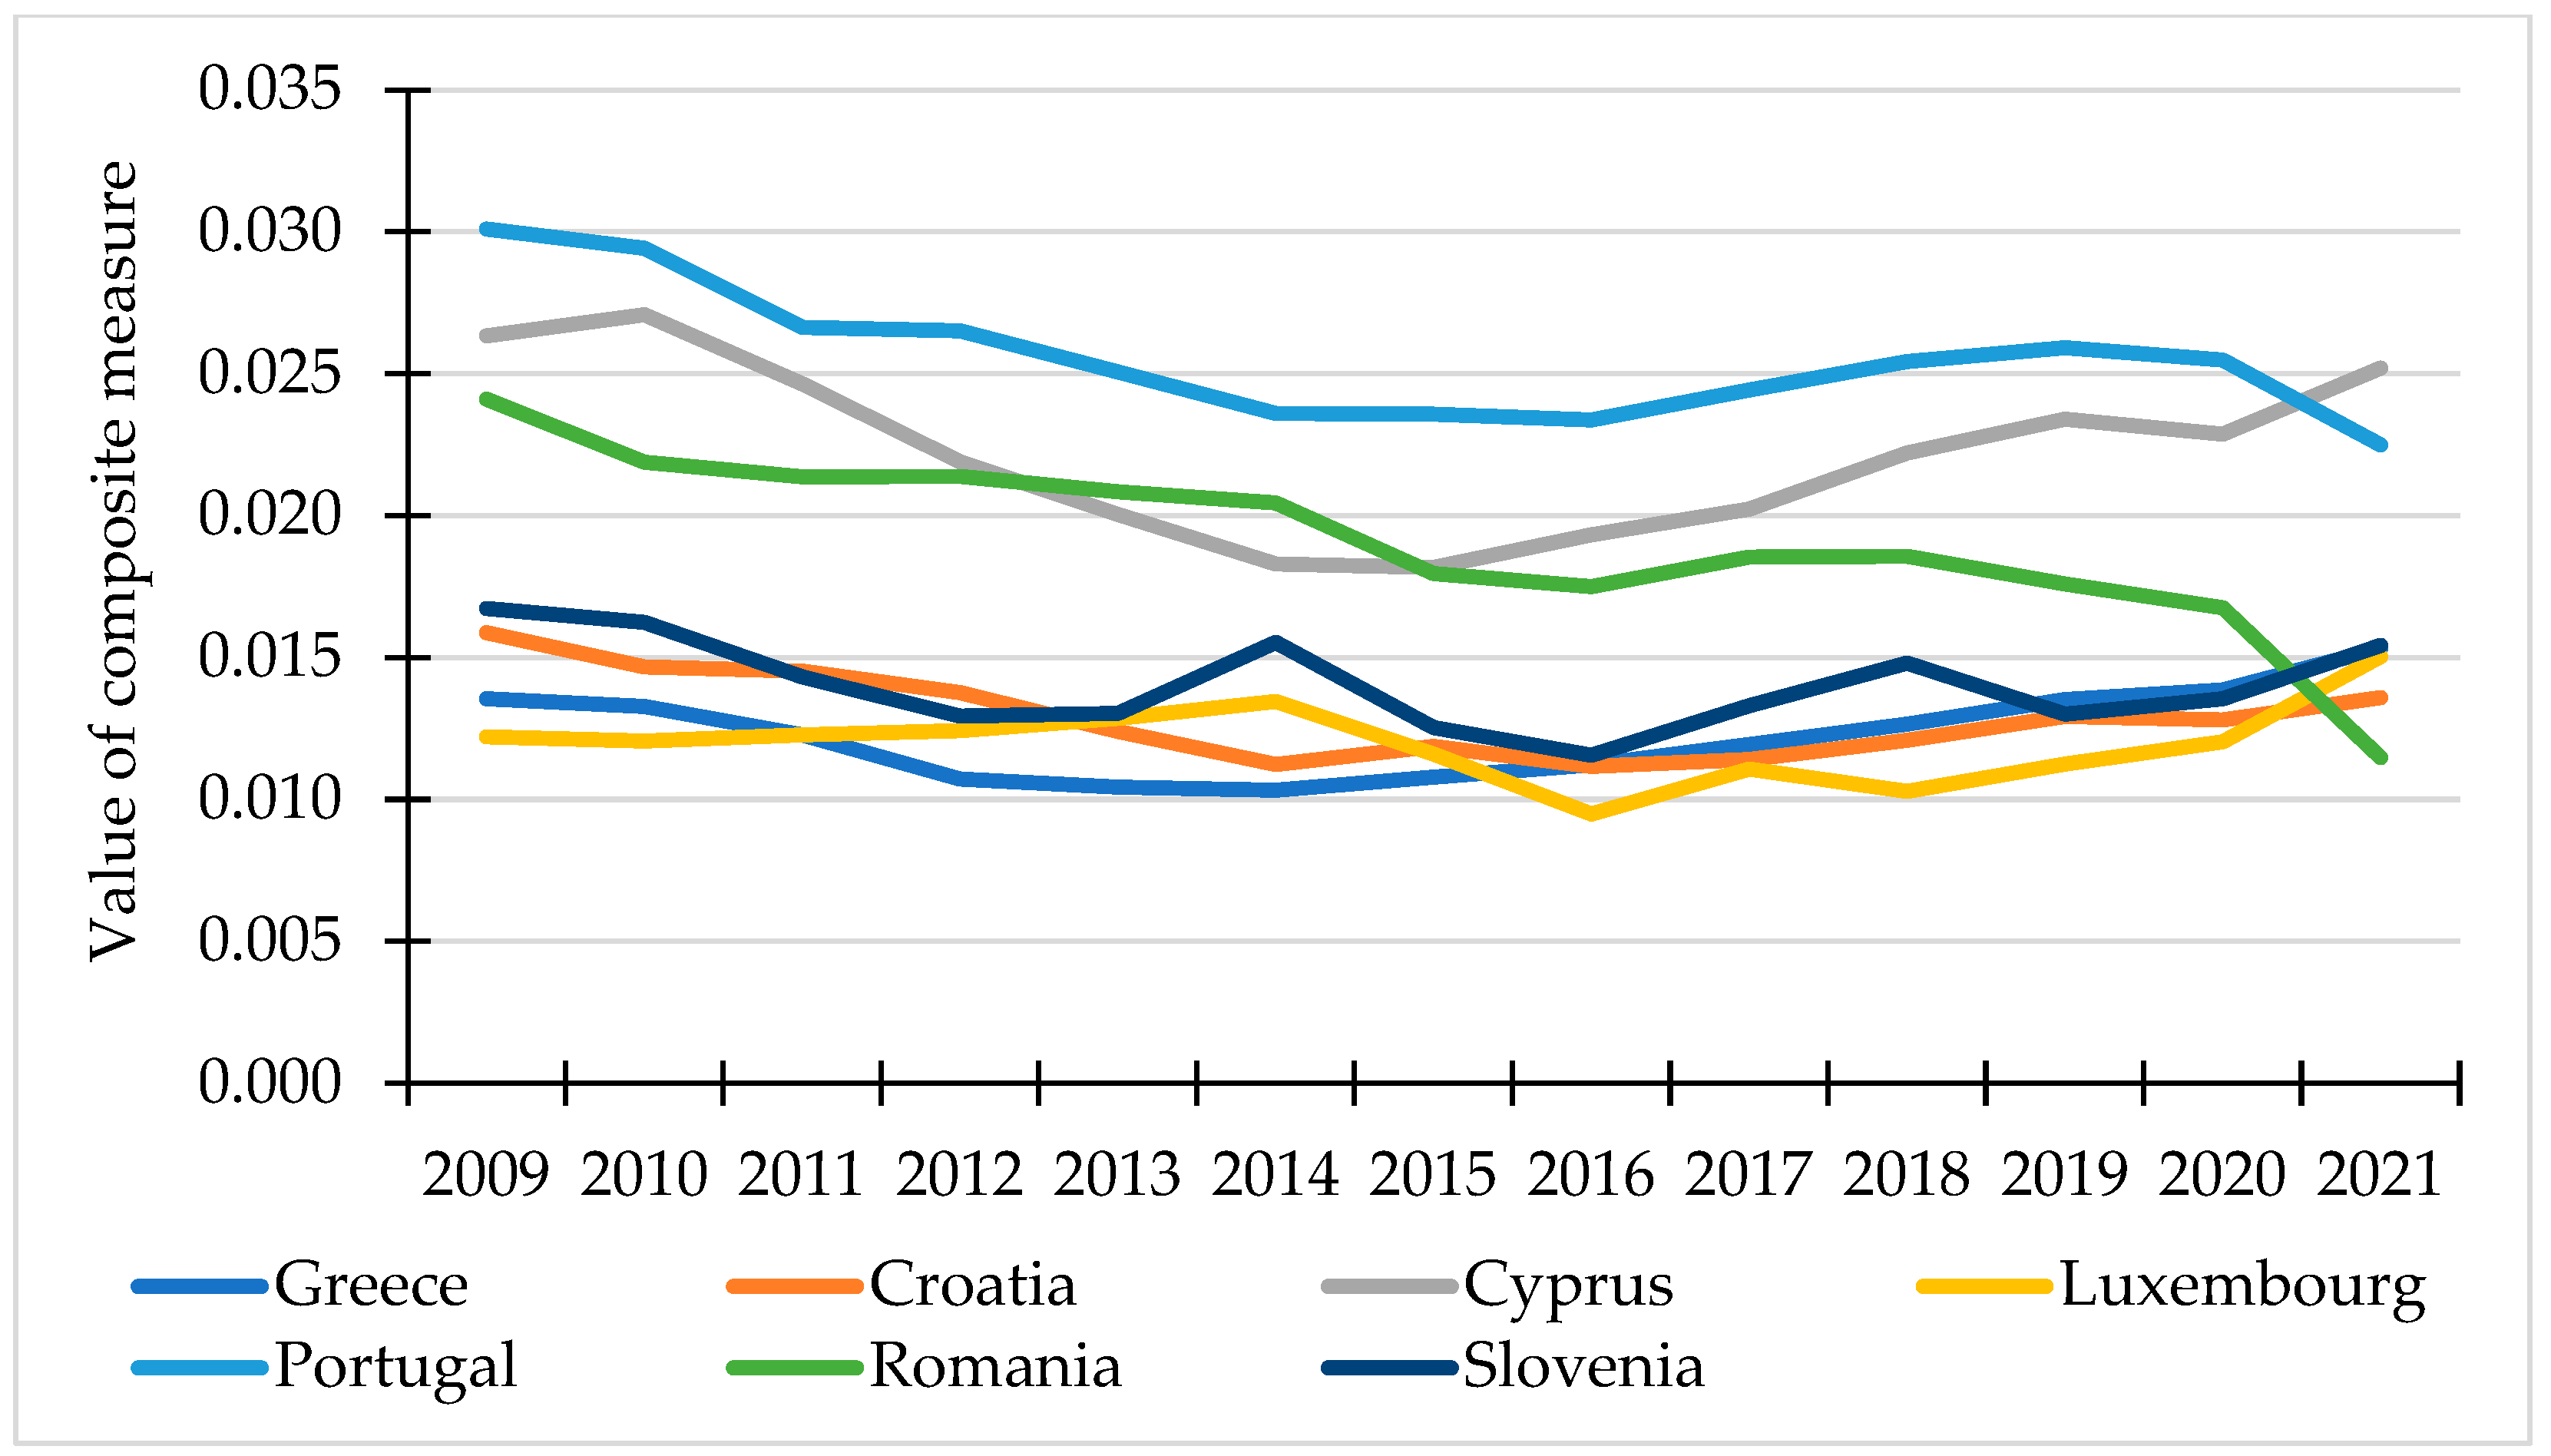
4.3. Clustering Countries According to the Dynamics of the Synthetic Variable

In the third stage of this study, countries were clustered according to the dynamics of changes in the value of the synthetic measure. This was possible because the dynamic version of the COPRAS method was used. This is an original approach to multivariate analyses in a dynamic approach. This part of this study is an attempt to answer the third research question Q3. Countries were analyzed in terms of improving selected aspects of the silver economy determined using the synthetic measure. For this purpose, a distance matrix between the time series of the synthetic variable for individual EU countries was used. These distances were determined using the DTW method. Clustering countries according to similarities in the dynamics of the synthetic variable was performed using hierarchical clustering, with the use of the Ward’s method. In this way, two homogeneous clusters of EU countries were obtained (Figure 4). It should be noted here that within each cluster, the levels of the synthetic variable could be different, but the changes in these levels were similar.
As a result of clustering the time series, two clusters of countries were obtained:
  • The first cluster consisted of Romania, Croatia, Portugal, Luxembourg, Slovenia, Greece, Cyprus (Figure 5). In these countries, the value of the synthetic variable decreased or remained more or less constant in the years 2009–2021.
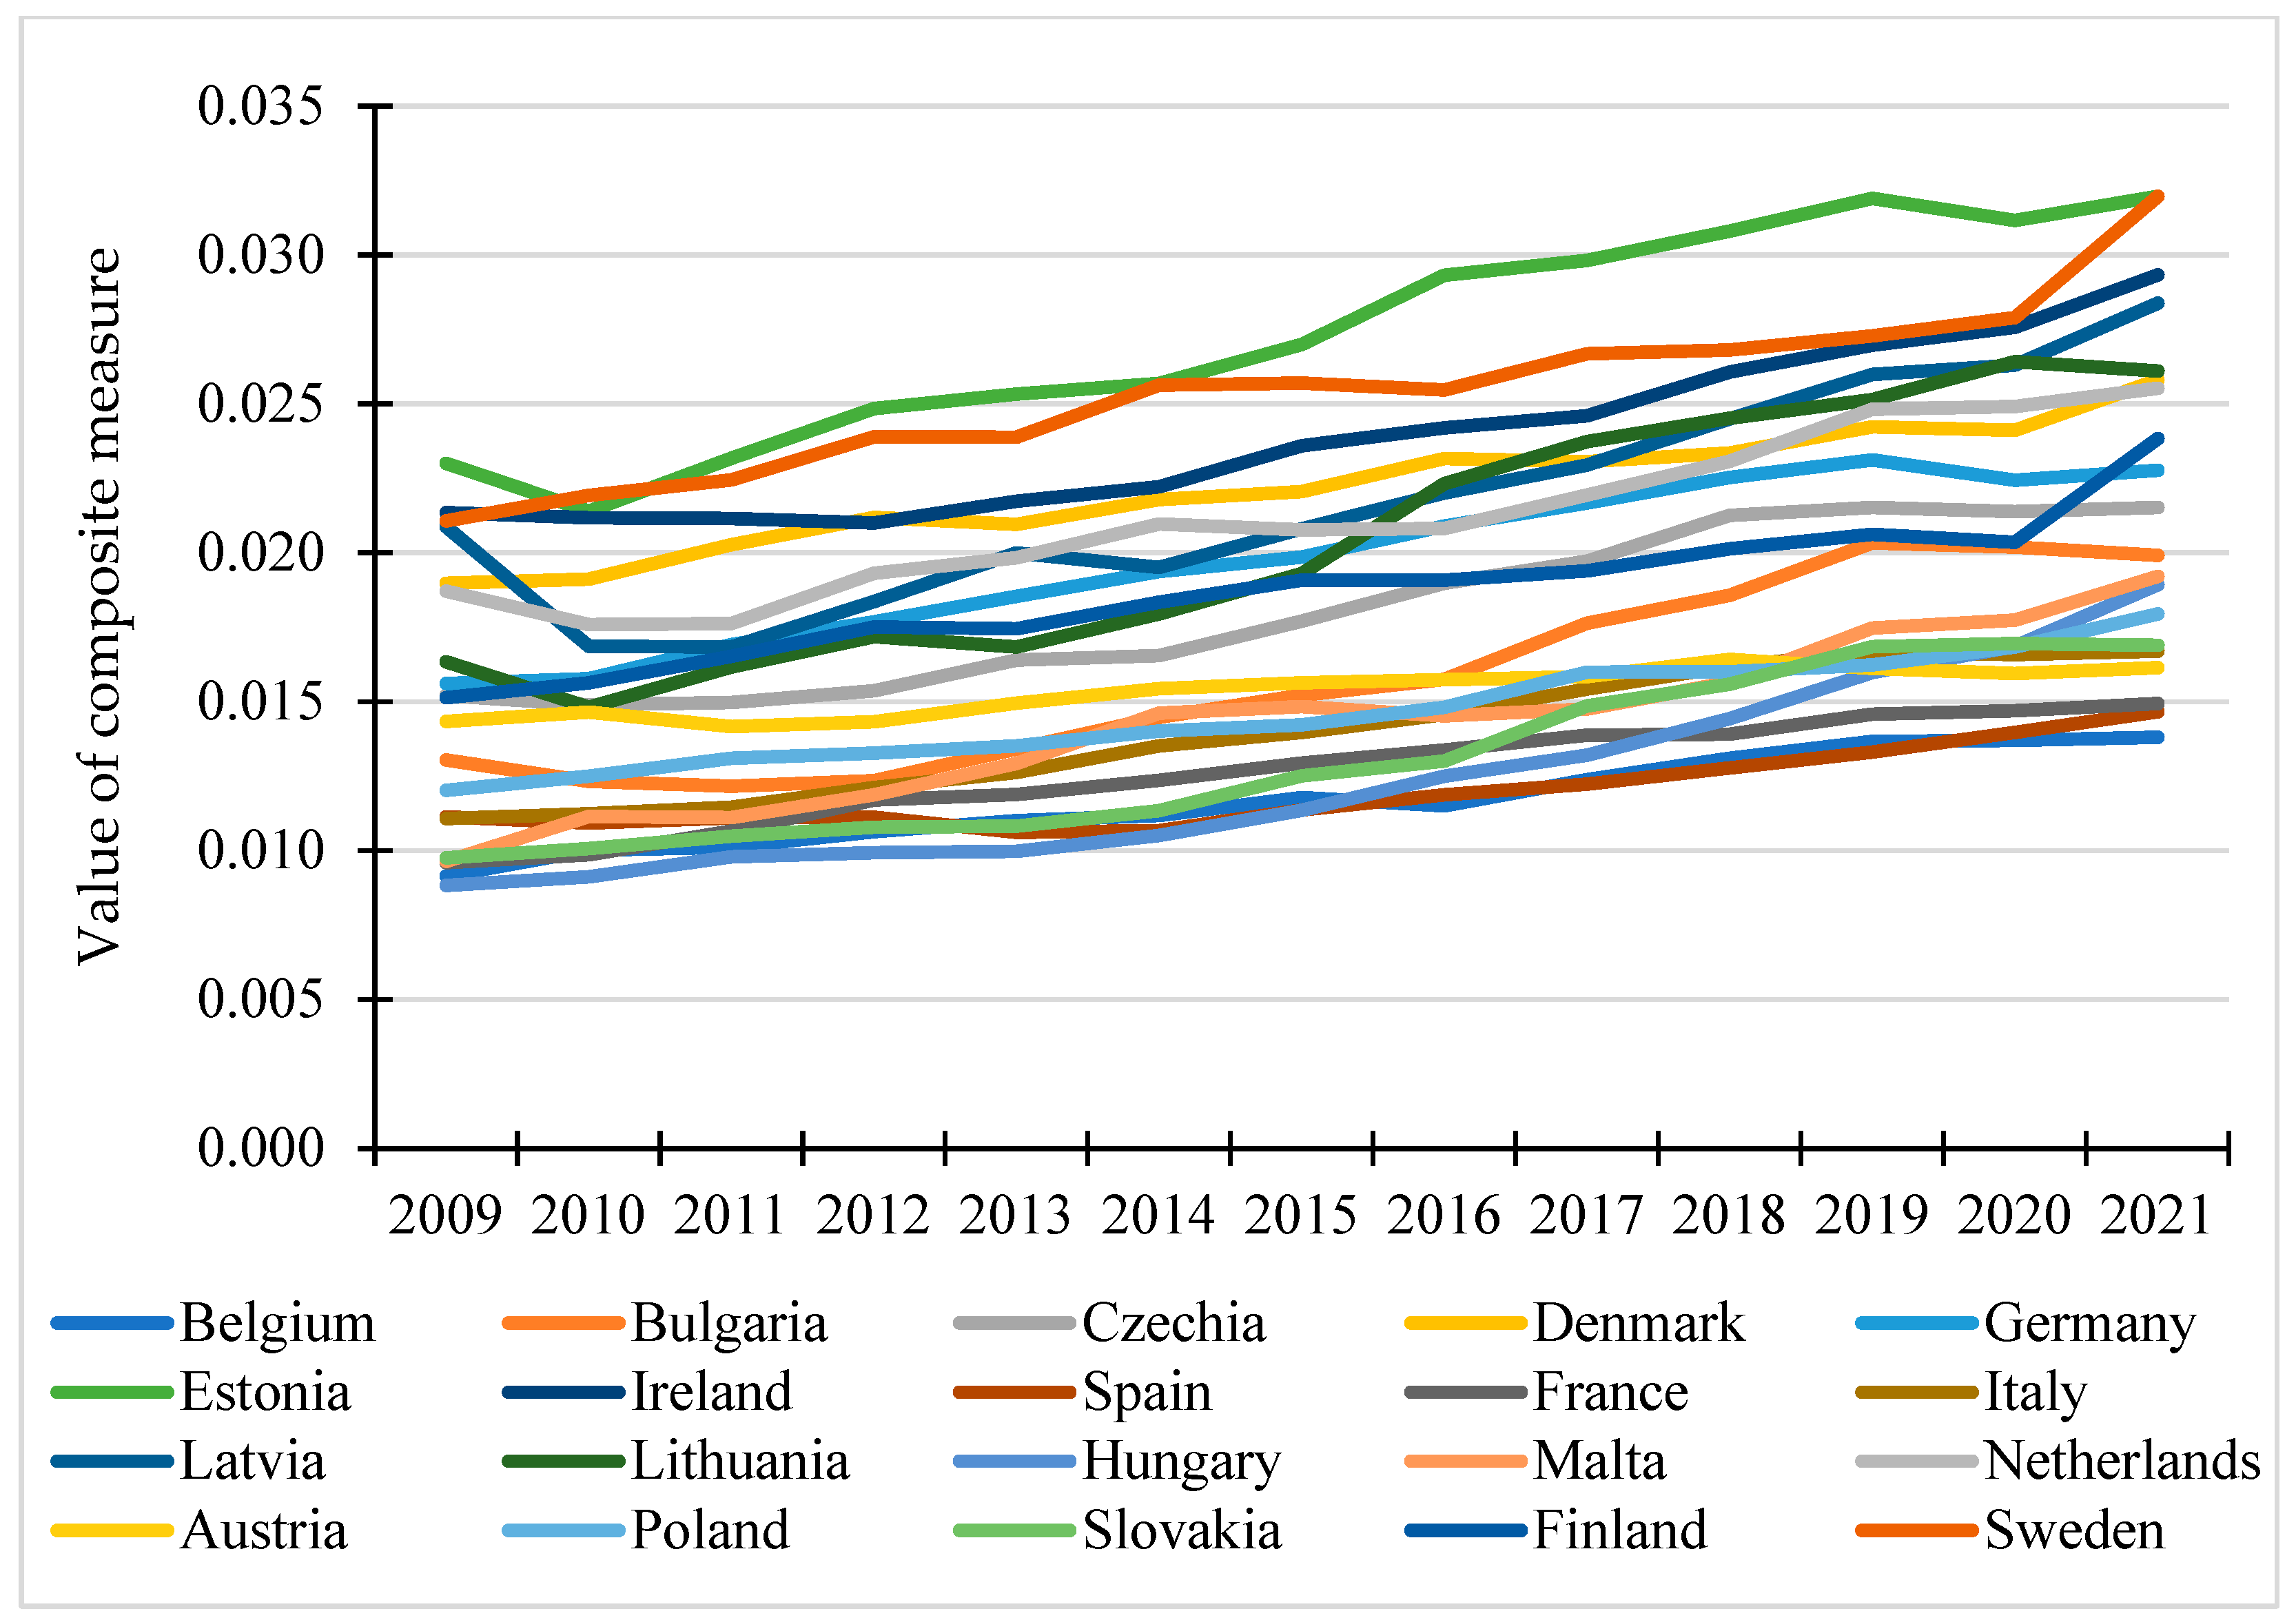
  • The second cluster included the remaining EU countries in which the value of the synthetic variable increased in the years 2009–2021 (Figure 6).
In the case of the present research, the value of composite measure can be understood as the level of development of selected aspects of silver economy. It is the criterion that the composite measure covers, considering the set of analyzed variables.
Presented on both figures, charts are generally confirmed by the values of descriptive statistics of all analyzed variables (Table A1). The values of composite measure for most countries increased during the analyzed period (Figure 6). When we analyze the mean and median values in Table A1, they improved for activity ratio of persons aged 65+ and employment ratio of persons aged 55–64. Mean and median values of share of old age pensions in GDP, share of inactive persons aged 55–74 willing to work, but not seeking employment and the at-risk-of-poverty rate for pensioners aged 65+, fluctuated throughout the whole period or remained on more or less similar level. Mean and median values of the old-age dependency ratio worsened throughout the whole period. Although not all variables indicated improvement in their values, relative high variability of the activity ratio of persons aged 65+ (which values improved) had a greater impact on the values of the composite variable than the values variable, which deteriorated—old-age dependency ratio, for which the level of dispersion was the smallest. Including the remaining variables with rather constant of fluctuating values, most EU countries indicated the improvement in these aspects of the silver economy.
Analysis of descriptive statistics may help in determining which aspects of the silver economy require deeper attention with respect to social and economic policy. The activity ratio of persons aged 65+ and employment ratio of persons aged 55–64 are of least concern, as they show improvement throughout the whole analyzed period. When considering share of old age pensions in GDP, share of inactive persons aged 55–74 willing to work, but not seeking employment and the at-risk-of-poverty rate for pensioners aged 65+, they need to be addressed by the institutions conducting the social and economic policy. However, their structure in all years was positively skewed, which means that more EU countries were characterized by smaller values than the countries with the higher values, which was a good thing for the destimulant variables. The countries with high (or unfavorable) values of these aspects should be identified and the appropriate policies should be addressed to such countries. Analysis of the old-age dependency ratio indicates that this area of the analyzed aspects of the silver economy needs the greatest attention. Not only its values deteriorated during the analyzed period, but also its structure in every year was strongly, negatively skewed. It means that there were more countries with high (or unfavorable) values of this indicator than the countries with its smaller values. However, as it is a purely demographic indicator, it cannot be influenced directly, but rather indirectly, by ensuring economic and social conditions for higher fertility.

5. Discussion

The cluster analysis conducted in the first stage of this study answered research question Q1. EU countries show diversity in terms of the examined aspects of the silver economy. In each of the years studied, three clusters of countries were obtained. The analysis of the countries included in these clusters confirms the diversity in the north–south direction. However, no differentiation was observed in the direction of the “old” EU and the “new” EU. The country rankings for 2009–2021 prepared in the second stage of this study are the answer to the second research question Q2. There were significant changes in the country rankings in terms of the examined aspects of the silver economy. Changes in the rankings over time were confirmed using Spearman’s rank correlation coefficient. The analysis of time series and their assessment using DTW is the answer to the third research question Q3. Two clusters of countries were obtained. In one of them (Romania, Croatia, Portugal, Luxembourg, Slovenia, Greece, and Cyprus), the value of the synthetic variable was decreasing or constant. For the remaining countries, this value was increasing. This might indicate that changes in the development process of the silver economy are not the same for EU countries.
Thalassinos et al. [73] studied the impact of active ageing on the economic development of EU member states. They analyzed the correlation between the Active Ageing Index (AAI) and other economic and market data. They pointed out significant differences between the EU-28 member states in terms of active ageing policies and strategies implemented for economic development. According to their study, the lowest scores were recorded by the EU-13 countries (including Greece and Portugal), while the highest scores were recorded by the Nordic countries (Sweden, Denmark, Finland) and five other EU-15 countries (namely France, Austria, Germany, Belgium, and The Netherlands).
Seniors want to be treated individually. Limiting the assessment AA (Active Ageing) only to economic engagement or physical activity is a great simplification. Przybysz and Stanimir [77] compared EU countries in terms of seniors’ subjective assessment of AA-related activities and checked whether the similarities and differences in the ratings of seniors from different countries had changed in 2020 compared to 2018. Their results confirmed regional differentiation of senior groups, as well as gender and age differentiation.
In the 2018 Active Ageing Index [78] report, the European Union countries were divided into four clusters. The highest scores were given to Sweden, Finland, Denmark, The Netherlands and the United Kingdom (the first best cluster). The second cluster included Ireland, Germany, Portugal, Czechia and the Baltic States. The third cluster included Belgium, France, Austria and Cyprus. The remaining EU countries were in the fourth cluster (the worst one). The highest AAI value in 2018 was for Sweden (47.2 overall score), Denmark was in second place (43.0 overall score) and The Netherlands was in third place (42.7 overall score). The worst position was taken by Greece (27.7 overall score). Croatia was in the last but one place (29.3 overall score), with Romania scored slightly higher (30.2 overall score).
Active ageing approaches and activity theory should take into account the diverse conditions and needs of older people. Only such extended research will allow for the formulation of good policy recommendations. Qualitative comparative analysis (QCA) conducted by Tkalec [79] showed that the combination of higher public health spending, active social life, achieving employment goals and retiring before or at statutory retirement age is a sufficient combination to exploit the potential of the silver economy. However, only a small proportion of EU member states have actively engaged in utilizing the potential of the silver economy.
Krzyminiewska [80] indicated that the development of the silver economy could be unbalanced. Such a problem can arise when the economy develops unevenly by area. The author compares rural areas with urban areas. Rural areas become beneficiaries to a lesser extent and thus generate new social inequalities and the development of destructive phenomena. Our study shows some inequalities in the development of the silver economy between the EU countries. For the Sustainable Development Goals to be realized it would be desirable that the development of the silver economy in the different EU countries follows the same good direction.

6. Conclusions

This article addresses an extremely important problem from the point of view of the ageing of societies. This is the development of the silver economy. It seems that the problem concerns only the elderly. However, due to its orientation and development, it is an issue concerning all age groups, i.e., the entire society. This is a broad issue covering, among others, social, economic, political and health aspects. This multifaceted nature of this issue causes certain limitations to appear in the research on the silver economy. Some problems concern key issues related to terminology. What is senior age? The extension of human life and the improvement of the quality of this life are related to the fact that in developed countries, contemporary 60-year-old persons are often very active members of society and it is difficult to call them seniors in the same sense as 50 years ago. A significant problem is the concept of the silver economy, which is defined in various ways. It is largely a conventional concept. The multifaceted nature of this concept means that it seems impossible to take into account all variables that have a potential impact on the development of the silver economy. Therefore, only selected areas of this issue can be studied. There is a lot of subjectivity in the choice of indicators and their assessment. In the case of multivariate statistical analysis, this problem is manifested in determining the weights of variables. However, in this case, the most important limitation of quantitative research is the lack of appropriate data. On the one hand, these are the gaps regarding a specific variable that should be used in this study. On the other hand, these gaps may concern selected countries (which makes spatial analysis impossible) or selected periods (which makes full time series analysis impossible). Another issue is the quality of available data. These data are collected by offices in individual countries. It happens that the indicators calculated on their basis differ in terms of content and therefore are not comparable.
It is necessary to fully agree with the position of Jóźwiak and Kotowska [81] that population ageing is an inevitable and irreversible process. It is necessary to recognize its existence, try to predict its course and overcome the challenges created by taking appropriate adaptation, anticipatory and modernization actions. In the case of the development of the silver economy, appropriate policies, well-thought-out strategies, measures and tools to support the activity of the ageing population are extremely important. Such actions can affect the successful integration of older people in all dimensions of life. There are studies indicating that the sustainable development of the silver economy can be achieved by means of continuous and gradual increase in the statutory retirement age [82]. Other aspects of public pension laws, such as increasing contribution rates, adjusting mandatory government subsidies, and a fair pension system, would also need to be addressed to achieve the SDG’s. Governments should also take action in other areas such as equality in access to health care, increasing demand for older workers, providing flexible benefit options, complementing pension reforms with other social programs and improving the safety of the working environment. As age increases, the costs of health care, medical treatment, social security, etc. will increase. Governments should therefore address a sustainable and effective social security system.
Future research in this area may focus on a broader selection of indicators covering not only economic aspects, but also health, social and even political aspects. One of the important issues related to ageing populations is the topic of older people in the context of migration. Data on the older migrant population are prepared and used only sporadically. The main focus is on women and children [83]. Overlooking the older migrant group may result in a reduction in the effectiveness of migration policy. This can lead to the perpetuation of social inequalities. It is thus a threat to achieving Sustainable Development Goals. This is the direction of future research. It is hoped that the development of the silver economy in the EU will improve the quality and availability of data, which will enable a broader analysis of this issue.

Author Contributions

Conceptualization, B.B.-S., K.D. and E.F.; methodology, B.B.-S., K.D. and E.F.; software, K.D.; validation, B.B.-S., K.D. and E.F.; formal analysis, B.B.-S.; investigation, B.B.-S., K.D. and E.F.; resources, B.B.-S., K.D. and E.F.; data curation, B.B.-S., K.D. and E.F.; writing—original draft preparation, B.B.-S., K.D. and E.F.; writing—review and editing, B.B.-S.; visualization, K.D.; supervision, E.F. All authors have read and agreed to the published version of the manuscript.

Funding

This research received no external funding.

Institutional Review Board Statement

Not applicable.

Informed Consent Statement

Not applicable.

Data Availability Statement

All data come from the Eurostat: https://ec.europa.eu/eurostat/web/main/data/database (accessed on 15 May 2024).

Conflicts of Interest

The authors declare no conflicts of interest.

Appendix A

Table A1. Basic descriptive statistics of analyzed variables for years 2009–2021. Source: own elaboration on the basis of the Eurostat data.
Descriptive StatisticsVariables
x2x3x4x5x6x7x2x3x4x5x6x7
20092010
min16.001.4029.104.100.664.2016.501.5029.303.900.723.70
max30.9017.0068.6011.5012.4453.5031.4016.5069.1011.6012.5342.30
mean24.075.8644.587.413.8920.6024.435.6444.517.574.1716.09
median25.204.9043.007.003.0419.4025.604.7042.807.003.4316.20
standard deviation3.753.809.891.772.6212.063.763.619.311.802.858.39
coefficient of variation0.160.650.220.240.670.590.150.640.210.240.680.52
skewness−0.401.210.380.441.421.22−0.411.350.520.331.301.13
20112012
min17.201.8029.304.000.723.5017.801.8030.904.101.044.40
max31.4014.5070.7012.7012.1037.8032.0014.6071.6013.9013.7331.20
mean24.805.5745.177.584.5415.1925.365.6746.087.804.9714.93
median25.904.9042.707.003.5714.5026.505.0044.207.304.2414.80
standard deviation3.763.249.852.012.737.933.803.229.942.192.886.33
coefficient of variation0.150.580.220.270.600.520.150.570.220.280.580.42
skewness−0.471.090.540.641.120.94−0.531.000.600.801.110.51
20132014
min18.401.7031.504.201.384.3019.001.7033.004.401.144.40
max32.7013.3072.3013.0012.1428.6033.1011.9072.8013.5011.6835.40
mean26.005.6147.278.045.4114.0726.695.7748.658.105.1814.46
median26.905.1045.207.704.6713.5027.405.4046.007.204.8113.90
standard deviation3.813.0310.062.222.786.173.812.9110.082.322.767.30
coefficient of variation0.150.540.210.280.510.440.140.500.210.290.530.50
skewness−0.580.790.550.440.450.41−0.630.460.470.520.401.02
20152016
min19.701.9032.704.601.304.3020.201.4035.304.601.185.70
max33.7011.8073.2014.3011.5539.8034.3013.5074.1014.3017.2945.50
mean27.405.7650.308.034.9115.7428.035.8152.407.995.0516.68
median27.905.3048.307.304.1414.0028.305.0050.507.004.5614.20
standard deviation3.792.8310.212.462.809.043.793.0910.272.453.349.61
coefficient of variation0.140.490.200.310.570.570.140.530.200.310.660.58
skewness−0.650.580.250.620.601.22−0.670.580.150.661.831.54
20172018
min20.502.1036.904.401.357.0020.601.9038.604.201.406.40
max34.8013.5075.2013.7015.2046.6035.2014.2076.7013.2015.2653.80
mean28.646.1854.637.934.7617.8229.256.5056.857.884.7019.00
median28.705.5053.507.604.0814.6029.605.8055.907.503.5815.40
standard deviation3.783.0410.172.412.9610.623.793.1710.072.393.3811.96
coefficient of variation0.130.490.190.300.620.600.130.490.180.300.720.63
skewness−0.720.540.040.511.711.49−0.760.51−0.060.421.741.66
20192020
min20.702.3040.404.101.027.4020.902.8041.504.001.047.10
max35.8014.6076.5013.2014.6453.8036.4014.1076.3014.5013.9449.40
mean29.776.8358.387.854.4319.6830.346.8458.978.534.6420.20
median30.406.6058.507.503.7015.6031.106.3059.608.303.7216.10
standard deviation3.833.2610.012.413.1711.813.893.239.652.593.2911.12
coefficient of variation0.130.480.170.310.720.600.130.470.160.300.710.55
skewness−0.750.49−0.070.391.711.59−0.750.56−0.110.361.451.37
2021
min21.002.4043.803.600.899.10
max37.0014.7076.9013.3017.0651.20
mean30.877.2460.668.094.6819.93
median31.606.2062.807.903.3515.80
standard deviation3.933.568.942.473.7711.23
coefficient of variation0.130.490.150.310.810.56
skewness−0.780.63−0.080.251.641.55

References

  1. United Nations. Available online: https://www.un.org/en/global-issues/ageing (accessed on 1 September 2024).
  2. Schulz, E.; Radvansky, M. Impact of Ageing Populations on Silver Economy, Health and Long-Term Care Workforce. NEUJOBS Policy Brief. 2014. No. D12. Available online: http://www.neujobs.eu/sites/default/files/publication/2014/02/NEUJOBS_PolicyBrief_D12.4.pdf (accessed on 20 August 2024).
  3. Starzenie się Ludności w Unii Europejskiej—Stan Obecny i Prognoza; Kancelaria Senatu: Warszawa, Poland, 2018. Available online: https://www.senat.gov.pl/gfx/senat/pl/senatopracowania/160/plik/ot-662.pdf (accessed on 25 August 2024).
  4. Reshetnikova, L.; Boldyreva, N.; Perevalova, M.; Kalayda, S.; Pisarenko, Z. Conditions for the Growth of the “Silver Economy” in the Context of Sustainable Development Goals: Peculiarities of Russia. J. Risk Financ. Manag. 2021, 14, 401. [Google Scholar] [CrossRef]
  5. World Health Organization. World Health Statistics 2016: Monitoring Health for the SDGs Sustainable Development Goals. 2016. Available online: https://www.who.int/publications/i/item/9789241565264 (accessed on 20 November 2024).
  6. Gutman, G. Meeting the challenges of global aging: The need for a gerontological approach. In Proceedings of the Geriatrics 2006, the International Congress of Elderly Health, Istanbul, Turkey, 2–6 April 2006. [Google Scholar]
  7. Szukalski, P. (Ed.) Przygotowanie do Starości. Polacy Wobec Starzenia Się; Instytut Spraw Publicznych: Warszawa, Poland, 2009. [Google Scholar]
  8. Kohlbacher, F.; Herstatt, C. (Eds.) The Silver Market Phenomenon. Business Opportunities in an Era of Demographic Change; Springer: Berlin/Heideiberg, Germany, 2010. [Google Scholar]
  9. Álvarez-Diez, R.C. The evolution research on Silver Economy: Current researches, trends, and implications for future directions. Transinformação 2023, 35, e237325. [Google Scholar] [CrossRef]
  10. European Commission. Growing the European Silver Economy (Background Paper). 2015. Available online: https://digital-strategy.ec.europa.eu/en/library/growing-silver-economy-background-paper (accessed on 10 September 2024).
  11. Klimczuk, A. The Silver Economy as a Constructive Response in Public Policy on Aging. In Strategic Approach to Aging Population: Experiences and Challenges; Bojanić, I.B., Erceg, A., Eds.; J.J. Strossmayer University of Osijek: Osijek, Croatia, 2021; pp. 19–35. Available online: https://nbn-resolving.org/urn:nbn:de:0168-ssoar-73702-7 (accessed on 10 August 2024).
  12. Klimczuk, A. Comparative analysis of national and regional models of the silver economy in the European Union. Int. Int. J. Ageing Later Life 2016, 11, 1–29. [Google Scholar] [CrossRef]
  13. Wierzbicka, W.; Farelnik, E. Population Aging and the Potential for Developing a Silver Economy in the Polish National Cittaslow Network. Sustainability 2024, 16, 6768. [Google Scholar] [CrossRef]
  14. Rogelj, V.; Bogataj, D. Social infrastructure of silver economy: Literature review and research agenda. IFAC-PapersOnLine 2019, 52, 2680–2685. [Google Scholar] [CrossRef]
  15. Marcucci, G.; Ciarapica, F.; Poler, R.; Sanchis, R. A bibliometric analysis of the emerging trends in silver economy. IFAC-PapersOnLine 2021, 54, 936–941. [Google Scholar] [CrossRef]
  16. Edvardsson, M.C.V.V.B.; Vigolo, V.; Colurcio, M. Fifty years of research on silver economy: A bibliometric analysis. Sinergie IJM’s Essays 2022, 40, 149–171. [Google Scholar] [CrossRef]
  17. Frąckiewicz, E.; Iwański, R. (Eds.) Srebrna Gospodarka. Perspektywa Interdyscyplinarna; Wydawnictwo Akademii Sztuki w Szczecinie: Szczecin, Poland, 2021. [Google Scholar]
  18. Szukalski, P. Trzy kolory: Srebrny: Co to takiego silver economy? Polityka Społeczna 2012, 5–6, 6–10. [Google Scholar]
  19. Leśna-Wierszołowicz, E. Silver economy as a response to demographic changes. Pr. Nauk. Uniw. Ekon. We Wrocławiu 2018, 529, 162–169. [Google Scholar] [CrossRef]
  20. Golinowska, S. Srebrna gospodarka—Element strategii rozwoju regionalnego. Małopolskie Stud. Reg. 2014, 2–3, 17–29. [Google Scholar]
  21. Laperche, B.; Boutillier, S.; Djellal, F.; Ingham, M. Innovating for elderly people: The development of geront’innovaations in the French silver economy. Technol. Anal. Strateg. Manag. 2018, 31, 462–476. [Google Scholar] [CrossRef]
  22. Zsarnoczky, M. Silver Tourism; Slovak University of Agriculture in Nitra: Nitra, Slovakia, 2016; pp. 556–563. [Google Scholar]
  23. Penrose, E. The Theory of the Growth of the Firm, 3rd ed.; Oxford University Press: New York, NY, USA, 1995. [Google Scholar]
  24. Grupp, H. Foundations of the Economics of Innovation; Edward Elgar: Cheltenham, UK, 1998. [Google Scholar]
  25. Swann, G.M.P. The Economics of Innovation: An Introduction; Edward Elgar: Cheltenham, UK, 2009. [Google Scholar]
  26. McGuirk, H.; Lenihan, A.C.; Lenihan, N. Awareness and potential of the silver economy for enterprises: A European regional level study. Small Enterp. Res. 2022, 29, 6–19. [Google Scholar] [CrossRef]
  27. Batsaikhan, U. Embracing the Silver Economy. Available online: http://bruegel.org/2017/04/embracing-the-silver-economy/ (accessed on 1 April 2019).
  28. Przywojska, J.; Podgórniak-Krzykacz, A.; Warwas, I. Environmental education of the elderly—Towards an active, inclusive and trust-based ecosystem. Innov. Eur. J. Soc. Sci. Res. 2023, 36, 453–480. [Google Scholar] [CrossRef]
  29. Griva, A.; Mitroulia, M.; Armakolas, S. Strategic management of the silver economy: A European perspective. Eur. J. Manag. Mark. Stud. 2024, 9, 1–17. [Google Scholar] [CrossRef]
  30. Chen, X. The Benefits of Re-employment Among the Elderly: Perspectives on the Silver Economy and Re-employment Willingness. Adv. Econ. Manag. Res. 2024, 12, 874. [Google Scholar] [CrossRef]
  31. Greco, F.; Tregua, M.; Carignani, F.; Bifulco, F. Silver entrepreneurship: A new trend in startups. Sinergie Ital. J. Manag. 2022, 40, 123–148. [Google Scholar] [CrossRef]
  32. Sanchis, R.; Mula, J.; Marcucci, G.; Bevilacqua, M. A Framework Proposal for Research into Silver Labour from a Resilient Perspective. IFAC-PapersOnLine 2021, 54, 930–935. [Google Scholar] [CrossRef]
  33. Oget, Q. When Economic Promises Shape Innovation and Networks: A Structural Analysis of Technological Innovation in the Silver Economy. J. Innov. Econ. Manag. 2021, 35, 55–80. [Google Scholar] [CrossRef]
  34. Butt, S.A.; Draheim, D. Ethical Challenges of ICT for the Silver Economy. In Proceedings of the Eighth International Conference on eDemocracy & eGovernment (ICEDEG), Quito, Ecuador, 28–30 July 2021; pp. 152–155. [Google Scholar] [CrossRef]
  35. Qi, J.; Wang, T.; Huai, F. The significance of senior education in the Internet era for the construction of lifelong education system. Appl. Math. Nonlinear Sci. 2024, 9, 1–14. [Google Scholar] [CrossRef]
  36. Shahvaroughi Farahani, M. The Impacts of Aging on Economic Growth and Sustainable Development (Case Study of G20 Countries). Iran. Sociol. Rev. 2022, 12, 85–100. [Google Scholar]
  37. Vera-Sanso, P. Will the SDGs and the UN Decade of Healthy Ageing Leave Older People Behind? Prog. Dev. Stud. 2023, 23, 391–407. [Google Scholar] [CrossRef]
  38. Cizelj, B. Silver economy—A reply to challenges of population aging. Mednar. Inov. Posl. J. Innov. Bus. Manag. 2022, 14, 1–5. [Google Scholar] [CrossRef]
  39. Lipp, B.; Peine, A. Ageing as a driver of progressive politics? What the European Silver Economy teaches us about the co-constitution of ageing and innovation. Ageing Soc. 2024, 44, 1481–1493. [Google Scholar] [CrossRef]
  40. Nahal, S.; Ma, B. The Silver Dollar—Longevity Revolution Primer; Bank of America Merrill Lynch: New York, NY, USA, 2014; Available online: https://www.longfinance.net/programmes/sustainable-futures/london-accord/reports/the-silver-dollar-longevity-revolution-primer/ (accessed on 27 August 2024).
  41. European Commission. Available online: https://digital-strategy.ec.europa.eu/en/policies/eip-aha (accessed on 10 September 2024).
  42. Brodny, J.; Tutak, M.; Grebski, W.; Bindzár, P. Assessing the level of innovativeness of EU-27 countries and its relationship to economic, environmental, energy and social parameters. J. Open Innov. Technol. Mark. Complex. 2023, 9, 100073. [Google Scholar] [CrossRef]
  43. Augustyński, I.; Jurek, Ł. Being old in the age of aging: Macro-level determinants of change in perception of old age threshold in EU countries. Eur. Res. Stud. 2021, 24, 767–784. [Google Scholar] [CrossRef]
  44. Dehnel, G.; Gołata, E.; Walesiak, M. Assessment of changes in population ageing in regions of the V4 countries with application of multidimensional scaling. Argum. Oecon. 2020, 1, 77–100. [Google Scholar] [CrossRef]
  45. Ortega-Gil, M.; ElHichou-Ahmed, C.; Mata-García, A. Effects of Immigrants, Health, and Ageing on Economic Growth in the European Union. Int. J. Environ. Res. Public Health 2022, 20, 224. [Google Scholar] [CrossRef]
  46. MacQueen, J. Some methods for classification and analysis of multivariate observations. In Proceedings of the Fifth Berkeley Symposium on Mathematical Statistics and Probability, Berkeley, CA, USA, 21 June–18 July 1965; pp. 281–297. [Google Scholar]
  47. Małys, Ł. The approach to supply chain cooperation in the implementation of sustainable development initiatives and company’s economic performance. Equilibrium. Quart. J. Econ. Policy 2023, 18, 255–286. [Google Scholar] [CrossRef]
  48. Bernardelli, M.; Korzeb, Z.; Niedziółka, P. The banking sector as the absorber of the COVID-19 crisis? economic consequences: Perception of WSE investors. Oecon. Copernic. 2021, 12, 335–374. [Google Scholar] [CrossRef]
  49. Konya, S. Panel Estimation of the Environmental Kuznets Curve for CO2 Emissions and Ecological Footprint: Environmental Sustainability in Developing Countries. Folia Oeconomica Stetinenesia 2022, 22, 123–145. [Google Scholar] [CrossRef]
  50. Khare, I.; Rodrigues, L.L.R.; Gulvady, S.; Bhakta, S.S.; Nair, G.K.; Hussain, A. Impact of Business Intelligence on Company Performance: A System Dynamics Approach. Folia Oeconomica Stetin. 2023, 23, 183–203. [Google Scholar] [CrossRef]
  51. Murrja, A.; Ndreca, P.; Maloku, S.; Meço, M. Analysis of Production Risk in Intensive Chicken Farms—The Case of Kosovo. Folia Oeconomica Stetin. 2023, 23, 294–310. [Google Scholar] [CrossRef]
  52. Zavadskas, E.K.; Kaklauskas, A.; Šarka, V. The new method of multictiteria complex proportional assessment projects. In Technological and Economic Development of Economy; Zavadskas, E.K., Linnert, P., Eds.; Business Management; Technika: Vilnius, Lithuania, 1994; Volume 3, pp. 131–140. [Google Scholar]
  53. Bellman, R.; Kalaba, R. On adaptive control processes. IRE Trans. Automat. Contr. 1959, 4, 1–9. [Google Scholar] [CrossRef]
  54. Rabiner, L.; Rosenberg, A.; Levinson, S. Considerations in dynamic time warping algorithms for discrete word recognition. IEEE Trans. Acoust. Speech Signal. Process. 1978, 26, 575–582. [Google Scholar] [CrossRef]
  55. Sakoe, H.; Chiba, S. Dynamic programming algorithm optimization for spoken word recognition. IEEE Trans. Acoust. Speech Signal. Process. 1978, 26, 43–49. [Google Scholar] [CrossRef]
  56. Myers, C.S.; Rabiner, L.R. A comparative study of several dynamic time-warping algorithms for connected word recognition. Bell Syst. Tech. J. 1981, 60, 1389–1409. [Google Scholar] [CrossRef]
  57. Sankoff, D.; Kruskal, J. (Eds.) Time Warps, String Edits, and Macromolecules: The Theory and Practice of Sequence Comparison; Addison-Wesley: Reading, MA, USA, 1983. [Google Scholar]
  58. Aach, J.; Church, G.M. Aligning gene expression time series with time warping algorithms. Bioinformatics 2001, 17, 495–508. [Google Scholar] [CrossRef]
  59. Müller, M. Information Retrieval for Music and Motion; Springer: Berlin/Heidelberg, Germany, 2007. [Google Scholar]
  60. Arici, T.; Celebi, S.; Aydin, A.S.; Temiz, T.T. Robust gesture recognition using feature pre-processing and weighted dynamic time warping. Multimed. Tools Appl. 2014, 72, 3045–3062. [Google Scholar] [CrossRef]
  61. Stübinger, J. Statistical arbitrage with optimal causal paths on high-frequency data of the S&P 500. Quant. Financ. 2019, 19, 921–935. [Google Scholar] [CrossRef]
  62. Dmytrów, K.; Bieszk-Stolorz, B. Mutual relationships between the unemployment rate and the unemployment duration in the Visegrad Group countries in years 2001–2017. Equilibrium. Q. J. Econ. Econ. Policy 2019, 14, 129–148. [Google Scholar] [CrossRef]
  63. Dmytrów, K.; Landmesser, J.; Bieszk-Stolorz, B. The Connections between COVID-19 and the Energy Commodities Prices: Evidence through the Dynamic Time Warping Method. Energies 2021, 14, 4024. [Google Scholar] [CrossRef]
  64. Dmytrów, K.; Bieszk-Stolorz, B.; Landmesser-Rusek, J. Sustainable Energy in European Countries: Analysis of Sustainable Development Goal 7 Using the Dynamic Time Warping Method. Energies 2022, 15, 7756. [Google Scholar] [CrossRef]
  65. Giorgino, T. Computing and visualizing dynamic time warping alignments in R: The dtw package. J. Stat. Softw. 2009, 31, 1–24. [Google Scholar] [CrossRef]
  66. Sardá-Espinosa, A. Time-series clustering in R using the dtwclust package. R J. 2019, 11, 22–43. [Google Scholar] [CrossRef]
  67. Miłek, D. Spatial differentiation in the social and economic development level in Poland. Equilibrium. Q. J. Econ. Econ. Policy 2018, 13, 487–507. [Google Scholar] [CrossRef]
  68. Pietrzak, M.B.; Ziemkiewicz, B. Cluster analysis of digital economy in the old European Union countries. In Mathematical Methods in Economics MME 2018, Proceedings of the 36th International Conference, Jindřichův Hradec, Czechia, 12–14 September 2018; Váchová, L., Kratochvíl, V., Eds.; MatfyzPress, Publishing House of the Faculty of Mathematics and Physics Charles University: Prague, Czechia, 2018; pp. 422–427. [Google Scholar]
  69. Rollnik-Sadowska, E.; Dąbrowska, E. Cluster analysis of effectiveness of labour market policy in the European Union. Oecon. Copernic. 2018, 9, 143–158. [Google Scholar] [CrossRef]
  70. Szymańska, A. National fiscal frameworks in the post-crisis European Union. Equilibrium. Q. J. Econ. Econ. Policy 2018, 13, 623–642. [Google Scholar] [CrossRef]
  71. Kovacova, M.; Kliestik, T.; Valaskova, K.; Durana, P.; Juhaszova, Z. Systematic review of variables applied in bankruptcy prediction models of Visegrad group countries. Oecon. Copernic. 2019, 10, 743–772. [Google Scholar] [CrossRef]
  72. Gnat, S. Spatial weight matrix impact on real estate hierarchical clustering in the process of mass valuation. Oecon. Copernic. 2019, 10, 131–151. [Google Scholar] [CrossRef]
  73. Thalassinos, E.; Cristea, M.; Noja, G.G. Measuring active ageing within the European Union: Implications on economic development. Equilibrium. Q. J. Econ. Econ. Policy 2019, 14, 591–609. [Google Scholar] [CrossRef]
  74. Poliak, M.; Svabova, L.; Konecny, V.; Zhuravleva, N.A.; Culik, K. New paradigms of quantification of economic efficiency in the transport sector. Oecon. Copernic. 2021, 12, 193–212. [Google Scholar] [CrossRef]
  75. Senin, P. Dynamic Time Warping Algorithm Review; Information and Computer Science Department University of Hawaii at Manoa: Honolulu, HI, USA, 2008. [Google Scholar]
  76. Ward, J.H. Hierarchical Grouping to Optimize an Objective Function. J. Am. Stat. Assoc. 1963, 58, 236–244. [Google Scholar] [CrossRef]
  77. Przybysz, K.; Stanimir, A. How Active Are European Seniors—Their Personal Ways to Active Ageing? Is Seniors’ Activity in Line with the Expectations of the Active Ageing Strategy? Sustainability 2023, 15, 10404. [Google Scholar] [CrossRef]
  78. UNECE/European Commission. 2018 Active Ageing Index: Analytical Report. 2019. Available online: https://unece.org/DAM/pau/age/Active_Ageing_Index/ECE-WG-33.pdf (accessed on 28 August 2024).
  79. Tkalec, I. The Interplay between Active Ageing and Silver Economy—A QCA Analysis. Cah. RESUME 2017, 3, 1–12. [Google Scholar] [CrossRef]
  80. Krzyminiewska, G. Silver economy in rural areas in the context of (un)sustainable development. Ann. PAAAE 2019, 21, 212–219. [Google Scholar] [CrossRef]
  81. Jóźwiak, J.; Kotowska, I.E. Przewidywane Zmiany Liczby i Struktury Wieku Ludności w Polsce do 2035 r. i ich Skutki Ekonomiczne, W: Problemy Demograficzne Polski i ich Skutki Ekonomiczne. Raport z Pierwszego Posiedzenia Narodowej rady Rozwoju; Kancelaria Prezydenta Rzeczpospolitej Polskiej: Warszawa, Poland, 2010; p. 54. [Google Scholar]
  82. Bran, F.; Popescu, M.-L.; Stanciu, P. Perspectives of Silver Economy in European Union. Rev. De Manag. Comp. Int. 2016, 17, 130–135. [Google Scholar]
  83. Migration Data Portal. Available online: www.migrationdataportal.org/themes/older-persons-and-migration (accessed on 10 November 2024).
Figure 1. Stages of research. Source: own elaboration.
Sustainability 16 10703 g001
Figure 2. Steps of the COPRAS method. Source: own elaboration.
Sustainability 16 10703 g002
Figure 3. Homogeneous clusters of EU countries in 2009, 2015, 2019, 2021. Source: own elaboration on the basis of the Eurostat data.
Sustainability 16 10703 g003
Figure 4. Homogeneous clusters of EU countries due to the dynamics of the synthetic variable in the years 2009–2021. Source: own elaboration on the basis of the Eurostat data.
Sustainability 16 10703 g004
Figure 5. Dynamics of the synthetic variable for EU countries in 2009–2021 in a smaller cluster. Source: own elaboration on the basis of the Eurostat data.
Sustainability 16 10703 g005
Figure 6. Dynamics of the synthetic variable for EU countries in 2009–2021 in a larger cluster. Source: own elaboration on the basis of the Eurostat data.
Sustainability 16 10703 g006
Table 1. Average values of the analyzed variables in the obtained clusters in 2009, 2015, 2019,2021. Source: own elaboration on the basis of the Eurostat data.
YearsCluster Number x 2 x 3 x 4 x 5 x 6 x 7
124.1275.14737.0607.5473.39116.407
2009224.0135.93854.2757.8253.45016.100
323.9758.40053.4006.1006.64645.350
126.6634.50643.0698.3634.82612.844
2015228.1007.62961.8438.5004.18611.943
329.1257.47559.0255.8756.51233.975
129.1144.25050.1648.1293.52015.014
2019230.0009.25666.9788.4114.98016.167
331.57510.42567.7755.6256.36143.925
130.2544.36252.5088.6853.04415.738
2021231.0409.50068.2908.1906.50815.820
332.47510.97568.0505.8755.45543.825
The bolds indicate the best average values across the clusters.
Table 2. Rankings of EU countries in terms of selected aspects of the silver economy in 2009–2021. Source: own elaboration on the basis of the Eurostat data.
Countries2009201020112012201320142015201620172018201920202021
Belgium26252626232423242323222425
Bulgaria18192019161715141413131313
Czechia14131313131313121111111112
Denmark8776555567886
Germany13119101098899101010
Estonia4532111111111
Ireland5667443333333
Greece17171925262727252525232321
Spain21232323252525222424242224
France25262422222119192022212123
Croatia12151415212322262626262626
Italy22212120201918171716171918
Cyprus222471111101010998
Latvia79109886776454
Lithuania1114121212129655645
Luxembourg19201818192024272727272722
Hungary27272727272626212221201615
Malta24222221181616181918151414
The Netherlands9888967988777
Austria16161614141514151615192019
Poland20181716151817161517181716
Portugal11112344445611
Romania34556712131314141827
Slovenia10101517171420232120252520
Slovakia23242524242221201819161517
Finland1512111111101011121212129
Sweden6343322222222
The underlinings indicate the countries with the worst positions; The bolds indicate the countries with the best positions.
Table 3. Consistency of EU country rankings in individual years. Source: own elaboration on the basis of the Eurostat data.
200920102011201220132014201520162017201820192020
20100.9791
20110.9650.9821
20120.9290.9490.9801
20130.8750.9110.9370.9711
20140.8340.8790.8960.9370.9791
20150.7670.8080.8460.9000.9550.9671
20160.7090.7460.7890.8410.9030.9100.9691
20170.7230.7590.7920.8410.9050.9150.9680.9931
20180.7230.7580.7850.8310.8980.9130.9650.9880.9951
20190.6690.7020.7360.7800.8510.8660.9370.9700.9740.9761
20200.6040.6340.6750.7170.7870.8090.8930.9490.9510.9540.9841
20210.5350.5800.6150.6430.7190.7490.8300.8710.8740.8890.9020.941
Disclaimer/Publisher’s Note: The statements, opinions and data contained in all publications are solely those of the individual author(s) and contributor(s) and not of MDPI and/or the editor(s). MDPI and/or the editor(s) disclaim responsibility for any injury to people or property resulting from any ideas, methods, instructions or products referred to in the content.

