Abstract
Carbon emissions have negative effects on the climate regardless of the location they are generated, and several strategies were introduced to meet the Sustainable Development Goals, precisely, Goal 13 “Take urgent action to combat climate change and its impacts”. Recently, to tackle the so-called carbon leakage, the European Union (EU) introduced the Carbon Border Adjustment Mechanism (CBAM), which is a crucial instrument to establish a fair price for the carbon emissions during the production of certain carbon-intensive goods, including fertilizers. The objective of this study is to assess the efficacy of the CBAM in addressing carbon leakage within the EU by evaluating the virtual carbon emission flows to the EU in the timespan 2019–2023, focusing on the top ten primary exporters of fertilizers. The assessment is based on the comparison of the world weighted average (WWA) emission factor and the country-specific one, to identify a more suitable method for measuring carbon emission flows. Results highlighted the opportunity of treating countries individually, rather than employing WWA emission factors. Emissions could be minimized by reducing production levels in countries with lax environmental policies, but this could penalize third-party economies. Sustainable development can be achieved by introducing fair environmental policies, maintaining constant production levels, economically compensating production economies, and exporting skills and know-how.
1. Introduction
The increase in anthropogenic greenhouse gas (GHG) emissions into the atmosphere, resulting from the combustion of fossil fuels, unsustainable energy and land use, and incorrect consumption and production patterns, is responsible for the present global warming and subsequent climate change on the planet. The last report of the Intergovernmental Panel on Climate Change asserts that the temperature has increased by 1.1 °C above pre-industrial levels [1]. This phenomenon has numerous consequences, including severe weather events (such as floods, droughts, and storms), melting glaciers, and rising sea levels, particularly in regions that are highly vulnerable to climate change, where more than 3 billion individuals reside, frequently prompting mass migrations [2]. To ensure a sustainable future for the next generation and to meet the Sustainable Development Goals (SDGs) introduced by the United Nations [3], several actions should be implemented. Goal 13 “Take urgent action to combat climate change and its impacts” and its target 13.2 “Integrate climate change measures into national policies, strategies and planning” highlight the need to estimate GHG emissions at the single country level and introduce long-term strategies and national adaptation plans to reduce carbon emissions and pursue sustainable consumption and production patterns [4]. To achieve the SDGs, climate solutions must be scaled up in critical international trade markets [5], such as fertilizers [6,7].
To tackle climate change, different worldwide agreements and actions have been implemented in the last years. The Kyoto Protocol, which was adopted in 1997 at the Conference of the Parties (COP) in Japan, represents a significant milestone in the international community’s efforts to reduce GHG emissions by 5.75% compared to 1990 levels during the period 2008–2012. It was amended in December 2012 at the COP in Qatar, which established a new goal of at least 18% below 1990 levels in the eight-year period from 2013 to 2020 [8]. Over time, the number of signatories grew from 84 to over 190, encompassing both industrialized nations and economies in transition. However, due to its apparent weaknesses (i.e., not compulsory restrictions for many major polluting countries or targets set considered too low to limit global warming), it was replaced by the Paris Agreement in 2015 signed at the COP in France. It intensified worldwide efforts by keeping “a global temperature increases well below 2 °C above pre-industrial levels, and to pursue efforts to limit the temperature increase to 1.5 °C” [9].
A key component that has distinguished climate change mitigation measures over time is the flexible market mechanism of the “Emission Trading System (ETS)” or “Cap-and-Trade (CAT)”. The initiative was established pursuant to article no. 17 of the Kyoto Protocol, with the objective of enabling countries that possess excess emission units—emissions that have been permitted but not utilized—to sell this excess capacity to countries that exceed their targets [2]. From then on, the number of ETSs in force at regional, national, and subnational levels has gradually increased from 13 systems in 2013 to 28 in 2023, differing substantially in their approach to regulating emissions [10,11]. Specifically, the ETS of the European Union (EU) is the oldest and one of the largest emissions systems, being established with the Directive 2003/87/EC and launched in 2005. It is considered the leading cap-and-trade programme globally. The EU determines a total emissions “cap”, lower every year, and distributes relative allowances to the most energy-consuming companies (power plants, manufacturing, and aircraft sectors), which can “trade” them if not used, accounting for 44% of global carbon profits in 2022 [12,13]. This mechanism has undergone various phases; currently it is in the fourth one (2021–2030), which was reformed in 2023 for incorporating GHG emissions from transportation, buildings, and some small industries, and for aligning with the European Green Deal target. As a result, it has established a new emission reduction goal of 62% by 2030 compared to the baseline year 2005 [14]. This reform is also focused on limiting the “carbon leakage” effect (drawback of this mechanism), primarily due to the transfer of production activities to other countries, with weak mitigation climate policies, by certain energy-intensive industries, and to the substitution of EU goods by more carbon-intensive imports. Consequently, the increase of total GHG emissions in both nations occurs, invalidating the corresponding efforts to mitigate them [15]. To avoid this phenomenon, free allocation of ETS allowances has been provided over time with different models to determine the amount [16]. However, 100% of benchmarked emissions have been allocated for those sectors deemed at significant risk of carbon leakage [17].
As of 2026, free allocation will gradually be phased out due to the introduction of a new measure, the Carbon Border Adjustment Mechanism. It was issued on 1 October 2023, with the EU Regulation 2023/956, and is now in a transitional phase until 2025. This novel environmental policy instrument, commonly referred to as the “carbon tax”, is implemented in sectors such as cement, iron and steel, aluminium, fertilizers, electricity, and hydrogen production, with the objective of reducing emissions by more than 50% in the sectors covered by the ETS. The EU proposed this measure to guarantee equitable conditions in the market regarding the quantity of emissions resulting from products and services. This tax ought to restrict the importation of products that fail to meet specified environmental standards and is calculated based on the quantity of CO2eq released during the production of imported goods, with the aim of incentivizing foreign manufacturers to decrease their emissions [18]. To achieve this aim, it is imperative that companies calculate the carbon footprint (CF) of their imported products within the EU and procure the CBAM certificates that correspond to the quantity of emissions contained within the imported products. They should then proceed to optimize their supply chains, invest in cleaner technologies, or adopt more sustainable practices to reduce their CF. This concern extends to the agricultural sector, wherein existing studies indicate a significant potential for carbon leakage [19]. The EU CBAM will have a significant impact on the agri-food supply chain through its interventions on the international fertilizer trade. Many countries require these goods to improve soil fertility and increase crop productivity. During the 20th century, they were responsible for an increase of up to 50% in agricultural yields, and about 40% of the global population was consuming food produced using synthetic fertilizers [19,20].
Based on the recent literature [21,22,23,24,25,26], the CBAM was mainly analysed in terms of economic feasibility and to examine the implications of its implementation on global markets, specifically with regards to China, Russia, and other emerging economies. Several researchers attempted to shed light on its mechanisms to determine the carbon tax and the financial costs for importing and exporting products or services, with particular emphasis on iron, steel, and aluminium products, and fertilizers (Section 2). However, according to the authors’ opinion, there is still room for further investigation into the environmental dynamics behind the CBAM, since the assessment of the carbon emission associated with products or services imported into the EU is essential for determining the correct carbon tax. In its transitional phase, the calculation method proposed by the CBAM requires countries to determine the carbon emissions based on a world weighted average (WWA) emission factor. However, many states have country-specific (CS) emission factors that are higher or lower than the global average. China’s CS emission factors in the field of fertilizers are higher than the WWA ones, and the adoption of the current CBAM method leads to an underestimation of its carbon emissions. For Russia, Egypt, and Trinidad and Tobago, the CS factors are lower than the WWA ones, resulting in an overestimation of the emission levels. Therefore, the use of the WWA instead of the CS emission factors could lead to market distortions from an economic and environmental perspective.
In this perspective, the purpose of this research is to evaluate the functioning of the CBAM in the international fertilizer trade, through the assessment (and the comparison) of the virtual carbon emission flows in the EU in the timespan 2019–2023. This research focuses on the top ten main exporters of fertilizers to the EU, with an emphasis on Russia, Egypt, Trinidad and Tobago, and China. The novelty of this research depends on several factors: (i) based on the current state-of-the-art (Section 2), it represents one of the first academic articles that tests the functioning of the CBAM to the international fertilizer trade through a direct calculation of carbon emissions associated with fertilizer trade (Section 3); (ii) it discusses challenges and opportunities associated with implementing the CBAM at the EU level, both from a theoretical and empirical perspective, and examines the difference between the application of the WWA and the CS emission factors for the evaluation of the carbon flows (Section 4); and (iii) it increases the studies on carbon leakage in the fertilizer industry at the global scale. The findings should be useful to EU policymakers to implement better strategies and actions for ensuring the carbon neutrality target in the international fertilizer trade, according to the CBAM approach.
2. Literature Review
The CBAM is a cross-border environmental regulation aimed at addressing climate change and the environmental challenge of carbon leakage in international trade. The objective is to impose taxes on energy-intensive imports from countries with lax environmental regulations, specifically on six carbon-intensive commodities such as iron and steel, cement, fertilizers, aluminium, hydrogen, and electricity production [21,22].
In the literature, the CBAM was mainly analysed from an economic standpoint, with an emphasis on international trade and the shock dynamics that the introduction of this EU regulation may have on international trade. Several studies examine the significance of the CBAM in safeguarding fair competition in the EU’s emission-intensive industries [22]. Others discuss the impacts of the CBAM on the China–EU trade with regards to aluminium and steel products [23], and on the Russia–EU economy with reference to iron and steel and fertilizers [24]. Last, Gergonder [25] investigated the effects of the CBAM on the Africa–EU trade. Regarding payments, it is expected that Russia, Uzbekistan, Georgia, Tajikistan, and Belarus will be responsible for the largest CBAM payments commencing in 2026 [26].
Considering the potential implications of the CBAM, Shidiq et al. [27] indicated that the implementation of this environmental regulation may result in higher production costs for the targeted industries, since they should account for their carbon footprints. However, although there is a higher production cost (due to investments, adaptation to technological innovation, and additional fees), stakeholders expect a reduction in the carbon emissions. Based on the analysis of the ASEAN’s carbon-intensive businesses, Shidiq et al. [27] conducted a survey to evaluate the readiness of companies in implementing sustainable solutions to meet the CBAM requirements, and their expectations in terms of costs and environmental benefits. Stakeholders trust in the role of the CBAM to reduce emissions and think that it can be a tool to achieve zero-net emissions. Lin and Zhao [7] carried out an assessment of the embodied carbon flows in the energy-intensive trade-exposed industries at the global scale, with the purpose of identifying priority sectors for emission reductions. Among different industries, the production of potassium and phosphorus fertilizers belongs to the category “priority sector”, whereas nitrogen fertilizers are included in the “non-critical sector” category. In terms of countries, Russia, the United States, the United Kingdom, and China represent the primary providers for energy-intensive commodities, also considering that Russia and China still rely on carbon-intensive fuels such as coal.
From an environmental impact assessment perspective, some solutions should be adopted before the end of the transitional phase of the CBAM, namely: (i) the improvement of data emission inventories, and a harmonization of data to ensure accountability and transparency; and (ii) the development of standardized emissions calculation, for guaranteeing a uniform measurement and an effective evaluation of the effects of the CBAM [27]. Similar results were obtained by Sudakov [26] that highlighted the need by Eurasian countries to adopt a transparent system for collecting and publishing high-quality and detailed information on embedded emissions of different products. Precisely, the authors underline that “country-specific data on embedded emissions of certain goods (CO2eq per tonne of food produced) is not always available or published”. This means that countries should make several efforts to enhance country-specific (case) studies to gather country-specific data. The same limitations were discussed by Wenmei and Mou [28]. In China, although it is the second-largest commodity exporter, there are still no official statistical data on carbon emissions. de Boer et al. [29] complains that previous studies on the CBAM focus on its CO2eq effective impacts rather than its CO2eq potential reduction. Moreover, it underlines that there are still some challenges in the assessment of the carbon emissions, when accounting for Scope 1, Scope 2, and Scope 3. Carbon emission factors are fixed for a certain period, and it is difficult to reflect the dynamic characteristics of direct and indirect emissions across different countries or local areas (e.g., regions) [30]. Moreover, using uniform carbon emission factors in a region is more likely to provide not accurate and not fair measures of the indirect carbon emissions from the user’s perspective, and therefore case-specific emission factors should be preferred, since they are more likely to capture the temporal and spatial characteristics of each area [30].
3. Materials and Methods
The purpose of this research is to evaluate the functioning of the CBAM to tackle carbon leakage in the international fertilizer trade, through the assessment (and the comparison) of the virtual carbon emission flows in the EU in the timespan 2019–2023. This research focuses on the top ten main exporters of fertilizers to the EU, with an emphasis on Russia, Egypt, Trinidad and Tobago, and China. To achieve this objective, this study is based on a stepwise approach, as follows: (i) initially, the authors quantified the flows of fertilizers (in material terms) according to a mass balance approach, on European Commission data (Section 3.1); and (ii) subsequently, by distinguishing among WWA and CS emission factors, as outlined by the CBAM, this research estimated the virtual flows of carbon emissions from foreign countries into the EU, and vice versa (Section 3.2).
3.1. Mass-Balance Approach
This research adapts the definition of virtual flows as outlined by Lamastra et al. [31], namely, the amount of carbon emissions embodied in imported and exported products (specifically, fertilizers) from a country to another country. Equation (1) identifies the formula for measuring the amount of virtual carbon flows (VCFs) associated with fertilizers:
where TFs = trade flows of fertilizers and CEs = carbon emissions of fertilizers.
The concept of VCFs takes into account two main variables, namely, the quantity of fertilizers flowing from one country to another (i.e., TFs, expressed in t), and the environmental impacts (i.e., CEs, expressed in tCO2eq), expressed in CO2eq, associated with their production (according to a country-specific carbon footprint).
Data related to “trade flows fertilizers” (Equation (1)) are retrieved from the European Commission [32], from the database “Fertilizer trade” developed by the Directorate-General for Agriculture and Rural Development. Precisely, this research focuses on mineral fertilizers, which are divided into three groups, namely, nitrogen (N), phosphorus (P), and potassium (K). In the Technical Report developed by the Joint Research Centre of the European Commission [33], five main fertilizer products were accounted, which represent 85% of the EU total mineral fertilizer production and use, as follows: (i) ammonia, anhydrous or in aqueous solution (23.5%); (ii) fertilizers, mineral or chemical, nitrogenous (54.9%); (iii) nitric acid, sulphonitric acids (0.1%); (iv) nitrates of potassium (3%); (v) mineral or chemical fertilizers containing two or three of the fertilizing elements NPK (16%). In the context of the countries under scope, about ten countries represent about 80% of the imports of fertilizers in EU [18], namely, Russia (37.7%), Egypt (10.3%), Morocco (6.1%), Belarus (5.9%), Trinidad and Tobago (5.4%), Norway (4.4%), Ukraine (3.1%), United Kingdom (2.6%), United States (1.9%), Serbia (1.5%), and China (1.3%).
In the present research, the collection of data pertaining to “trade flows fertilizers” encompasses a five-year period, spanning from 2019 to 2023, and covers the following types of fertilizers: (i) ammonia (CN code: 2814); (ii) urea (CN code 3102 10), (iii) urea ammonium nitrate (3102 80 00), and (iv) NPK 15-15-15 (CN code 3105 20). Specifically, this research considers the top-three importers for the four types of fertilizers in the timespan (2019–2023), namely, Russia, Egypt, and Trinidad and Tobago that together cover about 70% of the entire fertilizer trade to the EU. Moreover, this research dedicates a focus on China, since it presents the highest direct and indirect emission factors and a negative net fertilizer balance trade (Section 4.2).
3.2. Carbon Emission Values for CBAM Fertilizers
The CBAM estimates the carbon footprint (also defined “GHG footprint”) associated with “complex goods”, among which fertilizers are accounted for, and it also considers the emissions of precursors according to a lifecycle approach. Figure 1 illustrates the system boundaries for the carbon footprint evaluated by the CBAM, which is rather different compared to the product carbon footprint (ISO 14064).
Figure 1.
System boundaries for the carbon footprint evaluated by the CBAM. Source: personal elaboration by the authors.
The transitional CBAM considers “world average values” for carbon emissions (expressed in CO2eq per t of good), weighted by production volumes, and the default values apply independently of the country of origin until the end of the transitional period on 31 December 2025 [21,34,35]. Precisely, default value distinguishes between direct and indirect emissions, defined as follows: (i) “direct emissions” are “direct CO2eq emissions (plus nitrous oxide emissions from some fertilizer goods) embedded during production of goods being imported to the EU, at installation or production site level”; and (ii) “indirect emissions” are “emissions embedded in the goods as a result of activities involved other than physical production (e.g., electricity, heating/cooling)” [36].
Table 1 identifies the “carbon emissions fertilizer” distinguishing between direct and indirect emissions per import country.
Table 1.
“Carbon emissions fertilizer” values according to the CBAM in kgCO2eq per kg of fertilizer.
4. Results
4.1. Fertilizer Trade Flows
The total amount of fertilizer trade imported to the EU from foreign countries is about 21,678,331 t in 2023, whereas the highest peak in the last five years was registered in 2019, with about 26,767,111 t. On the export side, its amount was 9,944,451 t in 2023 and the highest peak in 2021 (12,875,435 t) [32].
Table 2 presents the top ten importers from foreign countries to the EU, plus China. It is important to distinguish between the total imports before and after the start of the Russia–Ukraine conflict in 2021. Prior to the onset of the conflict in 2021, the top ten nations accounted for approximately 36% of the total imports, with Russia occupying the lead position with approximately 16%. In 2023, Russia declined to the fourth place of the top ten (1.19%), soon after Egypt (11.18%), United States (4.82%), and Trinidad and Tobago (3.54%). In terms of China, it covered less than 0.01% of the total imports in 2019, but its rate increased up to 0.46% in 2023.
Table 2.
Fertilizer trade flows (t) from the top ten countries to the EU in the timespan 2019–2023, plus China.
Table 3 illustrates the top-three importers over the timespan 2019–2023, namely, Russia, Egypt, and Trinidad and Tobago, whereas in the category “Others” it includes Belarus, USA, Norway, Ukraine, UK, Morocco, and Serbia (Appendix A illustrate the detailed values in each country). Specifically, it focuses on the four most traded fertilizers, such as ammonia, urea, urea ammonium nitrate, and NPK fertilizers. In terms of ammonia, the leading importer to the EU was Trinidad and Tobago (495,049 t), whereas in terms of urea, the top importer was Egypt (2,216,258 t). As concerns urea ammonium nitrate, Russia was the leading importer, as well as for NPK fertilizers (561,723 t and 537,366 t, respectively). However, before the start of the Russia–Ukraine conflict, Russia was the leading importer for all four fertilizers. It means that, after the beginning of the conflict, the international trade changed in favour of Egypt, and Trinidad and Tobago.
Table 3.
Fertilizer trade flows (t) from the top three importers to the EU in the timespan 2019–2023.
4.2. Fertilizer Virtual Carbon Flows
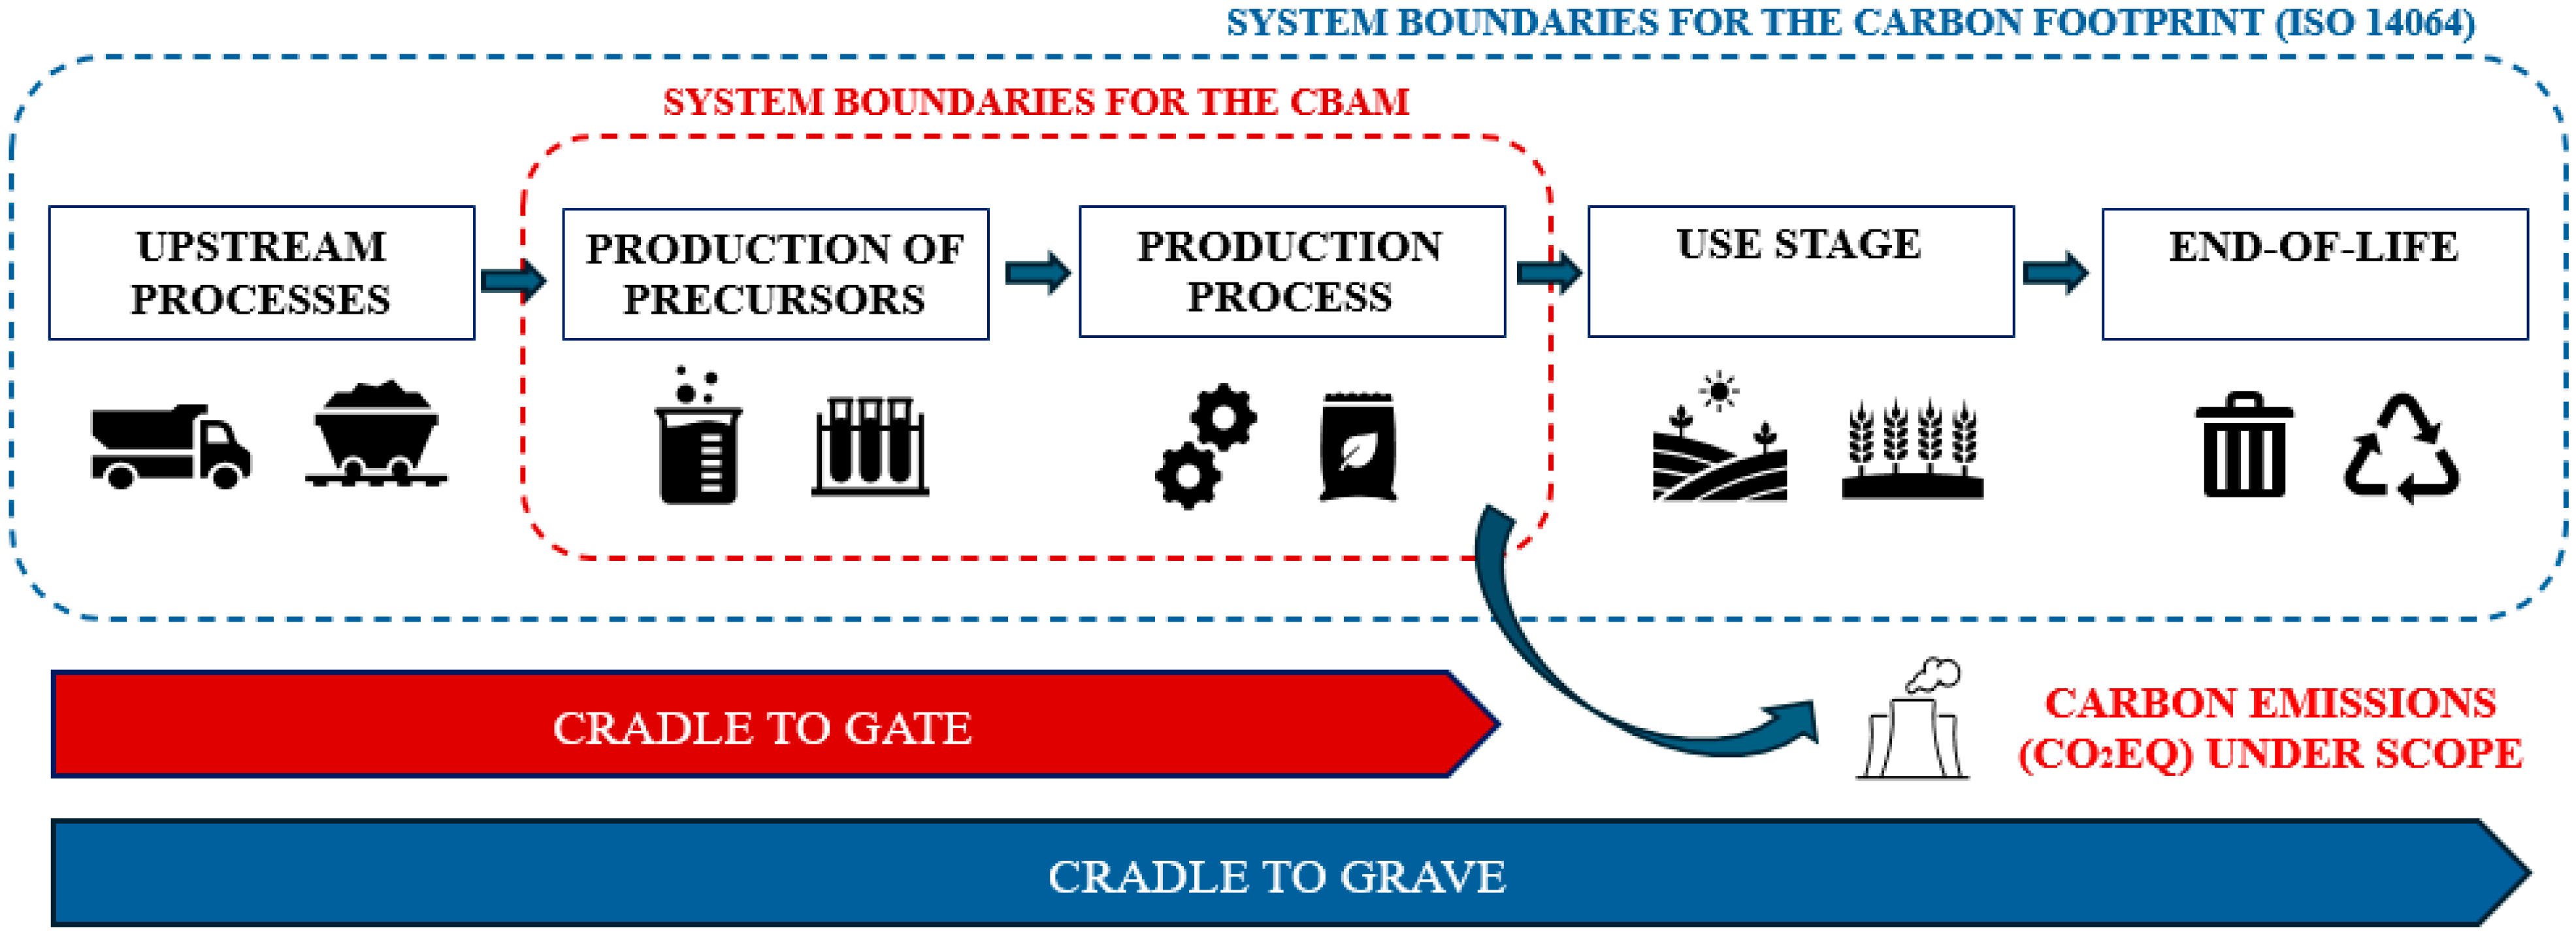
The analysis of virtual carbon flows is essential to understand how carbon emissions circulate from foreign countries to the EU (and vice versa, in terms of net virtual flows). This analysis is essential to comprehend the different environmental impacts associated with the production of fertilizers in light of the carbon leakage and the CBAM, also considering that: (i) producers and consumers are located at various places in different parts of the world, and they have significant differences in virtual GHGs; and (ii) China is increasingly carrying out the load of virtual GHGs. In order to better comprehend the carbon emissions associated with fertilizer production at the global scale, the current analysis calculates the CO
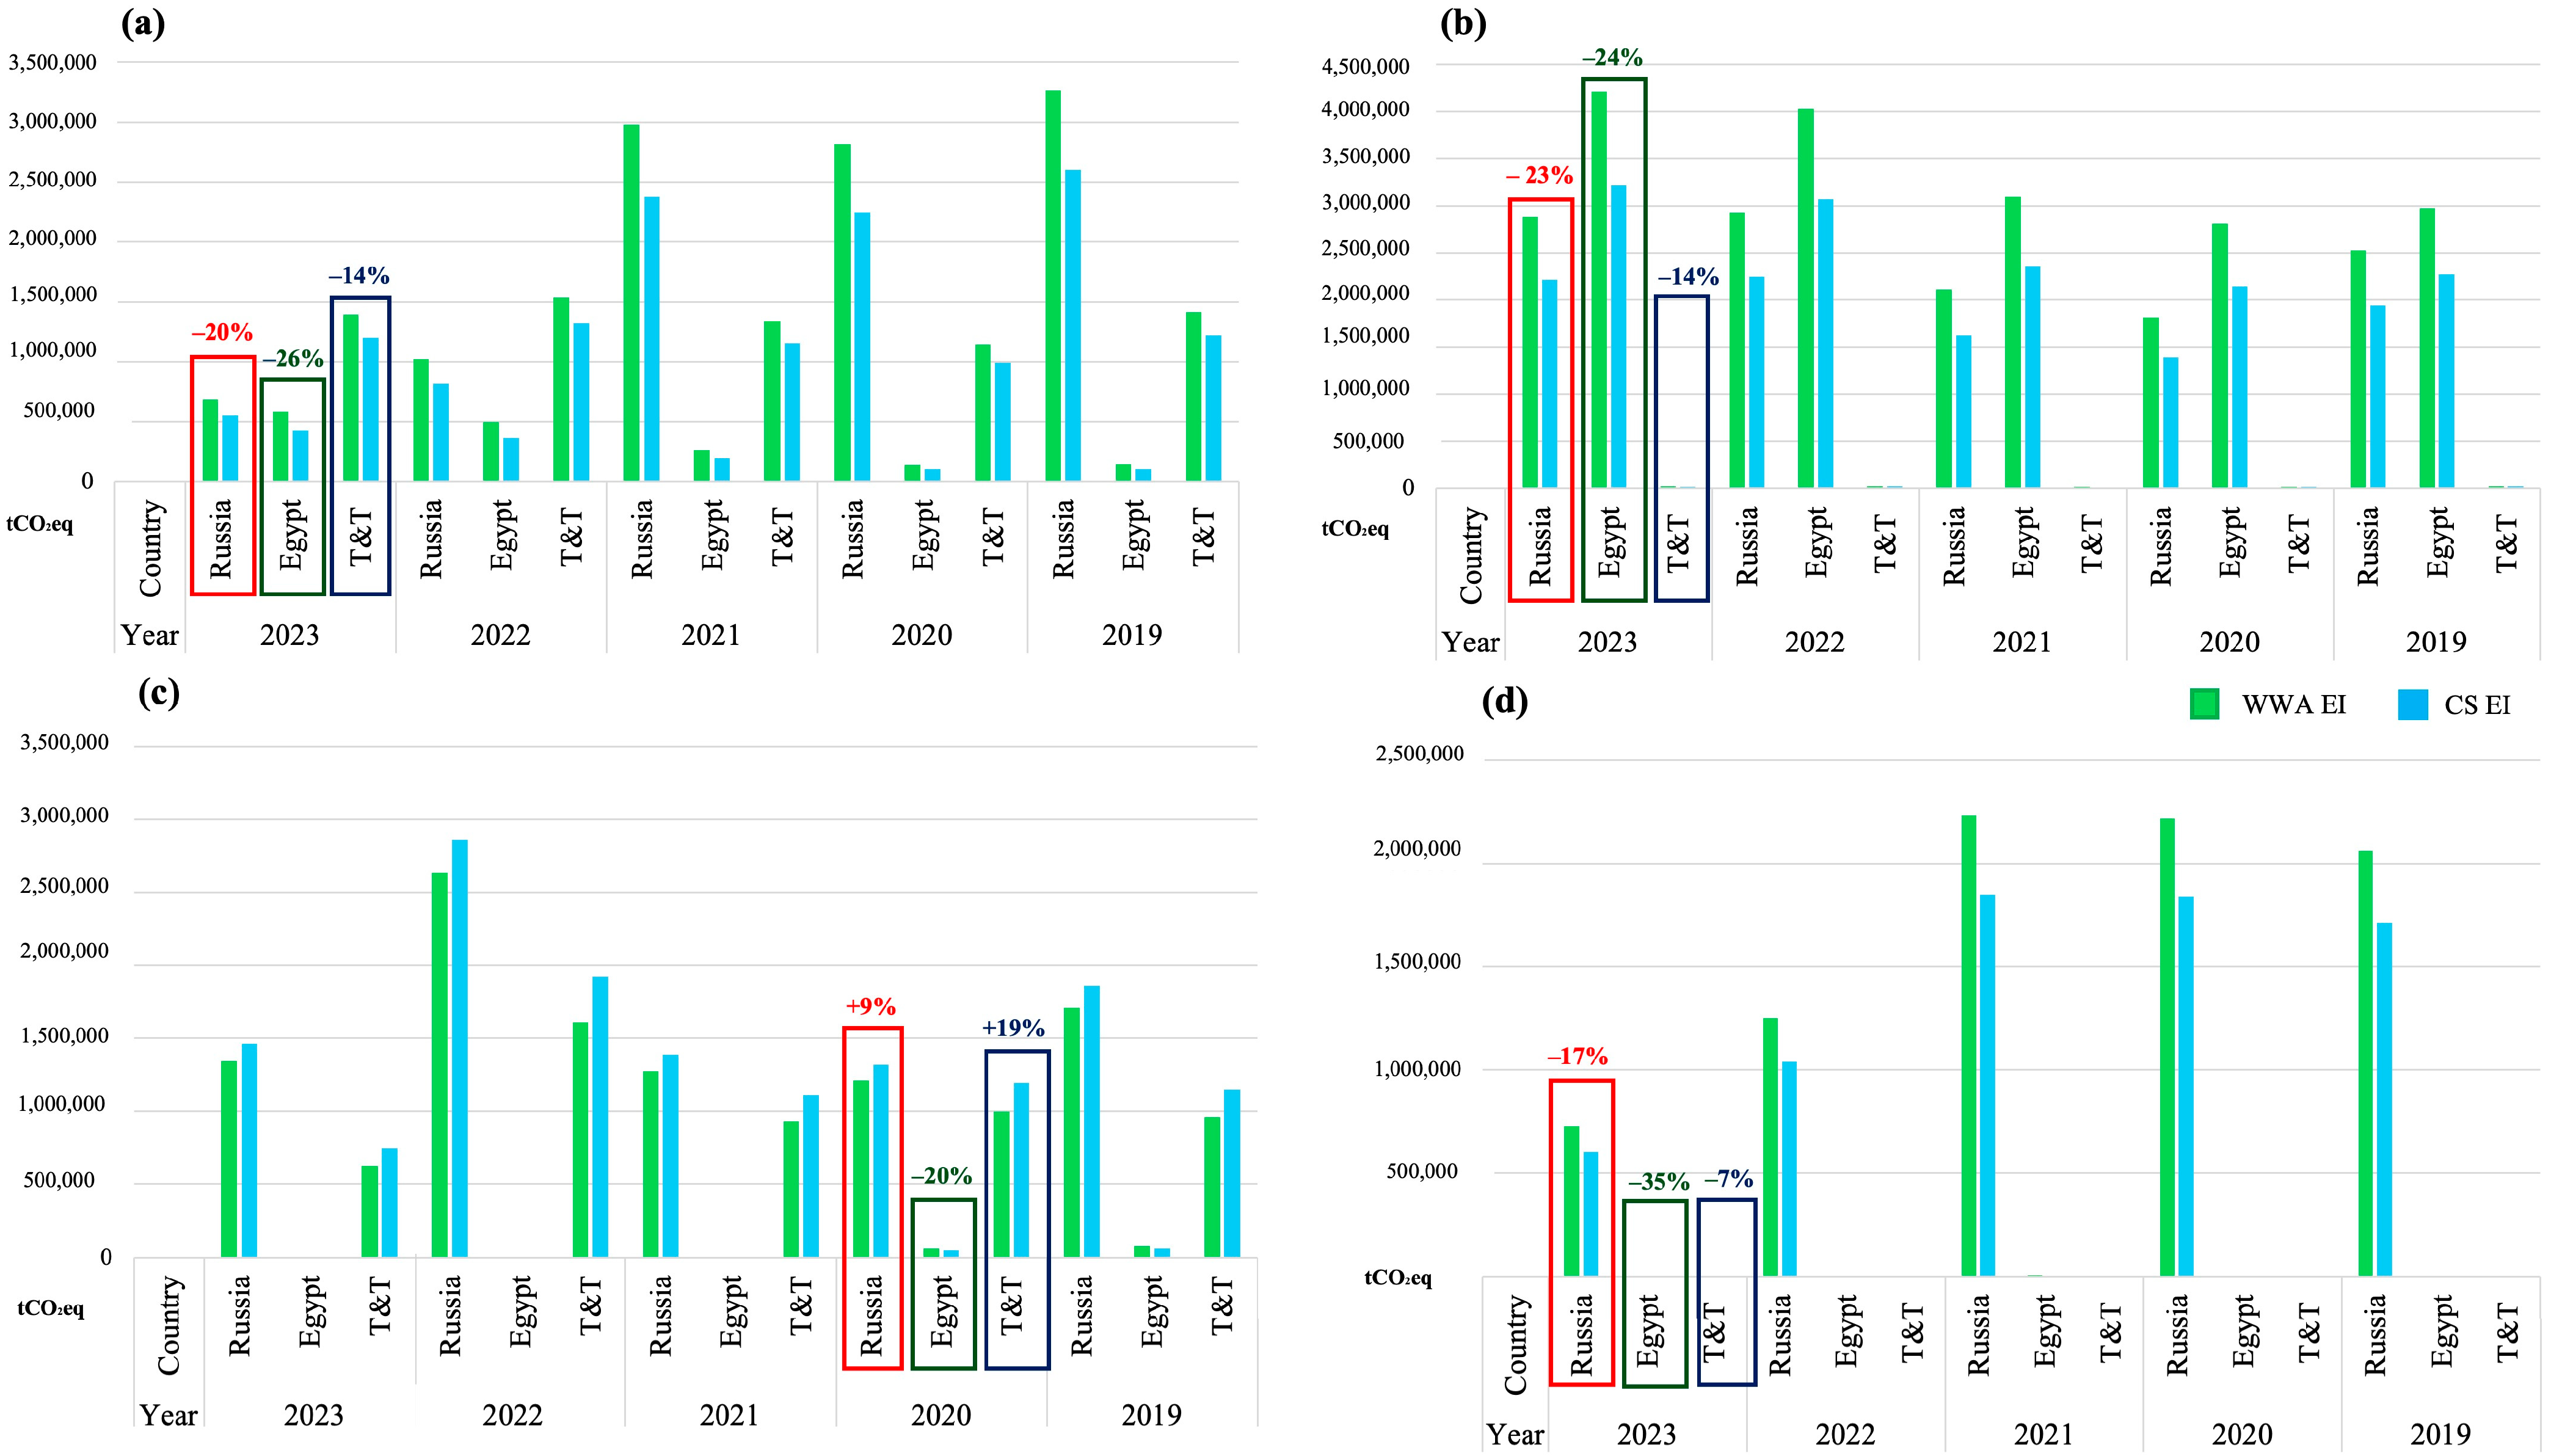
2eq emissions according to the WWA emission factors, and the CS ones (Figure 2).
Figure 2.
Carbon virtual flows (tCO2eq) distinguishing between WWA and CS emission factors in the timespan 2019–2023 for: (a) ammonia; (b) urea; (c) urea ammonium nitrate; and (d) NPK fertilizers. Notes: T&T = Trinidad and Tobago; WWA = world weighted average; CS = country-specific; EI = environmental impact.
By considering the carbon virtual flows in Russia, Egypt, and Trinidad and Tobago, four different scenarios should be considered in light of ammonia, urea, urea ammonium nitrate, and NPK fertilizers.
In the field of ammonia, the amount of carbon virtual flows estimated with the WWA emission factor is about 20%, 26%, and 14% higher compared to the CS emission factor of Russia, Egypt, and Trinidad and Tobago, respectively. It means that the application of the CS emission factor compared to the WWA one would provide different values, as follows (year = 2023): (i) in Russia, WWA = 689,995 tCO2eq > CS = 550,528 tCO2eq; (ii) in Egypt, WWA = 583,737 tCO2eq > CS = 430,558 tCO2eq; (iii) in Trinidad and Tobago, WWA = 1,396,038 tCO2eq > CS = 1,202,969 tCO2eq.
In the field of urea, the application of the WWA emission factor provides results that are 23%, 24%, and 14% higher compared to the application of the CS emission factor. On the contrary, when considering urea ammonium nitrate, it results that the WWA emission factor creates a bias in the opposite direction, at least as regards Russia and Trinidad and Tobago. Precisely, results calculated according to the WWA emission factor are 9% and 19% lower compared to results estimated through the CS emission factor. Last, the highest differences between WWA and CS emission factors are calculated for NPK fertilizers, as follows: (i) in Russia, WWA = 725,444 tCO2eq > CS = 601,850 tCO2eq (+17%); (ii) in Egypt, WWA = 1262 tCO2eq > CS = 823 tCO2eq (+35%); and (iii) in Trinidad and Tobago, WWA = 2483 tCO2eq > CS = 2299 tCO2eq.
Table 4 presents the CO2eq emissions according to the WWA emission factors, and CS emissions factors for Belarus, USA, Norway, Ukraine, UK, Morocco, and Serbia. When comparing WWA with CS results, it turns out that the WWA values are penalizing, with significant impacts on the assessment of the CO2eq emissions associated with the production of urea ammonium nitrate and NPK fertilizers in Norway and the United Kingdom. Among others, it results that: (i) the CO2eq emissions calculated with the WWA for the NPK fertilizers in the United Kingdom are 170% higher compared to those assessed with the CS emission factor; (ii) the CO2eq emissions calculated with the WWA for the urea ammonium nitrate in the United Kingdom are 125% higher compared to those assessed with the CS emission factor; and (iii) the CO2eq emissions calculated with the WWA for the NPK fertilizers in Norway are 121% higher compared to those assessed with the CS emission factor. Moreover, several other significant results could be highlighted, for instance, for the production of NPK fertilizers in the USA, the assessment of the CO2eq emissions by using the WWA is 71% compared to the assessment by using the CS emission factors. On the contrary, no particular differences are found between WWA and CS factors in Serbia or Ukraine, where sometimes the CS values are higher than the WWA ones.
Table 4.
Ammonia, urea, urea ammonium nitrate, and NPK fertilizers carbon virtual flows (tCO2eq) in Morocco, Belarus, Norway, Ukraine, UK, USA, and Serbia.
China represents a separate case, since its CS emission factors are much higher than the WWA ones, and this compromises the environmental impact assessments associated with fertilizer production within its boundaries. Table 5 illustrates the virtual carbon flows from China to the EU for ammonia, urea, urea ammonium nitrate (even if its trade from China to the EU is rather null), and NPK fertilizers distinguishing between WWA and CS emission factors. The comparison is based on the WWA as a reference value. Considering 2023 as a reference year, it results that: (i) for ammonia, WWA = 798 tCO2eq < CS = 1098 tCO2eq (−37%); (ii) for urea, WWA = 256,433 tCO2eq < CS = 291,939 tCO2eq (−13%); and (iii) for the NPK fertilizers, WWA = 1526 tCO2eq < CS = 1616 tCO2eq (−5%). These differences, far from marginal, can compromise the mechanism for calculating virtual carbon flows within the CBAM.
Table 5.
Fertilizer carbon virtual flows (tCO2eq) from China to the EU in the timespan 2019–2023.
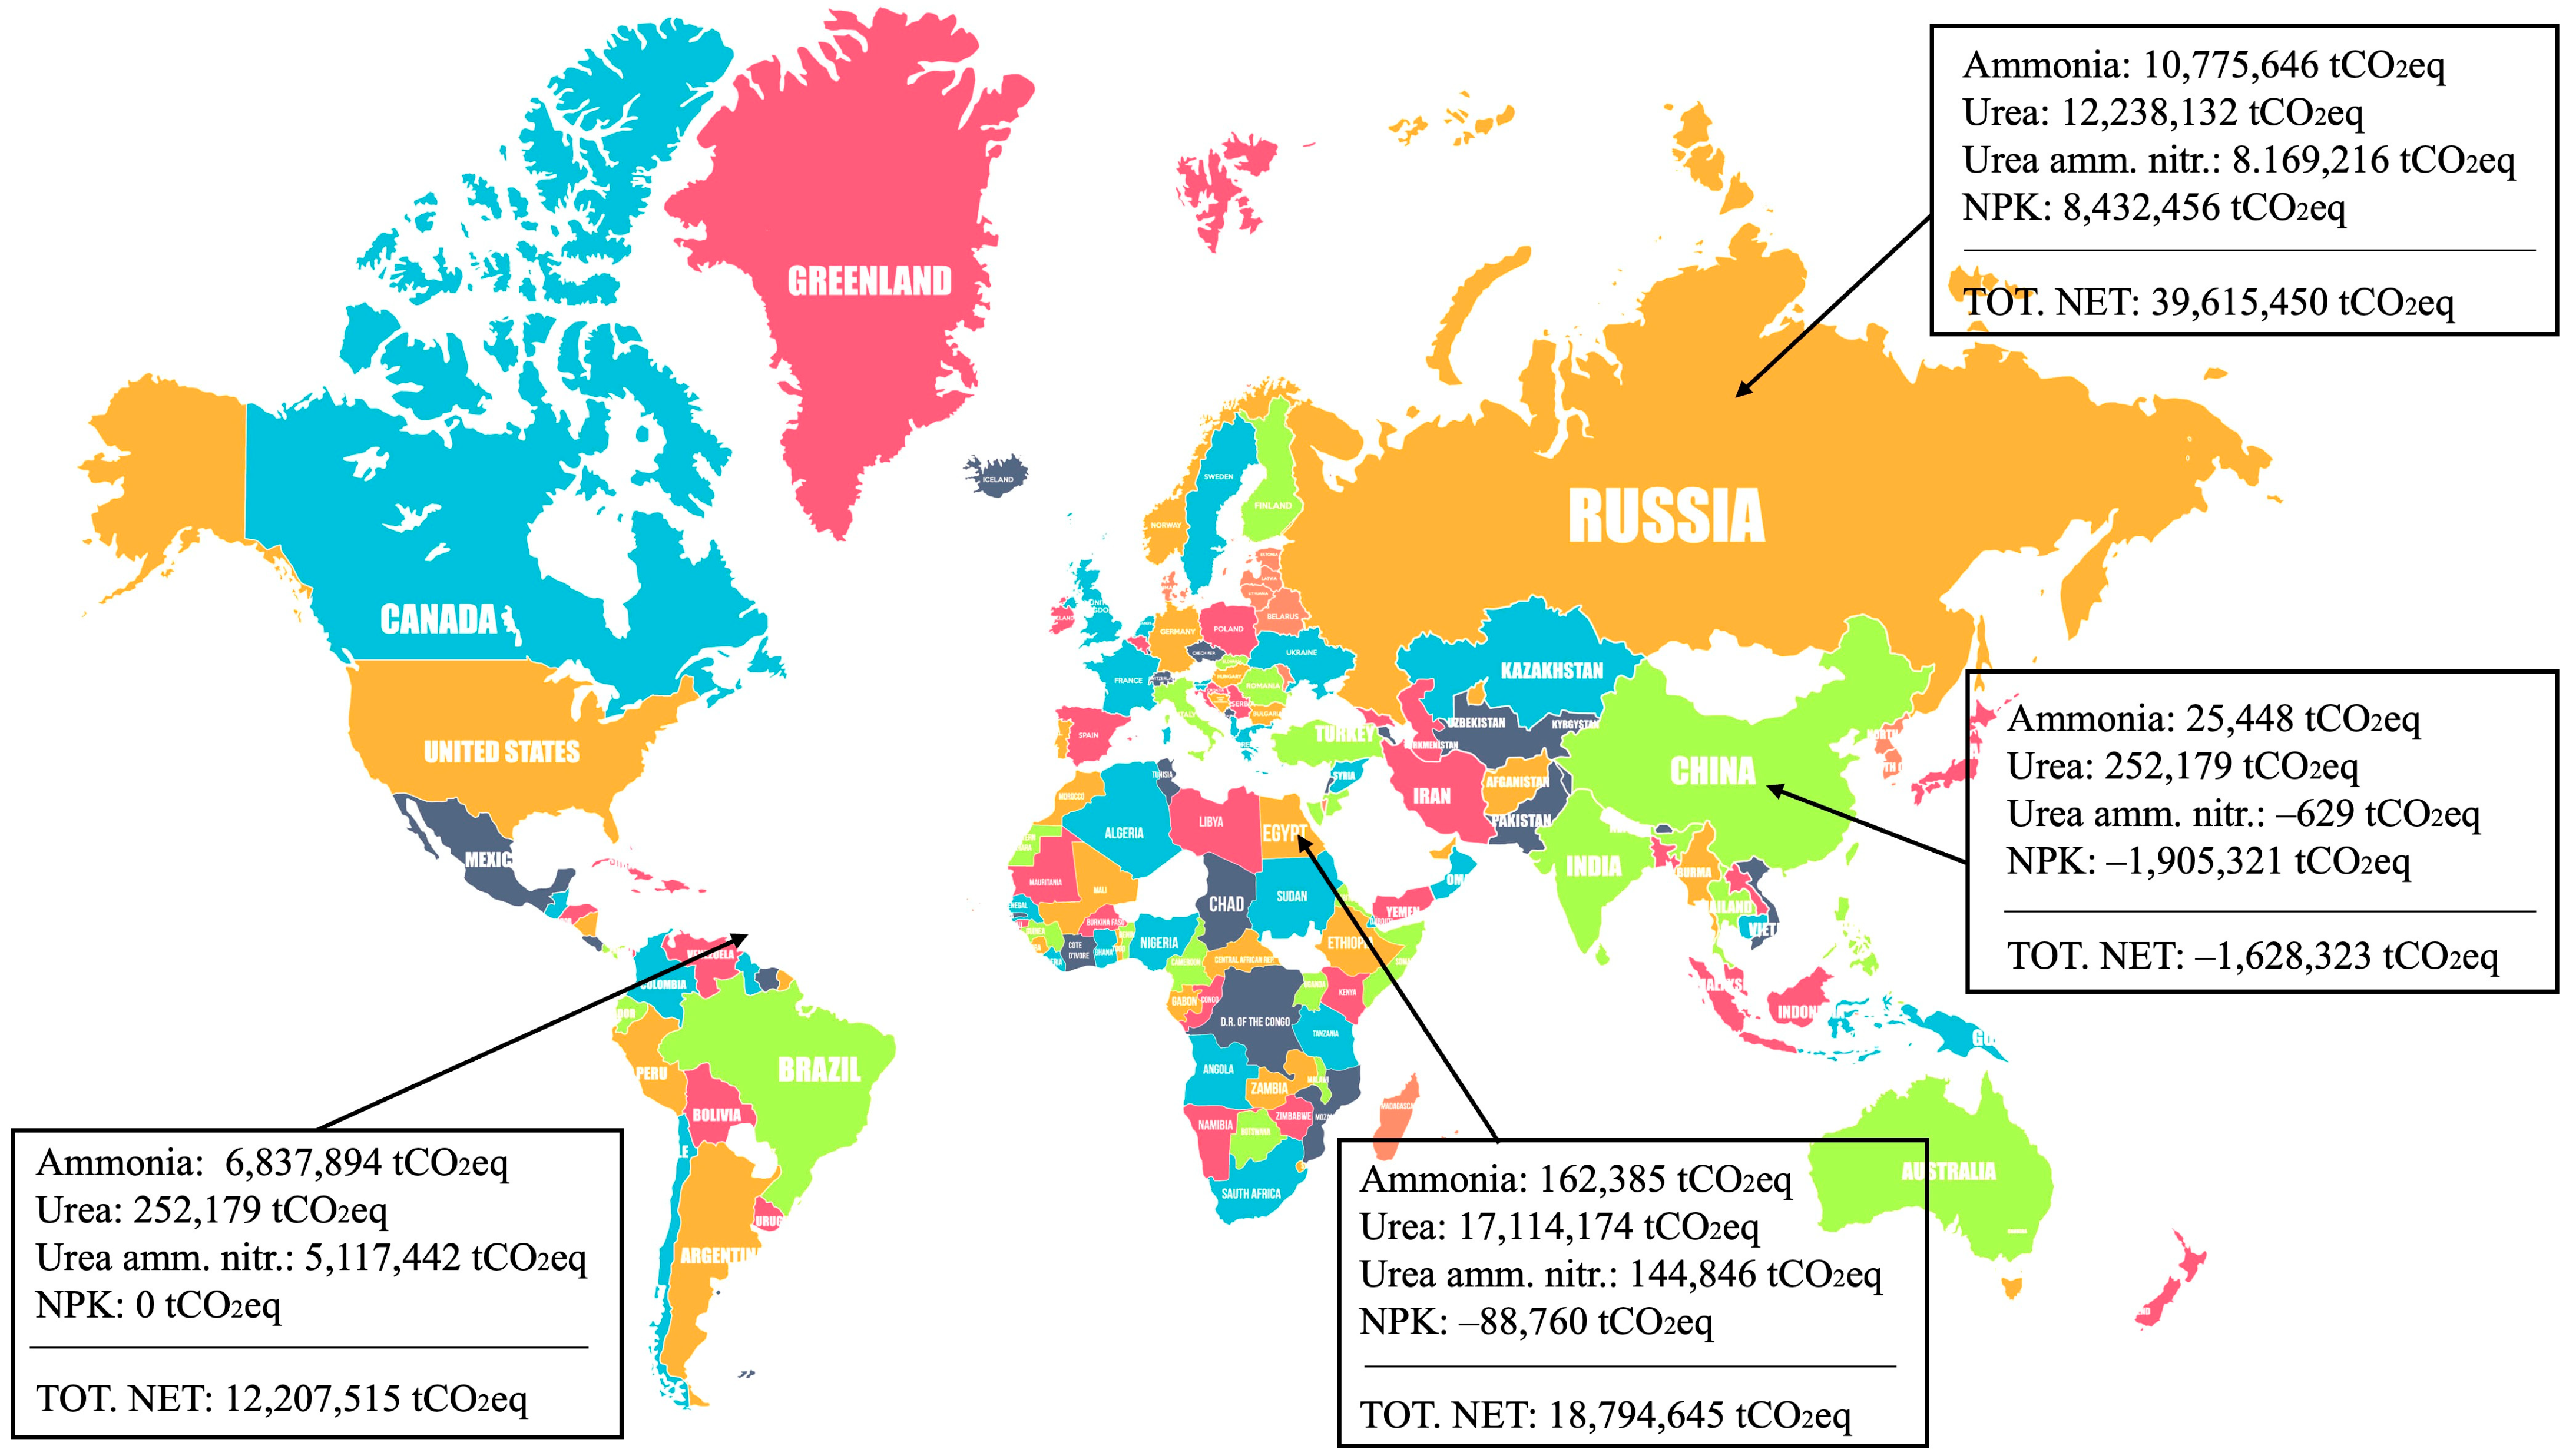
In terms of net virtual carbon flows from foreign countries to the EU, Figure 3 presents the results at an aggregate level considering the WWA emission factors in the timespan 2019–2023. Appendix B presents the net fertilizers trade (net trade = imports − exports). Overall, the balance of the net virtual carbon flows presents the vast majority of GHGs in Russia (net value = 39,615,450 tCO2eq), followed by Egypt (net value = 18,784,645 tCO2eq), and Trinidad and Tobago (net value = 12,207,515 tCO2eq). China, on the other hand, has a negative net balance, which means that emissions are higher in the EU and not in China (net value = −1,628,323 tCO2eq).
Figure 3.
Net carbon virtual flows from Russia, Egypt, Trinidad and Tobago, and China to the EU (and vice versa) in the timespan 2019–2023. Notes: net = import − export.
4.3. Some Indicators to Interpret the Carbon Leakage
The assessment of the carbon emissions associated with the production of fertilizers can provide some insights on the functioning of the CBAM. However, it takes on a worrying significance if looking at some indicators such as kgCO2eq/person or tCO2eq/km2, where the CO2eq are the net carbon emissions estimated with the WWA emission factors. These indicators could integrate the use of the CBAM and could help interpret the carbon leakage phenomenon, for a better estimation of the effects of the production of specific commodities in each country from an environmental standpoint.
In Russia, which is the largest country in the world (17,864,345 km2), and which accounts for about 145,440,000 inhabitants [37], the impacts are somehow slight, but the situation changes when coming to Trinidad and Tobago, which accounts for 1,500,000 inhabitants and less than 5120 km2. These indicators, based on 2023 as a reference year (see Appendix C), illustrate that: (i) in Russia, the carbon emissions associated with the fertilizer trade account for 38 kgCO2eq/person and 0.31 tCO2eq/km2; (ii) in Egypt, the emissions are 41 kgCO2eq/person and 4.77 tCO2eq/km2; (iii) in Trinidad and Tobago, they are 1360 kgCO2eq/person and 398 tCO2eq/km2; and (iv) in China, they are −0.13 kgCO2eq/person and −0.01 tCO2eq/km2.
However, a more significant indicator should compare the CO2eq associated with the net trade of fertilizers with the Gross Domestic Product (GDP, expressed in USD), to comprehend the weight of carbon emissions on the GDP [38]. In other words, it could help policy makers and public authorities understand how much the environmental impacts of the production of fertilizers load on the richness of a certain country. Precisely, (i) in Russia, it results in 0.003, which means that, considering one USD produced through the sale of local products, the production of fertilizers is responsible for solely 0.003 kgCO2eq; (ii) in Egypt, it is equal to 0.013; (iii) in Trinidad and Tobago, it is 0.43; and (iv) in China, −1.06 (considering its negative net trade balance and its impressive GDP, which is around USD 18 trillion).
5. Discussion
The adoption of the CBAM is currently in the testing phase (from 1 October 2023 to 31 December 2025) and will be introduced gradually. Currently, its goal is to tackle carbon leakage and attain climate neutrality by the year 2050. Therefore, it does not target single countries, but the virtual GHGs included in specific commodities, such as fertilizers.
Theoretically, countries importing the six commodities identified by the CBAM are asked to disclose the GHGs embodied in their products in accordance with pre-determined thresholds. However, as shown by the previous quantitative case, it results that the suggested default values (i.e., WWA) tend to underestimate or overestimate the actual carbon emissions associated with the production of commodities at the country level. In the case of Russia or Egypt, for instance, the WWA emission factor is rather higher compared to the CS one, meaning that the estimate of emissions associated with fertilizers produced in these countries is overestimated. This results in higher carbon costs for the importing country. The opposite is true for China, where the emission coefficient is underestimated, resulting in lower carbon expenses for the country importing from China.
The guidelines introduced by the CBAM, included in the document entitled “Default values for the transitional period of the CBAM between 1 October 2023 and 31 December 2025” [39], may raise some concerns (under the environmental standpoint) in the definition of carbon costs. In detail, the guidelines state that: “default values apply independently of the country of origin of the CBAM goods and only until the transitional period on 31 December 2023. From 2026 ongoing, another set of default values will apply”. However, although a new set of values is expected, they will still be based on an “average emission intensity of each exporting country, increased by a proportionately designed mark-up” [39]. The quantitative example (Section 4) illustrates the usefulness of treating each specific case individually, rather than using weighted averages, because each individual country has its own emission factor (i.e., carbon intensity due to technologies, energy sources, etc.) and therefore the emissions generated during the production of goods within its borders should be calculated as country-specific and not with global average values. This is especially true because these factors are the starting point for the definition of the CBAM methodology and are available [34].
Based on the previous (and very few) studies on the topic [19], the adoption of country-specific values may seem complex for importer countries. First, to obtain actual emissions embodied in traded goods (i.e., virtual carbon flows), importers should rely on qualitative and consistent data, which usually lack and exclude several countries [40]. Secondly, datasets should consider the high variability of carbon content in specific commodities, such as fertilizers. For example, the high spatial and temporal variability in N2O is due to many factors beyond individual production technologies, such as soil type, temperature, moisture, or management practices. Specifically, fertilizers do not generate carbon emissions solely during the production phase, but also during the consumption phase.
When determining carbon costs to offset emissions generated during fertilizer production, a country-specific approach should be considered instead of the global average. Furthermore, it is important to consider the environmental damage generated by individual exporting countries, such as Trinidad and Tobago, which are among the main producers and importers of fertilizers to the EU. While maintaining a constant internal production, it is certain that the kgCO2eq/person (or per tCO2eq/km2) is significantly higher in comparison to other nations. From a technology perspective, it is possible to export skills, know-how, and green technologies from countries with lower emission factors and therefore with a lower carbon intensity. From a policy perspective, it is also possible to include in the definition of carbon costs the greater damage caused to certain realities.
It is imperative for the importing countries to ensure environmental protection and economic development, in addition to compensating the exporting countries economically. Emissions can be reduced by reducing production levels in countries with lax environmental policies (but this could penalize third-party economies, such as those of Trinidad and Tobago), or by creating sustainable value through fair environmental policies, maintaining constant production levels, economically compensating production economies, and exporting skills and know-how to improve production and make it green. In fact, in the definition of carbon costs (or environmental taxes, more generally), public authorities should consider the strategic importance of some countries that have natural resources useful to produce certain commodities. Certain goods cannot be produced in “sustainable countries”, and therefore production cannot be easily transferred from one country to another. Instead, a “sustainable production” can be implemented by enhancing (and transferring) technologies and skills. In order to achieve carbon neutrality, the CBAM should consider the specific characteristics of each country, rather than treating everyone “in the same way” (to quote the rule presented by the CBAM: “default values apply independently of the country of origin of the CBAM goods”).
6. Conclusions
Climate change is a worldwide challenge, and several policies and environmental regulations have been introduced to address the so-called carbon leakage in international trade. The present study examined the functioning of the CBAM in the domain of fertilizer production and trade, with regards to the evaluation of virtual carbon emission flows in the EU from 2019 to 2023. It compared the CBAM of the production and trade of fertilizers with the emissions assessed by the authors and associated with the top ten importers, namely, Russia, Egypt, Trinidad and Tobago, Belarus, the United States, Norway, Ukraine, the United Kingdom, Morocco, and Serbia, with a focus on China. These countries contribute to 80% of the import of fertilizers to the EU, with regards to four specific commodities, namely, ammonia, urea, urea ammonium nitrate, and NPK fertilizers.
Through the assessment of the mass-balance and the virtual carbon flows, it was determined that the total amount of fertilizers imported to the EU was about 21 Mt in 2023, with the highest peak in 2019 (about 27 Mt). The EU produced and sold about 10 Mt in 2023, with the highest peak in 2021. In this study, the evaluation of virtual carbon flows differed from the assessment of carbon footprint through the use of CBAM (which relies on the use of WWA emission factors), as it was based on CS emission factors. One of the main reasons was that producers and consumers are located at different places in different parts of the world, and they have significant differences in virtual GHGs (due to different technologies, internal environmental regulations, environmental backgrounds, etc.). Considering the top-ten importers of fertilizers to the EU, the most significant results highlight that: (i) the CO2eq emissions calculated with the WWA (considered by the CBAM) for the NPK fertilizers in the United Kingdom are 170% higher compared to those assessed with the CS emission factor (considered by this research); and (ii) the CO2eq emissions calculated with the WWA for the urea ammonium nitrate in the United Kingdom are 125% higher compared to those assessed with the CS emission factor. This trend, substantially, applies to almost all the main importing countries, while the WWA value is almost in line (compared to the CS value as regards Serbia or Ukraine, whereas China represents a standalone country since all WWA emission factors are lower compared to the CS ones.
Last, this research presented some interesting (and preliminary) indicators that may be used for integrating the analysis on the carbon leakage and to better interpret the functioning and the effects of the CBAM in international trade. Among other, some possible indicators could be: (i) kgCO2eq/person (where kgCO2eq are associated with the production of fertilizers in a single country); (ii) tCO2eq/km2; and (iii) kgCO2eq/GDP (expressed in USD).
In conclusion, this quantitative study emphasized the significance of treating each individual case individually, as opposed to employing weighted averages. It is possible to reduce emissions in countries with lax environmental policies by reducing production levels, but this could penalize third-party economies, such as those of Trinidad and Tobago. Nonetheless, sustainable development can be achieved through the implementation of equitable environmental policies, the maintenance of constant production levels, the economic compensation of production economies, and the exportation of skills and know-how to boost production and reduce its negative environmental impact.
Despite being novel in the field of CBAM studies, the present research is restricted to an analysis of the fertilizer trade. The CBAM includes other commodities, such as cement, iron and steel, aluminium, electricity, and hydrogen production. Hence, it is necessary to broaden the assessment of virtual carbon flows to encompass these sectors. Additionally, the present study only investigates four typologies of fertilizers (that represent about 85% of the EU total mineral fertilizer production and use), but the remaining quota could be added to shed additional light on the topic.
Future research directions ought to incorporate additional indicators, such as eco-efficiency or material cycle indicators, to comprehend the carbon leakage phenomenon on a global scale and accurately evaluate the environmental impacts of the production and trade of specific commodities. These indicators should consider either environmental or economic factors. Furthermore, the authors intend to proceed with an economic–environmental analysis to integrate the economic variables (such as the value of the carbon tax) with the environmental variables (such as the value of carbon emissions) and ascertain the potential impacts of environmental policies on international commerce. The authors intend to focus on geographic areas for which it is not possible to mitigate the production of certain commodities, as they own critical raw materials that other countries do not have (i.e., Trinidad and Tobago in the field of fertilizers production). It is imperative to monitor the trend in the costs of green technologies to verify the effectiveness of the CBAM, as a means of reducing country-specific emissions. The introduction of this mechanism is necessary, but it is not sufficient without an assessment of other micro- and macroeconomic variables, such as production costs, availability of raw materials, or local environmental policies.
Author Contributions
Conceptualization, C.B., R.L.R., C.T., P.G. and M.L.; methodology, C.B., R.L.R. and M.L.; investigation, C.B. and M.L.; resources, C.B.; data curation, C.B.; writing—original draft preparation, C.B., R.L.R. and M.L.; writing—review and editing, C.B. and M.L.; visualization, C.B.; supervision, C.T. and P.G. All authors have read and agreed to the published version of the manuscript.
Funding
This research was undertaken within the CLIMETransition project. The CLIMETransition project is funded by the European Union “Next Generation EU” through the Italian Ministry of University and Research within NRRP Mission 4 “Education and Research”—Component C2—Investment 1.1 “Fondo per il programma Nazionale di Ricerca e progetti di Rilevante Interesse Nazionale (PRIN)” approved by the Decree n. 1376, 1 September 2023, and running under the CUP Master F53D23009450001 [CUP Cipollina—H53D23008410001, CUP De Pascale—D53D23017840001]. The information and views set out in this publication are those of the authors only and do not necessarily reflect those of the European Union or the Italian Ministry of University and Research. Neither the European Union nor the granting authority can be held responsible for them.
Institutional Review Board Statement
Not applicable.
Informed Consent Statement
Not applicable.
Data Availability Statement
Data are available on request.
Conflicts of Interest
The authors declare no conflicts of interest.
Appendix A
Table A1.
Fertilizer Trade Flows (t) from Belarus, USA, Norway, Ukraine, UK, Morocco and Serbia to the EU in the Timespan 2019–2023.
Table A1.
Fertilizer Trade Flows (t) from Belarus, USA, Norway, Ukraine, UK, Morocco and Serbia to the EU in the Timespan 2019–2023.
| Year | Country | Ammonia | Urea | Urea Amm. Nitrate | NPK |
|---|---|---|---|---|---|
| 2023 | Morocco | 0 | 0 | 0 | 245,570 |
| Belarus | 0 | 35,485 | 19,297 | 30,253 | |
| Norway | 5713 | 453 | 0 | 381,117 | |
| Ukraine | 0 | 20,398 | 16,653 | 91 | |
| UK | 4600 | 26,440 | 2122 | 68,914 | |
| USA | 219,291 | 57,842 | 764,614 | 2350 | |
| Serbia | 1 | 6230 | 10,271 | 96,178 | |
| 2022 | Morocco | 0 | 26 | 0 | 134,948 |
| Belarus | 0 | 9741 | 27,666 | 425,903 | |
| Norway | 6467 | 613 | 0 | 461,807 | |
| Ukraine | 41,495 | 81,386 | 34,187 | 257 | |
| UK | 47,652 | 31,291 | 115 | 59,451 | |
| USA | 150,618 | 155,354 | 853,263 | 4049 | |
| Serbia | 1 | 8225 | 42,896 | 157,786 | |
| 2021 | Morocco | 0 | 0 | 0 | 225,778 |
| Belarus | 1 | 86,484 | 158,783 | 425,902 | |
| Norway | 8050 | 2023 | 0 | 377,000 | |
| Ukraine | 122,977 | 342,704 | 92,143 | 22 | |
| UK | 75,925 | 34,757 | 393 | 81,656 | |
| USA | 52,137 | 15,105 | 1 | 3535 | |
| Serbia | 0 | 3678 | 7942 | 148,230 | |
| 2020 | Morocco | 0 | 11 | 0 | 178,170 |
| Belarus | 18,561 | 95,225 | 518,745 | 428,191 | |
| Norway | 9513 | 116 | 0 | 319,278 | |
| Ukraine | 328,761 | 179,460 | 0 | 113 | |
| UK | 263,318 | 77,244 | 155 | 110,740 | |
| USA | 2469 | 18,191 | 47 | 3054 | |
| Serbia | 48 | 634 | 0 | 105,802 | |
| 2019 | Morocco | 0 | 0 | 0 | 92,104 |
| Belarus | 11,469 | 130,539 | 385,248 | 432,582 | |
| Norway | 8633 | 581 | 0 | 394,107 | |
| Ukraine | 286,009 | 122,881 | 0 | 100 | |
| UK | 234,246 | 57,645 | 3208 | 87,343 | |
| USA | 17,865 | 19,749 | 221,964 | 3051 | |
| Serbia | 191 | 203 | 0 | 106,313 |
Appendix B
Table A2.
Net Fertilizer Trade (Import–Export) Expressed in t of Fertilizers.
Table A2.
Net Fertilizer Trade (Import–Export) Expressed in t of Fertilizers.
| Year | Country | Ammonia | Urea | Urea Amm. Nitrate | NPK |
|---|---|---|---|---|---|
| 2023 | Russia | 244,679 | 1,515,105 | 561,723 | 535,296 |
| Egypt | 206,979 | 2,215,864 | −53 | −9670 | |
| T&T | 494,901 | 11,152 | 261,201 | 0 | |
| China | 207 | 97,875 | 0 | −272,253 | |
| 2022 | Russia | 362,971 | 1,538,527 | 1,100,832 | 920,625 |
| Egypt | 175,769 | 2,119,316 | 0 | −10,380 | |
| T&T | 544,369 | 11,912 | 673,200 | 0 | |
| China | 8917 | 29,846 | −39 | −91,994 | |
| 2021 | Russia | 105,7361 | 1,108,240 | 533,225 | 1,640,642 |
| Egypt | 93,360 | 1,628,041 | −8 | −14,443 | |
| T&T | 475,641 | 7562 | 388,547 | 0 | |
| China | −51 | 1225 | −9 | −242,936 | |
| 2020 | Russia | 998,875 | 951,434 | 507,708 | 1,634,017 |
| Egypt | 49,264 | 1,478,477 | 26,811 | −17,314 | |
| T&T | 407,233 | 10,068 | 417,594 | 0 | |
| China | −29 | 2474 | −12 | −397,836 | |
| 2019 | Russia | 1,157,265 | 1,327,816 | 714,594 | 1,515,684 |
| Egypt | 50,651 | 1,565,762 | 33,855 | −13,941 | |
| T&T | 502,641 | 13,412 | 400,647 | 0 | |
| China | −20 | 1306 | −203 | −406,330 |
Appendix C
Table A3.
Net Carbon Emissions in 2023, Expressed in tCO2eq.
Table A3.
Net Carbon Emissions in 2023, Expressed in tCO2eq.
| Year | Country | Ammonia | Urea | Urea Amm. Nitrate | NPK | Total |
|---|---|---|---|---|---|---|
| 2023 | Russia | 689,994 | 2,878,700 | 1,342,518 | 722,650 | 5,633,862 |
| Egypt | 583,680 | 4,210,142 | −127 | −13,055 | 4,780,641 | |
| T&T | 1,395,620 | 21,189 | 624,270 | 0 | 2,041,080 | |
| China | 583 | 185,963 | 0 | −367,542 | −180,995 |
References
- IPCC. Summary for Policymakers. In Climate Change 2023: Synthesis Report; Contribution of Working Groups I, II and III to the Sixth Assessment Report of the Intergovernmental Panel on Climate Change; Core Writing Team, Lee, H., Romero, J., Eds.; IPCC: Geneva, Switzerland, 2023; pp. 1–34. [Google Scholar] [CrossRef]
- United Nations. Kyoto Protocol to the United Nations Framework Convention on Climate Change. 1998. Available online: https://unfccc.int/resource/docs/convkp/kpeng.pdf (accessed on 22 August 2024).
- United Nations. Goal 13. Take Urgent Action to Combat Climate Change and its Impacts. 2024. Available online: https://sdgs.un.org/goals/goal13#targets_and_indicators (accessed on 25 November 2024).
- United Nations. The 17 Goals. 2024. Available online: https://sdgs.un.org/goals (accessed on 25 November 2024).
- Martinus, M.; Laopirun, K. The EU’s Carbon Border Adjustment Mechanism (CBAM): Implications for ASEAN-EU Relations. In The EU’s Carbon Border Adjustment Mechanism (CBAM): Implications for ASEAN-EU Relations; ISEAS Publishing: Singapore, 2023; pp. 1–30. [Google Scholar] [CrossRef]
- Bux, C.; Fellner, J.; Seyhan, D.; Amicarelli, V. Measurement of fertilizer flows to advance circularity and resilience to climate change. Curr. Opin. Green Sustain. Chem. 2024, 50, 100971. [Google Scholar] [CrossRef]
- Lin, B.-Q.; Zhao, H.-S. Which sectors should be covered by the EU Carbon Border Adjustment Mechanism? Adv. Clim. Chang. Res. 2023, 14, 952–962. [Google Scholar] [CrossRef]
- UNFCCC. What is the Kyoto Protocol? 2024. Available online: https://unfccc.int/kyoto_protocol (accessed on 7 August 2024).
- UNFCCC. Key Aspects of the Paris Agreement. 2024. Available online: https://unfccc.int/most-requested/key-aspects-of-the-paris-agreement (accessed on 7 August 2024).
- ICAP. Emissions Trading Worldwide: Status Report 2023. International Carbon Action Partnership. 2023. Available online: https://icapcarbonaction.com/system/files/document/ICAP%20Emissions%20Trading%20Worldwide%202023%20Status%20Report_0.pdf (accessed on 22 August 2024).
- Ekins, P.; Osorio, S.; Doda, B.; Wildgrube, T.; Raude, M.; Ferrari, A.; Heinrich, L.; Borghesi, S. Impacts and evolution of emissions trading systems: Insights from research and regulation. In Research Project Report; European University Institute Publisher, San Domenico di Fiesole: Fiesole, Italy, 2024; pp. 1–33. [Google Scholar] [CrossRef]
- Cammeo, J.; Ferrari, A.; Borghesi, S.; Zens, G.; de Bonfils, L. The functioning and Socioeconomic Impacts of the EU Emission Trading System: Updated Evidence and Insights. SPES. Working Paper No. 7.1. SPES Project—Sustainability Performances, Evidence and Scenarios. Florence: University of Florence. 2024. Available online: https://www.sustainabilityperformances.eu/publications-deliverables/ (accessed on 22 August 2024).
- Cardenas Monar, D. Maximising Benefits of Carbon Pricing Through Carbon Revenue Use: A Review of International Experiences. 2024. Available online: https://www.i4ce.org/wp-content/uploads/2024/05/240515-i4ce-EUCDs-use-of-revenues-66pA4-Web.pdf (accessed on 26 August 2024).
- European Commission. ETS2: Buildings, Road Transport and Additional Sectors. 2023. Available online: https://climate.ec.europa.eu/eu-action/eu-emissions-trading-system-eu-ets/ets2-buildings-road-transport-and-additional-sectors_en?prefLang=it (accessed on 22 August 2024).
- Zhang, K.; Yao, Y.-F.; Qian, X.-Y.; Zhang, Y.-F.; Qiao-Mei Liang, Q.-M.-B.; Wei, Y.-M. Could the EU carbon border adjustment mechanism promote climate mitigation? An economy-wide analysis. Adv. Clim. Chang. Res. 2024, 15, 557–571. [Google Scholar] [CrossRef]
- Wang, M.; Kuusi, T. Trade flows, carbon leakage, and the EU Emissions Trading System. Energy Econ. 2024, 134, 107556. [Google Scholar] [CrossRef]
- Bellora, C.; Fontagné, L. EU in search of a Carbon Border Adjustment Mechanism. Energy Econ. 2023, 123, 106673. [Google Scholar] [CrossRef]
- Pirlot, A. Carbon Leakage and International Climate Change Law. Transnatl. Environ. Law 2024, 13, 61–86. [Google Scholar] [CrossRef]
- Fournier Gabela, J.G.; Spiegel, A.; Stepanyan, D.; Freund, F.; Banse, M.; Gocht, A.; Soder, M.; Heidecke, C.; Osterburg, B.; Matthews, A. Carbon leakage in agriculture: When can a carbon border adjustment mechanism help? Clim. Policy 2024, 24, 1410–1425. [Google Scholar] [CrossRef]
- Tricase, C.; Rana, R.L.; Lombardi, M.; Geatti, P.; Giungato, P.; Amicarelli, V.; Bux, C. Carbon Footprint as a Tool to Improve Sustainability: Evidence from the Agri-Food Supply Chain. In Carbon Footprint Assessments. Environmental Footprints and Eco-Design of Products and Processes; Muthu, S.S., Ed.; Springer: Cham, Switzerland, 2024; pp. 177–200. [Google Scholar] [CrossRef]
- European Commission. Carbon Border Adjustment Mechanism. 2024. Available online: https://taxation-customs.ec.europa.eu/carbon-border-adjustment-mechanism_en (accessed on 26 November 2024).
- Zhou, W.; Feng, R.; Han, M. The robustness and disturbance within China’s industrial complex network under carbon border tariffs. Environ. Sci. Pollut. Res. 2023, 30, 109841–109853. [Google Scholar] [CrossRef] [PubMed]
- Yan, Z.; Yuan, Z. Discussion on the impact of EU carbon border adjustmen mechanism (CBAM) for China—EU trade. Environ. Res. Commun. 2023, 5, 111001. [Google Scholar] [CrossRef]
- Lestan, F.; Kabiraj, S.; George, B. Preliminary Impact Assessment of Carbon Border Adjustment Mechanism on Russian Economy. FIIB Bus. Rev. 2023, 23197145221143033. [Google Scholar] [CrossRef]
- Gergondet, E. The European Union’s Proposed Carbon-Border Adjustment and Its Impact on Trade with Africa. Glob. Trade Cust. J. 2021, 16, 564–571. [Google Scholar] [CrossRef]
- Sudakov, S. Effects of the EU’s CBAM on Eurasian Countries. Istanb. J. Econ. 2023, 73, 675–696. [Google Scholar] [CrossRef]
- Shidiq, M.; Htet, H.; Abdullah, A.; Rakhiemah, A.N.; Pradnvaswari, I.; Margenta, I.D.R.; Suryadi, B. Carbon Border Adjustment Mechanism (CBAM) Implementation on Reducing Emissions in the ASEAN Energy Sector. IOP Conf. Ser. Earth Environ. Sci. 2023, 1395, 012035. [Google Scholar] [CrossRef]
- Wenmei, K.; Wang, M. The impacts of the EU carbon border adjustment mechanism on China. Res. Sq. 2023, 1–13. [Google Scholar] [CrossRef]
- de Boer, B.F.; Wang, R.; Hoekstra, R.; Tukker, A. From raw materials to downstream goods: Potential impact of a more comprehensive EU CBAM on global emissions. SSRN 2023. [CrossRef]
- Wang, Y.; Zhou, M.; Wu, Z.; Wang, J.; Li, G. Carbon Flow Tracing based Consumer’s Indirect Carbon Emissions Calculation. In Proceedings of the 2023 IEEE Power & Energy Society General Meeting (PESGM), Orlando, FL, USA, 16–20 July 2023; pp. 1–5. [Google Scholar] [CrossRef]
- Lamastra, L.; Miglietta, P.P.; Toma, P.; De Leo, F.; Massari, S. Virtual water trade of agri-food products: Evidence from italian-chinese relations. Sci. Total Environ. 2017, 599–600, 474–482. [Google Scholar] [CrossRef] [PubMed]
- European Commission. Fertilizer Trade. Monthly EU Trade, Quantity in Tonnes. 2024. Available online: https://agridata.ec.europa.eu/extensions/DashboardFertiliser/FertiliserTrade.html (accessed on 8 September 2024).
- Vidovic, D.; Marmier, A.; Zore, L.; Moya, J. Greenhouse Gas Emission Intensities of the Steel, Fertilisers, Aluminium and Cement Industries in the EU and its Main Trading Partners; JRC134682; Publications Office of the European Union: Luxembourg, 2023. [Google Scholar] [CrossRef]
- European Parliament. Carbon Border Adjustment Mechanism as Part of the European Green Deal. 2024. Available online: https://www.europarl.europa.eu/legislative-train/package-fit-for-55/file-carbon-border-adjustment-mechanism (accessed on 5 August 2024).
- European Commission. Regulation (EU) 2023/956 of the European Parliament and of the Council of 10 May 2023. Establishing A Carbon Border Adjustment Mechanism, Official Journal of the European Union, L 130/52, 16.5.2023, 52–103. 2023. Available online: https://eur-lex.europa.eu/legal-content/EN/TXT/PDF/?uri=CELEX:32023R0956 (accessed on 26 August 2024).
- European Union Carbon Border Adjustment Mechanism. Information for Importers of Fertilizers. 2023. Available online: https://taxation-customs.ec.europa.eu/system/files/2023-11/CBAM%20Factsheet_FERTILISERS_1.pdf (accessed on 31 July 2024).
- Ritchie, H.; Rodés-Guirao, L.; Mathieu, E.; Gerber, M.; Ortiz-Ospina, E.; Hasell, J.; Roser, M. Population Growth. 2023. Available online: https://ourworldindata.org/population-growth (accessed on 8 September 2024).
- World Bank Group. GDP (Current US$). 2024. Available online: https://data.worldbank.org/indicator/NY.GDP.MKTP.CD (accessed on 3 September 2024).
- European Commission. Default Values for the Transitional Period of the CBMA Between 1 October 2023 and 31 December 2025. 2023. Available online: https://taxation-customs.ec.europa.eu/document/download/017e46f1-dd1a-4235-b2d7-dafcc6692acf_en?filename=Default%20values%20transitional%20period.pdf (accessed on 31 July 2024).
- Sato, M. Embodied carbon in trade: A survey of the empirical literature. J. Econ. Surv. 2014, 28, 831–861. [Google Scholar] [CrossRef]
Disclaimer/Publisher’s Note: The statements, opinions and data contained in all publications are solely those of the individual author(s) and contributor(s) and not of MDPI and/or the editor(s). MDPI and/or the editor(s) disclaim responsibility for any injury to people or property resulting from any ideas, methods, instructions or products referred to in the content. |
© 2024 by the authors. Licensee MDPI, Basel, Switzerland. This article is an open access article distributed under the terms and conditions of the Creative Commons Attribution (CC BY) license (https://creativecommons.org/licenses/by/4.0/).