Article

Kinetic Modelling of Ralstonia eutropha H16 Growth on Different Substrates

1
University of Zagreb, Faculty of Chemical Engineering and Technology, Marulićev trg 19, HR-10000 Zagreb, Croatia
2
University of Zagreb, Faculty of Food Technology and Biotechnology, Pierottijeva 6, HR-10000 Zagreb, Croatia
3
Department of Packaging, Recycling and Environmental Protection, University North, Trg dr. Žarka Dolinara 1, HR-48000 Koprivnica, Croatia
*
Author to whom correspondence should be addressed.
Sustainability 2024, 16(23), 10650; https://doi.org/10.3390/su162310650
Submission received: 12 November 2024 / Revised: 29 November 2024 / Accepted: 3 December 2024 / Published: 5 December 2024

Abstract

:
Due to environmental pollution and the depletion of fossil fuels, there is growing interest in the development and use of biofuels as environmentally friendly alternatives. One of the most promising biofuels is biohydrogen, hydrogen produced through sustainable processes using microorganisms such as bacteria and algae. One of the most interesting bacteria for hydrogen production is Ralstonia eutropha H16, known for its ability to produce oxygen-tolerant hydrogenases. These enzymes play a crucial role in biohydrogen metabolism and production. The aim of this work was to determine the optimal conditions (reactor type and synthetic medium composition) for the cultivation of R. eutropha H16. The culture media contained different concentrations of fructose and glycerol (mono- or double-substrate cultivation) and the experiments were carried out in a batch reactor. The initial experiments were carried out with 4 g/L fructose or glycerol in the culture medium at pH 7, T = 30 °C, and 120 rpm. The mathematical model, consisting of the growth kinetics (described by the Monod’s model) and the corresponding mass balances, was proposed. The developed model was validated using two independent experiments with different initial substrate concentrations: 2 g/L glycerol and fructose in one medium and 4 g/L fructose and 1 g/L glycerol in the second. In order to propose the optimal cultivation procedure for future research, the mathematical model simulations were performed for different reactor types (batch, fed-batch, and continuous stirred tank reactors) and different initial substrate concentrations. The most successful experiment was the one with 4 g/L glycerol, where γX = 0.485 ± 0.001 g/L of biomass was achieved. Further calculations showed that the most biomass would be produced at higher glycerol concentrations (at γG = 6.358 g/L, γX = 1.311 g/L should be achieved after 200 h of cultivation) and when using a fed-batch reactor (γX = 0.944 g/L after 200 h of cultivation).

1. Introduction

With the depletion of fossil fuel reserves and the growing challenges posed by climate change, the need to diversify fuel and energy sources is increasing [1]. Among the most promising alternatives to traditional fossil fuels are biofuels, including biogas, biodiesel, bioethanol, and biohydrogen [2]. The use of biofuels helps to reduce emissions of carbon dioxide and other harmful gases but also to stabilise energy prices. Among biofuels, hydrogen is the most promising due to its high specific energy value (143 GJ/tonne) and the fact that the use of hydrogen as a fuel significantly reduces greenhouse gas emissions, as the only by-product of hydrogen combustion is water. This makes hydrogen a clean and sustainable energy source compared to conventional fossil fuels [3,4].
Although it is the most abundant element in nature, it does not occur freely and therefore must be produced by various chemical and biological processes. Chemical processes include gasification, reforming of hydrocarbons and fractional oxidation of denser hydrocarbons, electrolysis of water, photoelectrolysis, gasification of biomass, etc. [4]. The majority of hydrogen is currently produced by the first three processes mentioned above, which are based on production from fossil fuels, which is neither sustainable nor environmentally friendly, as they release significant amounts of carbon, sulphur, nitrogen oxides, ash, radioactive material, and heavy metals [4,5,6]. Apart from their environmental impacts, these processes also have serious disadvantages, such as high investment and operating costs, high specific energy consumption and low process efficiency. These disadvantages have led to a growing interest in biological processes as a more sustainable and cost-effective alternative [7].
Hydrogen produced by biological, sustainable processes using microorganisms is referred to as biohydrogen. Biological processes include dark fermentation, microbial electrolysis, and photofermentation, in which microorganisms convert organic material into biohydrogen and by-products such as organic acids, alcohols, and CO2. Biohydrogen can be produced from various organic substrates. However, for biohydrogen to become a sustainable energy source, it must be produced from renewable energy sources such as crops and lignocellulose, which have high sugar contents [4]. Simple sugars such as glucose, sucrose, and lactose are highly biodegradable and therefore ideal model substrates for biohydrogen production. In the course of technological progress, biomass could become an important source of energy in the future. In addition to suitable raw materials, the selection of the most suitable microorganisms is also crucial for efficient biohydrogen production, as they are responsible for converting the organic substrates into biohydrogen. The efficiency of these processes largely depends on their metabolic pathways [6,7,8]. Compared to conventional chemical processes, biological processes offer a more environmentally friendly way of producing hydrogen, as they have less impacts on the environment. However, the production of biohydrogen has serious drawbacks, including high production costs, low substrate conversion rates, and low yields and productivity due to the ineffective metabolic pathways of microorganisms used in biohydrogen production and their production of a number of other compounds, as well as the lack of suitable technology and infrastructure [6,7,9].
One of the biological methods for the production of biohydrogen is the oxidation of D-glucose to gluconic acid, whereby D-gluconolactone is formed as an intermediate product. This reaction is catalysed by the enzyme glucose dehydrogenase (GDH) in the presence of the cofactor NAD+ or NADP+. In this process, NAD+ or NADP+ serves as an electron acceptor and is consequently reduced to NADH or NADPH. This reaction cannot take place without the cofactors, but their high price makes the process economically unfeasible for large-scale applications. A promising solution to this problem is the enzymatic regeneration of NADH and NADPH using hydrogenase enzymes, which enables the recycling of these cofactors and the simultaneous formation of biohydrogen [10,11,12]. Hydrogenases can reversibly catalyse the formation of H2 from protons or its oxidation back to protons [13,14].
Hydrogenases are usually categorized based on the metal bound in the centre of their active site, with [FeFe]-hydrogenases, [NiFe]-hydrogenases and [Fe]-hydrogenases being the most common. [FeFe]-hydrogenases contain two iron atoms and both carbon monoxide and cyanide ligands in their active centre and are known for their high activity in hydrogen production. These enzymes are particularly suitable for the rapid and efficient transfer of electrons [15]. [NiFe]-hydrogenases contain an iron and a nickel atom in the centre, as well as ligands such as carbon monoxide and cyanide, and usually have a lower activity compared to [FeFe]-hydrogenases. Nevertheless, they are considered more promising for biohydrogen production as they are thermodynamically more stable and more oxygen-tolerant [16]. They are found in various organisms, and one of the most interesting microorganisms for the production of hydrogenases is Ralstonia eutropha H16. This bacterium is known for its ability to produce four oxygen-tolerant [NiFe]-hydrogenases: a membrane-bound hydrogenase (MBH), a cytoplasmic soluble hydrogenase (SH), an actibacterial-type hydrogenase (AH), and a regulatory hydrogenase (RH). Of these, MBH and SH are considered the most interesting for biohydrogen production, as MBH efficiently oxidizes hydrogen, while SH plays a key role in the oxidation of NADH to the coenzyme NAD+ and simultaneously reduces protons to molecular hydrogen. R. eutropha H16 can grow on many different carbon sources, including organic waste, lignocellulose, glycerol, etc. However, R. eutropha H16 grows best on fructose and glycerol, as they provide good conditions for the synthesis of the hydrogenase enzyme [17]. In the work presented by Poladyan et al. [17], the authors concluded that organic wastes, specifically glycerol and brewery spent grain hydrolysate, are promising as carbon and energy sources for the cultivation of biomass rich in the biotechnologically valuable hydrogenases MBH and SH. Their findings highlight the potential of microbial cells as producers of hydrogenase enzymes, which are suitable as catalysts in enzymatic fuel cells. However, the authors did not define the optimal reaction conditions for achieving the maximum cell yield.
Based on the above, the aim of this work was to cultivate R. eutropha H16 in a batch reactor using different synthetic media with different concentrations of fructose and glycerol. To the best of our knowledge, this is first study in which the biomass and substrate concentrations were monitored throughout the cultivation process in order to collect the necessary data for estimating the kinetic parameters of the process, which should then be used for process optimization. A mathematical model consisting of the growth kinetics and the corresponding mass balances was developed. In a next step, the model was validated using two independent experiments with different initial substrate concentrations. In order to propose the optimal cultivation process, mathematical models were developed for different reactor types (batch, fed-batch, continuous stirred tank reactors, etc.).

2. Materials and Methods

2.1. Materials

2.1.1. Chemicals

Tris(hydroxymethyl)aminomethane and ferric chloride heptahydrate were purchased from BDH Prolabo (Poole, UK), and D-fructose was purchased from Lach Ner (Neratovice, Czech Republic). Glycerol, potassium dihydrogen phosphate, monopotassium phosphate, ammonium chloride, magnesium sulphate hexahydrate, and calcium chloride dihydrate were purchased from Gram-mol (Zagreb, Croatia). 3,5-Dinitrosalicylic acid (DNS), potassium sodium tartrate tetrahydrate, and sodium phosphate dibasic dodecahydrate were purchased from Sigma-Aldrich (St. Louis, MO, USA), while peptone and meat agar were supplied by Sigma-Aldrich (Darmstadt, Germany). Hydrochloric acid was purchased from Ficher Chemicals (Strasbourg, France) and sodium hydroxide from CARLO ERBA Reagents (Cornaredo, Italy). Nickel (II) chloride was obtained from Alfa Aesar Gmbh&Co. KG (Karlsruhe, Germany). The chemicals were of analytical grade and were used without further purification.

2.1.2. The Bacterium R. eutropha H16

The bacterium R. eutropha H16 was purchased from DSMZ (Leibniz, Germany).

2.2. Methods

2.2.1. Analytical Methods

The fructose concentration was determined using the DNS method. DNS reagent contains 3,5-dinitrosalicylic acid, which, in the presence of carbonyl groups (C=O) in reducing sugars, reduces to 3-amino-5-nitrosalicylic acid, a reddish-brown aromatic compound that absorbs light at λ = 575 nm [18]. The glycerol concentration was analysed using a gas chromatograph (Shimadzu GC-2014, Kyoto, Japan) with an FID detector and Zebron ZB-Wax capillary column (length 30 m, i.d. 0.53 mm and film thickness 1.00 μm, Phenomenex, Aschaffenburg, Germany) according to the method described elsewhere [19]. The optical density of the samples during cell cultivation was measured at λ = 436 nm and λ = 600 nm, while the concentration of biomass was determined using the gravimetric method and correlated with the measured optical densities [17].

2.2.2. Cultivation of R. eutropha H16 on Different Media

R. eutropha H16 was propagated at 37 °C in a thermostatically controlled laboratory shaker (WNB 14 Memmert, Schwabach, Germany) in a liquid medium containing 5 g of peptone and 3 g of meat extract dissolved in 1 L of distilled water at pH 7. In the exponential growth phase, the liquid medium with the cells was transferred to different culture media.
The base medium for cell cultivation [17] was prepared by mixing 100 mL of sodium/potassium phosphate buffer (pH 7) with 850 mL of ultrapure water. The prepared solution was then sterilized at 130 °C for 15 min (InkoLab, Zagreb, Hrvatska). In the next step, the following separately autoclaved solutions were added to the medium: 10 mL of a 20% (w/v) solution of NH4Cl, 1 mL of a 20% (w/v) solution of MgSO4·H2O, 1 mL of a 1% (w/v) solution of CaCl2·2 H2O, 1 mL of a 0.02% (w/v) solution of NiCl2, and 1 mL of a 0.5% (w/v) solution of FeCl3·6 H2O prepared in 0.1 mol/L HCl, previously sterilized by filtration (0.2 µm filter, CHROMAFIL Xtra disposable filter RC-45/13). Finally, 25 mL of an autoclaved SL-6 solution was added to the medium.
The sodium/potassium buffer contained 90 g of Na2HPO4·12 H2O and 15 g of KH2PO4 in 1 L of distilled water with a pH of 7. The SL-6 solution contained the following chemicals dissolved in 1 L of ultrapure water: 100 mg ZnSO4·7H2O, 30 mg MnCl2·4H2O, 300 mg H3BO3, 200 mg CoCl2·6H2O, 15 mg CuSO4·5H2O, 20 mg NiCl2·6H2O and 30 mg Na2MoO4·2H2O.
R. eutropha H16 was cultivated (pH 7, T = 30 °C and 120 rpm) on media with different concentrations of fructose and glycerol (Table 1), and all experiments were carried out in duplicate.
All media were prepared by mixing 200 mL of the base medium with different concentrations of glycerol and fructose. Cultivation began with the addition of bacterial cells (1.5% inoculum). During cultivation, the cells were incubated at 30 °C on a laboratory shaker (WNB 14, Memmert, Germany) at 120 rpm. The consumption of fructose and glycerol was continuously monitored, as well as the pH value and the optical density at λ = 436 nm and λ = 600 nm. As soon as the optical density no longer changed, i.e., the bacteria reached the stationary growth phase, the cultivation was stopped. The cells were then separated from the growth medium by centrifugation at 4300 rpm for 20 min (EBA 8, Hettich, Germany). The pellet obtained after centrifugation was washed with 50 mmol/L potassium phosphate buffer (pH 7) and stored at −4 °C until further analysis.

2.2.3. Mathematical Modelling and Kinetic Parameter Estimation

The Batch Reactor

The mathematical model of the cultivation process includes both a reactor model and a kinetic model and was developed to accurately simulate the process. It consisted of the mass balances for fructose (F), glycerol (G) and biomass (X) (Equations (1)–(3)), and the corresponding growth kinetics (Equation (4) or (5)).
d γ F d t = μ · γ X Y X / F
d γ G d t = μ · γ X Y X / G
d γ X d t = μ · γ X
where γ is the mass concentration, Y is the biomass yield coefficient, Ks is the half-saturation constant representing the substrate concentration at which the specific growth rate is half of its maximum value, and µ is the specific growth rate described by the Monod equation (Equation (4)) for the growth of R. eutropha H16 on a single substrate.
μ = μ m a x · γ F   o r   G K S F   o r   G + γ F   o r   G
For the specific growth rate of R. eutropha H16 on two substrates, the specific growth rate is described by an extension of the Monod equation (Equation (5)).
μ = μ m a x · γ F K S F + γ F · γ G K S G + γ G

The Fed-Batch Reactor

A fed-batch reactor is a type of reactor in which the reaction mixture is fed continuously or occasionally. This increases the volume of the reaction mixture and the mass balances differ from those of the batch reactor (Equations (6)–(8)).
d V d t = q V
d m X d t = μ · m X
d m F   o r   G d t = q V · γ F 0   o r   G 0 μ · m X Y X / F   o r   G
where m is the mass of substrates or biomass, V is the volume of the reaction mixture, qV is the volumetric flow rate, and the index 0 indicates the inlet stream.

The Continuous Stirred Tank Reactor (CSTR)

The CSTR is an open flow system in which reagents and reactants flow into a reactor, while the reaction product leaves the reactor. The dilution rate, D, is the one of the important parameters for continuous reactors, i.e., the parameter that determines the rate at which the reaction volume is diluted by the addition of the influent/nutrient feed (Equation (9)). At the steady state, the dilution rate is equal to the specific growth rate.
D = q V V
The corresponding mass balances for the CSTR are described by Equations (10) and (11).
d m X d t = μ · m X D · m X
d m F   o r   G d t = q V · γ F 0   o r   G 0 μ · m X Y X / F   o r   G D · m F   o r   G

Data Analysis

The kinetic parameters’ values were estimated using nonlinear regression, in particular the simplex method and the least squares method integrated into the Scientist software package (MicroMath® Scientist® for WindowsTM, Version 2.0, Salt Lake City, UT, USA). The applicability of the developed models was estimated using the coefficients of determination (R2), root mean square error (RMSE), mean absolute error (MAE), and mean squared error (MSE) calculated in Microsoft Excel 2023.

2.2.4. Local Sensitivity Analysis

Sensitivity analysis is a technique used to evaluate how changes in the results of a mathematical model’s simulations are affected by variations in its inputs [20]. A local parametric sensitivity analysis is commonly used to evaluate the accuracy of computational and mathematical models. In this method, all model parameters are examined to determine the parameters that have the greatest impacts on the model results and thus gain insight into the actual behaviour of the system. Mathematically, the local parametric sensitivity analysis is represented by the first-order derivatives of model outputs with respect to the model parameters [21,22]. The relative sensitivity of the output variables is calculated using specific equations, where SX/i denotes the sensitivity coefficient, cx the concentration vector, ki the system parameter vector and a parameter value variation (Equations (12) and (13)).
S x / i = k i c x   ·   c x k i   · 100 %     k i · c x c x · k i   · 100 %
S x / i = k i c x   ·   c x · 1 + a c x · k i a · k i   · 100 %
In this study, a local parametric sensitivity analysis was performed by systematically varying the value of each input parameter while keeping the other parameters constant. The effects of these changes on the output results of the mathematical model simulation were then evaluated. Specifically, each of the kinetic parameters was individually increased and decreased by 3%, and the resulting values of the model variables and response rates were measured following a 174 h simulation.

3. Results and Discussion

3.1. Cultivation of the R. eutropha H16 Bacterium Culture

According to the literature, various carbon sources, such as sugars, fatty acids, amino acids, alcohols, and aromatic compounds [23], as well as cheap carbon sources, e.g., organic waste [24,25], can be used for the heterotrophic growth/cultivation of the bacterium R. eutropha H16 [26,27]. Among the organic wastes, glycerol [28], a by-product of biodiesel production, and lignocellulosic biomass [29] stand out. The hydrolysis of lignocellulosic biomass yields raw material rich in pentose and hexose sugars, acids, aromatic compounds, and (micro)elements such as sodium, potassium, calcium, magnesium, iron, manganese, copper, zinc, aluminium, barium, strontium, phosphorus, sulphur, chromium, and silicon [30,31]. All these make lignocellulose a very rich substrate. However, Judger et al. [32] state in their work that media containing fructose and glycerol are best suited for the production of hydrogenase enzymes by the bacterium R. eutropha H16. The use of these substrates provides the best conditions for the synthesis of hydrogenase enzymes [33]. Fructose is mainly transported into the cell via ABC transporters (membrane proteins) [27] and catabolized via the Entner–Doudoroff pathway. Glycerol enters the cells by facilitated diffusion. It supports the very slow growth of R. eutropha H16, which however leads to the strong expression of hydrogenase genes and enzymes of the Calvin–Benson–Bassham (CBB) cycle [24,25].
Therefore, the cultivation of the bacterial culture of R. eutropha H16 on synthetic media (pH 7) with fructose, glycerol, and nitrogen was carried out on a laboratory shaker at T = 30 °C, and the entire process was monitored for 174 h. As already mentioned in Table 1, the cultivation was carried out with different initial concentrations of fructose and glycerol in the culture medium. These changes in the initial concentrations and substrate types made it possible to investigate the influence of different conditions on the growth of the R. eutropha H16 bacterial culture. To ensure the continuous monitoring of growth, samples were taken approximately every 24 h. During cultivation, both the substrate concentrations and the biomass concentration were carefully monitored. In this way, it was possible to closely follow the growth dynamics of R. eutropha H16 and obtain valuable data on the effects of fructose and glycerol as carbon sources. The cultivation was carried out in the batch reactor due to its simplicity and ease of operation.
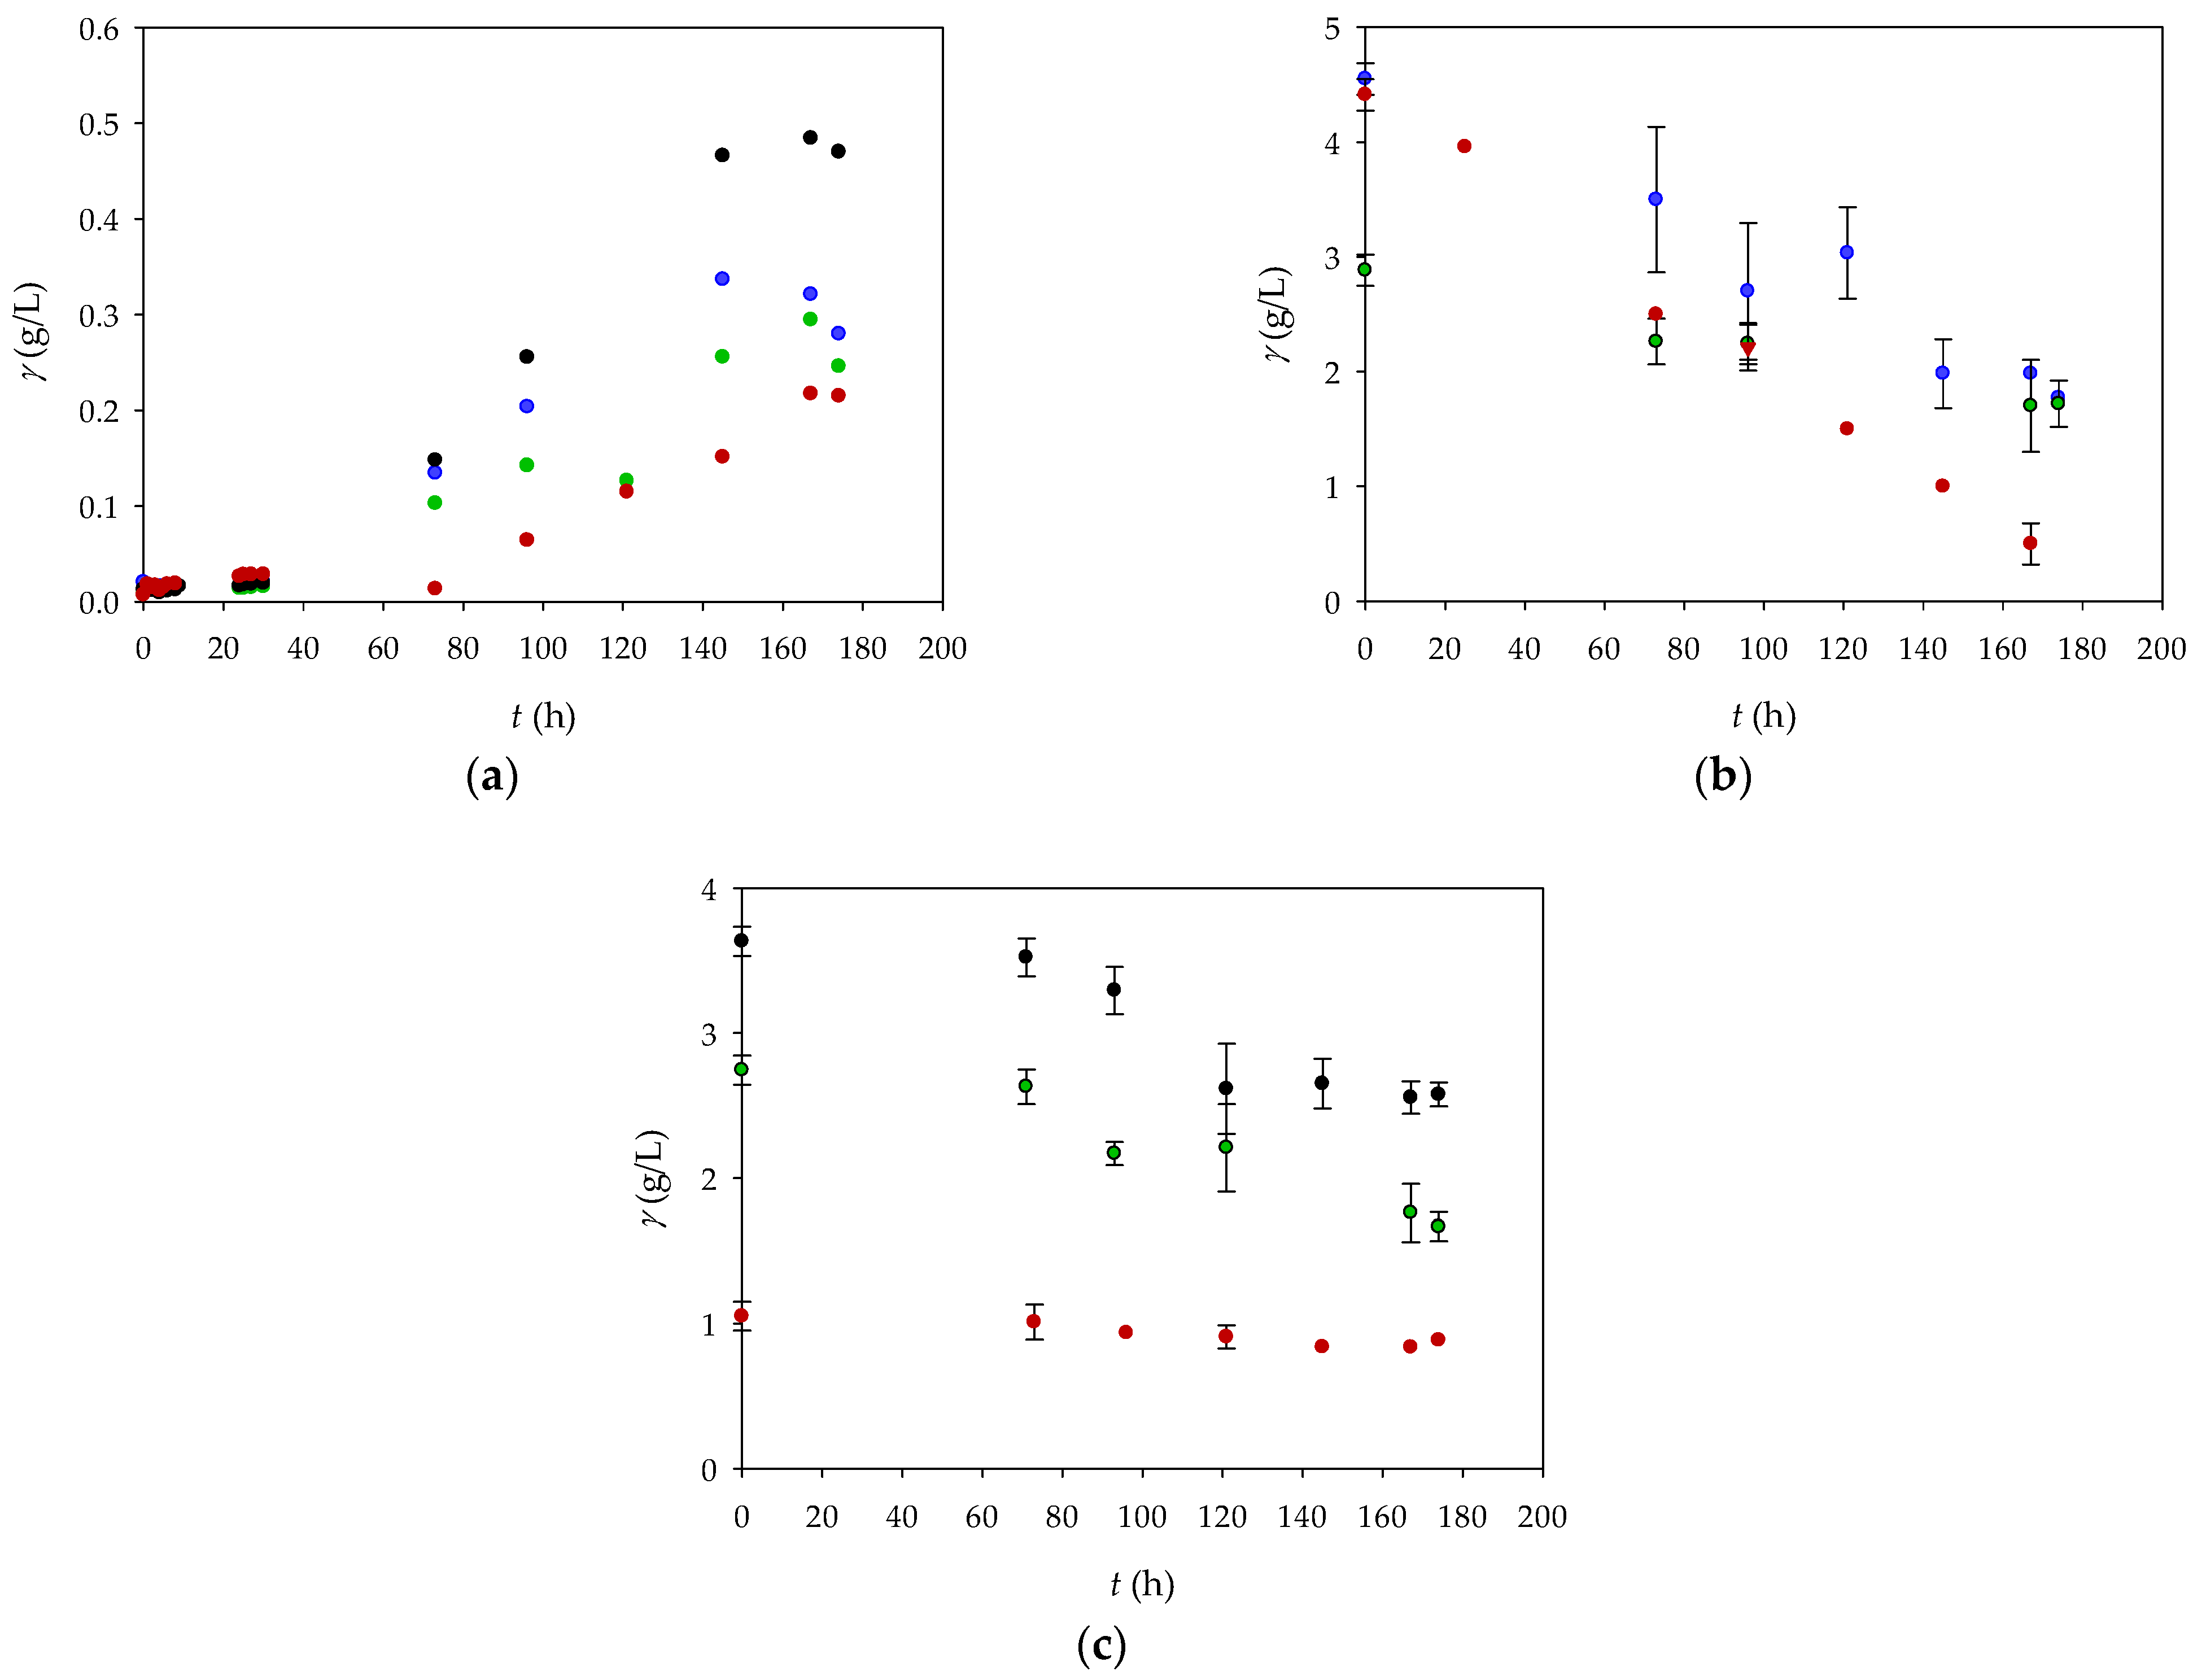
Figure 1a shows the change in biomass concentration as a function of the duration of cultivation with glycerol and/or fructose. The highest biomass concentration achieved was 0.485 ± 0.001 g/L and was obtained in Experiment 2 (GN medium), in which a glycerol solution with a concentration of 4 g/L was added to the culture medium. A slightly lower biomass concentration of 0.337 ± 0.001 g/L was achieved in Experiment 1 (FN medium) of this study, in which a fructose solution with a concentration of 4 g/L was added to the culture medium. In Experiment 3 (FGN medium), in which a fructose solution with a concentration of 2 g/L and a glycerol solution with a concentration of 2 g/L were added to the medium, a biomass concentration of 0.295 ± 0.001 g/L was achieved. The lowest biomass yield of 0.217 ± 0.001 g/L was obtained in Experiment 4 (GFN medium), in which a fructose solution with a concentration of 4 g/L and a glycerol solution with a concentration of 1 g/L were added to the culture medium. The final biomasses obtained in these four experiments differ slightly from the results described by Poladyan et al. [17]. The mentioned authors obtained higher amounts of biomass and also concluded that the best medium for growth is the FNG medium, which ensures better growth due to the presence of both carbon sources. The difference in the results obtained is probably due to the different cultivation conditions and the adaptation of the bacteria to the carbon sources. This shows the importance of optimizing the cultivation conditions and the specificity of the genotypic variations of the R. eutropha H16 strains used in the study.
Figure 1b,c show the changes in the glycerol and fructose concentrations as a function of the cultivation time. In Experiment 1, the highest biomass growth was recorded between 75 and 145 h, which coincided with fructose consumption. In Experiment 2, the biomass increased between 96 and 145 h, which coincided with glycerol consumption. In Experiment 3, the biomass increased slightly throughout the experiment, but fructose was consumed slightly faster than glycerol. In Experiment 4, glycerol was barely consumed, while the fructose concentration gradually decreased during the process.

3.2. Kinetic Parameter Estimation and Mathematical Modelling

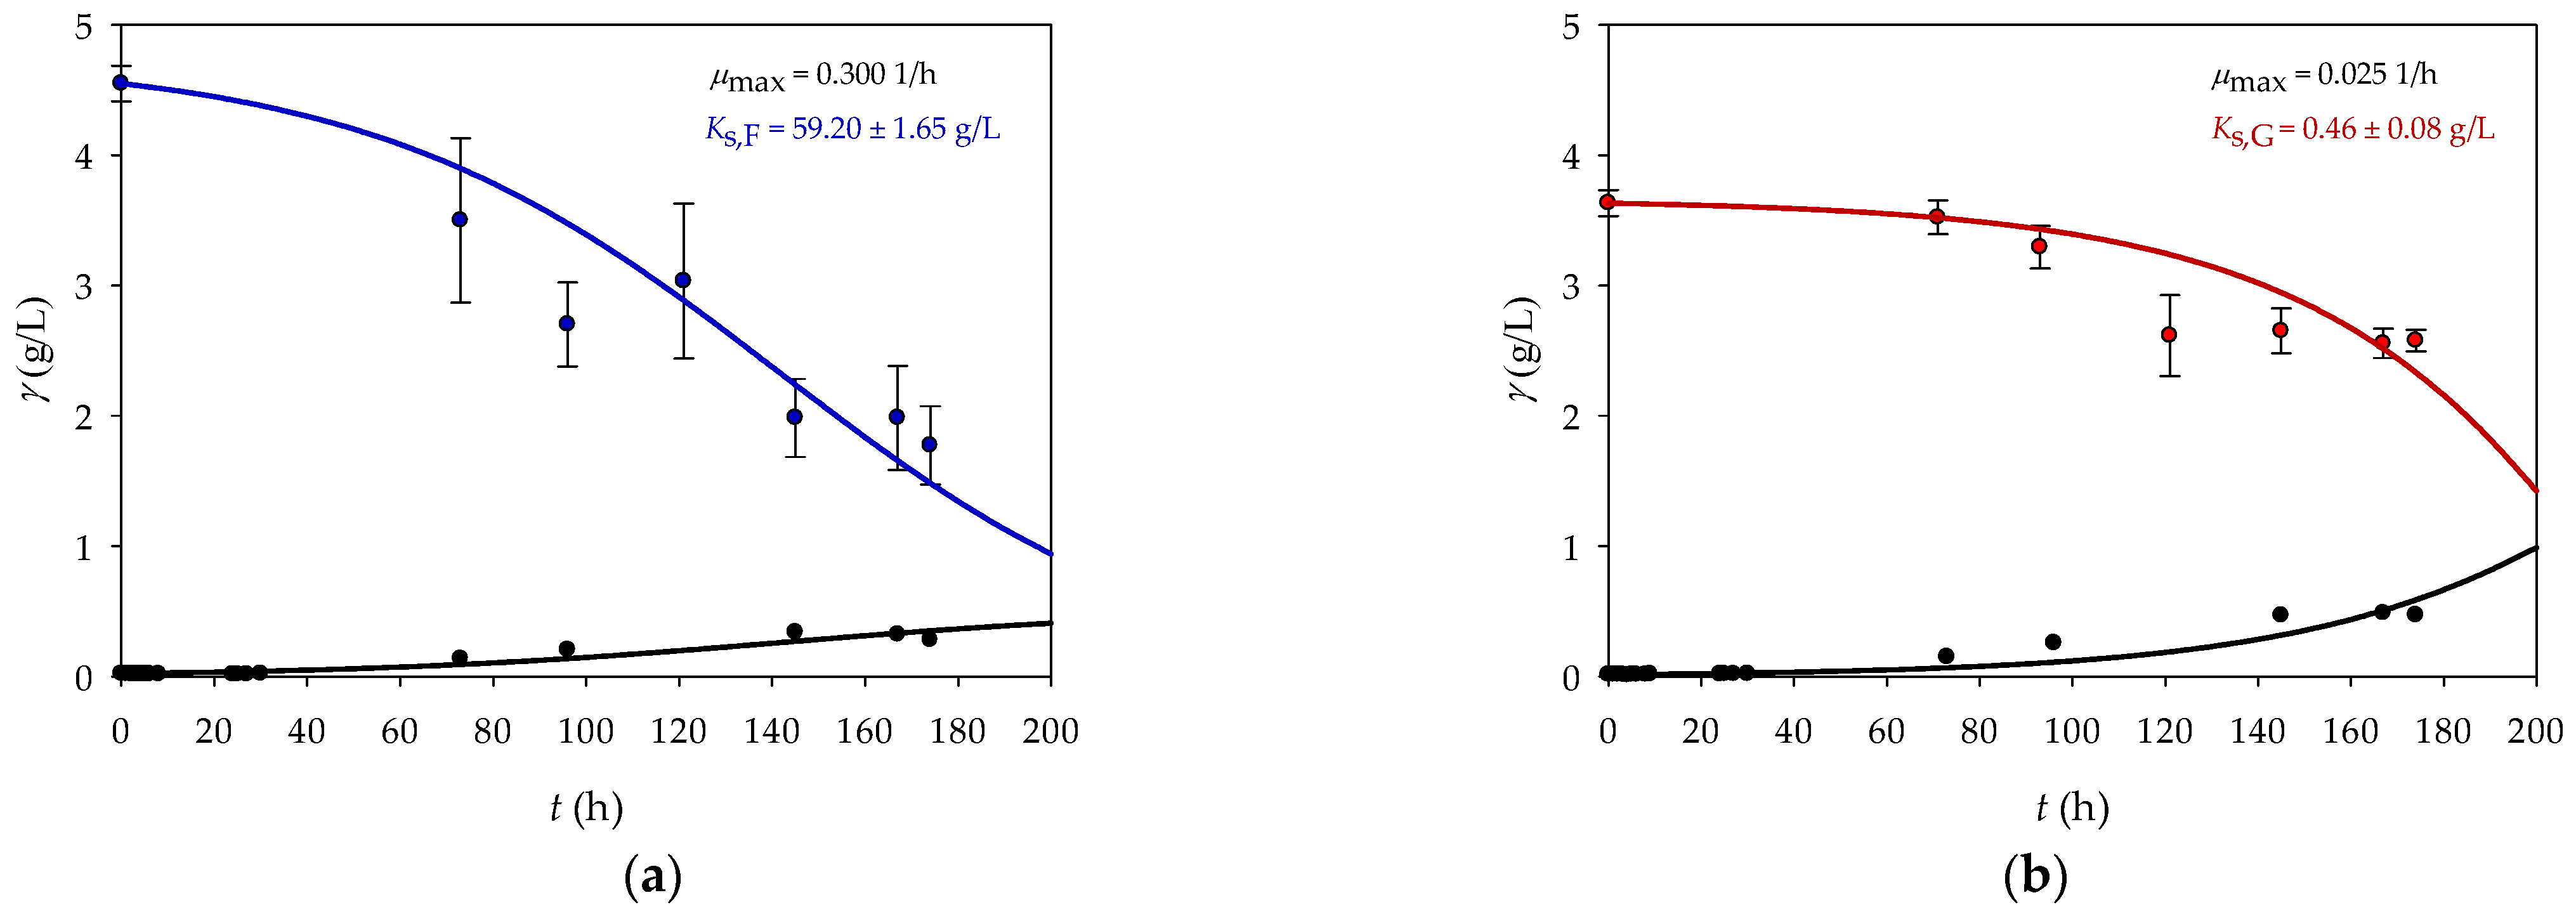
As already mentioned, in the work presented by Poladyan et al. [17], the authors confirmed that hydrogenases, MBH and SH, can be obtained by cultivating the biomass on medium containing glycerol and fructose, but they did not define the optimal reaction conditions for obtaining the maximal cell yield. For this purpose, a mathematical model was developed to analyse and compare the growth behaviour of R. eutropha H16 on two different substrates and to predict the growth efficiency under different conditions. Based on the changes in biomass and substrate concentrations (Figure 2), the KS parameter value was estimated using the Scientist software package (MicroMath® Scientist® for WindowsTM, Version 2.0, Salt Lake City, UT, USA) and a process model was created. The μ max values were taken from the study by Poladyan et al. [17].
The higher μ max value for fructose (0.300 1/h) indicates that R. eutropha H16 can grow faster on fructose than on glycerol (0.025 1/h). The results obtained are in agreement with the literature data [17] and transport mechanisms. As already mentioned, fructose is mainly transported into the cell via ABC transporters (membrane proteins) [27], whereas glycerol enters the cells by facilitated diffusion, which supports the very slow growth of R. eutropha H16 [24,25].
Conversely, the higher KS value for fructose suggests that R. eutropha H16 requires a relatively higher concentration of this substrate to reach half of its maximum growth rate, indicating a lower activity of R. eutropha H16 for fructose than for glycerol. Thus, while fructose allows R. eutropha H16 to grow faster when it is present in sufficient quantities, the microorganism has a lower affinity for it. On the other hand, R. eutropha H16 grows more slowly on glycerol, but has a higher affinity for it, which means that it can grow efficiently even at lower substrate concentrations [34].

3.3. Kinetic Parameter Sensitivity Analysis

To evaluate the importance of the kinetic parameters used, a sensitivity analysis (SA) of the kinetic parameters was carried out. The aim of an SA is to identify the critical inputs of a model and to quantify how the uncertainty of the inputs affects the model’s result(s) [35]. The results obtained are shown in Table 2, where the green colour represents a positive influence of parameter changes on the process, while the red colour stands for a negative influence.
As can be seen in the table, the impact of individual kinetic parameters on the process is influenced by the specific experimental conditions and the direction of the parameter changes. For instance, in Experiment 1, a 3% increase in the maximum specific growth rate (μmax) leads to a significant increase in the fructose concentration, indicating a strong correlation between the growth rate and substrate utilization under these conditions. Conversely, in Experiment 3, the same increase in μmax has no significant effect on fructose levels, suggesting that other factors may be limiting or that the system behaves differently with different substrate concentrations.
In addition, decreasing the half-saturation constant (KS,F) by 3% results in a pronounced positive effect on the fructose concentration across the experiments. This implies that lower KS,F values enhance the affinity of the organism for fructose, thereby improving substrate uptake and conversion efficiency. In contrast, an increase in KS,F has a detrimental effect, indicating a reduced uptake rate and suggesting that higher half-saturation constants may hinder the metabolic process.
The data also shows that variations in these kinetic parameters have greater impacts on the fructose and biomass concentrations than on the glycerol levels. This trend underscores the relative importance of managing fructose parameters to optimize the overall process. By determining which parameters have the greatest impacts, this information becomes instrumental for future optimization efforts and allow for targeted adjustments that can lead to improved yield and efficiency in biohydrogen production. The results thus highlight critical areas for further investigation and the tuning of parameters in subsequent experiments.

3.4. Model Validation

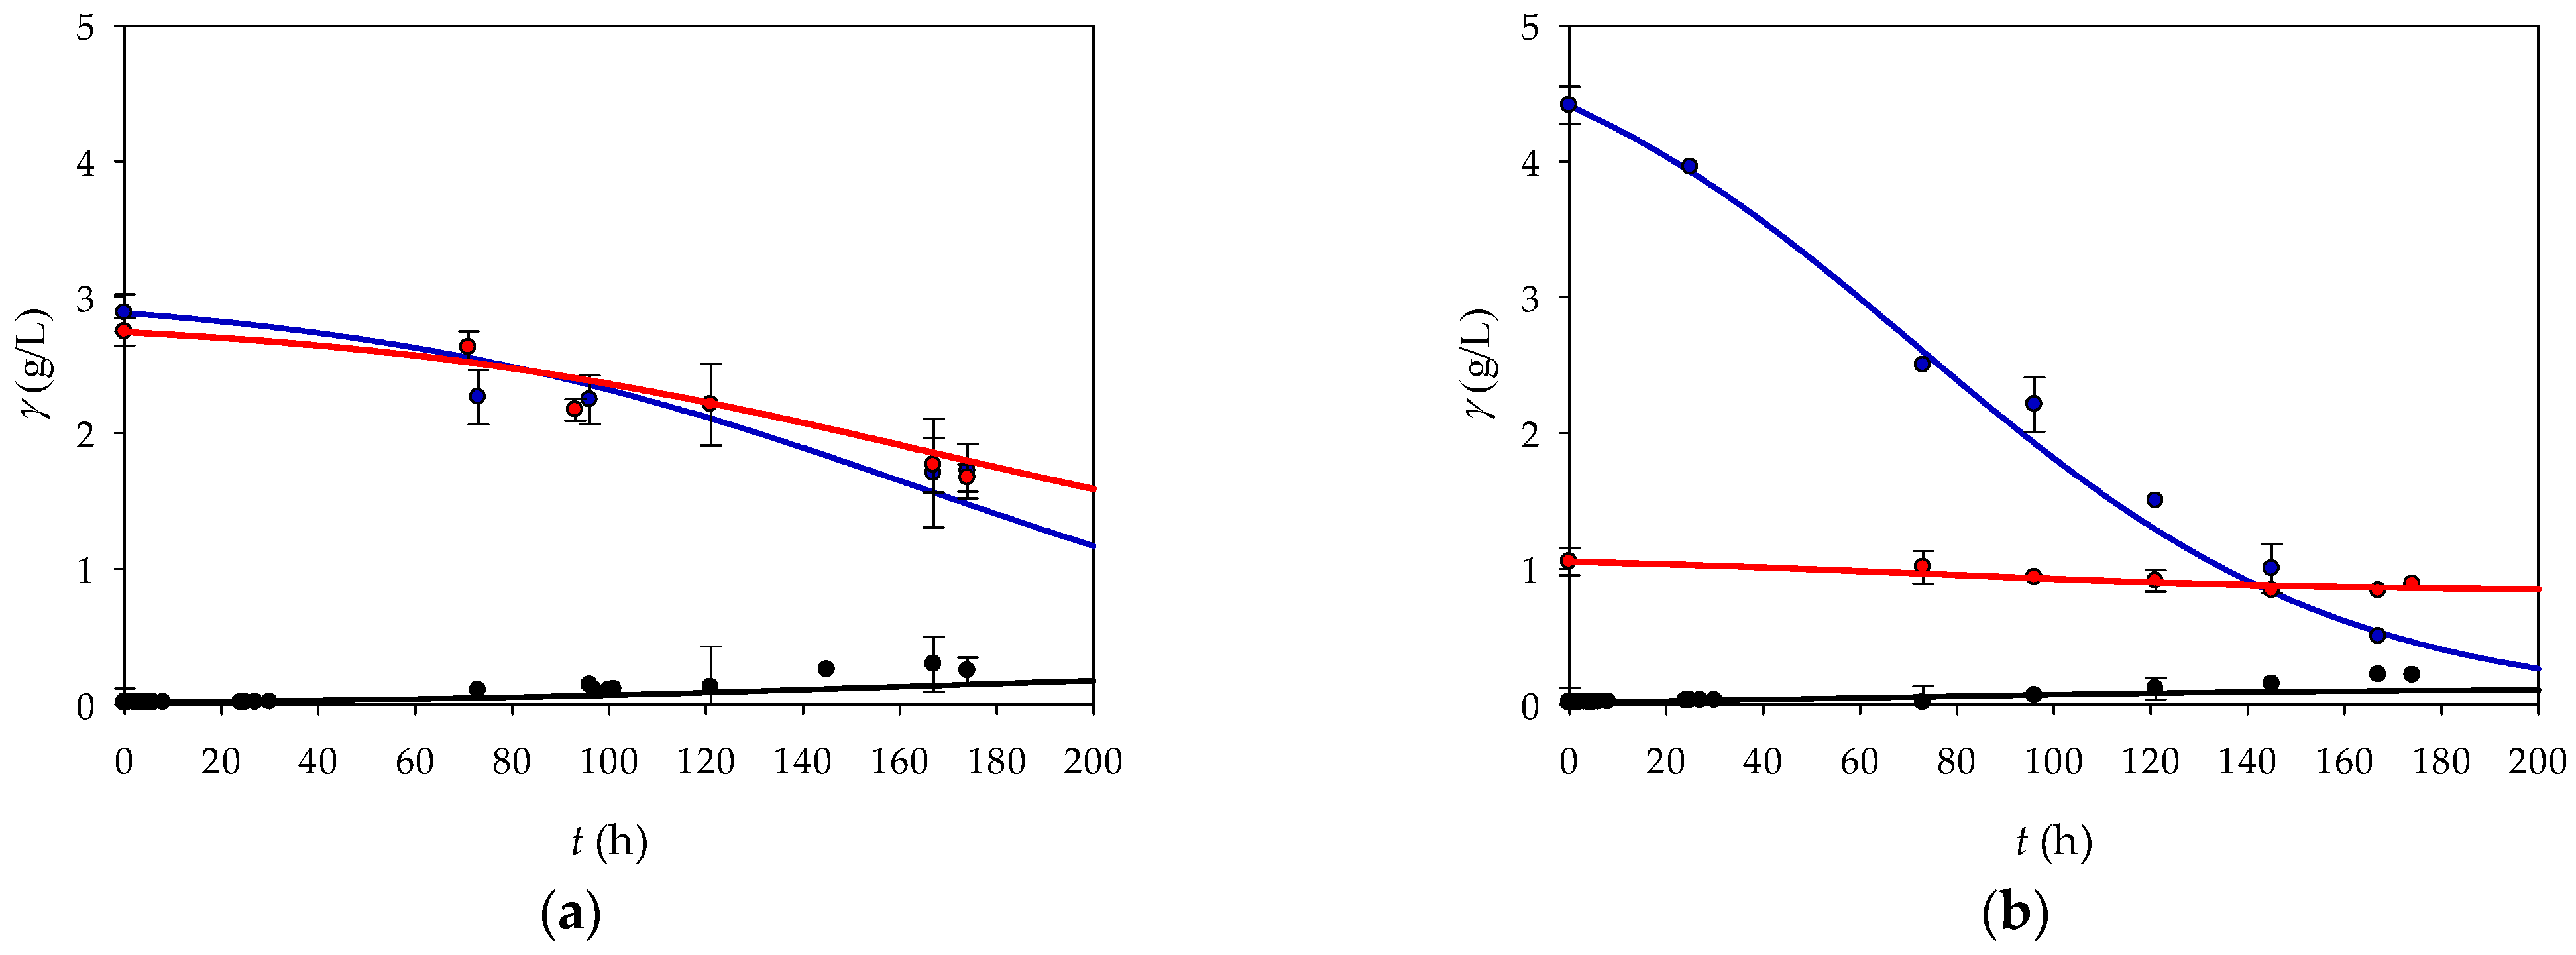
After estimating and evaluating the kinetic parameters, a mathematical model for bacterial growth on both substrates in a batch reactor was proposed. Before the model could be used for process optimization, it had to be validated. The validation was based on the experimental data obtained from two independent experiments with both substrates and different initial concentrations. A statistical analysis was then performed to evaluate the accuracy and reliability of the model’s prediction. As can be seen in Figure 3 and Table 3, the proposed model describes all experimental data very well.
In all experiments, the coefficients of determination between the experimental data and the predicted data are above 0.830 (Table 3), indicating good agreement. In addition, the RMSE, MAE, and MSE are very low, indicating the high accuracy of the model’s predictions. However, there are subtle differences between the models that deserve more detailed analysis.
In Experiment 3, the model for fructose showed relatively good agreement with an R2 value of 0.917 and an R2adj of 0.830. These values indicate that the model agrees well with the observed growth rate on this substrate. However, the error metrics show areas where the model captures the general trend but has some discrepancies between the predicted and actual values with RMSE (0.246) and MAE (0.177). The models for glycerol and the biomass also showed high R2 values (0.947 and 0.887) in combination with low RMSEs and MSEs, indicating that these models were not only well-fitted but also provided predictions with minimal deviations from the experimental data. In contrast, Experiment 4 showed mixed performance. Although the model for fructose had a high R2 value of 0.947, similar to Experiment 3, the higher RMSE and MAE suggested that the predictions were less consistent. The models for glycerol and biomass in Experiment 4 had slightly lower R2 values, but very low RMSE and MSE values, indicating an accurate and reliable prediction despite a less pronounced fit. Overall, the data obtained indicate that the proposed model can be used for process optimization.

3.5. Cultivation Condition Optimization

3.5.1. Optimization of the Initial Substrate and Biomass Concentrations

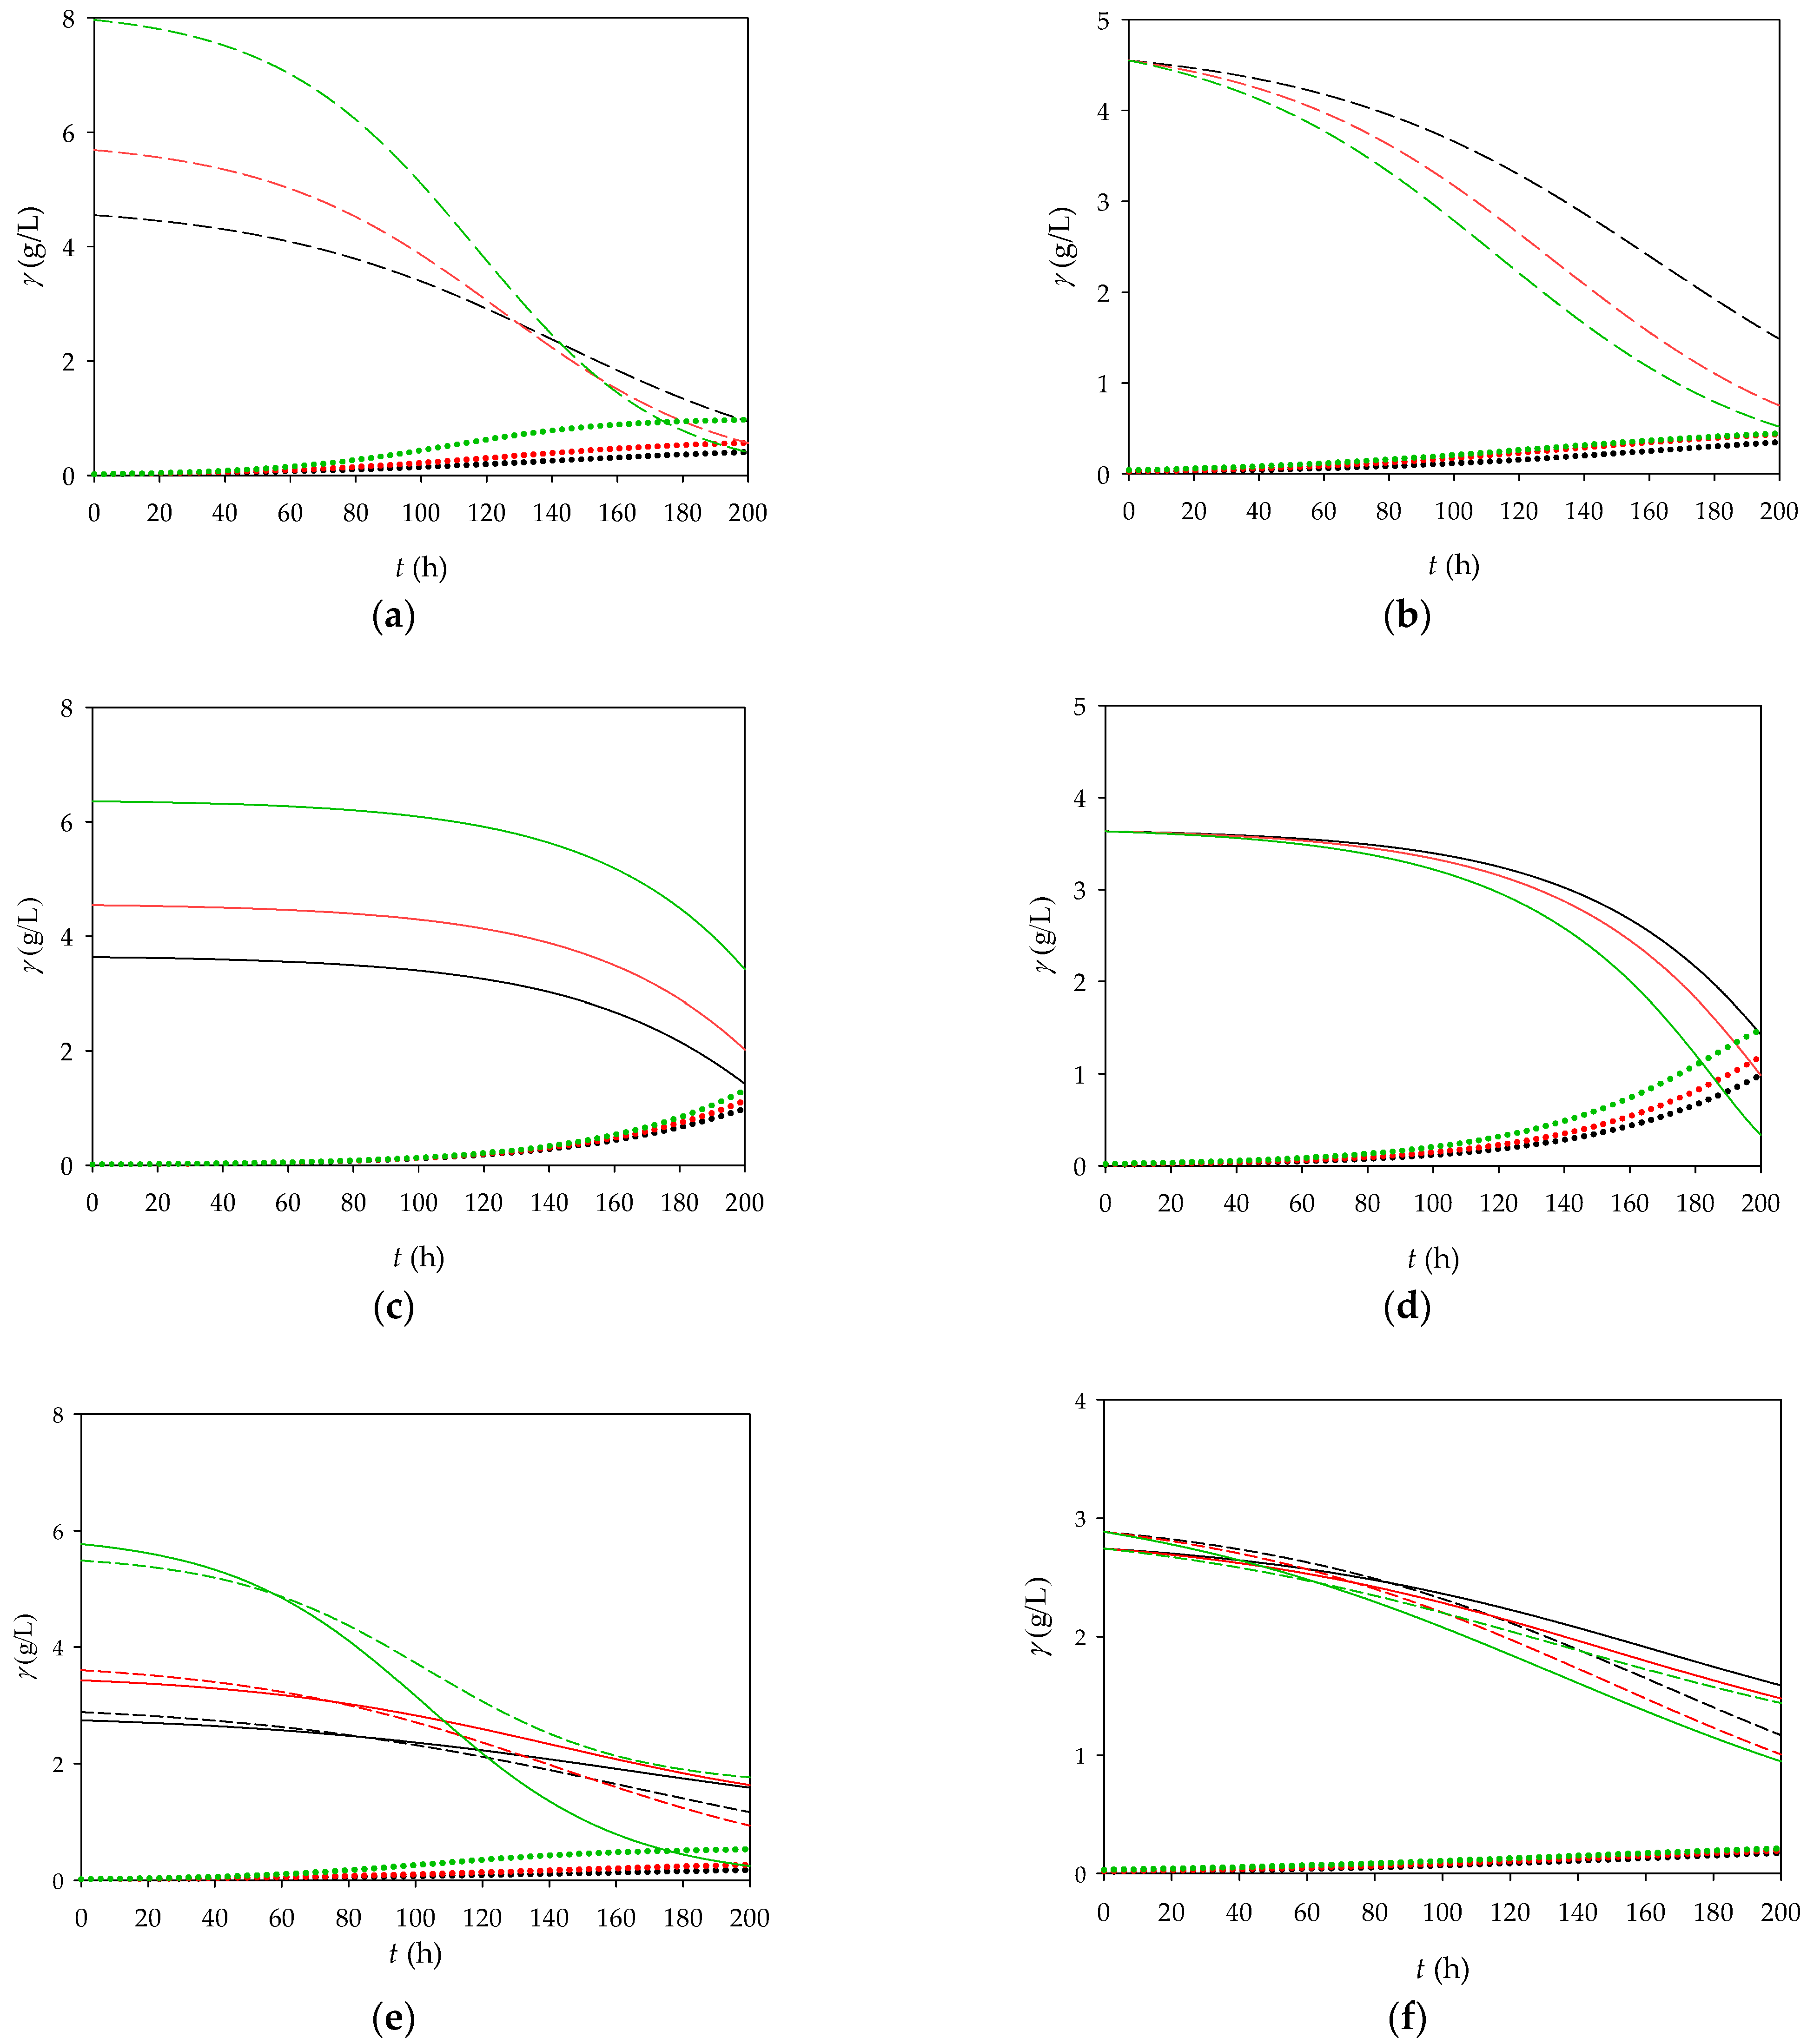
In the next step (Figure 4), the proposed and validated model was used for further process optimization in which the influences of the initial concentrations of biomass, fructose (4 g/L) and glycerol (4 g/L) on the final biomass concentration were investigated.
According to the mathematical model, increases in both the initial fructose concentration and the biomass concentration (increase of 25 and 75%, respectively) have positive effects on the biomass concentration at the end of the process. In the simulations with glycerol as substrate, the same trend was observed as for fructose, which means that an increase in the glycerol concentration (increase of 25 and 75%) also has a positive effect on the final biomass concentration. Compared to the medium in which fructose is used as a substrate, the model predicts that almost the same biomass concentration is produced with glycerol as a substrate. In the simulations carried out with glycerol and fructose as substrates, it was found that 46% less biomass is produced than in the process carried out with single substrate. This result was also confirmed experimentally, where 38% less biomass was obtained when the process was carried out with two substrates. The fact that the use of both substrates together led to a significant reduction in biomass production indicates a lack of synergy. This could indicate competition between the substrates, inhibition of metabolism, or inefficient processing when both are present in the medium and should be further investigated to optimize the system.

3.5.2. Reactor Optimization

Previous experiments have been carried out in batch reactors, but there are also alternative cultivation methods, such as fed-batch reactors and continuous stirred tank reactors (CSTRs). In batch cultivation, high initial substrate concentrations can have a negative effect on bacterial growth due to possible substrate inhibition. Fed-batch reactors on the other hand allow substrates to be added gradually to provide optimal conditions and improve the process efficiency without high substrate concentrations inhibiting growth [36,37,38]. Fed-batch reactors are generally more efficient for bacterial cultivation as they prevent the dilution of the biomass, a common problem in CSTRs. To fully evaluate these systems, models were developed for both fed-batch reactor and CSTR processes and their performance was compared to that of batch reactors to determine the most effective method for R. eutropha H16 growth.
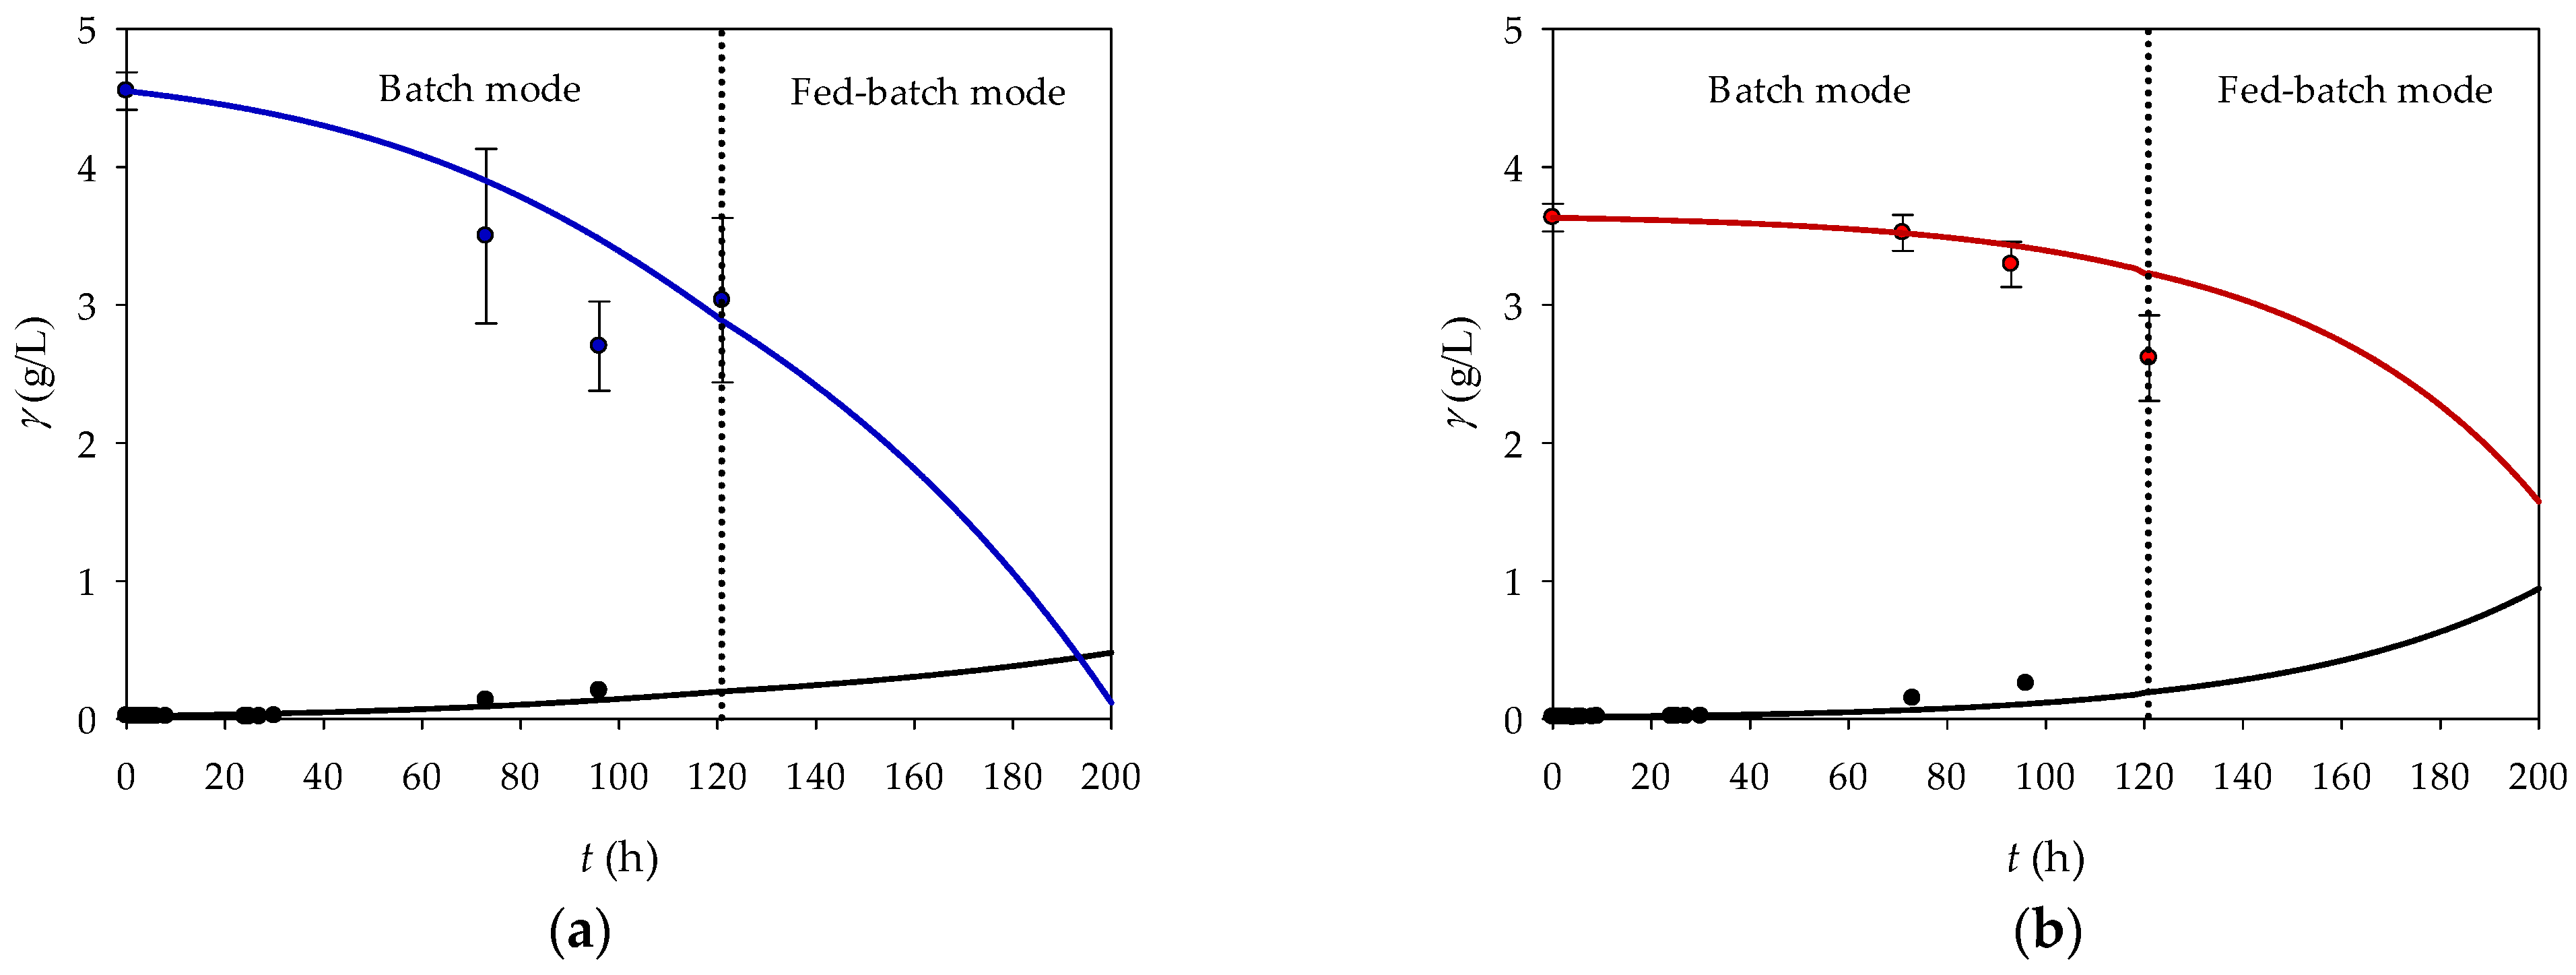
Figure 5 shows the dynamic changes in the microbial biomass, fructose, and glycerol concentrations over time. It was proposed to run the reaction as a batch cultivation until a certain time point (121 h), after which the substrate concentrations start to decrease. At this point, the feed would be activated with 4 g/L substrate to keep the substrate concentration constant in a reactor volume of 0.2 L. The theoretical feed rate (10.45 µL/min and 7.00 µL/min) was determined based on the consumption rates of fructose (6.3 mg/L·h) and glycerol (8.4 mg/L·h). The results show that the fed-batch reactor is more efficient than the batch reactor, with a biomass concentration of 0.479 g/L on the fructose medium and 0.944 g/L on the glycerol medium under fed-batch conditions after 200 h.
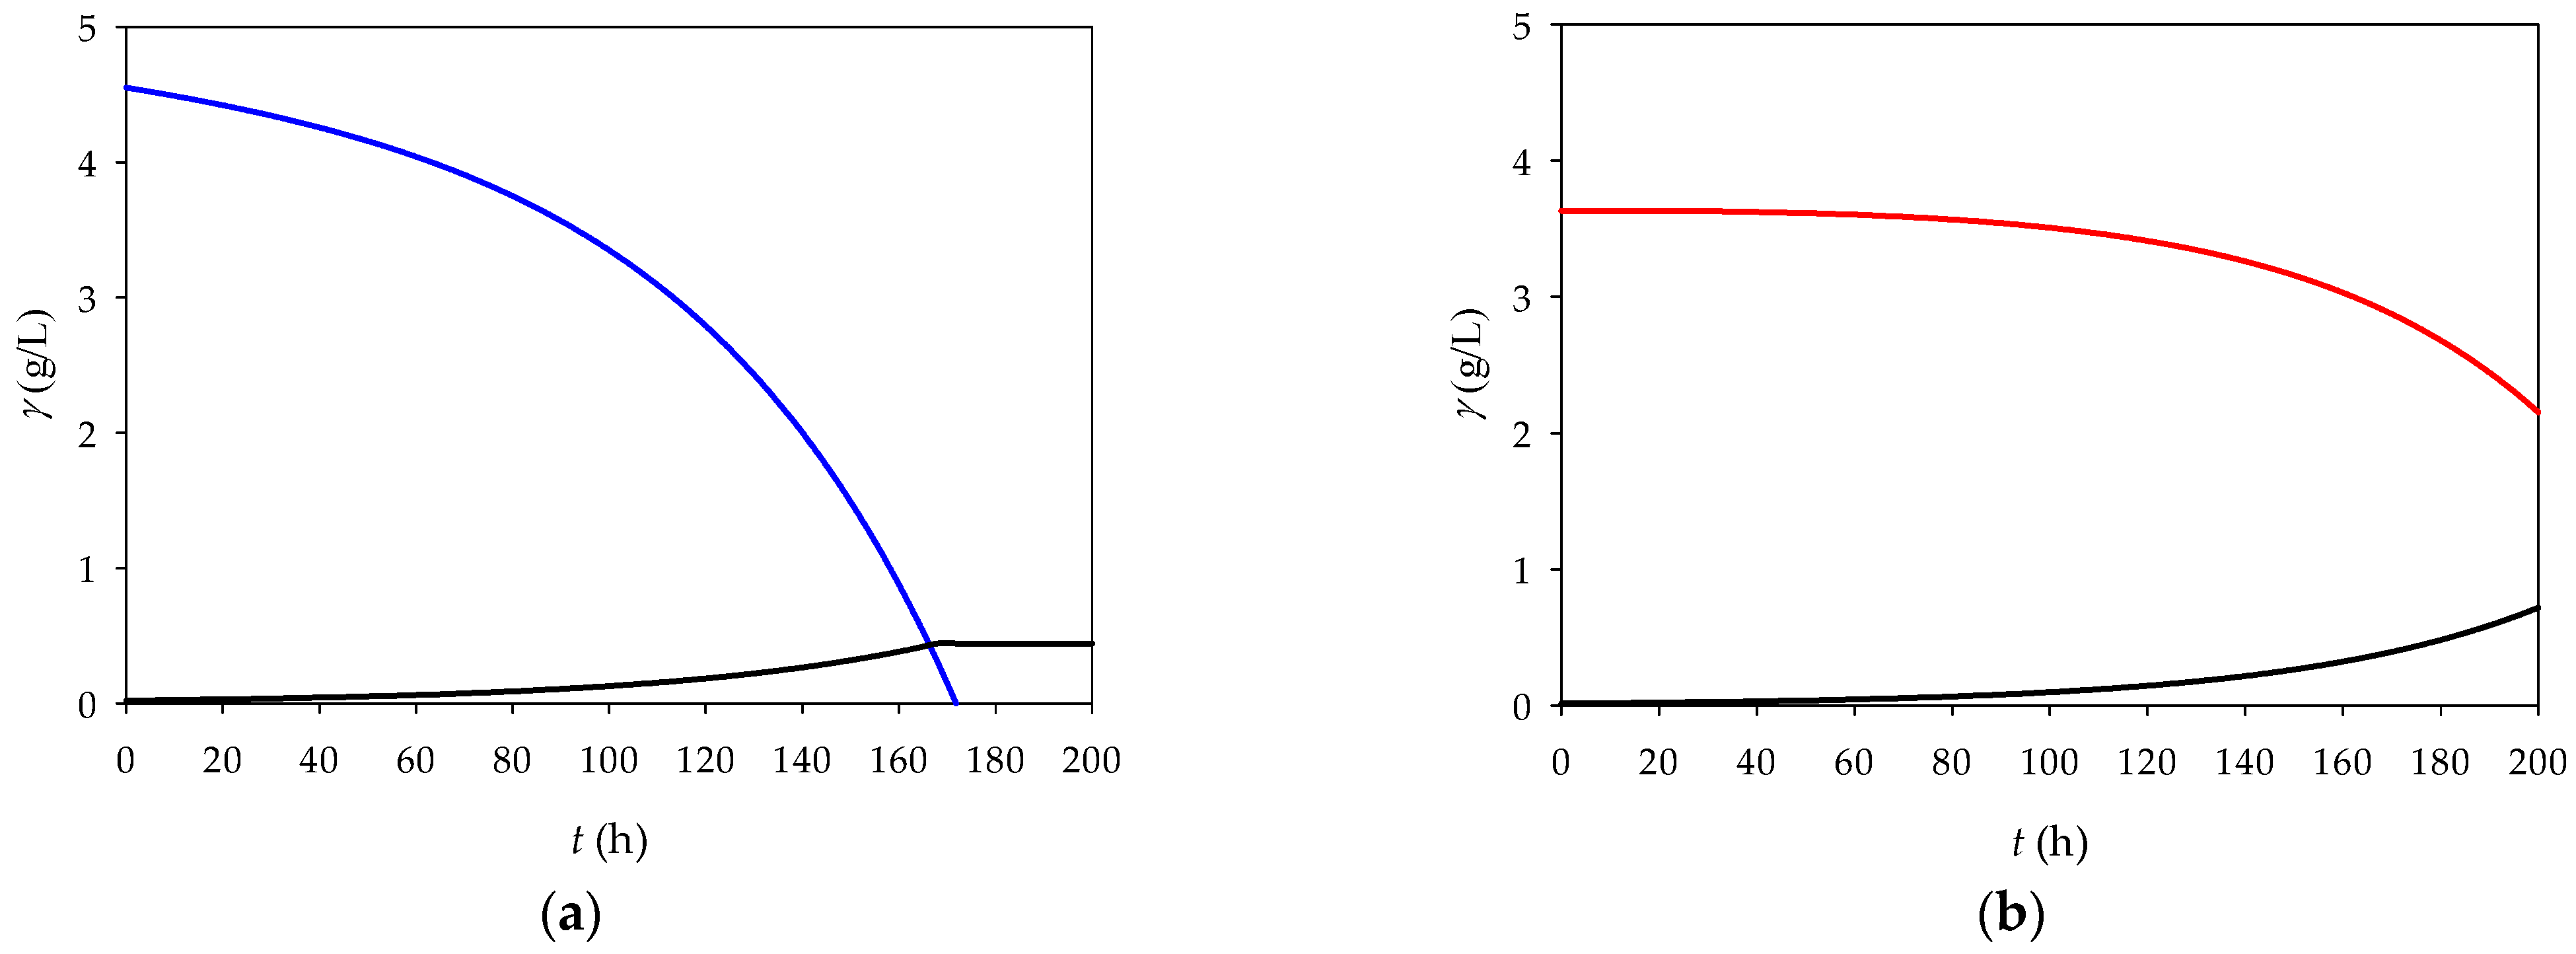
As expected, the CSTR showed lower biomass production with both fructose and glycerol (Figure 6) due to continuous dilution over time, which limits the cell concentration. Therefore, the CSTR will not be considered for future research.

4. Conclusions

The cultivation of R. eutropha H16 was successfully carried out on four different media containing either fructose, glycerol, or a combination of both. The results showed that all media were suitable for the growth of the microbial biomass. However, glycerol proved to be the most effective substrate, yielding the highest biomass concentration of γX = 0.484 g/L after 174 h of cultivation. A similar biomass concentration was achieved with fructose as substrate (γF = 0.337 g/L), while significantly lower biomass values were observed in experiments where both glycerol and fructose were used as substrates.
To better understand the process, a mathematical model was developed to predict the behaviour of the cultivation process under different conditions and to optimize the process. To check whether the model was accurate, reliable, and consistent with the experimental data, it was validated using the results of two independent experiments. Due to the good agreement between the mathematical model and the experimental results, the model was used to optimize the cultivation. A series of calculations were performed by increasing and decreasing the initial substrate and biomass concentrations to determine the effects on the final biomass. The predictions of the mathematical model suggest that the experiment should be carried out as a monosubstrate process (preferably glycerol) with higher substrate concentrations to achieve a higher biomass concentration. According to the mathematical model, the biomass concentration after 200 h at γG = 6.358 g/L should be γX = 1.311 g/L. In addition, calculations were performed for three different reactors, with the most successful reactor being the fed-batch reactor with a biomass concentration of γX = 0.944 g/L after 200 h of cultivation.
Based on the above, future research will focus on defining the optimal growth conditions by changing the initial substrate concentration using the models developed in this research. In addition, future research should prioritize the use of lignocellulose as a susceptible substrate for biohydrogen production, taking into account the main challenges and opportunities in this area.
Author Contributions

Conceptualization, A.Š., A.J.T. and R.V.; methodology, A.Š. and A.J.T.; software, R.V. and A.J.T.; validation, A.Š., A.J.T. and R.V.; formal analysis, A.Š., A.J.T. and R.V.; investigation, A.Š., A.J.T. and R.V.; resources, B.Z.; data curation, A.Š., A.J.T. and R.V.; writing—original draft preparation, R.V.; writing—review and editing, A.Š., A.J.T. and B.Z.; visualization, A.Š., A.J.T. and R.V.; supervision, B.Z.; project administration, B.Z.; funding acquisition, B.Z. All authors have read and agreed to the published version of the manuscript.

Funding

This research was funded by Croatian Science Foundation (HRZZ), grant numbers IP-2022-10-2175 and DOK-NPOO-2023-10-3890.

Institutional Review Board Statement

Not applicable.

Informed Consent Statement

Not applicable.

Data Availability Statement

Data will be available on request.

Conflicts of Interest

The authors declare no conflict of interest.

References

  1. Canuto, E.; Mazza, D. Fossil fuel reserves and depletion: Can they comply with CO2-emission pledges and targets. Acad. Lett. 2022, 2, 1–12. [Google Scholar] [CrossRef]
  2. Jeswani, H.K.; Chilvers, A.; Azapagic, A. Environmental sustainability of biofuels: A review. Proc. R. Soc. A 2020, 476, 20200351. [Google Scholar] [CrossRef]
  3. Gupta, S.; Fernandes, A.; Lopes, A.; Grasa, L.; Salafranca, J. Photo-Fermentative Bacteria Used for Hydrogen Production. Appl. Sci. 2024, 14, 1191. [Google Scholar] [CrossRef]
  4. Show, K.Y.; Yan, Y.G.; Lee, D.J. Biohydrogen Production: Status and Perspectives. In Biofuels: Alternative Feedstocks and Conversion Processes for the Production of Liquid and Gaseous Biofuels, 2nd ed.; Pandey, A., Larroche, C., Dussap, C.G., Gnansounou, E., Khanal, S.K., Ricke, S., Eds.; Academic Press: Cambridge, MA, USA, 2019; Volume 2, pp. 693–713. [Google Scholar] [CrossRef]
  5. Mattiello-Francisco, L.; Ferreira, F.V.; Peixoto, G.; Mockaitis, G.; Zaiat, M. Hydrogen Production from Sugarcane Bagasse Pentose Liquor Fermentation Using Different Food/Microorganism and Carbon/Nitrogen Ratios under Mesophilic and Thermophilic Conditions. Fermentation 2024, 10, 432. [Google Scholar] [CrossRef]
  6. Albuquerque, M.M.; Sartor, G.d.B.; Martinez-Burgos, W.J.; Scapini, T.; Edwiges, T.; Soccol, C.R.; Medeiros, A.B.P. Biohydrogen Produced via Dark Fermentation: A Review. Methane 2024, 3, 500–532. [Google Scholar] [CrossRef]
  7. Mona, S.; Kumar, S.S.; Kumar, V.; Parveen, K.; Saini, N.; Deepak, B.; Pugazhendhi, A. Green technology for sustainable biohydrogen production (waste to energy): A review. Sci. Total Environ. 2020, 728, 138481. [Google Scholar] [CrossRef]
  8. Sindhu, R.; Binod, P.; Pandey, A.; Gnansounou, E. Agroresidue-based biorefineries. In Refining Biomass Residues for Sustainable Energy and Bioproducts; Praveen Kumar, R., Gnansounou, E., Raman, J.K., Baskar, G., Eds.; Academic Press: Cambridge, MA, USA, 2020; Volume 1, pp. 243–258. [Google Scholar] [CrossRef]
  9. Hutsol, T.; Glowacki, S.; Tryhuba, A.; Kovalenko, N.; Pustova, Z.; Rozkosz, A.; Sukmaniuk, O. Current Trends of Biohydrogen Production from Biomass—Green Hydrogen; Monograph; Libra-Print: Łomża, Poland, 2021. [Google Scholar] [CrossRef]
  10. Scheller, F.; Schubert, F. Metabolism Sensors. In Techniques and Instrumentation in Analytical Chemistry; Schelfer, F., Schubert, F., Eds.; Elsevier: Amsterdam, The Netherlands, 1992; Volume 11, p. 85. [Google Scholar] [CrossRef]
  11. Bauer, J.A.; Zámocká, M.; Majtán, J.; Bauerová-Hlinková, V. Glucose Oxidase, an Enzyme “Ferrari”: Its Structure, Function, Production and Properties in the Light of Various Industrial and Biotechnological Applications. Biomolecules 2022, 12, 472. [Google Scholar] [CrossRef]
  12. Lauterbach, L.; Lenz, O.; Vincent, K.A. H2-driven cofactor regeneration with NAD(P)+-reducing hydrogenases. FESB J. 2013, 280, 3058–3068. [Google Scholar] [CrossRef]
  13. Xuan, J.; He, L.; Wen, W.; Feng, Y. Hydrogenase and Nitrogenase: Key Catalysts in Biohydrogen Production. Molecules 2023, 28, 1392. [Google Scholar] [CrossRef]
  14. Kim, D.H.; Kin, M.S. Hydrogenases for biological hydrogen production. Bioserour. Technol. 2011, 102, 8423–8431. [Google Scholar] [CrossRef]
  15. Vignais, P.M.; Billoud, B. Occurrence, Classification, and Biological Function of Hydrogenases:  An Overview. Chem. Rev. 2007, 107, 4206–4272. [Google Scholar] [CrossRef]
  16. Hoekstra, A.S.; Bayley, J.P. The role of complex II in disease. Biochim. Biophys. Acta 2013, 1827, 543–551. [Google Scholar] [CrossRef] [PubMed]
  17. Poladyan, A.; Blbulyan, S.; Sahakyan, M.; Lenz, O.; Trchounian, A. Growth of the facultative chemolithoautotrophy Ralstonia eutropha on organic waste materials: Growth characteristics, redox regulation and hydrogenase activity. Microb. Cell Fact. 2019, 18, 201. [Google Scholar] [CrossRef]
  18. Božinović, M.; Sokač, T.; Šalić, A.; Dukarić, A.; Tišma, M.; Planinić, M.; Zelić, B. Standardization of 3,5-dinitrosalicylic acid (DNS) assay for measuring xylanase activity: Detecting and solving problems. Croat. J. Food Sci. Technol. 2023, 15, 151–162. [Google Scholar] [CrossRef]
  19. Šalić, A.; Faletar, P.; Zelić, B. NAD+ Regeneration in a Microreactor Using Permeabilized Baker’s Yeast Cells. Biochem. Eng. J. 2013, 77, 88–96. [Google Scholar] [CrossRef]
  20. Zi, Z. Sensitivity analysis approaches applied to systems biology models. IET Syst. Biol. 2011, 5, 336–346. [Google Scholar] [CrossRef]
  21. Qian, G.; Mahdi, A. Sensitivity analysis methods in the biomedical sciences. Math. Biosci. 2020, 323, 108306. [Google Scholar] [CrossRef]
  22. Marino, S.; Hogue, I.B.; Ray, C.J.; Kirschner, D.E. A methodology for performing global uncertainty and sensitivity analysis in systems biology. J. Theor. Biol. 2008, 254, 178–196. [Google Scholar] [CrossRef]
  23. Jugder, B.E.; Chen, Z.; Oing, D.T.; Lebhar, H.; Welch, J.; Marquis, C.P. An analysis of the changes in soluble hydrogenase and global gene expression in Cupriavidus necator (Ralstonia eutropha) H16 grown in heterotrophic diauxic batch culture. Microb. Cell Fact. 2015, 14, 42. [Google Scholar] [CrossRef]
  24. Cavalheiro, J.M.B.T.; Raposo, R.S.; de Almeida, M.D.; Cesario, M.T.; Sevrin, C.; Grandfils, C.; da Fonseca, M.M.R. Effect of cultivation parameters on the production of poly(3-hydroxybutyrate-co-4-hydroxybutyrate) and poly(3-hydroxybutyrate-4-hydroxybutyrate-3-hydroxyvalerate) by Cupriavidus necator using waste glycerol. Bioresour. Technol. 2012, 111, 391–397. [Google Scholar] [CrossRef]
  25. Fukui, T.; Mukoyama, M.; Orita, I.; Nakamura, S. Enhancement of glycerol utilization ability of Ralstonia eutropha H16 for production of polyhydroxyalkanoates. Appl. Microbiol. Biotechnol. 2014, 98, 7559–7568. [Google Scholar] [CrossRef]
  26. Grunwald, S.; Mottet, A.; Grousseau, E.; Plassmeier, J.K.; Popovic, M.K.; Uribelarrea, J.L.; Gorret, N.; Guillouet, S.E.; Sinskey, A. Kinetic and stoichiometric characterization of organoautotrophic growth of Ralstonia eutropha on formic acid in fed-batch and continuous cultures. Microb. Biotechnol. 2014, 8, 155–163. [Google Scholar] [CrossRef] [PubMed]
  27. Pohlmann, A.; Fricke, W.F.; Reinecke, F.; Kusian, B.; Liesegang, H.; Cramm, R.; Eitinger, T.; Ewering, C.; Pötter, M.; Schwartz, E.; et al. Genome sequence of the bioplastic-producing “Knallgas” bacterium Ralstonia eutropha H16. Nat. Biotechnol. 2006, 24, 1257–1262. [Google Scholar] [CrossRef] [PubMed]
  28. Trchounian, K.; Sawers, R.G.; Trchounian, A. Improving biohydrogen productivity by microbial dark- and photo fermentations: Novel data and future approaches. Renew. Sust. Energ. Rev. 2017, 80, 1201–1216. [Google Scholar] [CrossRef]
  29. Buffington, J. The economic potential of Brewer’s Spent Grain (BSG) as a biomass feedstock. Adv. Chem. Eng. Sci. 2014, 4, 308–318. [Google Scholar] [CrossRef]
  30. Muthusamy, N. Chemical composition of brewers spent grain. Int. J. Sci. Environ. Technol. 2014, 3, 2109–2112. [Google Scholar]
  31. Jönsson, J.L.; Martín, C. Pretreatment of lignocellulose: Formation of inhibitory by-products and strategies for minimizing their effects. Bioresour. Technol. 2016, 199, 103–112. [Google Scholar] [CrossRef]
  32. Jugder, B.E.; Lebhar, H.; Aguey-Zinsou, K.F.; Marquis, C.P. Production and purification of a soluble hydrogenase from Ralstonia eutropha H16 for potential hydrogen fuel cell applications. MethodsX 2016, 3, 242–250. [Google Scholar] [CrossRef]
  33. Schwartz, E.; Voigt, B.; Zühlke, D.; Pohlmann, A.; Lenz, O.; Albrecht, D.; Schwarze, A.; Kohlmann, Y.; Krause, C.; Hecker, M.; et al. A proteomic view of the facultatively chemolithoautotrophic lifestyle of Ralstonia eutropha H16. Proteomics 2009, 9, 5132–5142. [Google Scholar] [CrossRef]
  34. Zentou, H.; Zainal Abidin, Z.; Yunus, R.; Awang Biak, D.R.; Zouanti, M.; Hassani, A. Modelling of Molasses Fermentation for Bioethanol Production: A Comparative Investigation of Monod and Andrews Models Accuracy Assessment. Biomolecules 2019, 9, 308. [Google Scholar] [CrossRef]
  35. Sysoev, A. Sensitivity Analysis of Mathematical Models. Computation 2023, 11, 159. [Google Scholar] [CrossRef]
  36. Fan, Q.; Caserta, G.; Lorent, C.; Lenz, O.; Neubauer, P.; Gimpel, M. Optimization of Culture Conditions for Oxygen-Tolerant Regulatory [NiFe]-Hydrogenase Production from Ralstonia eutropha H16 in Escherichia coli. Microorganisms 2021, 9, 1195. [Google Scholar] [CrossRef] [PubMed]
  37. Jiang, G.; Hill, D.J.; Kowalczuk, M.; Johnston, B.; Adamus, G.; Irorere, V.; Radecka, I. Carbon Sources for Polyhydroxyalkanoates and an Integrated Biorefinery. Int. J. Mol. Sci. 2016, 17, 1157. [Google Scholar] [CrossRef] [PubMed]
  38. Yu, S.T.; Lin, C.C.; Too, J.R. PHBV production by Ralstonia eutropha in a continuous stirred tank reactor. Process Biochem. 2005, 40, 2729–2734. [Google Scholar] [CrossRef]
Figure 1. Dynamic changes in the concentrations of (a) the biomass, (b) glycerol, and (c) fructose during the cultivation of R. eutropha H16 ( Experiment 1—γF,0 = 4 g/L, ● Experiment 2—γG,0 = 4 g/L, Experiment 3—γF,0 = 2 g/L and γG,0 = 2 g/L, Experiment 4—γF,0 = 4 g/L and γG,0 = 1 g/L) (pH 7, T = 30 °C, and 120 rpm).
Sustainability 16 10650 g001
Figure 2. Dynamic changes in the biomass concentration (●) in media containing (a) fructose () and (b) glycerol () (▬ mathematical model) (pH 7, T = 30 °C, and 120 rpm).
Sustainability 16 10650 g002
Figure 3. Dynamic changes in the biomass concentration (●) in media containing (a) fructose () and (b) glycerol () (▬ mathematical model) (pH 7, T = 30 °C, and 120 rpm).
Sustainability 16 10650 g003
Figure 4. The influences of the initial concentrations of (a) fructose (γX,0 = 0.021 g/L, green: γF,0 = 7.96 g/L, red: γF,0 = 5.69 g/L; black: γF,0 = 4.45 g/L), (b) biomass (γF,0 = 4.55 g/L, green: γX,0 = 0.032 g/L, red: γX,0 = 0.026 g/L; black: γX,0 = 0.021 g/L), (c) glycerol (γX,0 = 0.021 g/L, green: γG,0 = 6.36 g/L, red: γG,0 = 4.54 g/L; black: γG,0 = 3.63 g/L), (d) biomass (γG,0 = 0.02 g/L, green: γX,0 = 0.019 g/L, red: γX,0 = 0.016 g/L; black: γX,0 = 0.013 g/L), (e) fructose and glycerol (γX,0 = 0.02 g/L, green: γF,0 = 5.49 g/L, γG,0 = 5.77 g/L, red: γF,0 = 3.43 g/L, γG,0 = 3.61 g/L; black: γF,0 = 2.75 g/L, γG,0 = 2.89 g/L), and (f) biomass (γF,0 = 2.88 g/L, γX,0 = 2.74 g/L, green: γX,0 = 0.032 g/L, red: γX,0 = 0.020 g/L; black: γX,0 = 0.016 g/L) on the change in the biomass concentration in the medium (▬ (glycerol), – – (fructose) and ● (biomass) represents results of mathematical model simulations).
Sustainability 16 10650 g004
Figure 5. Dynamic changes in the concentrations of (a) fructose () and the microbial biomass (●), and (b) glycerol () and the microbial biomass (●) in the fed-batch reactor (▬ mathematical model) (pH 7, T = 30 °C, and 120 rpm).
Sustainability 16 10650 g005
Figure 6. Dynamic changes in the concentrations of (a) fructose () and the microbial biomass (▬), and (b) glycerol () and the microbial biomass (▬) in the CSTR, as described by the mathematical model.
Sustainability 16 10650 g006
Table 1. Volumes and initial concentrations of fructose and glycerol used for the cultivation of R. eutropha H16.
Growth Medium γF,0, g/LγG,0, g/L
Fructose–Nitrogen (FN)Experiment 14-
Glycerol–Nitrogen (GN)Experiment 2-4
Fructose–Glycerol–Nitrogen (FGN)Experiment 322
Glycerol–Fructose–Nitrogen (GFN)Experiment 441
Table 2. Sensitivity analysis of the estimated parameters.
Exp.Kinetic Parameter3% Increase in the Parameter Value 3% Decrease in the Parameter Value
BiomassFructoseGlycerolBiomassFructoseGlycerol
1µmax
KS,F
YX/F
2µmax
KS,G
YX/G
3µmax
KS,F
YX/F
KS,G
YX/G
4µmax
KS,F
YX/F
KS,G
YX/G
−6000−5000−4000−3000−2000−10000100020003000400050006000
Negative influenceNo influencePositive influence
Table 3. Coefficients of determination (R2), root mean square error (RMSE), mean absolute error (MAE), and mean square error (MSE) for the comparison of the experimental data and data predicted by the mathematical model.
R2R2adjRMSEMAEMSE
Experiment 3Fructose0.9170.8300.246 0.1770.059
Glycerol0.9470.8950.183 0.1510.034
Biomass0.8870.8030.093 0.0770.009
Experiment 4Fructose0.9470.8950.3270.2450.107
Glycerol0.8500.6990.0670.0610.004
Biomass0.8360.7380.0660.0450.004
Disclaimer/Publisher’s Note: The statements, opinions and data contained in all publications are solely those of the individual author(s) and contributor(s) and not of MDPI and/or the editor(s). MDPI and/or the editor(s) disclaim responsibility for any injury to people or property resulting from any ideas, methods, instructions or products referred to in the content.