Article

Effects of Different Straw Incorporation Amounts on Soil Organic Carbon, Microbial Biomass, and Enzyme Activities in Dry-Crop Farmland

1
College of Resources and Environmental Sciences, Gansu Agricultural University, Lanzhou 730070, China
2
Gansu Provincial Key Laboratory of Arid Land Crop Science, Gansu Agricultural University, Lanzhou 730070, China
3
College of Forestry, Gansu Agricultural University, Lanzhou 730070, China
*
Author to whom correspondence should be addressed.
Sustainability 2024, 16(23), 10588; https://doi.org/10.3390/su162310588
Submission received: 1 November 2024 / Revised: 27 November 2024 / Accepted: 2 December 2024 / Published: 3 December 2024
(This article belongs to the Section Sustainable Agriculture)

Abstract

:
The direct input of straw to the field can increase the source and supply of soil carbon and nitrogen, change the soil microbial biomass and enzyme activity, and affect the soil organic carbon sequestration, which in turn affects soil fertility and quality. In this study, a three-year field orientation experiment was conducted to investigate the effects of straw input on soil microbial biomass, enzyme activity, and soil organic carbon at different straw incorporation amounts (0, 3000, 7000, and 14,000 kg/hm2). The results showed that soil microbial biomass, enzyme activity, and organic carbon content increased with the increase in straw amount, and the increase in 4-fold straw input (T4) treatment was significantly larger than that of other treatments; the microbial biomass, enzyme activity, and SOC (soil organic carbon) in different soil layers were 0–10 cm > 10–20 cm > 20–30 cm; and straw incorporation amounts had a significant effect on soil microbial biomass, enzyme activity, and SOC. The amount of straw input to the field had a highly significant positive effect on soil microbial carbon and nitrogen and SOC (p < 0.001). In conclusion, four times the amount of straw input to the field had the most obvious effect on enhancing soil organic carbon content, microbial biomass, and enzyme activity. This has important implications for the development of sustainable agriculture.

1. Introduction

As a carrier of energy and nutrients [1], straw is a prime source of nitrogen, phosphorus, potassium and trace elements, but the utilization index is not high, most of it is burnt, resulting in pollution to the environment [2], and with the improvement of the level of grain yields, the residual amount of crop straw is also increasing. As a direct and effective way of straw utilization, straw input to the field can not only solve the environmental pollution problem of straw; but also promote the recycling of rural nutrient resources and sustainable development of agriculture [3]. Soil organic carbon is an important component of soil, which not only regulates the physical and chemical properties of soil, but also determines soil fertility. Soil microbial population is the source and reservoir of plant nutrients and actively participates in nutrient cycling, and the addition of organic matter has a greater impact on microbial population than mineral fertilizers [4,5]; and is often used to evaluate the soil’s enzyme activity can characterize the comprehensive fertility characteristics of soil and the process of soil nutrient transformation, reflecting the intensity and direction of various biochemical processes in the soil [6], and can be used as a biological indicator of soil quality.
In recent years, the quantity and proportion of straw input to the field in China have been increasing, and agronomists and ecologists have conducted a large number of in-depth studies on the way, time, quantity, degree of tilling and pest control of wheat straw input to the field, such as the selection of a reasonable amount of straw input to the field [7]. However, is there an upper limit for straw input? If so, what is the reason for it and how is it characterized? Some scholars have given different conclusions from the present study, and they have thought that it was not that the more straw input to the field, the more beneficial to the improvement of soil moisture retention and water storage capacity [8]. They have suggested that the reason might be due to the dual effect of straw input to the field on soil moisture properties. In the early stage of the process of straw decomposition consumes a lot of water, which produces the phenomenon of competition for water with the crop, resulting in the reduction of soil water content. At the end of decomposition, the soil water content is increased due to the improvement of soil water retention by straw input [9,10]. Most of the studies on the effects of straw incorporation amount to the field have focused on the effects on crop growth and soil structure and fertility, and mainly through the changes in soil nutrients and organic matter to understand or predict the evolution of soil fertility trends. However, there is a lack of systematic research on the ecological effects caused by different amounts of straw input to the field, especially the relationship between soil microbial loads and soil enzyme activities [11]. In this experiment, we mainly studied the effects of different amounts of wheat straw input to the field on the soil microbiota and soil enzyme activities of dry farming soils under traditional cultivation conditions, to provide a scientific basis for exploring the optimal amount of straw input to the field that is suitable for the local production and ecology, making full use of the crop straw resources, and improving the productivity of the soil [12].

2. Materials and Methods

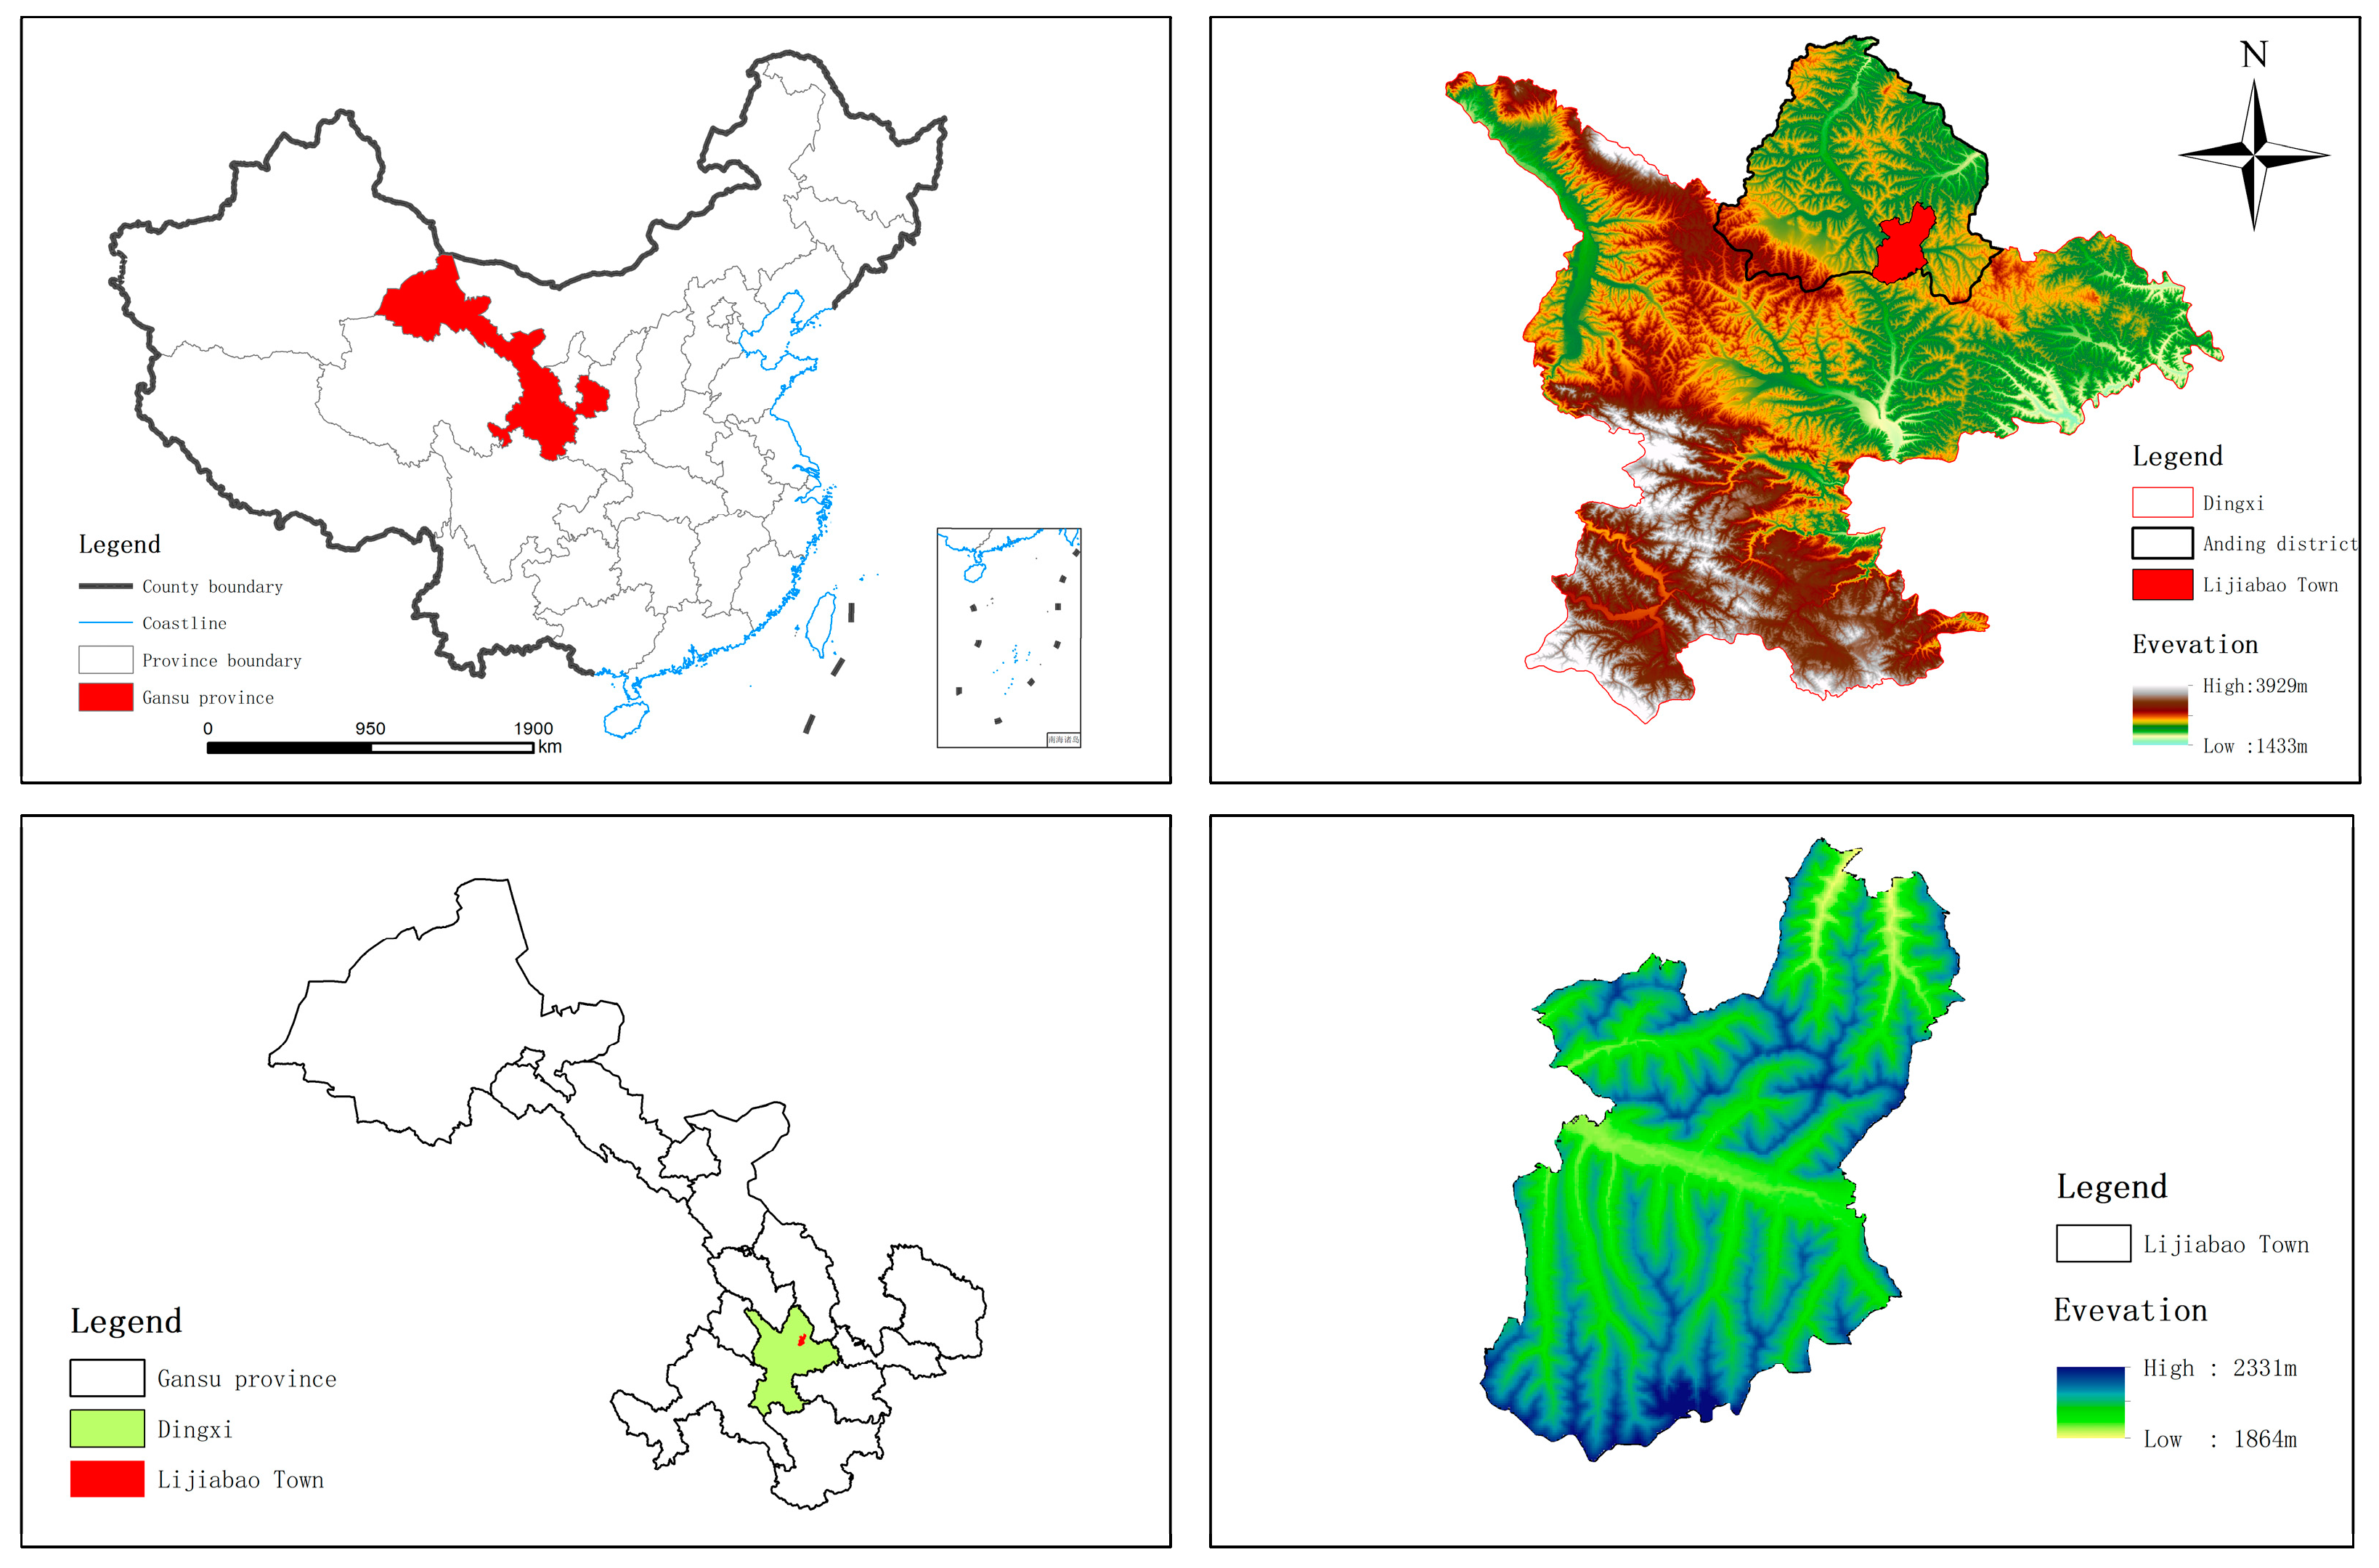
2.1. Overview of the Test Site

This experiment was started in 2022, and a long-term positioning experiment with different straw incorporation amounts was laid out in Ma Zi Chuan Village, Li Jia Bao Town, Ding Xi City, Gansu Province, in the western part of the Loess Plateau. The test area belongs to the semi-arid zone of the mesothermal zone, with an average altitude of 2000 m, an annual average solar radiation of 591.9 KJ/cm2, and 2476.6 h of sunshine. The average annual temperature is 6.4 °C, ≥0 °C cumulative temperature is 2933.5 °C, ≥10 °C cumulative temperature is 2239.1 °C, and the frost-free period is 140 d. The average precipitation is 390.9 mm, the annual evaporation is 1531 mm, the dryness is 2.53, the precipitation with an 80% guarantee rate is 365 mm, and the coefficient of variation is 24.3%. The farmland soil in the test area is typical yellow sheep soil, loose and porous, with good water storage performance. The basic physical and chemical properties of the soil in the test area were pH 8.13, organic carbon 8.06 g·kg−1, total nitrogen 0.88 g·kg−1, alkaline dissolved nitrogen 56.35 mg·kg−1, quick-acting phosphorus 24.71 mg·kg−1, quick-acting potassium 132.50 mg·kg−1, and the average soil bulk density of 0~200 cm was 1.17 g·cm−2 (Figure 1).

2.2. Experimental Methods and Sampling

The experiment was set up with different straw reduction treatments, and the specific experimental design is shown in Table 1. The experiment selected wheat straw for reduction treatment, and each set 4 levels, a total of 4 treatments, each treatment was repeated 3 times, randomly block design, a total of 12 plots, the area of the plots was 6 m2 (2 m × 3 m).
The experimental crop was spring wheat (Ding xi 40), sown in March and harvested in August each year, with a sowing rate of 187.5 kg/ha and a row spacing of 20 cm, and all treatments were fertilized with N 105 kg/ha (urea, with a pure nitrogen content of 46%) and P2O5 45.9 kg·hm−2 (calcium superphosphate, with a P2O5 content of 14%). All fertilizers were applied as basal fertilizer at the same time as sowing, and the straw used in the input treatment was from the current season’s crop, which was harvested, broken into small sections of about 5 cm, and spread evenly over the plot, and tilled into the plot using a typical tillage pattern for the area. At 45 d after treatment, soil samples were collected from 0–10 cm, 10–20 cm, and 20–30 cm by the five-point sampling method, and one sample was stored at 4 °C for measuring microbial biomass and total organic carbon; one sample was air-dried indoors for determining soil enzyme activity.

2.3. Sample Determination and Methods

Soil pH was determined by electrode method (water–soil ratio 2.5:1) [13]; water content was determined by drying method; unit weight was determined by ring knife method; organic carbon was determined by carbon and nitrogen combined analyzer after removing inorganic carbon with 0.5 mol·L−1 HCl.
Microbial biomass carbon (MBC), microbial biomass nitrogen (MBN) and microbial biomass phosphorus (MBP) were determined by chloroform fumigation and leaching [14,15]; sucrase activity: colorimetric method with 3,5-dinitrosalicylic acid [16], sucrase activity was expressed as the mass of glucose in 1 g of soil after 24 h (mg); alkaline phosphatase activity: colorimetric method with disodium benzoate phosphate; catalase activity: potassium permanganate titrimetric method.

2.4. Calculation of Indices

After fresh soil is fumigated with chloroform (24 h), the biomass C, N, and P of soil microorganisms killed in a certain proportion can be extracted with 0.5 mol·L−1 K2SO4 solution and quantitatively determined, and the biomass C, N, and P of soil microorganisms can be estimated according to the difference between the amount of organic C, N, and P determined in fumigated and unfumigated soils and the extraction efficiency (or conversion coefficient KEC).
The microbial biomass C, N, and P content [17] was calculated according to the following formula:
MBC = (FC − UFC)/KEC
where FC is the carbon content of the fumigated sample and UFC is the carbon content of the corresponding unfumigated sample. The correction factor (KEC) is 0.38;
MBN = (FN − UFN)/KEN
where FN is the nitrogen content of the fumigated sample and UFN is the nitrogen content of the corresponding unfumigated sample. The correction factor (KEN) is 0.54;
MBP = (FP − UFP)/KEP
where FP is the phosphorus content of the fumigated sample and UFP is the phosphorus content of the corresponding unfumigated sample. The correction factor (KEP) is 0.4.

2.5. Data Processing

The data obtained from the experiment were preliminarily organized, analyzed, and graphed using Microsoft Excel 2021, and analyzed by ANOVA and correlation analysis using SPSS 26.0. Origin 2021 was used for graphing. All variables were described by means and standard errors (SE) and differences in soil microbial biomass and enzyme activities among three replicates of the four treatments were tested by one-way analysis of variance (ANOVA) using the least significant difference (LSD) test (p < 0.05). In addition, correlations between SOC and soil microbial and enzyme activities were analyzed using Pearson’s correlation coefficient. In addition, structural equation modeling (SEM) was carried out using Amos 17.0 (Small Waters Corporation, Chicago, IL, USA) to assess the direct and indirect effects of various variables on SOC.

3. Results

3.1. Effects of Straw Incorporation Amount on Soil Physicochemical Properties

3.1.1. Effects of Straw Incorporation Amount on Soil pH

Through the analysis of different amounts of straw input to the field, it was found that compared with the CK treatment, the soil pH of different soil layers after different amounts of straw input to the field increased, and the trend of the pH of each soil layer in each treatment was as follows: 0–10 cm > 10–20 cm > 20–30 cm. The soil pH of different soil layers increased by 0.48%, 0.12%, and 0.12% in the 1-fold straw input treatment, respectively; soil pH of different soil layers in the 2-fold straw input treatment increased by 0.60%, 0.49%, and 2%, respectively; soil pH of different soil layers in 4-fold straw input treatment increased by 0.97%, 0.73%, and 0.73%, respectively. It was found that the highest soil pH was reached after a 4-fold straw input treatment (T3), followed by T2 treatment. It can be seen that the amount of straw returned to the field has a small effect on the change in soil pH, but small changes in pH are enough to have a significant effect on the effectiveness of a wide range of nutrients in the soil, and thus on soil fertility (Figure 2).

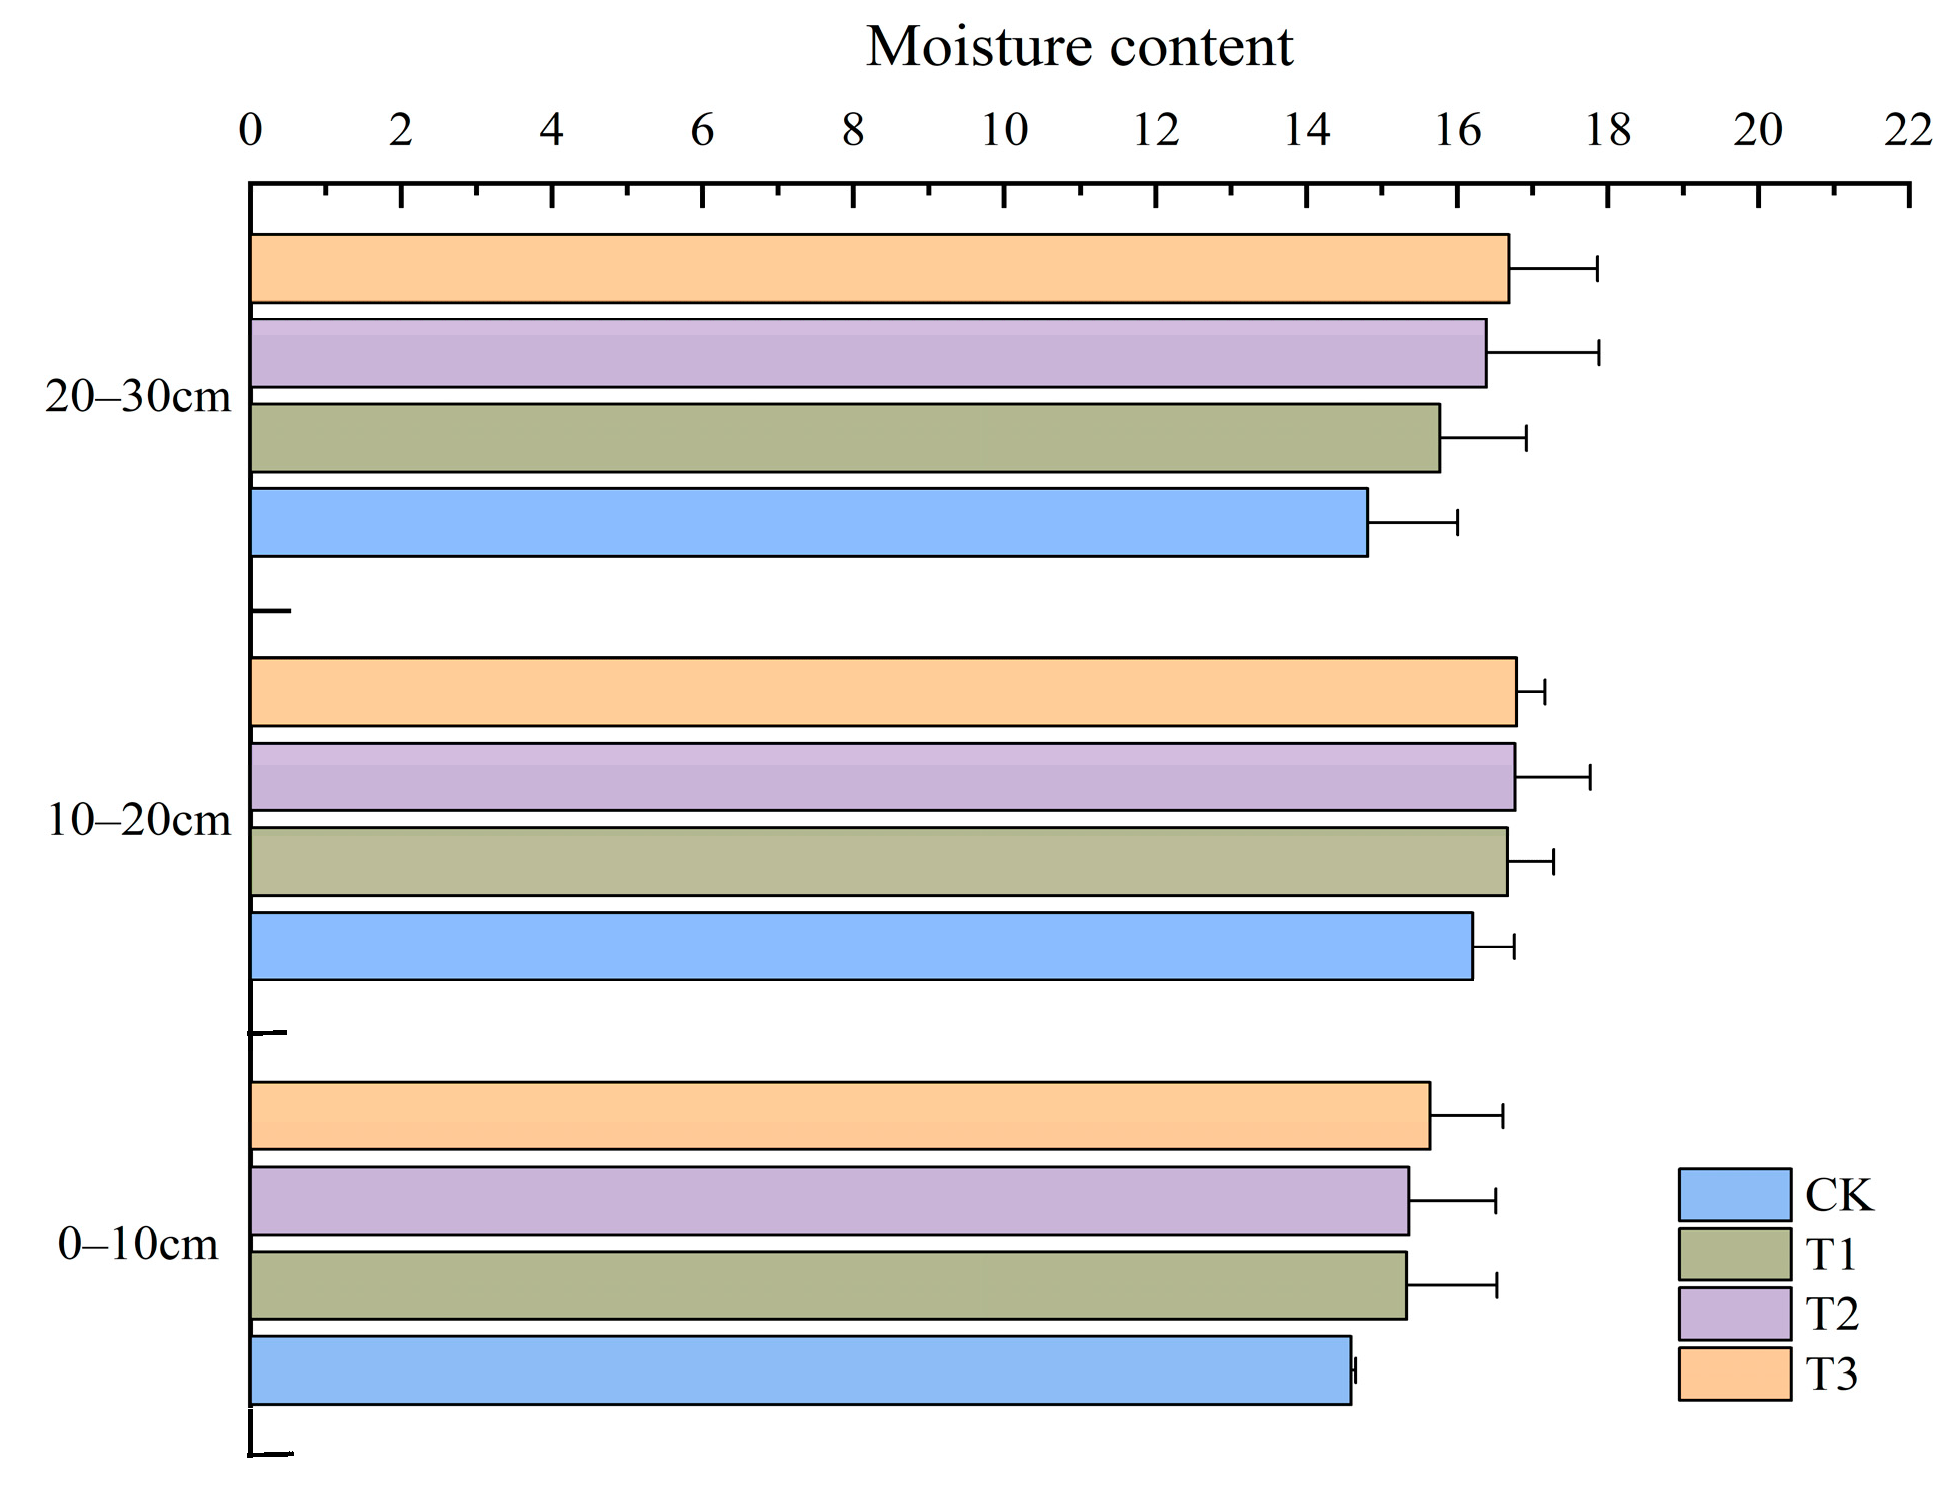
3.1.2. Effects of Straw Incorporation Amount on Soil Moisture

It was found that the 1-fold straw input to the field could significantly increase the water content of the soil. After 45 d of straw input, compared with straw not input to the field (CK), the moisture content of all soil layers after straw input was significantly increased, showing a trend of 10–20 cm > 20–30 cm > 0–10 cm, and the change of 20–30 cm soil layer after straw input was larger. The 4-fold straw input treatment (T3) increased the soil moisture content most obviously, and the soil moisture of each soil layer after T3 treatment was elevated by 7.2%, 3.58%, and 12.69%, respectively. It can be seen that the changes in soil moisture content were affected by different straw input amounts. Soil moisture may also be affected by environmental factors, for example, rainy weather during sampling will increase the moisture content of shallow soil to a certain extent, and high temperature will cause evaporation of water from the surface soil, which will lead to a decrease in soil moisture content.
In the 20–30 cm soil layer, compared with the straw not returned to the field, the soil moisture content after the straw returns to the field is elevated because after the straw returns to the field, the straw covers the soil surface, which can effectively reduce the evaporation of soil moisture, especially in the arid areas, so that the soil moisture in the 20–30 cm soil layer is maintained at a higher level; straw return to the field can increase the organic matter content of the soil, providing more carbon and energy for soil microorganisms, microorganisms produce a number of metabolites during the decomposition of straw, and these metabolites also have a positive effect on the structure and water retention capacity of the soil. In addition to this, it has been shown that an increase in the number of years that straw has been returned to the field can also increase soil moisture content (Figure 3).

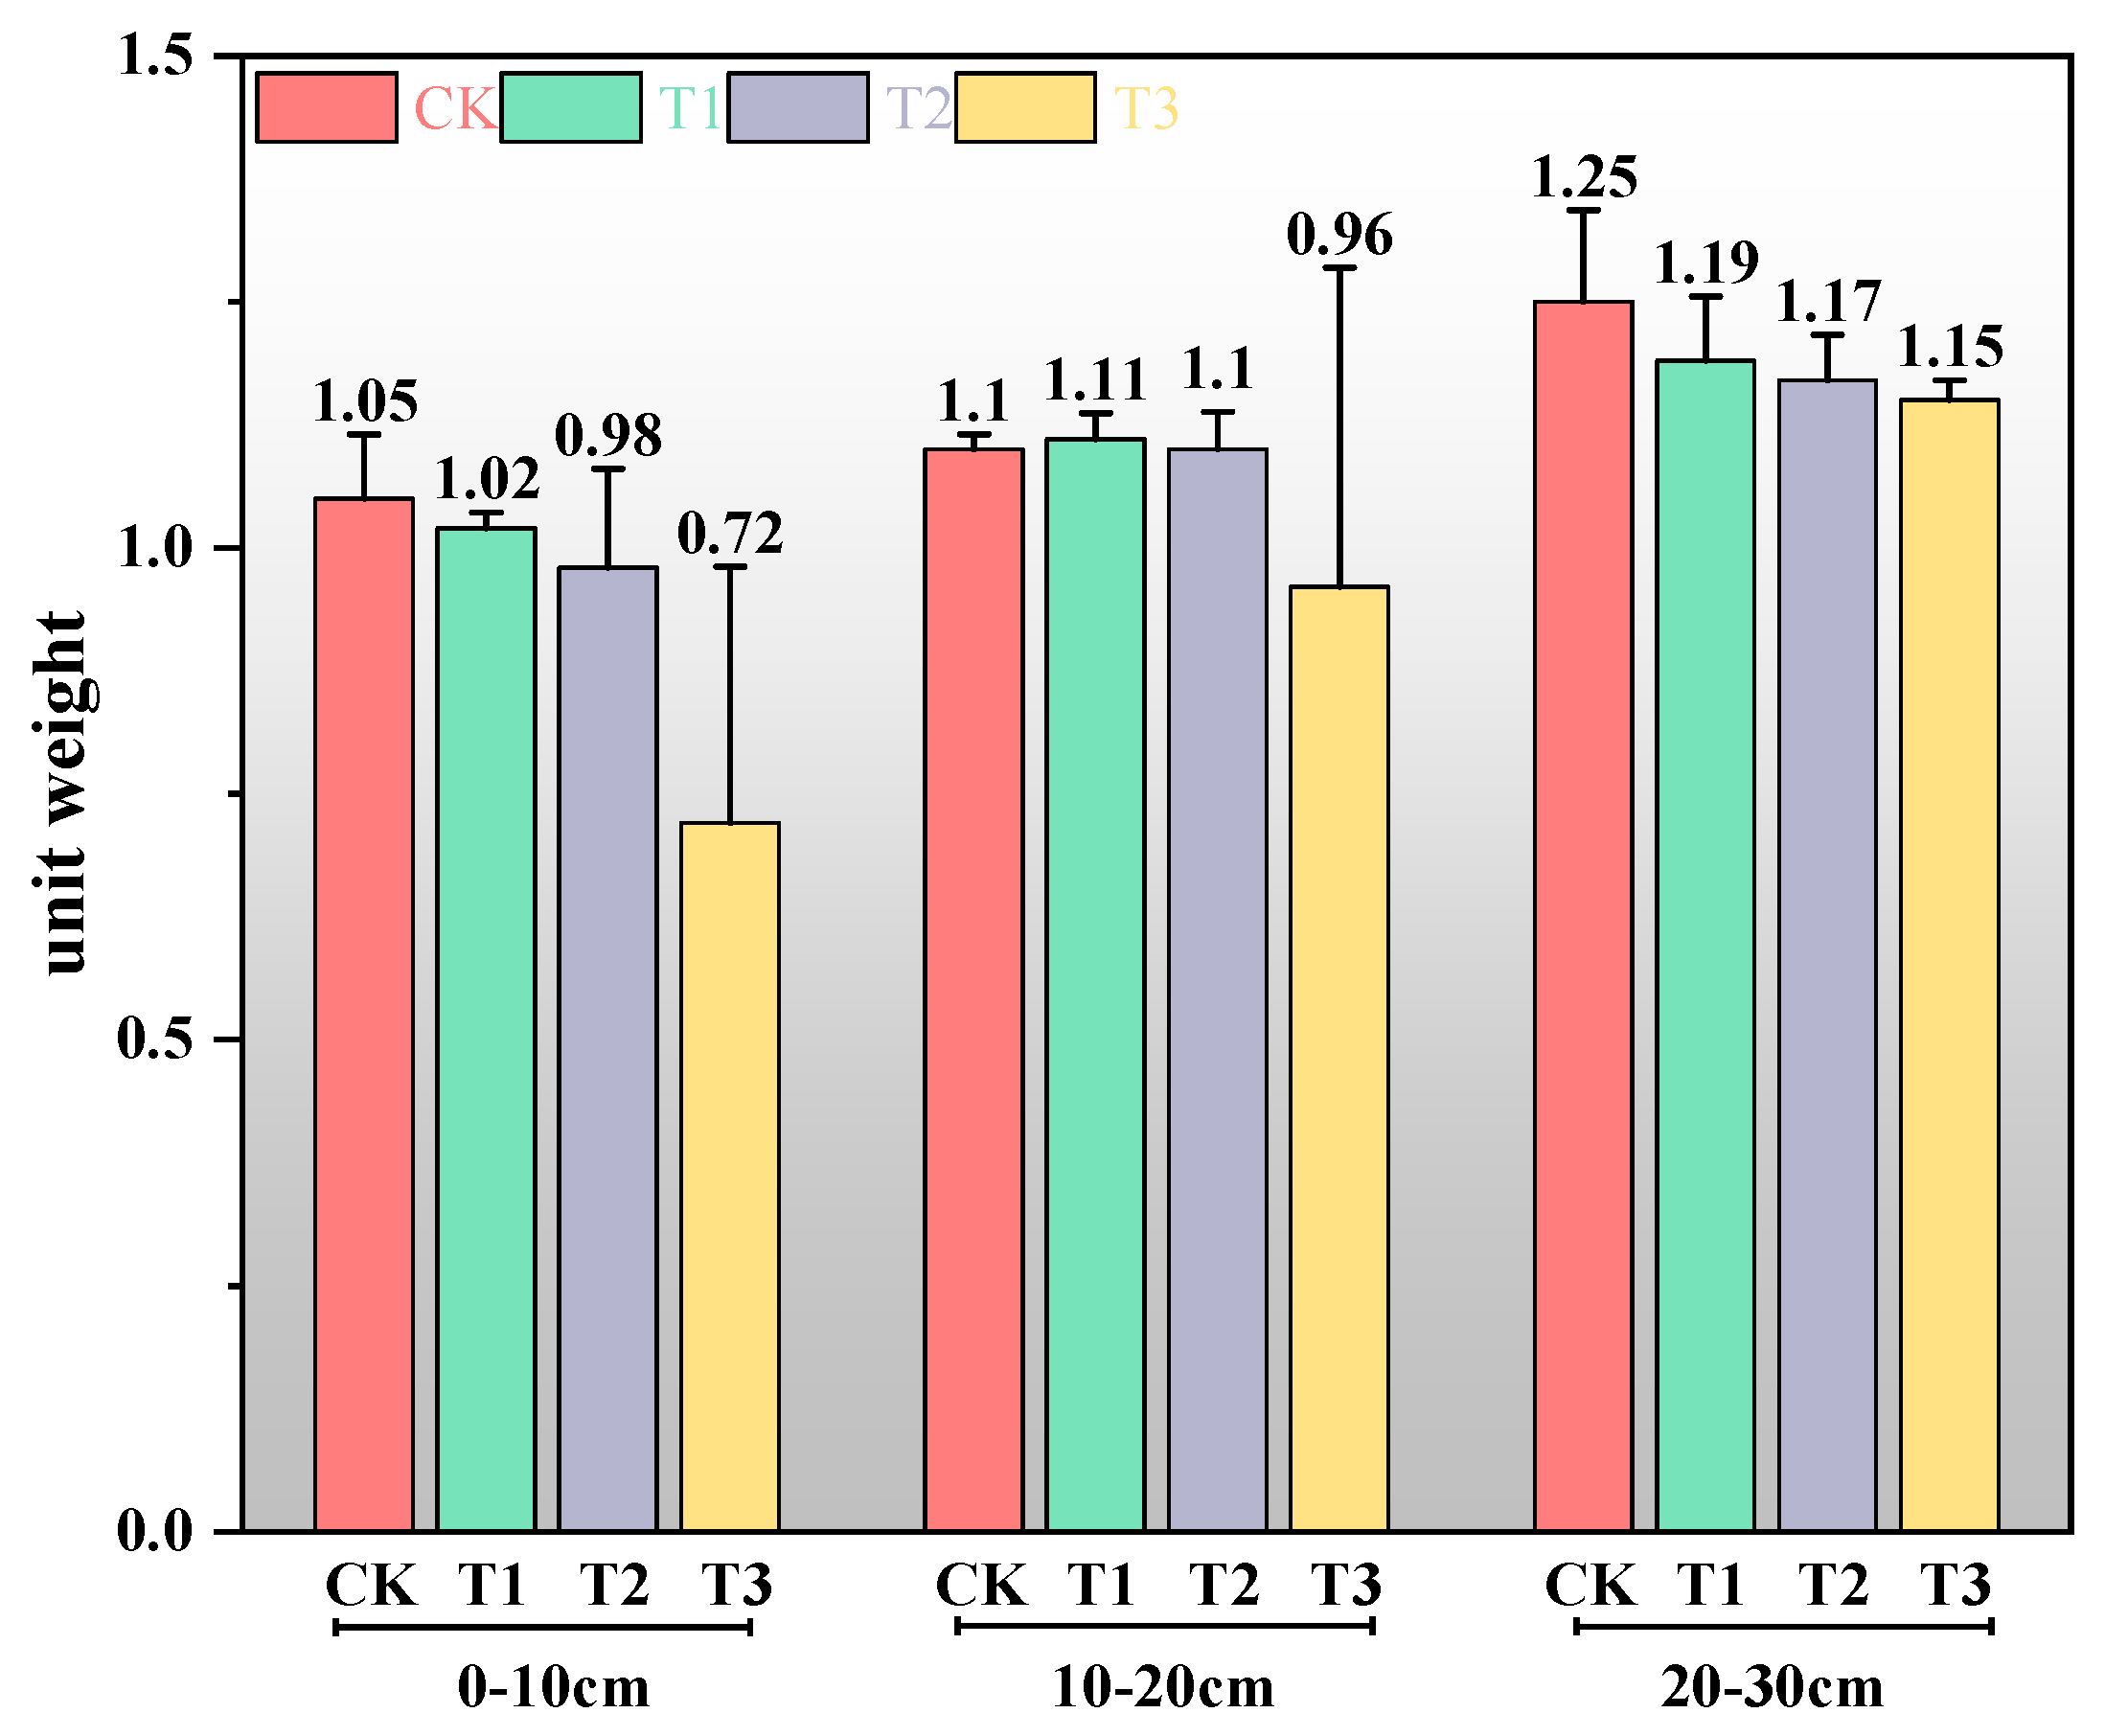
3.1.3. Effects of Straw Incorporation Amount on Soil Unit Weight

From the figure, it can be seen that the increase in straw incorporation amount can significantly reduce the soil unit weight of dry farmland soil. The soil unit weight of each soil layer showed a trend of 0–10 cm < 10–20 cm < 20–30 cm. After 45 d of straw input, compared with straw not input to the field (CK), the soil unit weight of each soil layer decreased significantly, and the change in soil unit weight was the largest after 3-fold straw input, while the fluctuation of soil unit weight in T1 and T2 treatments did not change significantly.
The changes in soil unit weight were affected by the different amounts of straw input. Moreover, as the amount of straw returned to the field increases, the soil unit weight decreases. Due to the following reasons: straw is rich in organic matter, and returning it to the field can increase the content of organic matter in the soil, so that the soil becomes looser; straw returned to the field provides a rich source of carbon and energy for microorganisms, which promotes microbial activity and reproduction, and microorganisms produce a large amount of inorganic substances, such as CO2 and water; during the decomposition of straw, these inorganic substances can further improve the soil structure and reduce the soil weight (Figure 4).

3.2. Effects of Straw Incorporation Amount on Soil Microorganisms

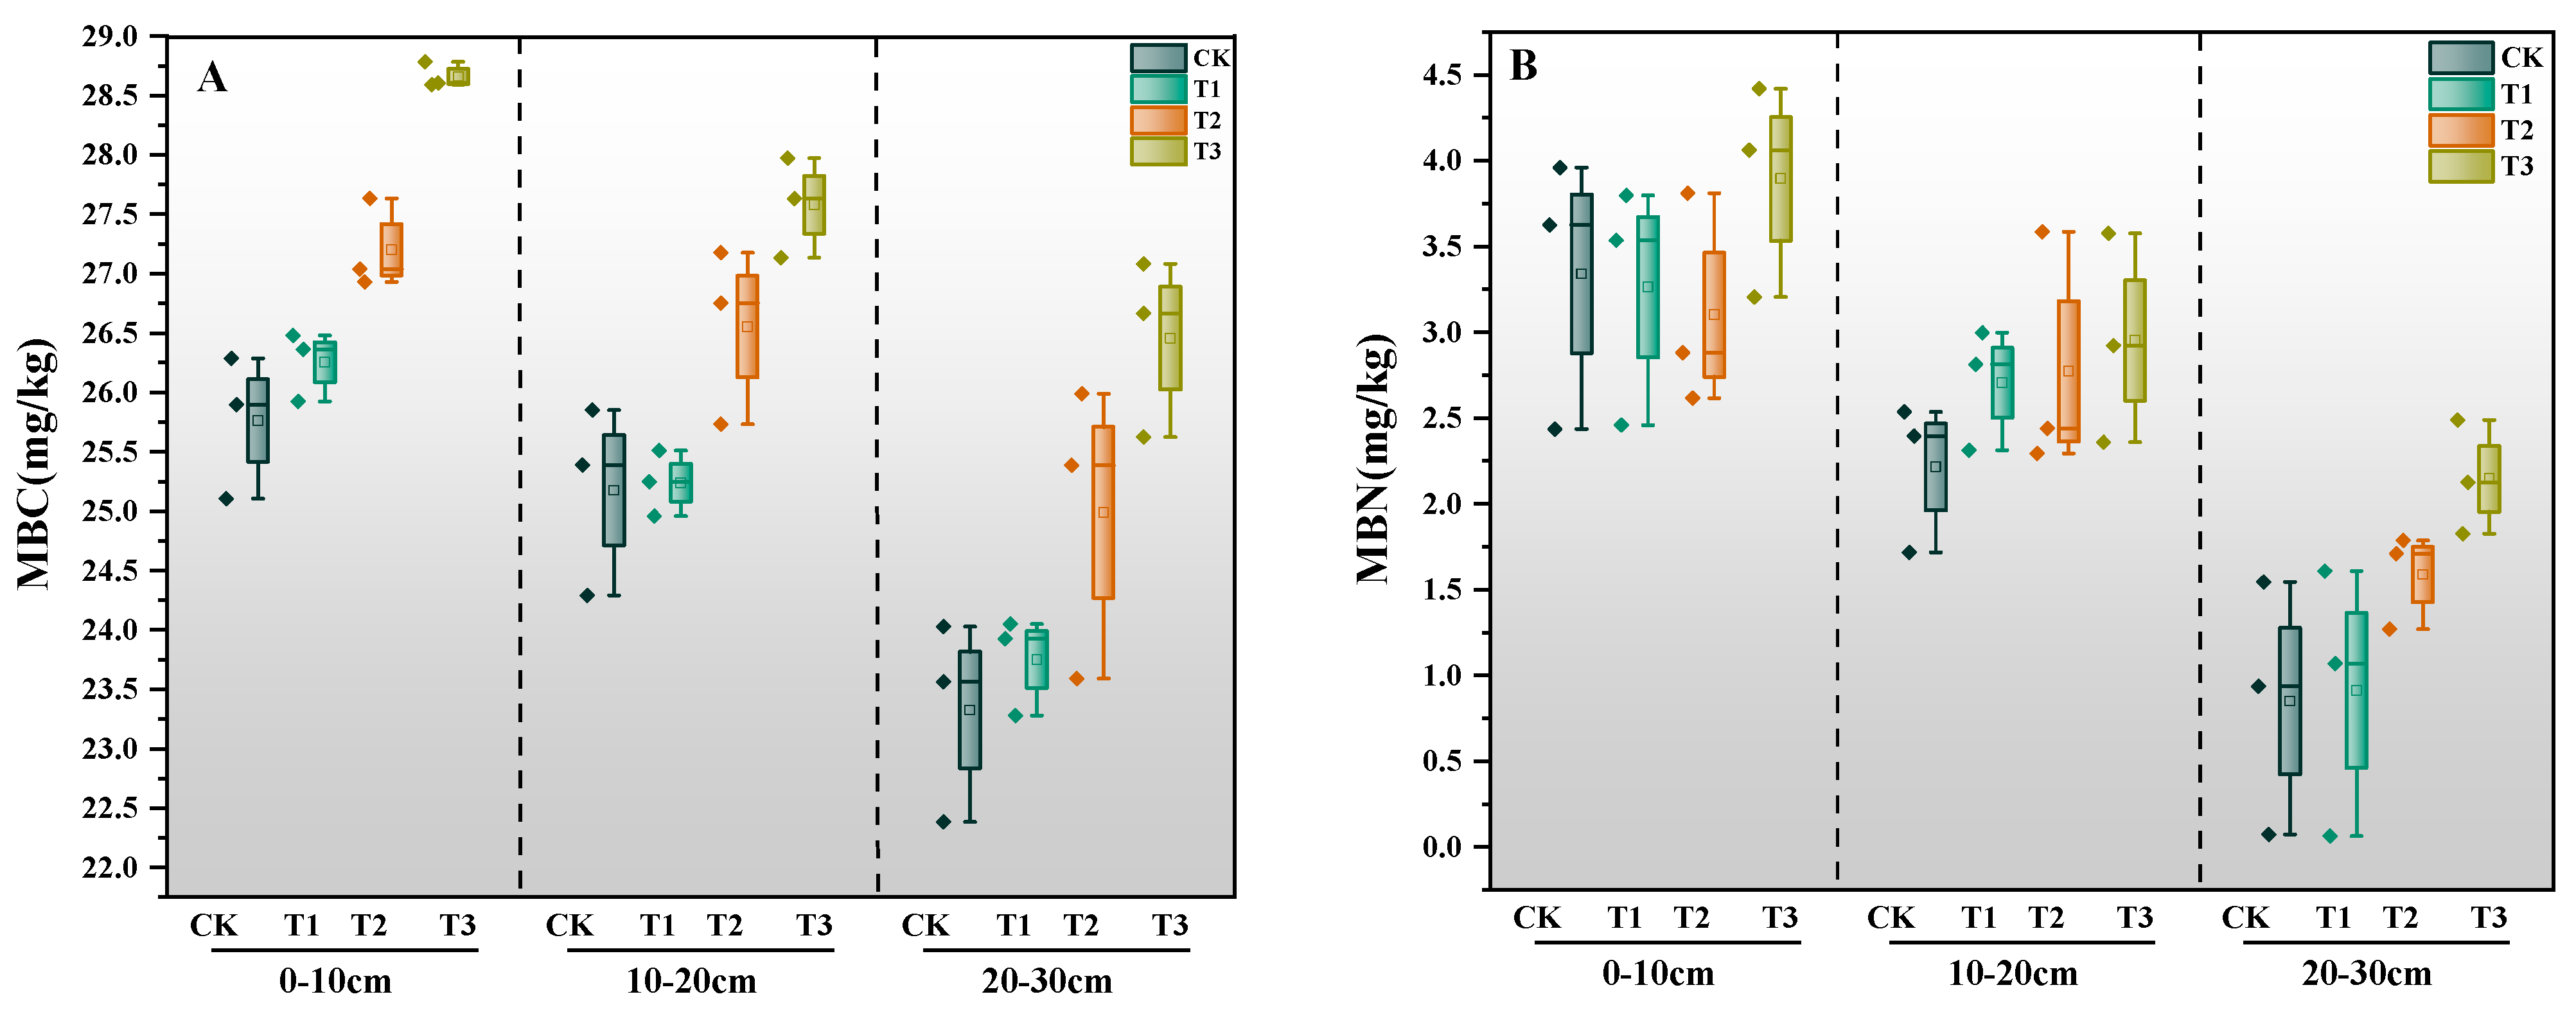
3.2.1. Effects of Straw Incorporation Amount on MBC and MBN

Soil microbial carbon can reflect the effective nutrient status and biological activity of soil, and can largely reflect the number of soil microorganisms, which is an important index for evaluating the number and activity of soil microorganisms and soil fertility. Soil microbial nitrogen is an important reservoir of soil nitrogen, and soil microorganisms themselves are also one of the active reservoirs of soil nitrogen transformation, so the study of soil microbial nitrogen elimination and growth can help to reveal the nature of biological fixation and release of nitrogen into the soil fertilizer. As the amount of straw returned to the field increases, the number of microorganisms and enzyme activity in the soil increases accordingly, which helps to accelerate the decomposition and transformation of straw and improve the biological activity of the soil.
As can be seen from Figure 5, the soil microbial carbon and nitrogen of different straw input treatments were higher than that of CK treatment and showed the trend of T3 > T2 > T1 > CK. The results of ANOVA showed that T3 had the most obvious (p < 0.05) effect on microbial carbon, which was significantly increased by 11.4% compared with CK, while the microbial carbon of the other treatments was increased by 1.32% and 6.03% (p > 0.05) compared with CK, respectively. Compared with CK, T3 had the most obvious (p < 0.05) effect on the microbial amount of nitrogen, which was significantly increased by 40.4%; while the microbial amount of nitrogen in the other treatments was not significantly (p > 0.05) increased compared with that of CK.

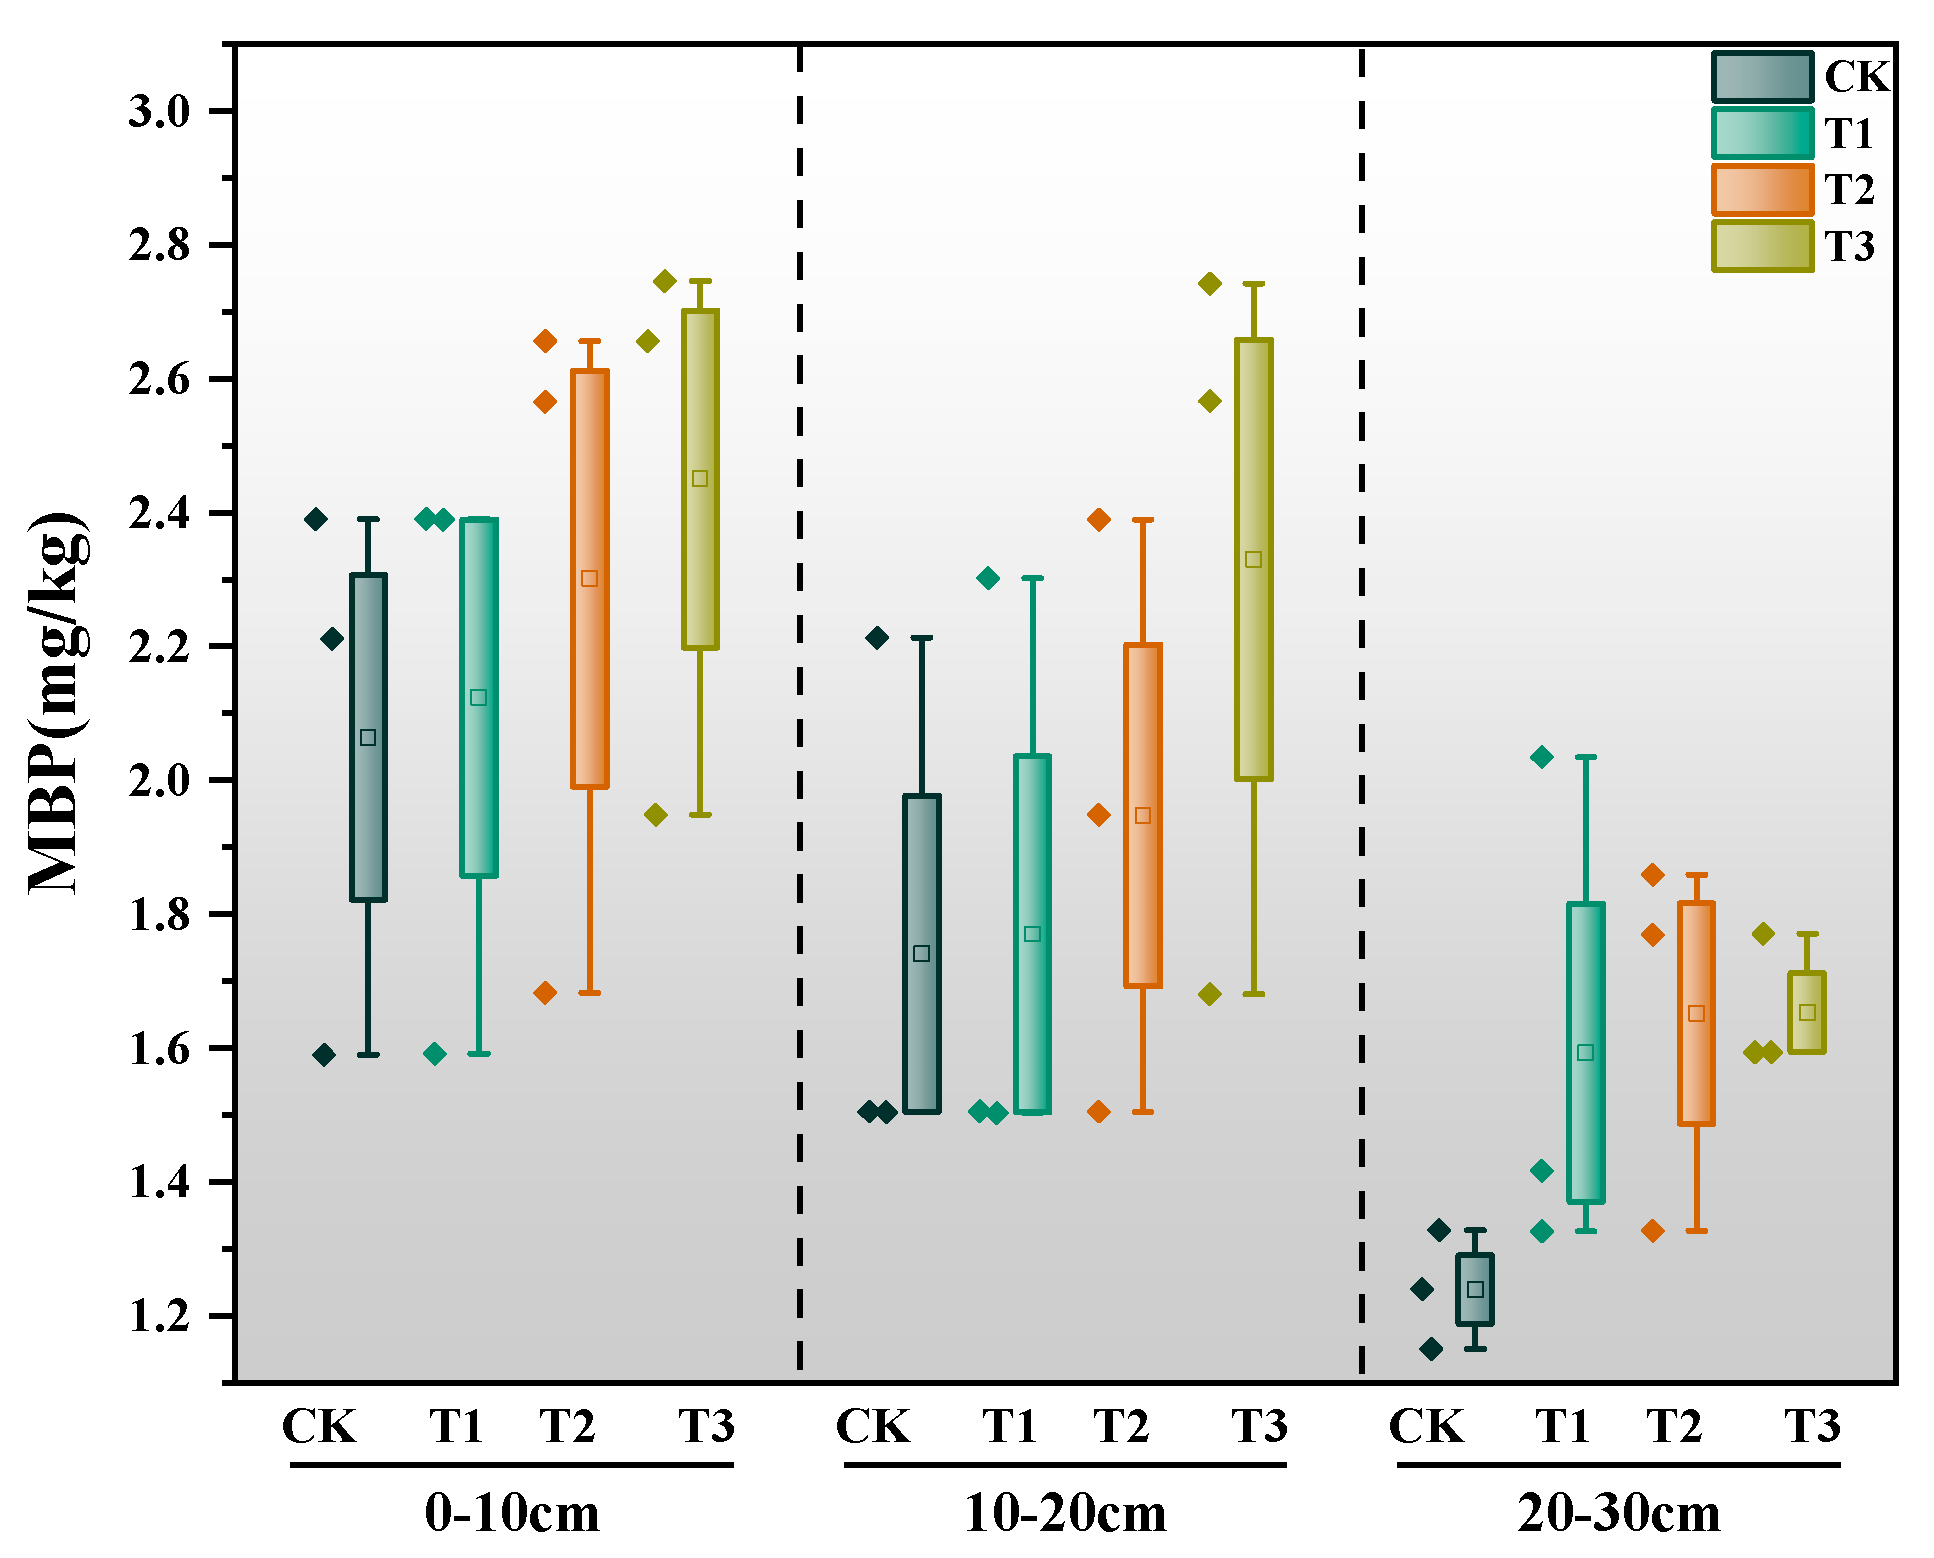
3.2.2. Effects of Straw Incorporation Amount on MBP

As shown in Figure 6, the phosphorus of soil microbial mass varied from 1.590 to 2.746 mg/kg in the 0–10 cm soil layer, among which, the T3 treatment was the highest, which was significantly higher than the other treatments by 7.2–15.8%, followed by the T2 treatment, and the T1 treatment was the lowest, but it was not significantly different from that of the T2 treatment. The phosphorus of soil microbial mass varied from 1.502 to 2.742, and 1.150 to 2.035 mg/kg in the 10–20 and 20–30 cm soil layers, respectively, in which, the T3 treatment was the highest in both soil layers, which was higher than the other treatments. In the 10–20 and 20–30 cm soil layers, the soil microbial phosphorus of each treatment ranged from 1.502 to 2.742 and 1.150 to 2.035 mg/kg, respectively, in which the T3 treatment was the highest in both soil layers, and significantly increased by 38.2% to 56.0% and 6.00% to 6.01%, respectively, compared with the other treatments, while the T2 treatment was the second highest and the T1 treatment was the lowest and was lower than the other treatments. In general, under the same tillage conditions, the soil microbial phosphorus was higher in the 4-fold straw input treatment than in the 1-fold straw input, 2-fold straw input treatments, and the non-input treatment; under the same straw input condition, the soil microbial phosphorus in the shallow soil was higher than that in the deep soil, and it showed the trend of 0–10 cm > 10–20 cm > 20–30 cm.

3.3. Effects of Straw Incorporation Amount on Soil Enzyme Activities

3.3.1. Effects of Straw Incorporation Amount on Soil Sucrase Activity

Table 2 shows the sucrase activities of different treatments in the 0~30 cm soil layer during the straw input period. Sucrase is widely present in all soils, and it is an important enzyme to characterize the biological activity of soils and plays an important role in increasing the amounts of soluble substances in soils that can be utilized by plants and microorganisms. As shown in Fig, the sucrase activity in the 0–10 cm, 10–20 cm, and 20–30 cm soil layers was increased by straw input, and the T3 treatment increased by 2.4–5.9% compared with the T2 and T1 treatments but did not show any significant difference, and the sucrase activity was greater in the 0–10 cm than in the 10–20 cm layer, and the 10–20 cm than in the 20–30 cm layer. In addition, the sucrase activity in the 0–10 cm layer was greater than that in the 10–20 cm layer, and that in the 10–20 cm layer was greater than that in the 20–30 cm layer. In general, the sucrase activity in the top soil layer was higher than that in the deep soil layer. In addition, by doubling the amount of straw input to the field, it could be seen that the sucrase activity of the surface soil was still higher than that of the deep soil compared with that of the CK. The sucrase activity of all treatments increased with the increase in straw doubling.

3.3.2. Effects of Straw Incorporation Amount on Soil Alkaline Phosphatase Activity

Table 3 shows the alkaline phosphatase activities of different treatments measured in the 0~30 cm soil layer during the straw input period, as shown in the figure, the alkaline phosphatase activities in the soil were greatly affected by the amount of straw input to the field, and the alkaline phosphatase activities increased gradually when the amount of straw input to the field was increasing, which was also presented in different soil layers. The T3 treatment in the 0~10 cm, 10~20 cm, and 20~30 cm soil layers was not significantly different from the other two treatments, and the activity of alkaline phosphatase was higher than that of the deeper soil in the surface layer, with the activity of alkaline phosphatase in the surface layer ranging from 5.5% to 12.4% higher than that in the deeper soil.

3.4. Effects of Straw Incorporation Amount on SOC

The amount of organic carbon in the soil can directly reflect good or bad soil fertility. In this paper, by adding different amounts of straw to the soil to grow wheat, the organic carbon content in the soil was greatly increased based on the original soil, as shown in Figure 7. The organic carbon contents of the three treatments were enhanced in the 0–10, 10–20, and 20–30 cm soil layers compared with those of the non-straw input treatment. In the 0–10 cm soil layer, T1 and T3 increased by 7.10–14.11% compared with the control treatment, with significant differences; and in the 10–20 cm soil layer, the differences between the T3 treatment and the control were also significant. In the soil layer from 10 to 20 cm, the differences between the T3 treatment and the control were also gradually significant, and the organic carbon content of the T3 treatment increased by 3.65~17.02% compared with the other three treatments; while in the soil layer from 20 to 30 cm, the differences between the T3 treatment and the control were also gradually significant, and the organic carbon content of the T3 treatment increased by 0.61~10.19% compared with the other three treatments in the same soil layer.

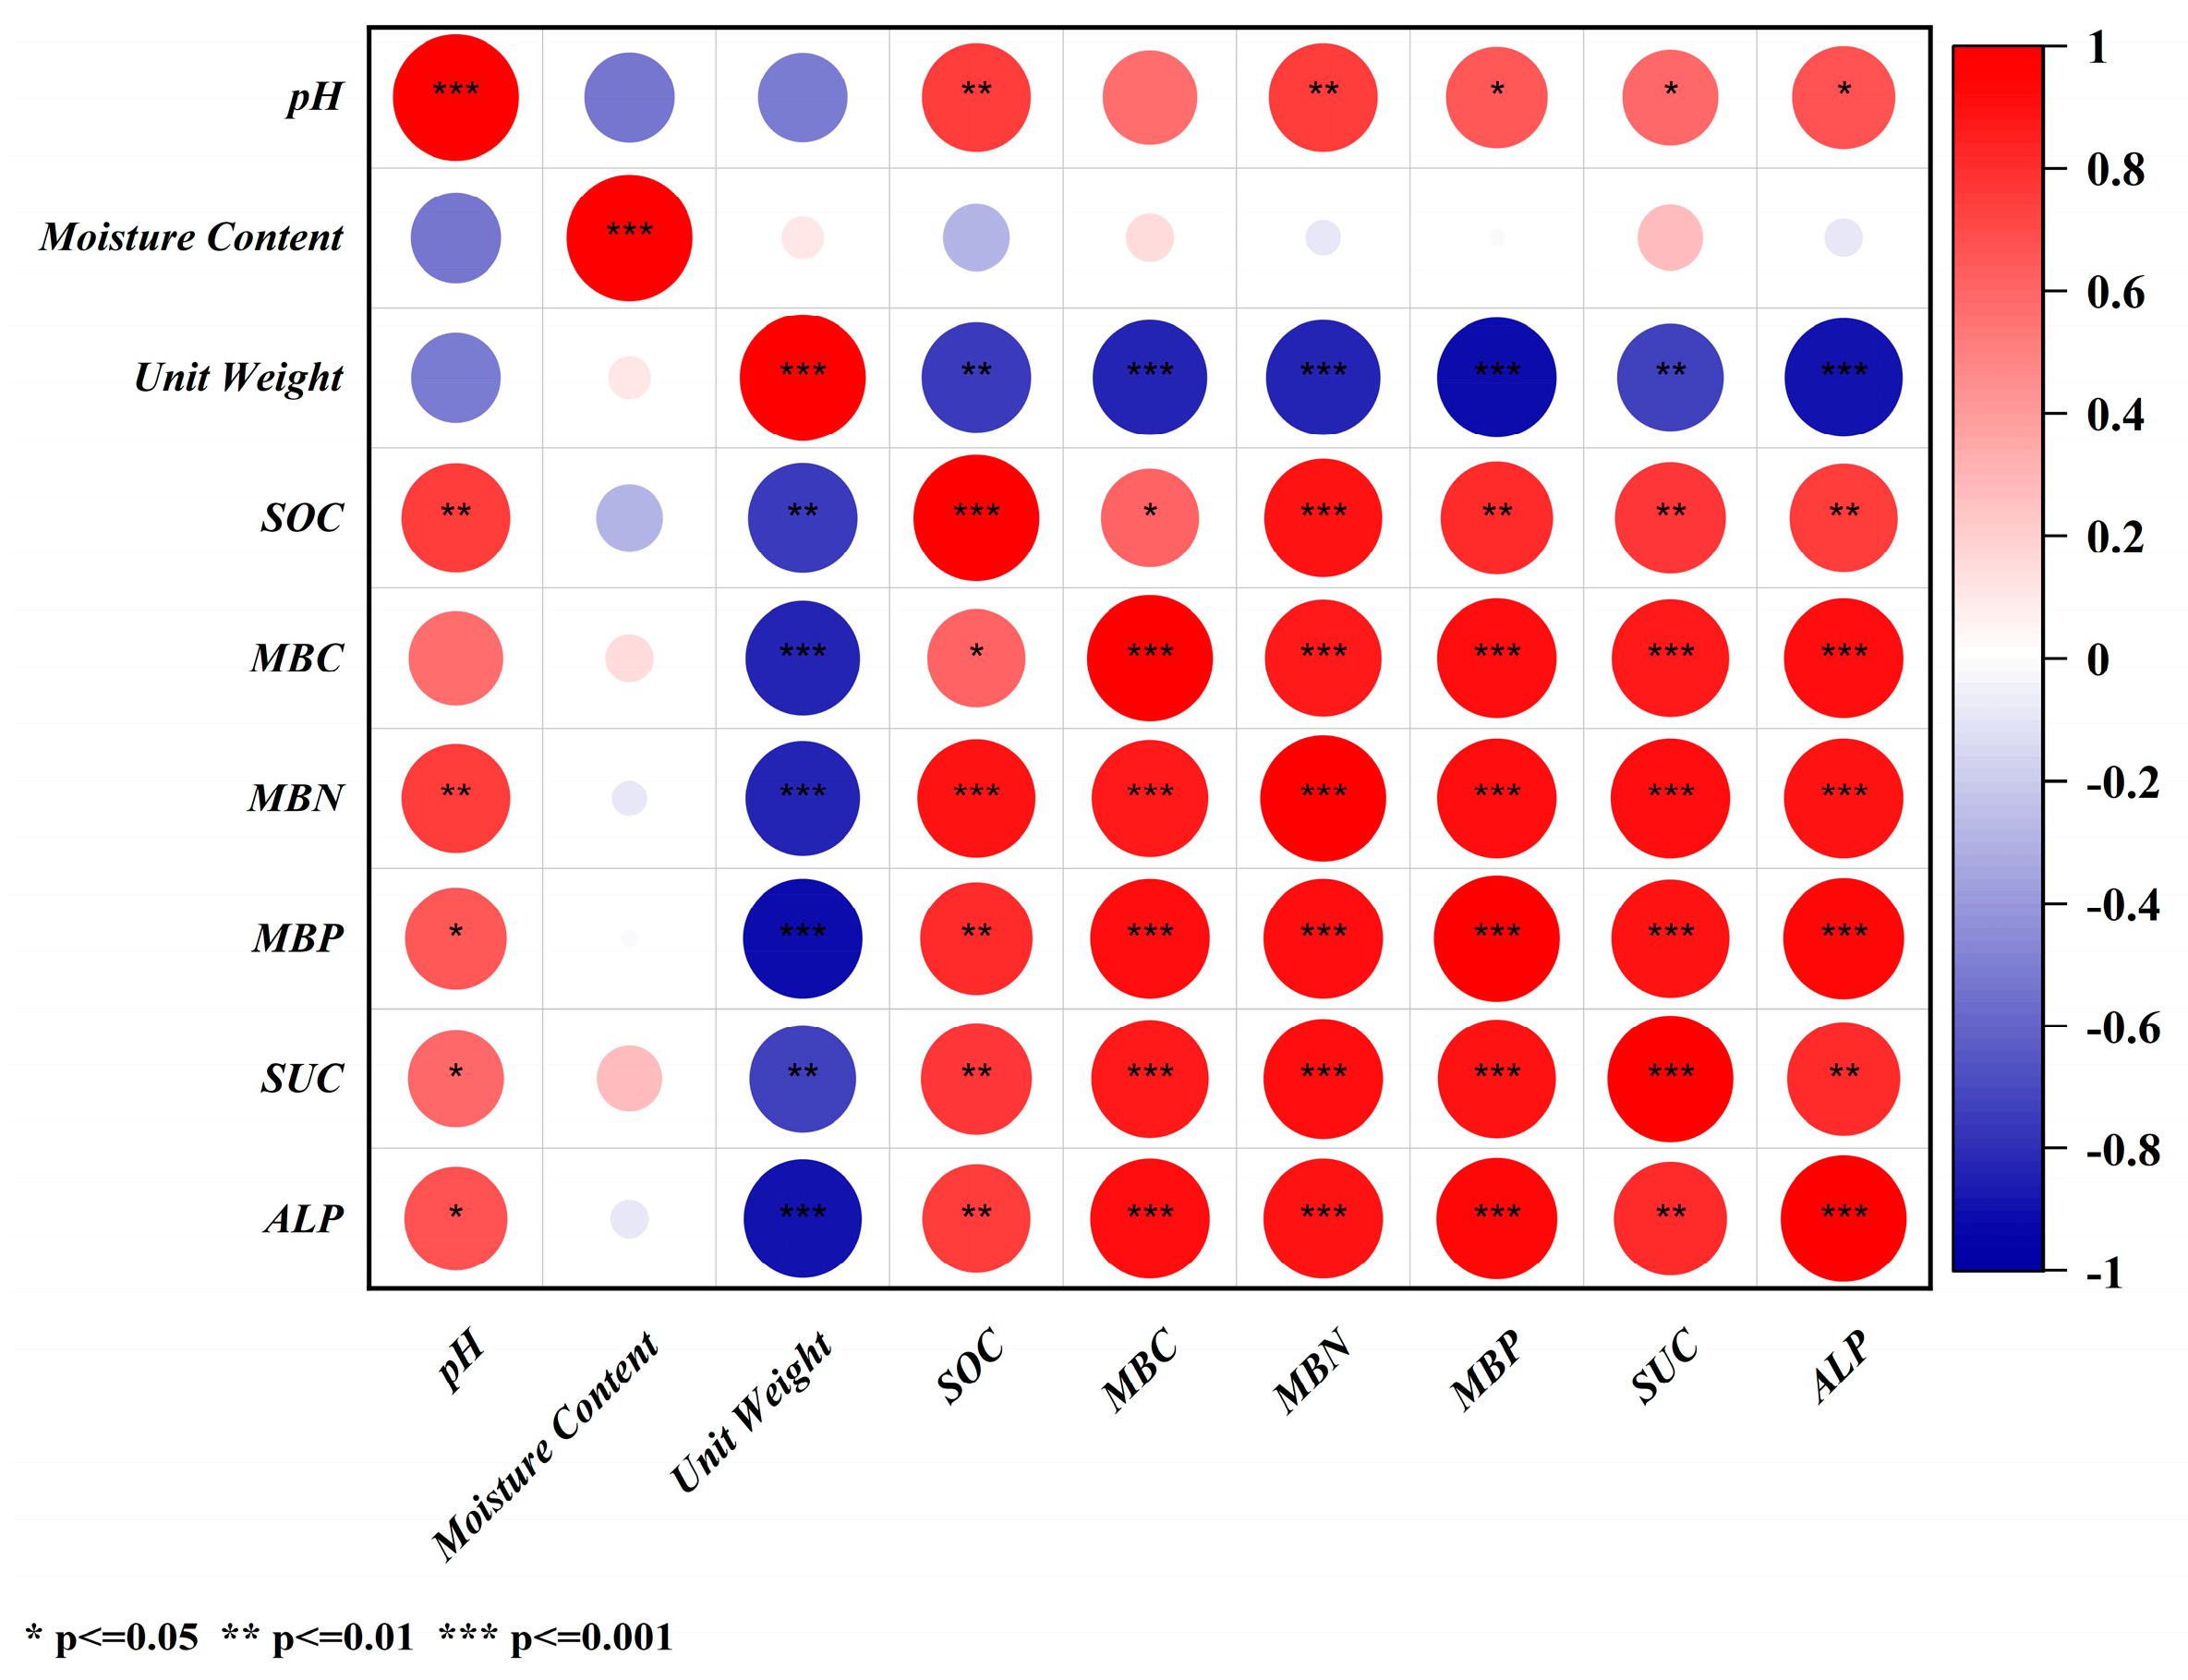
3.5. Correlation Analysis

Figure 8 shows the results of the correlation analysis between soil SOC and soil microbial carbon, nitrogen, phosphorus, and enzyme activities. As shown in the table, there was a significant correlation between soil SOC and microbial phosphorus, which indicated that soil microbial phosphorus was able to respond to soil quality to a certain extent; microbial nitrogen also showed a highly significant correlation with SOC, which indicated that nitrogen was an important nutrient element affecting the fertility of the soil. The correlation between soil total organic carbon and microbial carbon, nitrogen, and phosphorus, in addition to microbial nitrogen and microbial phosphorus, also had a significant positive correlation with microbial carbon (p < 0.05); the correlation between soil enzymes reached a significant level, which indicated that soil enzymes not only had specificity in catalyzing reactions but also had commonality among each other, which in general could reflect the level of soil fertility. In addition, there was a significant positive correlation (p < 0.05) between microbial carbon, microbial nitrogen, and enzyme activities, which indicated that there was a certain positive correlation between the changes in soil carbon and nitrogen and the activities of soil enzymes under different treatments and that the increase in soil carbon and nitrogen content had a certain promotion effect on the increase in soil sucrose and alkaline phosphatase activities.

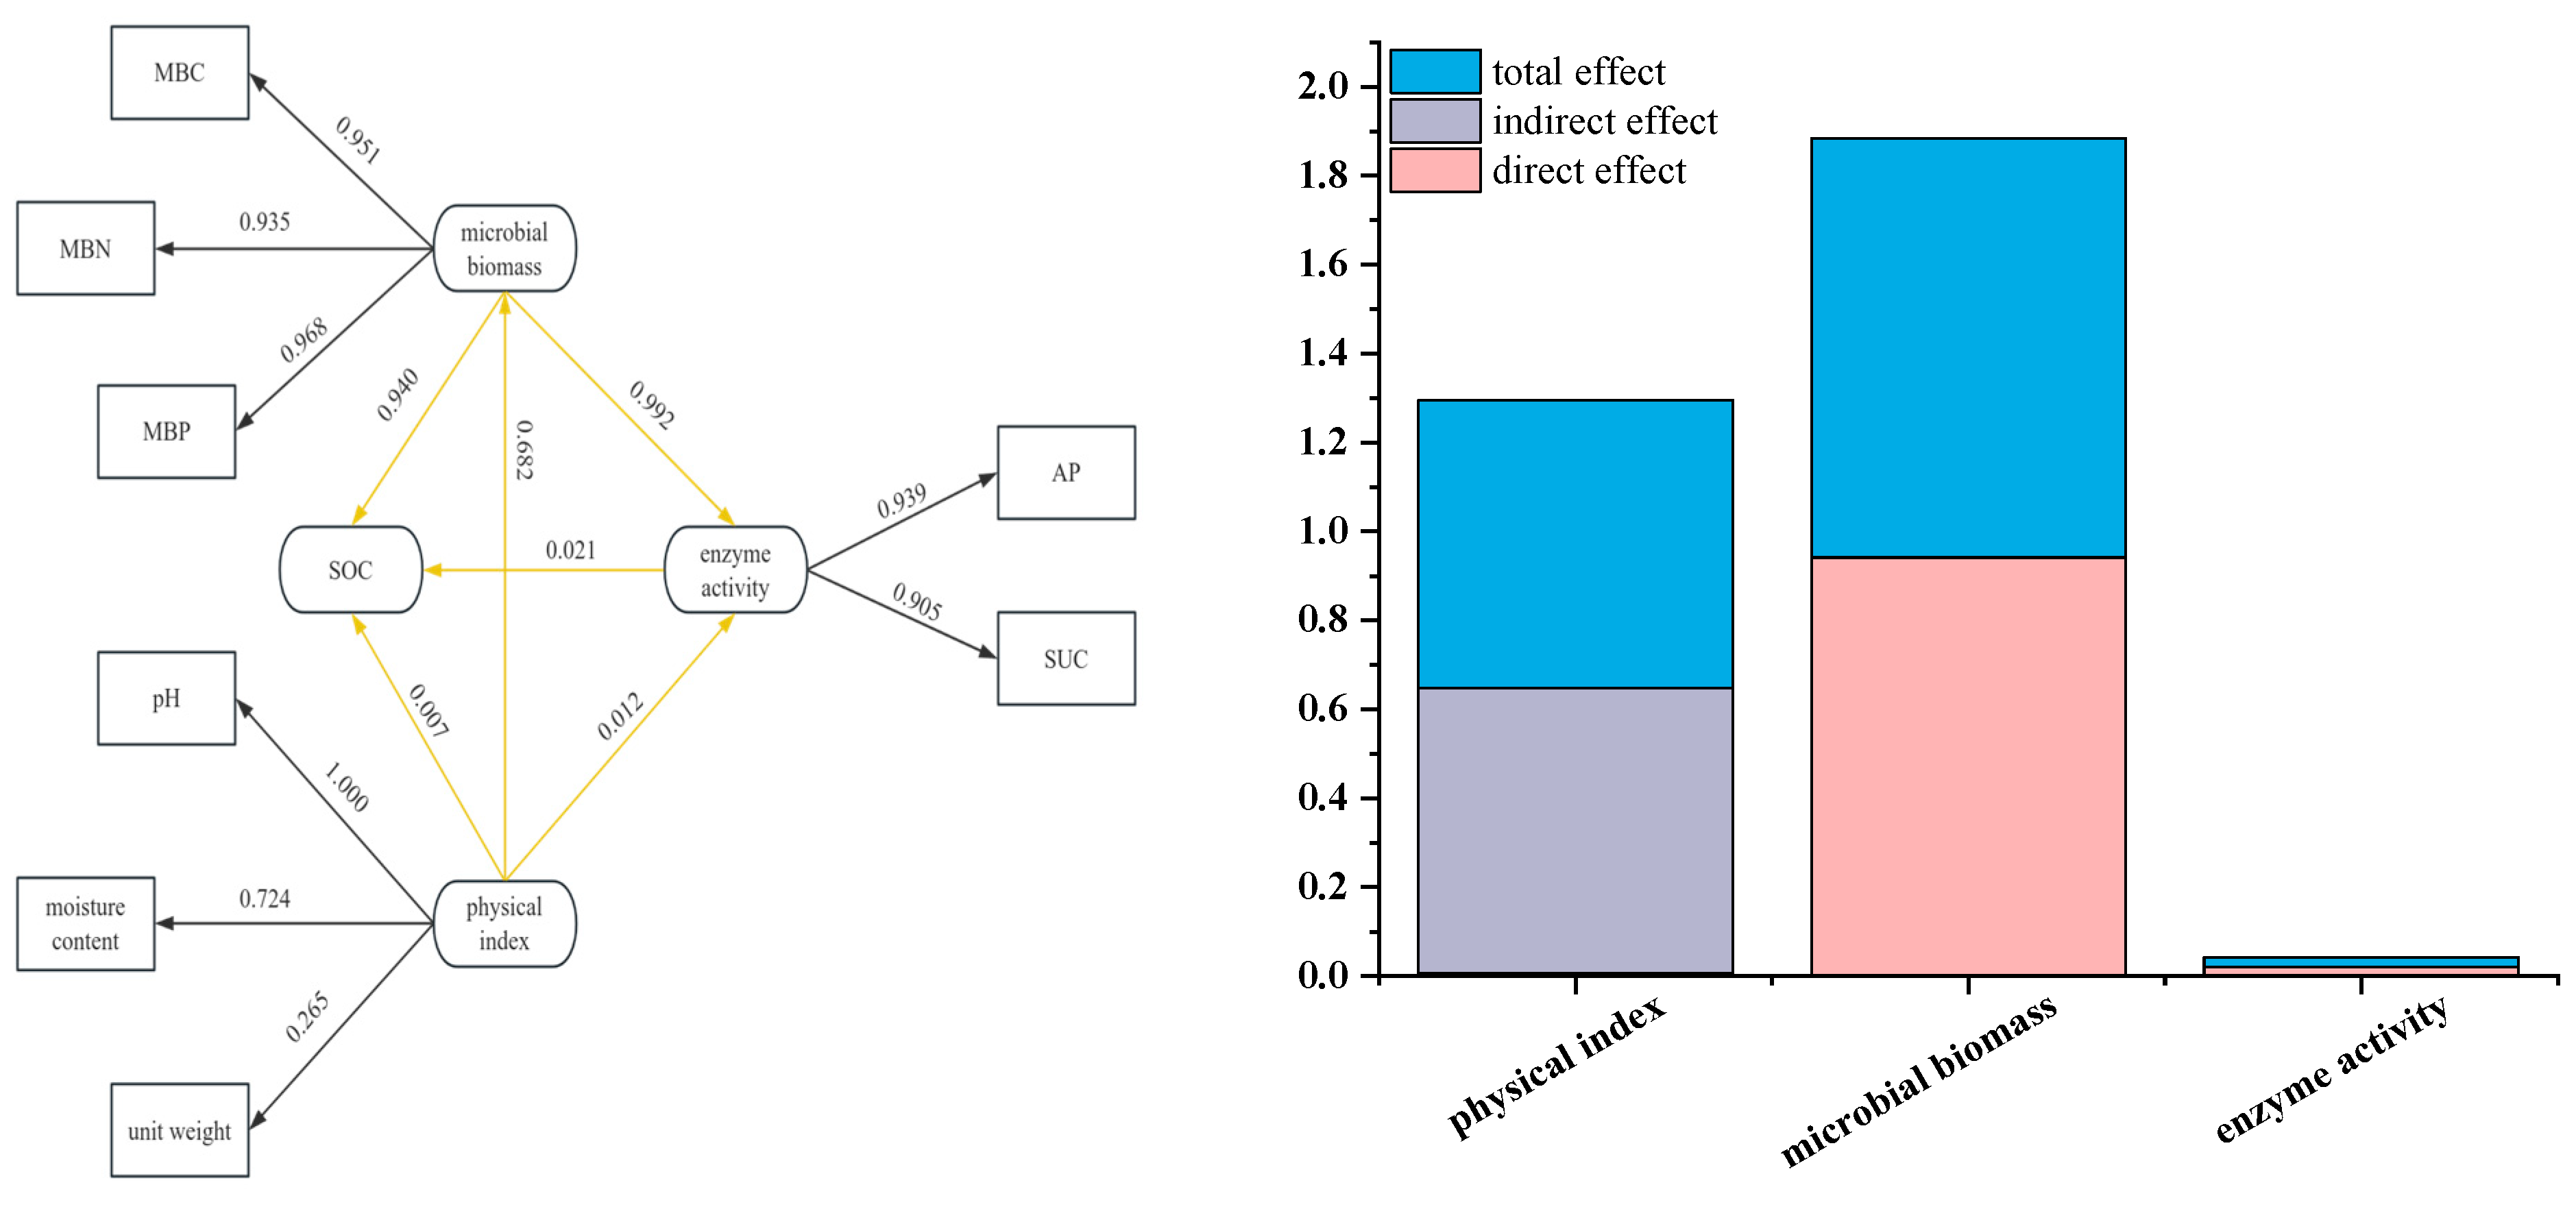
3.6. Structural Equation Modeling (SEM)

As can be seen from Figure 9, the direct effect of soil physical indicators on soil organic carbon under different treatments was 0.007. The direct effect of microbial biomass on soil organic carbon was 0.940. The direct effect of enzyme activity on soil organic carbon was 0.021. However, the indirect effect of soil physical indicators on soil organic carbon under different treatments was 0.641. The indirect effect of microbial biomass on soil organic carbon was 0.002. There was no indirect effect of enzyme activity on soil organic carbon. Overall, microbial biomass had the greatest effect on soil organic carbon at 0.942. Physical indicators had less effect on soil organic carbon which was 0.648. Enzyme activity had the least effect on soil organic carbon which was 0.021.

4. Discussion

4.1. Effects of Straw Incorporation Amount on Soil Physicochemical Properties

Soil pH is one of the important indicators of soil fertility, and the ideal soil pH range for most crop growth is roughly between 6.0 and 7.0, an interval that maximizes the effectiveness of elements such as nitrogen, phosphorus, and potassium in the soil [18]. Research has shown that soil pH decreases as the amount of straw input to the field increases. The reason may be that the amount of straw input to the field can make the straw and soil fully contact, thus accelerating the decomposition of soil organic matter, and at the same time improving the soil water content, which leads to the reduction of soil pH, this point of view is consistent with the results of the previous study [19].
Soil water content, as one of the important components of soil, is an important material basis for soil energy transformation, which can affect the decomposition and transformation process of soil materials [20]. Straw input to the field can improve the soil moisture condition and increase the water content of the soil in the dry land, and the effects of different amounts of straw input to the field on soil water content were different, which showed that as the amount of straw input to the field increased, the soil water content was improved to different degrees [21,22].
With the increasing amount of straw input to the field, the soil unit weight of dry-crop farmland has been significantly reduced. This phenomenon suggests that the rational utilization of crop wastes not only improves soil structure but also plays a positive role in improving the soil’s water retention capacity and regulating the overall health of farmland ecosystems. This type of farming helps to enhance the physical stability of the soil, thus providing a more solid and moist growing environment for crops.

4.2. Effects of Straw Incorporation Amount on Microorganisms and Enzyme Activity

As an important source of organic fertilizer, crop straw contains a considerable amount of carbon, nitrogen, phosphorus, potassium, and other nutrients necessary for crop growth [23], and after straw is input to the field, it will increase the nutrient content of the soil through decomposition for crop growth and has a promotional effect on the growth and development of crops. Straw returned to the field can improve the soil structure, increase the content of soil agglomerates, reduce the soil bulk weight, and improve the soil porosity. These changes are favorable to the survival and activities of soil microorganisms, providing a good environment for microorganisms to grow. Wheat straw C/N is generally higher, after input to the field in the early stage of decomposition of microbial reproduction and growth of nitrogen deficiency, to meet their own nitrogen needs, microorganisms will be absorbed from the soil mineral nitrogen, resulting in microorganisms and plants compete for nitrogen nutrients [24]. Most of the nutrients in the straw exists in the form of the organic state, and the mineral state exists in a relatively small amount of the organic state, decomposition rate is slow, and the effect of nutrients released to the soil in the short term is not obvious. The impact of nutrients released into the soil in the short term is not obvious, which will lead to soil C/N imbalance. Under the same fertilization level, too much straw input to the field would lead to the increase in soil C/N, and there was not enough nitrogen in the soil for microbial reproduction and growth, and the number and activity of microorganisms were reduced, which led to the decrease in the decomposition rate of straw.
In this study, it was found that under the fertilization level of this experiment, the 4-fold straw input treatment significantly increased the soil microbial carbon, nitrogen, and enzyme activities compared with the control, which indicated that the C/N was controlled in a suitable range under this input rate, which was conducive to the improvement of soil microbial biomass and microbial activity, and the increase in soil microbial population would further increase the amount of secretion including soil enzymes [25], thus improving the soil enzyme activities. Crop straw contains certain nutrients, such as cellulose, hemicellulose, lignin, protein, and nutrients such as nitrogen, phosphorus and potassium. After straw is returned to the field, these nutrients are utilized by soil microorganisms, which promotes the growth and reproduction of microorganisms, thus increasing soil microbial biomass. The increase in soil microbial population will further increase the amount of secretion including soil enzymes [26], thus improving soil enzyme activity. Returning straw to the field can improve the physicochemical properties of the soil and increase the permeability and water retention of the soil, which is conducive to the increase in soil enzyme activity. Soil enzymes are important catalysts for soil biochemical reactions and play an important role in the transformation and release of soil nutrients. After straw is returned to the field, with the increase of organic matter in the soil and the enhancement of microbial activities, the activity of soil enzymes is also increased accordingly, which helps to accelerate the soil nutrient cycle and transformation. Wenxin et al. [27] investigated the effects of different amounts of straw input to the field on the functional diversity of soil microbial communities, and found that straw input to the field increased the number of soil bacteria, and 2/3 of straw input to the field was the best; Chen Dong Lin et al. [28] found that the effects of the amount of straw input to the field on the soil microbial activity of soil microorganisms were different in different tillage methods, and the soil microbial activity was high in the treatment of 2/3 straw input to the field in tillage condition, and less no-tillage condition and the soil microbial activity was high in the treatment of 2/3 straw input to the field. The microbial activity of soil microorganisms was higher in the treatment with 2/3 of the amount of straw input to the field under tilling conditions, while the highest activity was found in the treatment with 1/3 of the amount of straw input to the field under no-tillage.
The results of these studies indicated that the number and activity of soil microorganisms were affected by factors such as the amount of straw input to the field, which was also proved in this experiment. In contrast, Lu et al. [29] found that the activities of various soil enzymes in the 0–20 cm soil layer of each treatment did not reach significant differences after straw input, which might be caused by different soil textures, cropping systems, and climatic conditions.

4.3. Effects of Straw Incorporation Amount on Soil SOC

When straw is input into the soil as an exogenous carbon source, the fundamental pathway of decomposition is the secretion of relevant enzymes by soil microorganisms to the surrounding environment to carry out biochemical catalytic reactions [30]. The activities of different enzymes in the soil can be used to indicate the organic carbon content and the number of microorganisms in some aspects [31], and the changes in soil enzyme activities after straw is input into the field can also be used as one of the effective parameters for judging soil fertility [32]. In addition, previous studies have shown that microorganisms in the decomposition of crop straw will consume CO2 and water in the soil, but at the same time, their microbial respiration will also release CO2, and the negative impacts of CO2 emissions should not be ignored [33]. Part of the carbon in straw enters into the air, while the other part is retained in the soil to increase soil fertility in the form of different components of organic carbon [34]. To achieve the goals of “carbon peak” and “carbon neutrality”, a reasonable amount of input to the field is the key to emission reduction [35]. Moreover, studies have shown that the storage and long-term accumulation of organic carbon in soil is important for mitigating climate change and increasing the sustainability of crop productivity [36].

5. Conclusions

In this paper, the effects of different amounts of straw on the soil organic carbon (SOC), soil microbial carbon, nitrogen and phosphorus, and enzyme activities under traditional tillage conditions were comprehensively investigated, and the correlation between the four was analyzed. The results were summarized as follows: (1) Straw’s input to the field could improve the soil’s physicochemical properties. According to the changes in the characteristics after 45 d of straw input, the soil physicochemical properties changed to different degrees with different straw input treatments during the straw input process. Compared with the straw-unreturned (CK) treatment, the pH, water content, bulk weight, and SOC were all increased to different degrees after straw input, with the 4-fold straw input treatment being the most significant. (2) The four-fold straw input treatment had the most obvious effect on the enhancement of micro biomass carbon, nitrogen, and phosphorus, which were significantly increased by 11.4%, 40.4%, and 27.5%, respectively, compared with the control, while the other treatments did not reach the significant difference. (3) Soil enzyme activities were increased in different straw input treatments compared with the control straw-non-input treatment, and the degree of increase varied according to the amount of straw input. (4) Soil microbial carbon, nitrogen and phosphorus, and soil enzyme activities were all higher in different straw input treatments than in the control straw-non-input treatment, and all of them showed a trend of 0–10 cm > 10–20 cm > 20–30 cm. (5) Correlation analysis showed that there was a significant correlation between sucrase, alkaline phosphatase, and microbial mass carbon nitrogen and phosphorus, indicating that soil enzyme activity and microbial mass could, to some extent, respond to the soil fertility and soil quality status, and were good indicators to describe the soil quality. In the case of straw doubling, there is a close ecological effect relationship between soil microbial load and soil enzyme activity. On the one hand, the increase in soil microbial load provided more substrates and nutrient sources for soil enzymes, which promoted the improvement of soil enzyme activity; on the other hand, the increase in soil enzyme activity accelerated the decomposition of soil organic matter and nutrient conversion, which provided more energy and material support for soil microorganisms. (6) From the structural equation modeling, under different straw incorporation amounts, microbial biomass has a significant positive impact on soil organic carbon. Because of the long-term effect of straw input on soil fertility and the complexity of the effect on soil microbial physiological metabolism, the selection of the appropriate straw input amount needs to be studied in long-term positioning experiments.

Author Contributions

Conceptualization: X.Z. and L.C.; methodology, X.Z.; software, X.Z. and X.R.; validation, X.R. and L.C.; formal analysis, X.Z.; investigation, X.Z. and X.R.; resources, L.C.; data curation, X.Z.; writing—original draft preparation, X.Z. and L.C.; writing—review and editing, L.C.; visualization, X.Z. and X.R.; supervision, L.C.; project administration, L.C., funding acquisition, L.C. All authors have read and agreed to the published version of the manuscript.

Funding

This research was funded by the project “Research on Key Indicators of Thickened High-Strength and Easily Recyclable Plastic Film and Formulation of Local Standards for Product Quality” (GSAU-JSFW-2023-32). The study also received support from the Gansu Province Agricultural Ecology and Resource Protection Technology Promotion Station 2024 Agricultural Ecological Environment Protection Special New Technology (New Equipment) Research and Development Promotion Project (HT-SHGK-2024-037) and the project “Integration of Application Technology and Standard Formulation for Thickened High-Strength Plastic Film” (GSAU-JSFW-2022-23).

Institutional Review Board Statement

Not applicable.

Informed Consent Statement

Not applicable.

Data Availability Statement

The datasets presented in this article are not readily available because the data are part of an ongoing study.

Acknowledgments

We would like to thank the support of Gansu Provincial Key Laboratory of Arid Land Crop Science and the project “Research on Key Indicators of Thickened High-Strength and Easily Recyclable Plastic Film and Formulation of Local Standards for Product Quality” (GSAU-JSFW-2023-32) and the Gansu Province Agricultural Ecology and Resource Protection Technology Promotion Station 2024 Agricultural Ecological Environment Protection Special New Technology (New Equipment) Research and Development Promotion Project (HT-SHGK-2024-037) and the project “Integration of Application Technology and Standard Formulation for Thickened High-Strength Plastic Film” (GSAU-JSFW-2022-23), guidance (ideas and writing, eta) of Liqun Cai and in this project, as well as help in software processing and project investigation by Xiaoyan Ren.

Conflicts of Interest

The authors declare no conflicts of interest.

References

  1. Powlson, D.S.; Prookes, P.C.; Christensen, B.T. Measurement of soil microbial biomass provides an early indication of changes in total soil organic matter due to straw incorporation. Soil Biol. Biochem. 1987, 19, 159–164. [Google Scholar] [CrossRef]
  2. Kolb, S.E.; Fermanich, K.J.; Dornbush, M.E. Effect of Charcoal Quantity on Microbial Biomass and Activity in Temperate Soils. Soil Sci. Soc. Am. J. 2009, 73, 1173–1181. [Google Scholar] [CrossRef]
  3. Lao, X.; Wu, Z.; Gao, Y. Effect of Long-Term Inputing Straw to Soil on Soil Fertility. Trans. Chin. Soc. Agric. Eng. 2002, 18, 49–52. [Google Scholar]
  4. Angens, D.A.; Bissomette, N.; Legere, A.; Samson, N. Microbial and biochemical changes induced by rotation and tillage in soil under barley production. Can. J. Soil Sci. 1993, 73, 39–50. [Google Scholar] [CrossRef]
  5. Parkin, T.B. Spatial variability of microbial processes in soil: A view. J. Environ. Qual. 1993, 22, 409–417. [Google Scholar] [CrossRef]
  6. Jiang, Y.; Liang, W.; Wen, D.Z. Effects of no-tillage on soil biological properties in farmlands: A review. Chin. J. Soil Sci. 2004, 35, 347–351. [Google Scholar]
  7. Wright, D.; MacLeod, B.; Hammond, N.; Longnecker, N. Can grain growers and agronomists identify common leaf diseases and biosecurity threats in grain crops? An Australian example. Crop Prot. 2016, 89, 78–88. [Google Scholar] [CrossRef]
  8. Gao, F.; Cui, Z.; Sun, S. Effects of straw input on soil moisture, corn biological traits, and yield in the dry zone of east-central Gansu. Arid Reg. Agric. Res. 2016, 34, 74–78. [Google Scholar]
  9. Lu, W.; Jia, Z.; Gao, F. Effects of straw input on soil moisture and crop productivity in dry-crop farmland in Ningnan. J. Agric. Environ. Sci. 2011, 30, 93–99. [Google Scholar]
  10. Wu, F. Effects of Continuous Multi-Year Corn Stover Input on Soil Physicochemical Properties and Crop Growth. Master’s Thesis, China Agricultural University, Beijing, China, 2005. [Google Scholar]
  11. Sadet-Bourgeteau, S.; Djemiel, C.; Chemidlin Prévost-Bouré, N.; Feder, F. Dynamic of bacterial and archaeal diversity in a tropical soil over 6 years of repeated organic and inorganic fertilization. Front. Microbiol. 2022, 13, 943314. [Google Scholar] [CrossRef]
  12. Lu, R.K. Soil Chemical Analysis Methods; China Agricultural Science and Technology Press: Beijing, China, 1999; pp. 106–110. [Google Scholar]
  13. Jenkinson, D.S.; Parry, L.C. The nitrogen cycle in the Broad balk wheat experiment: A model for the turnover of nitrogen through the soil microbial biomass. Soil Biol. Biochem. 1989, 21, 535–541. [Google Scholar] [CrossRef]
  14. Lu, R. Soil and Agro-Chemical Analytical Methods; China Agriculture Press: Beijing, China, 1999. [Google Scholar]
  15. Nsabimana, D.; Haynes, R.J.; Wallis, F.M. Size activity and catabolic diversity of the soil microbial biomass as affected by land use. Appl. Soil Ecol. 2004, 26, 81–92. [Google Scholar] [CrossRef]
  16. Juma, N.G.; Paul, E.A. Mince ralizable soil nitrogen: Amounts and ex-tractability ratios. Soil Sci. Am. J. 1984, 48, 76–80. [Google Scholar] [CrossRef]
  17. Wu, J.-S.; Lin, Q.-M.; Huang, Q.-Y.; Xiao, H.A. Determine of Soilmicrobial Biomass and Its Application; Meteorological Press: Beijing, China, 2006; pp. 65–74. [Google Scholar]
  18. Zhang, G.S.; Chan, K.Y.; Li, G.D.; Huang, G.B. Effect of straw and plastic film management under contrasting tillage practices on the physical properties of an erodible loess soil. Soil Tillage Res. 2008, 98, 113–119. [Google Scholar] [CrossRef]
  19. Liu, S.; Zhang, H.; Li, T. Effects of tillage practices on soil properties and winter wheat yield in dry farmland in Northwest China. Northwest J. Agric. 2019, 28, 1411–1418. [Google Scholar]
  20. Zhong, Z. Experiments on the determination of soil moisture content. Rural Econ. Technol. 2016, 27, 2–3. [Google Scholar]
  21. Meng, Q.-F.; Li, D.-W.; Zhang, J.; Zhou, L.-R.; Wang, H.-Y.; Wang, G.-C. Soil properties and corn (Zea mays L.) production under manure application combined with deep tillage management in solonetzic soils of Songnen Plain, Northeast China. J. Integr. Agric. 2016, 15, 879–890. [Google Scholar] [CrossRef]
  22. Li, Y.; Sun, J.; Liu, J.; Yuan, Z.; Hu, S.; Sun, C.; Du, J.; Ji, W.; Cao, G.; Wang, Z. Effects of Straw Returning on Drought Tolerance and Growth Status of Maize Under Drought Stress in the Cold and Arid Regions of Northern China. Agronomy 2024, 14, 2580. [Google Scholar] [CrossRef]
  23. Maizels, M. Effect of sodium content on sodium efflux from human red cells suspended in sodium-free media containing potassium, rubidium, cesium, or lithium chloride. J. Physiol. 1968, 195, 657–679. [Google Scholar] [CrossRef]
  24. Ye, W.-P.; Xie, X.-L.; Wang, K.-R.; Li, Z.-G. Effects of rice straw manuring in different periods on growth and yield of rice. Chin. J. Rice Sci. 2008, 22, 65–70. [Google Scholar]
  25. Chen, C.-Q.; Hu, Q.-Y.; Sun, B.; Zhang, J.-B. Simulating trends in soil organic carbon in calcareous flavor aquic soil under long-term fertilization using the DNDC model. Plant Nutr. Fertil. Sci. 2010, 16, 1410–1417. [Google Scholar]
  26. Ren, W.-J.; Huang, Y.; Wu, J.-X.; Liu, D.-Y.; Yang, W.-Y. Effects of no-till agenda stubble-remaining on soil enzyme activities in broadcasting rice seedlings paddy field. J. Appl. Ecol. 2011, 22, 2913–2918. [Google Scholar]
  27. Zhou, W.; Chen, D.; Bu, Y.; Tu, N.M. Effects of rice straw inputing to the field on the metabolic diversity of soil microbial communities. Acta Sci. Circumstantiae 2008, 28, 326–330. [Google Scholar]
  28. Chen, D.; Yi, Z.; Zhou, W.; Tu, N. Effects of straw input on soil nutrients and microorganisms in late rice under different soil tillage systems. Acta Sci. Circumstantiae 2010, 30, 1722–1728. [Google Scholar]
  29. Lu, W.-T.; Jia, Z.-K.; Zhang, P.; Wang, W.; Hou, X.-Q.; Yang, B.-P.; Li, Y.-P. Effects of straw re-turning on soil labile organic carbon and enzyme activity in semi-arid areas of southern Ning Xia, China. J. Agro Environ. Sci. 2011, 30, 522–528. [Google Scholar]
  30. Han, W.; He, M. The application of exogenous cellulase to improve soil fertility and plant growth due to the acceleration of straw decomposition. Bioresour. Technol. 2010, 101, 3724–3731. [Google Scholar] [CrossRef]
  31. Tian, J.; Sun, C.; Yang, M.; Zhang, X. Studies on the Activities of Three Kinds of Soil Enzyme, Organic Matters, Microbes, and the Yields and Quality of Apples in Different Tree-aged Apple Orchards in Loess Plateau. J. Agric. Sci. Technol. 2012, 14, 115–122. [Google Scholar]
  32. Zhang, P.; Chen, X.; Wei, T.; Yang, Z.; Jia, Z.; Yang, B.; Han, Q.; Ren, X. Effects of straw incorporation on the soil nutrient contents, enzyme activities, and crop yield in a semiarid region of China. Soil Tillage Res. 2016, 160, 65–72. [Google Scholar] [CrossRef]
  33. Akhtar, M.; Malik, A. Roles of organic soil amendments and soil organisms in the biological control of plant-parasitic nematodes: A review. Bioresour. Technol. 2000, 74, 35–47. [Google Scholar] [CrossRef]
  34. Kunzová, E.; Hejcman, M. Yield development of winter wheat over 50 years of FYM, N, P and K fertilizer application on black earth soil in the Czech Republic. Field Crops Res. 2009, 111, 226–234. [Google Scholar] [CrossRef]
  35. García Sanchez, D. Decision making and the energy path towards carbon neutrality. The Case of Costa Rica. In Proceedings of the Berlin Conference on Human Dimensions of Global Environmental Change, Berlin, Germany, 5–6 October 2012. [Google Scholar] [CrossRef]
  36. Li, Z.P.; Han, F.X.; Su, Y.; Zhang, T.L.; Sun, B.; Monts, D.L.; Plodinec, M.J. Assessment of soil organic and carbonate carbon storage in China. Geoderma 2007, 138, 119–126. [Google Scholar] [CrossRef]
Figure 1. Overview of the study area.
Sustainability 16 10588 g001
Figure 2. Effects of different amounts of straw on pH.
Sustainability 16 10588 g002
Figure 3. Effects of different amounts of straw on soil moisture.
Sustainability 16 10588 g003
Figure 4. Effects of different amounts of straw on unit weight.
Sustainability 16 10588 g004
Figure 5. Effects of different amounts of straw on soil microbial biomass-C (A) N (B).
Sustainability 16 10588 g005
Figure 6. Effects of different amounts of straw on soil microbial biomass-P.
Sustainability 16 10588 g006
Figure 7. Effects of different amounts of straw on soil organic carbon.
Sustainability 16 10588 g007
Figure 8. Correlation analysis of soil total organic carbon with soil microbial carbon, nitrogen, phosphorus, and enzyme activities.
Sustainability 16 10588 g008
Figure 9. Overall model standardization path.
Sustainability 16 10588 g009
Table 1. Experimental design.
Processing CodeTreatmentAmount of Straw Input to the Field (kg/hm2)
CKStraw Not Input to Fields0 kg/hm2
T11× Straw Input to Fields3500 kg/hm2
T22× Straw Input to Fields7000 kg/hm2
T34× Straw Input to Fields14,000 kg/hm2
Table 2. Sucrase activity of different straw incorporation amounts (mg·(g·h)−1).
Treatment0–10 cm10–20 cm20–30 cm
CK4.33 ± 0.13 abcd4.22 ± 0.18 bcd3.35 ± 0.40 f
T14.45 ± 0.16 abc4.37 ± 0.16 abcd3.79 ± 0.08 e
T24.49 ± 0.10 abc4.47 ± 0.11 abc4.07 ± 0.14 de
T34.58 ± 0.07 a4.54 ± 0.03 ab4.20 ± 0.01 cd
Note: CK (no straw input to the field), T1 (1-fold input to the field), T2 (2-fold input to the field), T3 (4-fold input to the field), different letters indicate significant differences (p < 0.05).
Table 3. Alkali phosphatase activity of different straw incorporation amounts (mg·(g·h)−1).
Treatment0–10 cm10–20 cm20–30 cm
CK0.28 ± 0.01 abcd0.26 ± 0.01 cde0.25 ± 0.01 e
T10.27 ± 0.01 abcd0.27 ± 0.01 bcde0.25 ± 0.01 de
T20.29 ± 0.03 ab0.26 ± 0.00 cde0.25 ± 0.01 cde
T30.30 ± 0.01 a0.28 ± 0.01 abc0.27 ± 0.00 bcde
Note: CK (no straw input to the field), T1 (1-fold input to the field), T2 (2-fold input to the field), T3 (4-fold input to the field), different letters indicate significant differences (p < 0.05).
Disclaimer/Publisher’s Note: The statements, opinions and data contained in all publications are solely those of the individual author(s) and contributor(s) and not of MDPI and/or the editor(s). MDPI and/or the editor(s) disclaim responsibility for any injury to people or property resulting from any ideas, methods, instructions or products referred to in the content.

