Article

Quantifying the Effects of Wind Turbulence on CO2 Flux Measurement in a Closed Chamber

1
College of Mathematics and Computer Science, Zhejiang A&F University, Hangzhou 311300, China
2
Zhejiang Provincial Key Laboratory of Forestry Intelligent Monitoring and Information Technology Research, Zhejiang A&F University, Hangzhou 311300, China
3
College of Chemistry and Materials Engineering, Zhejiang A&F University, Hangzhou 311300, China
*
Author to whom correspondence should be addressed.
Sustainability 2024, 16(23), 10501; https://doi.org/10.3390/su162310501
Submission received: 14 November 2024 / Revised: 26 November 2024 / Accepted: 28 November 2024 / Published: 29 November 2024
(This article belongs to the Section Soil Conservation and Sustainability)

Abstract

:
This study aimed to investigate the effects of wind turbulence on CO2 transport within a medium and the extent of measurement errors in a closed chamber. Therefore, in a laboratory with controllable environmental conditions, the measurement performance of the closed chamber at various wind speeds was assessed using a soil respiration calibration apparatus and four types of porous media. The experimental results indicated that the closed chamber under the influence of wind turbulence exhibited varying degrees of underestimation, ranging from −51 to −6%. The effects of wind turbulence were more pronounced in sandy soils. As wind turbulence enhanced gas transport within the medium, the flux measurements of the closed chamber were biased, and this phenomenon was closely related to the medium’s particle size and surface wind speed. To address this issue, it is recommended to conduct long-term monitoring and eliminate errors by averaging repeated measurements, which will improve the accuracy of the ecosystem carbon budget.

1. Introduction

Global warming is a critical environmental issue faced worldwide. It not only threatens biodiversity and ecosystem stability, but also poses significant threats to human society, economic development, and quality of life. The primary cause of global warming is the accumulation of excessive greenhouse gases in the atmosphere, which prevent the dispersion of heat generated by surface radiation, thus leading to an increase in air temperature. Soil is a major source of greenhouse gases such as methane (CH4), carbon dioxide (CO2), and nitrous oxide (N2O) [1], and it acts as a vast carbon reservoir, releasing approximately 98 ± 12 Pg C of CO2 annually [2], which is about 15 times the amount released annually by the combustion of fossil fuels [3,4]. Soil respiration is a crucial mechanism for the exchange of CO2 between terrestrial ecosystems and the atmosphere [5]. Even minor changes in soil respiration can significantly alter atmospheric CO2 concentrations, directly affecting the global climate [6]. Measuring soil respiration is a challenging task because of the involvement of various complex biological, chemical, and physical processes. The accuracy and reliability of these measurements directly affects the estimation of soil carbon flux and the understanding of ecosystem carbon cycle dynamics [7,8].
To estimate the flux generated by soil respiration in terrestrial ecosystems and understand the CO2 emissions of soil, researchers have developed numerous methods over the past few decades to measure soil respiration, including chamber methods, isotopic labeling, box methods, gas well methods, and eddy covariance techniques [9]. Each method has different advantages, disadvantages, and applicable scenarios. The chamber method, due to its simplicity and speed, is the most commonly used, accounting for over 95% of applications [9,10,11,12,13,14,15]. The chamber measurement method used in early research was the closed static chamber method, which measured flux values by absorbing CO2 with an alkaline solution. However, this method tends to overestimate low CO2 fluxes and underestimate high CO2 fluxes [16,17]; hence, it is now used less. Currently, the most commonly used methods are the closed dynamic chamber and open chamber methods. The closed dynamic chamber method calculates the soil CO2 flux by modeling the rate of change in CO2 concentration over time within a chamber. The open chamber method calculates the soil CO2 flux based on the gas flow rate and the difference in the CO2 concentration between the incoming and outgoing air. The closed dynamic chamber method is still predominantly used. However, biases in flux measurements using the closed dynamic chamber method have been identified, and several potential factors that may lead to overestimation or underestimation have been established [11,17,18,19].
First, the duration of chamber deployment increases the uncertainty in flux calculations. During shorter deployment times, placing the chamber on the soil surface can disturb the soil–atmosphere interface, leading to potential measurement errors. Conversely, longer deployment times can result in the accumulation of CO2 within the chamber, causing the concentration gradient within the chamber to diminish over time. Consequently, the flux values calculated theoretically based on Fick’s law of diffusion may also decrease. Secondly, fluctuations in air pressure or wind turbulence can create the Venturi effect. Pressure fluctuations (pressure pumping effect) and wind turbulence (wind pumping effect) strongly influence soil gas transport [20], increasing emissions by approximately 30–60%. This is due to dynamic changes in the air pressure above the soil, which convert the dominant mode of gas transport from diffusion into convection, and result in discrepancies between the measured results and actual CO2 fluxes. A study conducted by Mohr [21] at a coniferous forest site demonstrated that wind-induced air pressure fluctuations within a certain frequency range could affect gas transport in surface soil. To avoid the venturi effect, Xu [22] designed vents to equalize the pressure difference between the inside and outside of the chamber.
Therefore, as wind-turbulence-induced gas transport is often characterized by a high frequency and short duration, it is the most significant factor affecting short-time measurements in closed chambers [20,23,24]. Atmospheric turbulence has been demonstrated to significantly influence gas transport in soil [25,26,27]. Some studies have demonstrated the effect of atmospheric turbulence on gas transport within soil pores in grasslands [28] and forests [20]. Consequently, under the influence of wind turbulence, the flux values calculated by fitting flux models cannot be considered valid. Currently, the exact error induced by wind turbulence in closed-chamber measurements remains unknown. However, the effects of wind turbulence are inevitable in practical measurements; thus, this study performed a quantitative analysis of carbon flux measurements in a closed chamber under wind turbulence conditions.
To investigate the potential shortcomings of closed-chamber measurements and analyze the interference of wind-induced transport phenomena on soil respiration measurements, this study utilized a soil respiration calibration device in a laboratory setting to discuss the response relationship between wind turbulence and CO2 within various porous media. We quantitatively analyzed the measurement performance of a closed chamber in the presence of wind turbulence and explored the differences under various porous media conditions.

2. Materials and Methods

2.1. Experimental Site Description

This study was conducted between November 2023 and January 2024. To avoid the effects of sunlight, natural wind, and fluctuations in air temperature and relative humidity, the experiments were conducted on overcast days in a controlled laboratory environment, where the air temperature and relative humidity were similar. During the experimental period, the air temperature and relative humidity were maintained at 4–10 °C and 55–75%.

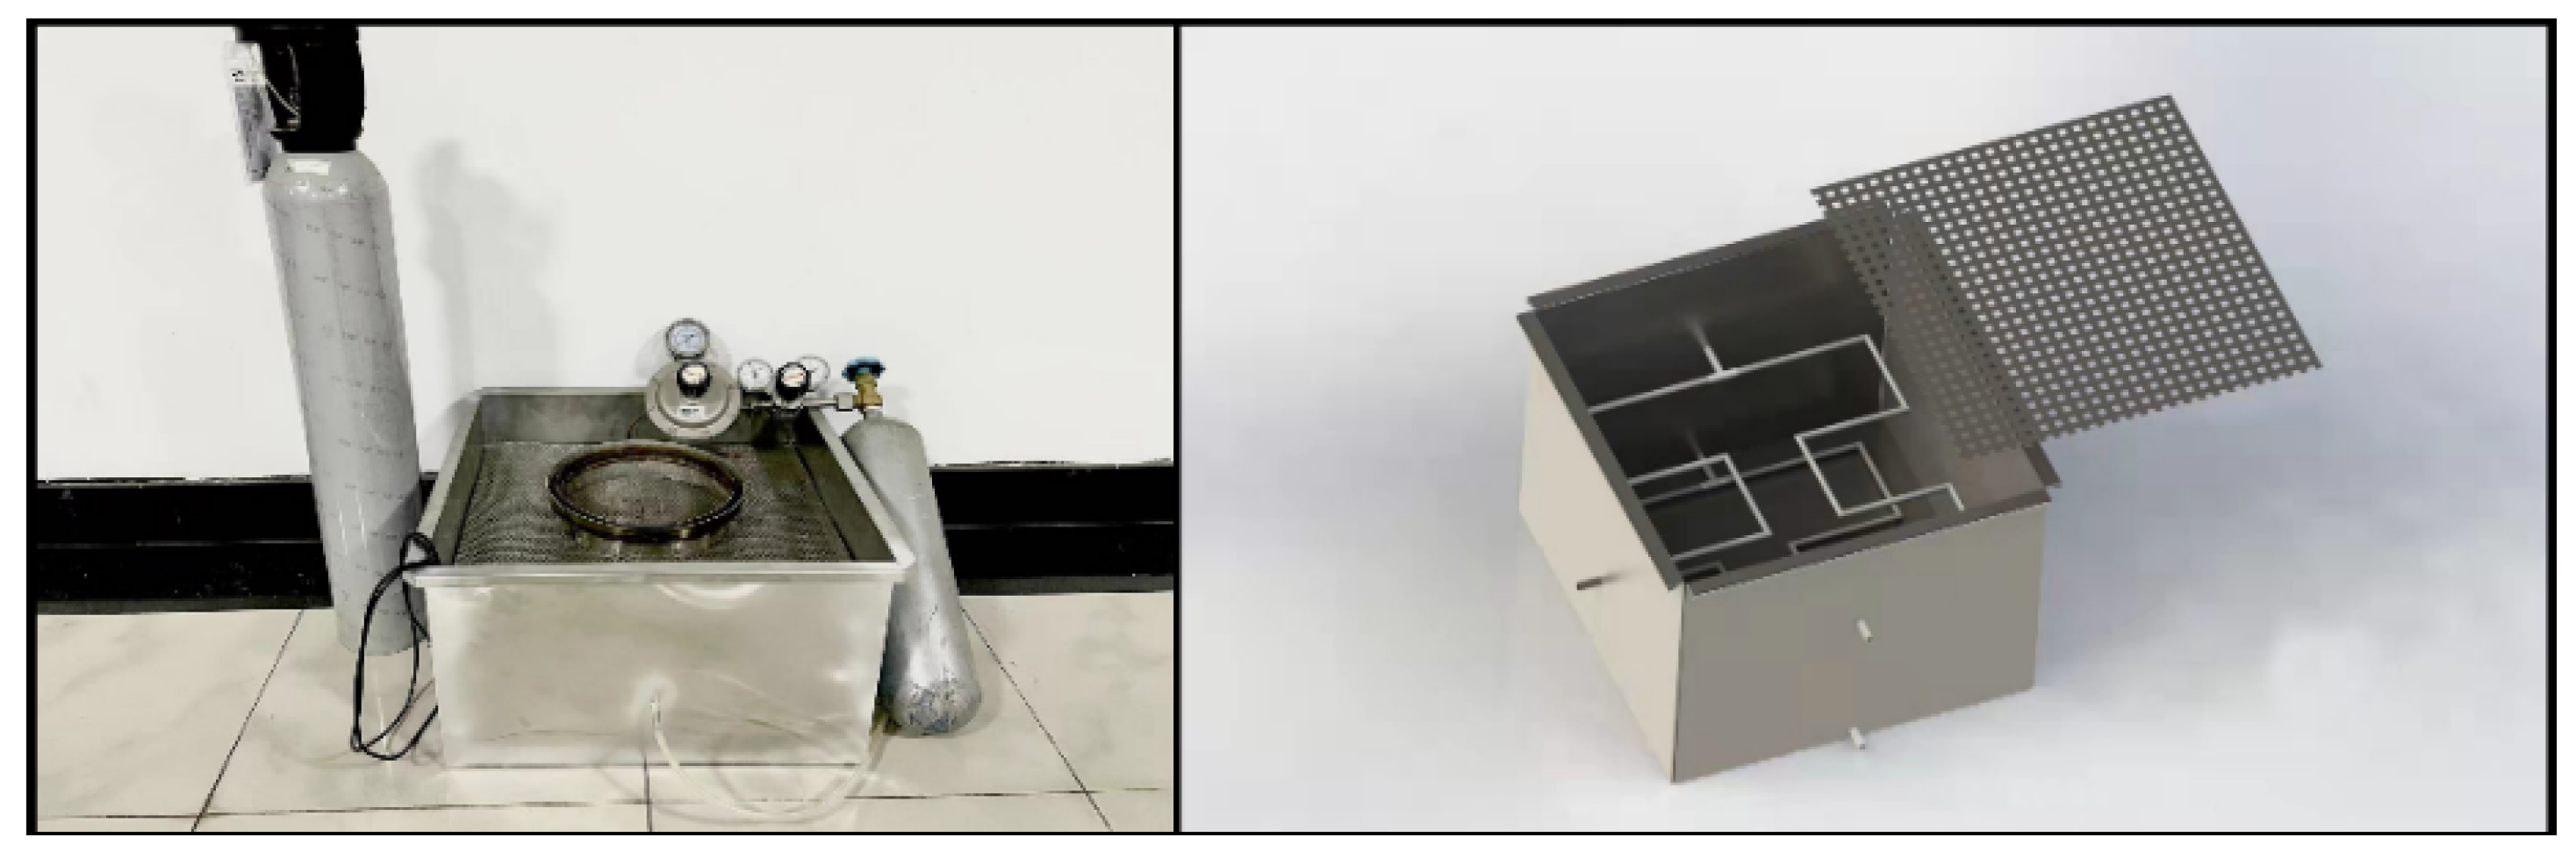
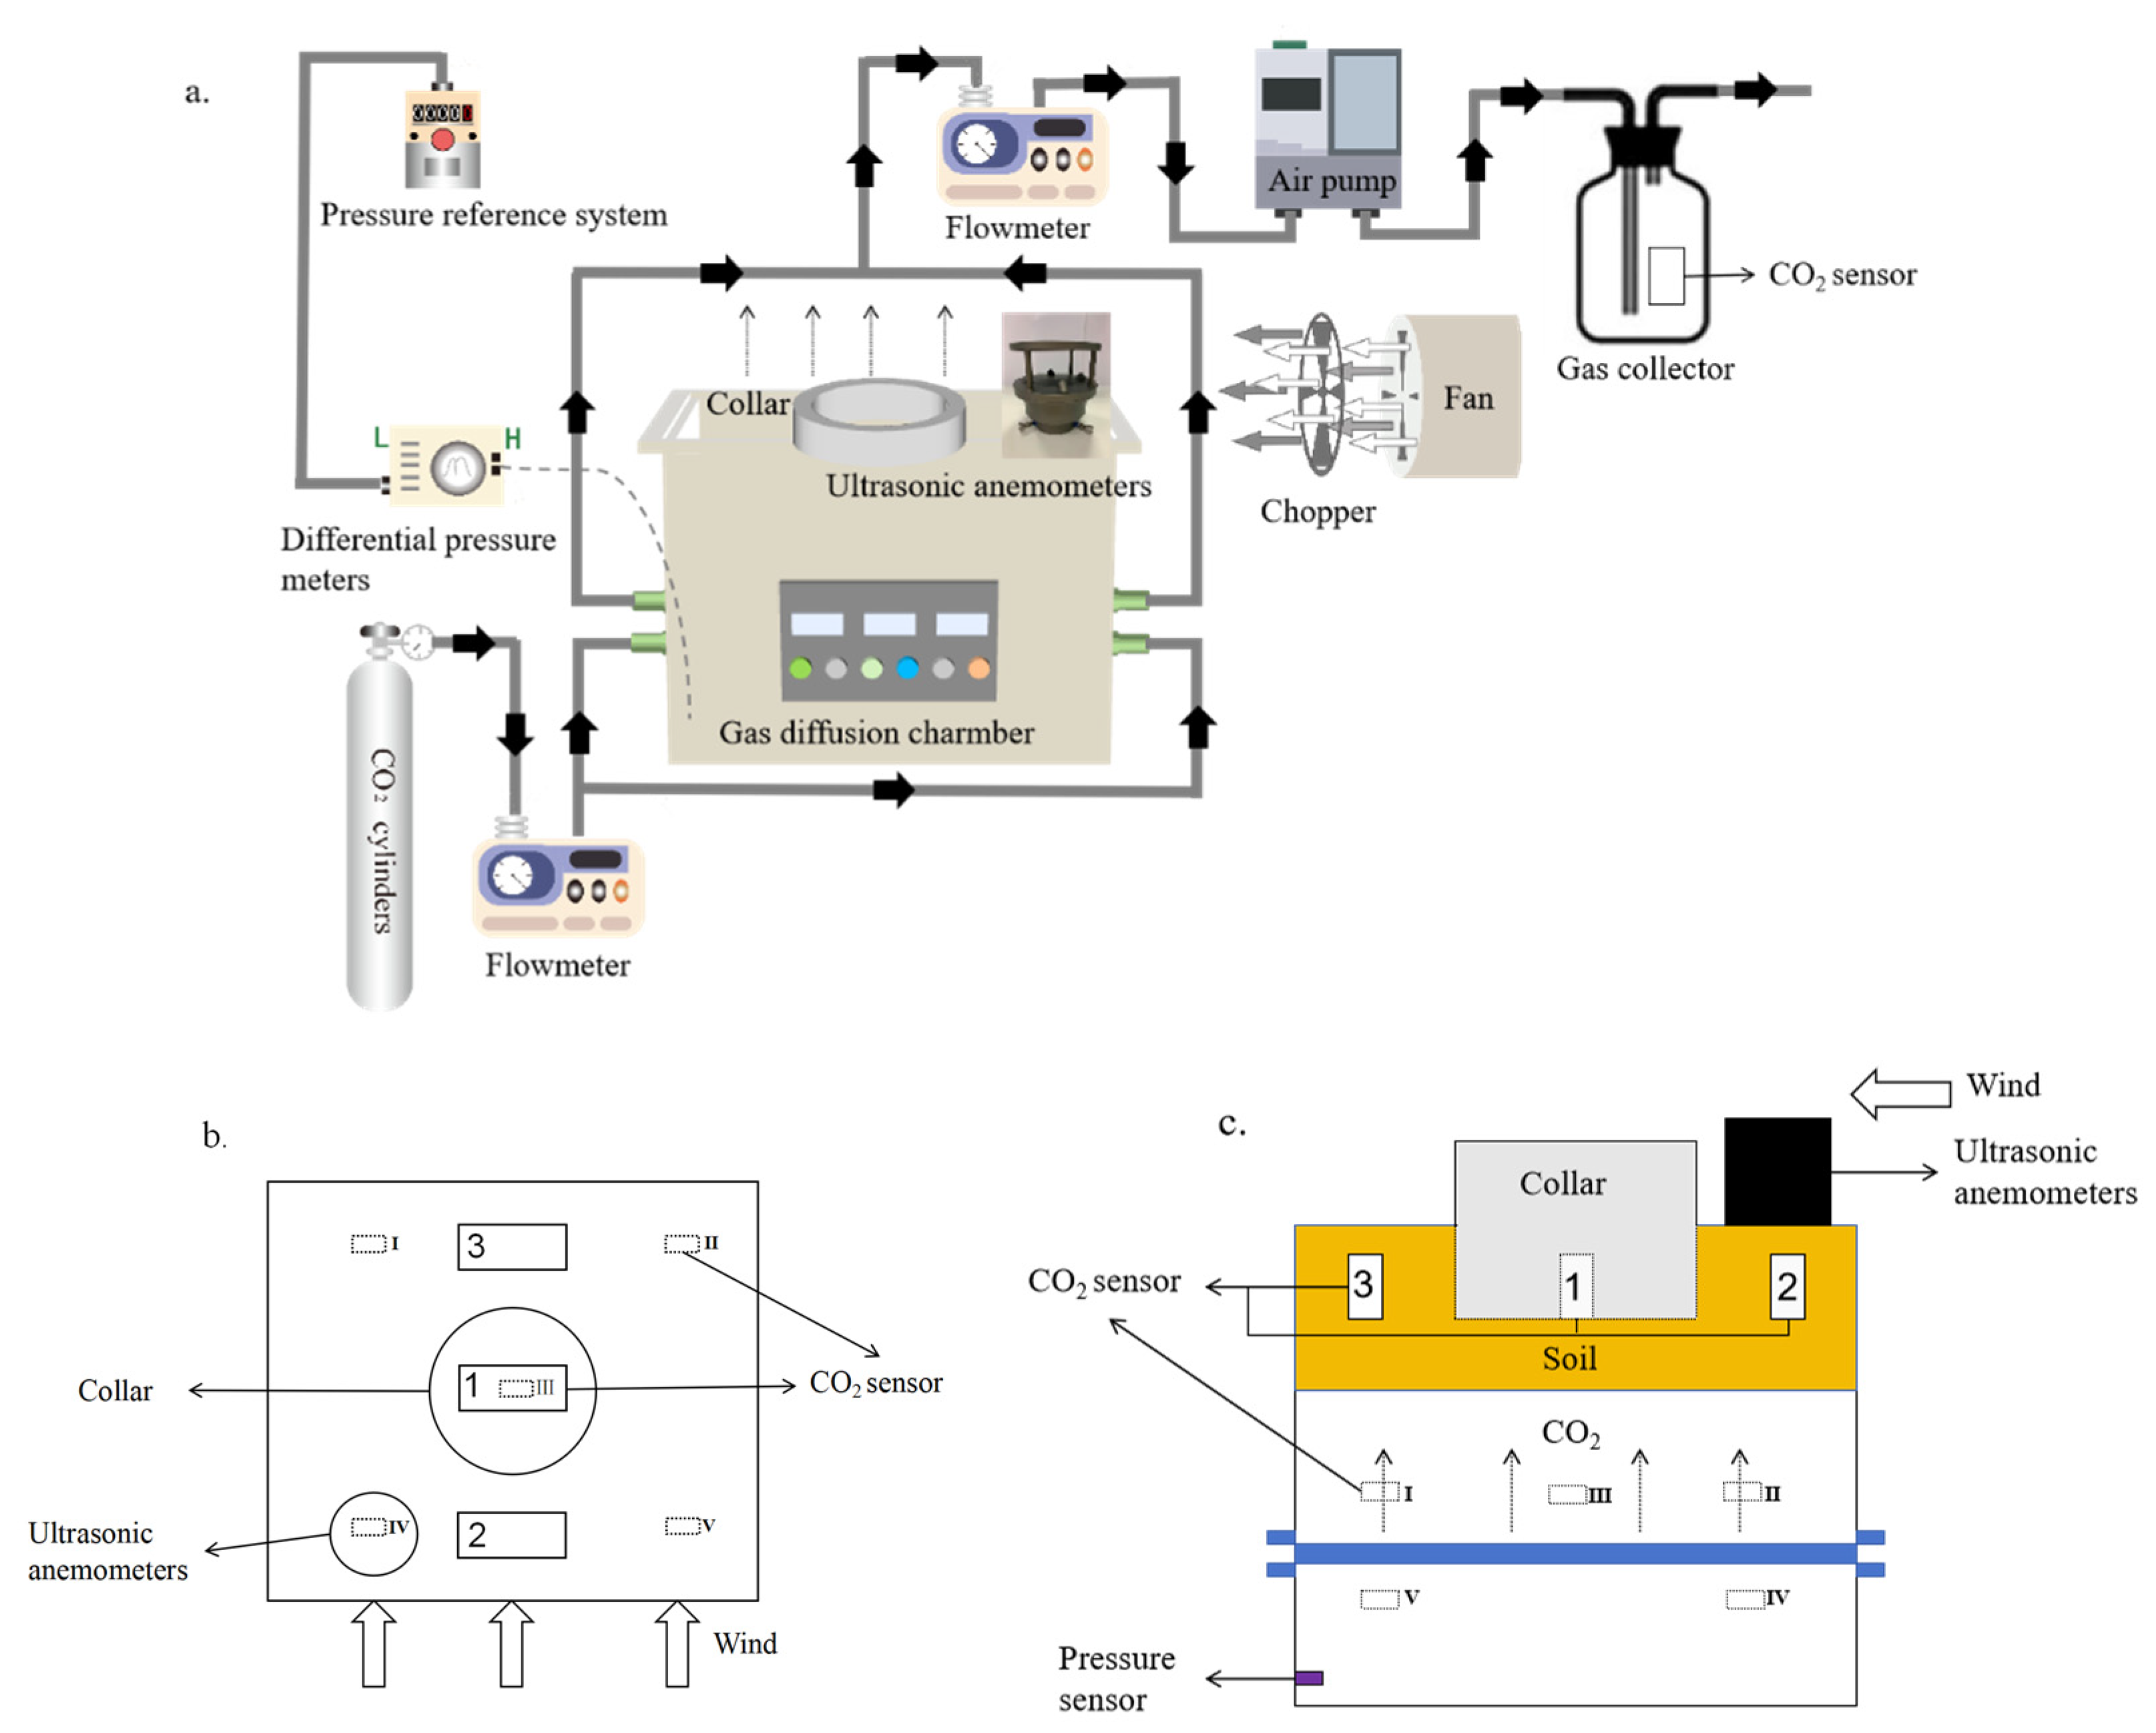
2.2. Experimental Materials

In this experiment, we employed a soil respiration calibration device designed by Jiang [29], which was originally used to evaluate the measurement performance of different chambers. In this study, we assessed the performance of a closed chamber under the influence of wind turbulence, with some modifications to meet our experimental requirements, as shown in Figure 1. The device was cuboid (70 cm long, 55 cm wide, and 40 cm high) and divided into upper and lower layers separated by a fine iron mesh.
The top layer was a 10 cm high layer filled with various porous media, and the device was equipped with a collar (at the base of the closed chamber) and three CO2 concentration sensors (GMP 252, Vaisala Corporation, Vantaa, Finland; accuracy of 2%, frequency of 1 Hz). The closed chamber had an LI-8100 automated soil CO2 flux system (Li-cor Bioscience Company, Lincoln, NE, USA) set on the collar, and measurements were taken every 2.5 min. To generate and measure wind of different turbulence intensities, the setup included a fan and an anemometer (FC-307 Beijing Feichao Wind Speed Control Instrument Co., Ltd., Beijing, China; accuracy ±2%), with a chopper to achieve stable and low-speed winds. Various porous media were used to evaluate the response of the closed chamber to different media, including sandy soil, loam, loess, and quartz sand. In order to prevent CO2 production from microbial respiration in the soil from interfering with the experimental results, the media were inactivated and dried. The diffusion coefficients of the media were calculated using the model of Buckingham (1904): DS/D0 = θ2, where Ds is the diffusion coefficient of CO2, D0 is the molecular diffusion coefficient in free air, θ is the effective porosity, and Φ is the total porosity, with θ = Φ under dry conditions [1,23]. Table 1 lists the physical properties of the four porous media used in the experiment.
The lower layer served as the gas chamber with a height of 30 cm and was filled with tracer gases. In addition, it featured symmetrically arranged S-shaped perforated tubing to ensure uniform diffusion of the tracer gases within the gas chamber. Five CO2 concentration sensors (GMP 252, Vaisala Corporation, Vantaa, Finland; accuracy ±2%, frequency of 1 Hz) were installed around the tubing to measure the change in the CO2 concentration in the gas chamber and to determine whether the gas chamber had reached a steady state. There were a total of four holes at the bottom, which were 4 cm from the base; the lower two holes were connected via tubing to a gas flow meter (MF4003-02-O6, Nanjing Shunlaida Measurement and Control Equipment Co., Ltd., Nanjing, China; accuracy ±1.5%, frequency 2 Hz) and then in series to a CO2 cylinder with a regulator valve. To simulate near-surface soil CO2 concentrations, a CO2 concentration of 4000 µmol mol−1 was used here. To avoid pressure differentials during ventilation, the gas flow was stabilized at 0.3 L min−1. The upper two holes were similarly connected through tubing to a gas flow meter and passed through a gas pump (ZL10T, Hangzhou Congxiao Electronics Co., Ltd., Hangzhou, China) flowing through a 500 mL scrubbing bottle. A CO2 concentration sensor (GMP 252, Vaisala Corporation, Finland; accuracy ±2%, frequency of 1 Hz) placed inside the scrubbing bottle was used to monitor the stability of the CO2 concentration within the calibration device before it was vented outdoors to prevent any impact on the experiment. At the bottom of the chamber, a hole was reserved for installing a differential pressure sensor (HCS3051, Qingdao Huacheng Measurement and Control Equipment Co., Ltd., Qingdao, China; accuracy ±0.075%). Specific device details can be found in Figure A1 and Jiang [29].

2.3. Calculation of Related Variables

To investigate the reliability of the closed-chamber measurements under the influence of wind turbulence, the deviations between the observed and calculated values were compared. The observed values were measured using the LI-8100 system, whereas the calculated values were derived from the data obtained using the calibration device system.

2.4. Measured Value

Currently, closed-chamber measurements are primarily categorized into two types: non-steady-state flow-through chambers (NSF) and non-steady-state nonflow-through chambers (NSNF). Both types were calculated based on numerical fitting of the changes in gas concentrations within the closed chamber. Linear and exponential models are commonly used as fitting models. The measurement formulae are as follows:
f = V R A c c t
where f represents the flux (µmol m−2 s−1), V is the volume of the closed chamber (m3), Ac is the area of the closed chamber (m2), c denotes the CO2 concentration (µmol mol−1), t is the time (s), and R is the molar volume of gas as a constant, about 24.5 (m3 mol−1) at 25 °C. In this study, it was measured by a LI-8100.

2.5. Calculated Value

In the experiment, the volume flow method [29] was used to calculate the CO2 flux, which can be calculated by the advection–diffusion equation:
c t = R f z v f z + s
where c is the gas concentration (µmol mol−1), t is the time (s), f is the CO2 flux (µmol m−2 s−1), z is the distance (m), v is the flow rate of the CO2 gas in the soil (m s−1), and s is the source term.
c t = R f z v c z  
When the gas chamber reaches a steady state, the concentration gradient is zero, and Equation (3) can be simplified to:
R f z = v c z
Integral operations are performed on both sides of Equation (4):
f = Q R A g C i n C o u t
where Q is the gas flow (L min−1) equal to 0.3 L min−1, Ag is the gas chamber area (m2) equal to 0.25 m2, Cin is the concentration of CO2 entering the chamber (µmol mol−1) equal to 4000 µmol mol−1, and Cout is the concentration of CO2 leaving the gas chamber (µmol mol−1), measured by a CO2 concentration sensor placed inside the scrubbing bottle. In this study, the calculated values under the no-wind condition were defined as the standard value.

2.6. Experiment Procedure

Before starting the experiment, the CO2 concentration in the CO2 cylinder was measured to ensure that it was at 4000 µmol mol−1. All the sensors and flow meters used in the experiment were calibrated and the collar was inserted into the soil at a depth of 3 cm, with a LI-8100 placed on top. At the beginning of the experiment, the CO2 cylinder was opened, and a precision valve was used to maintain the flow meter reading at 0.3 L min−1 (with a fluctuation of 0.003). The calibration was surrounded with a baffle, and CO2 was subsequently vented into the gas chamber layer for approximately 2–4 h, after which the baffle was removed and we waited for the concentration to drop to a steady state. In the absence of wind, CO2 was diffused from the gas chamber layer into the media layer and then into the closed chamber. When the readings of the five CO2 concentration sensors in the gas chamber layer and the three CO2 concentration sensors in the media layer stabilized, the air pump was turned on, and a precision valve was used to maintain the flow meter reading at 0.3 L min−1 (with a fluctuation of 0.003). The CO2 concentration in the scrubbing bottle was gradually increased to match that in the gas chamber layer. The gas flow is shown in Figure 1a. After waiting for another 20 min, the manometer readings were observed to confirm that they were stable or fluctuating by less than 0.1 Pa, and that the CO2 concentration readings in the chamber layer and washing bottle were stable and consistent, indicating that the chamber and media layers had reached a steady state. Under these conditions, the amount of CO2 (CinCout) discharged into the media layer per unit time was calculated using Equation (5), and the actual CO2 flux at steady state was measured using the LI-8100. The measurements were repeated several times to avoid measurement errors. Then, the fan was switched on to expose the closed chamber to wind turbulence, a 30 min wind experiment was conducted, and the wind speed and flux values measured by the LI-8100 were recorded. This operation was repeated five times before changing to the next wind speed level in order to conduct five wind speed experiments. A 30 min interval was allowed between each wind experiment to stabilize the calibration device. This procedure was repeated for each medium.

2.7. Data Analysis

The experimental measurements were saved and preprocessed using Microsoft Excel (Office 365), followed by data analysis and plotting using Origin (Origin Lab, 2020b, Northampton, MA, USA). The flux error was calculated using Equation (6).
f l u x   e r r o r = 1 m e a s u r e   v a l u e s t a n d a r d   v a l u e

3. Results

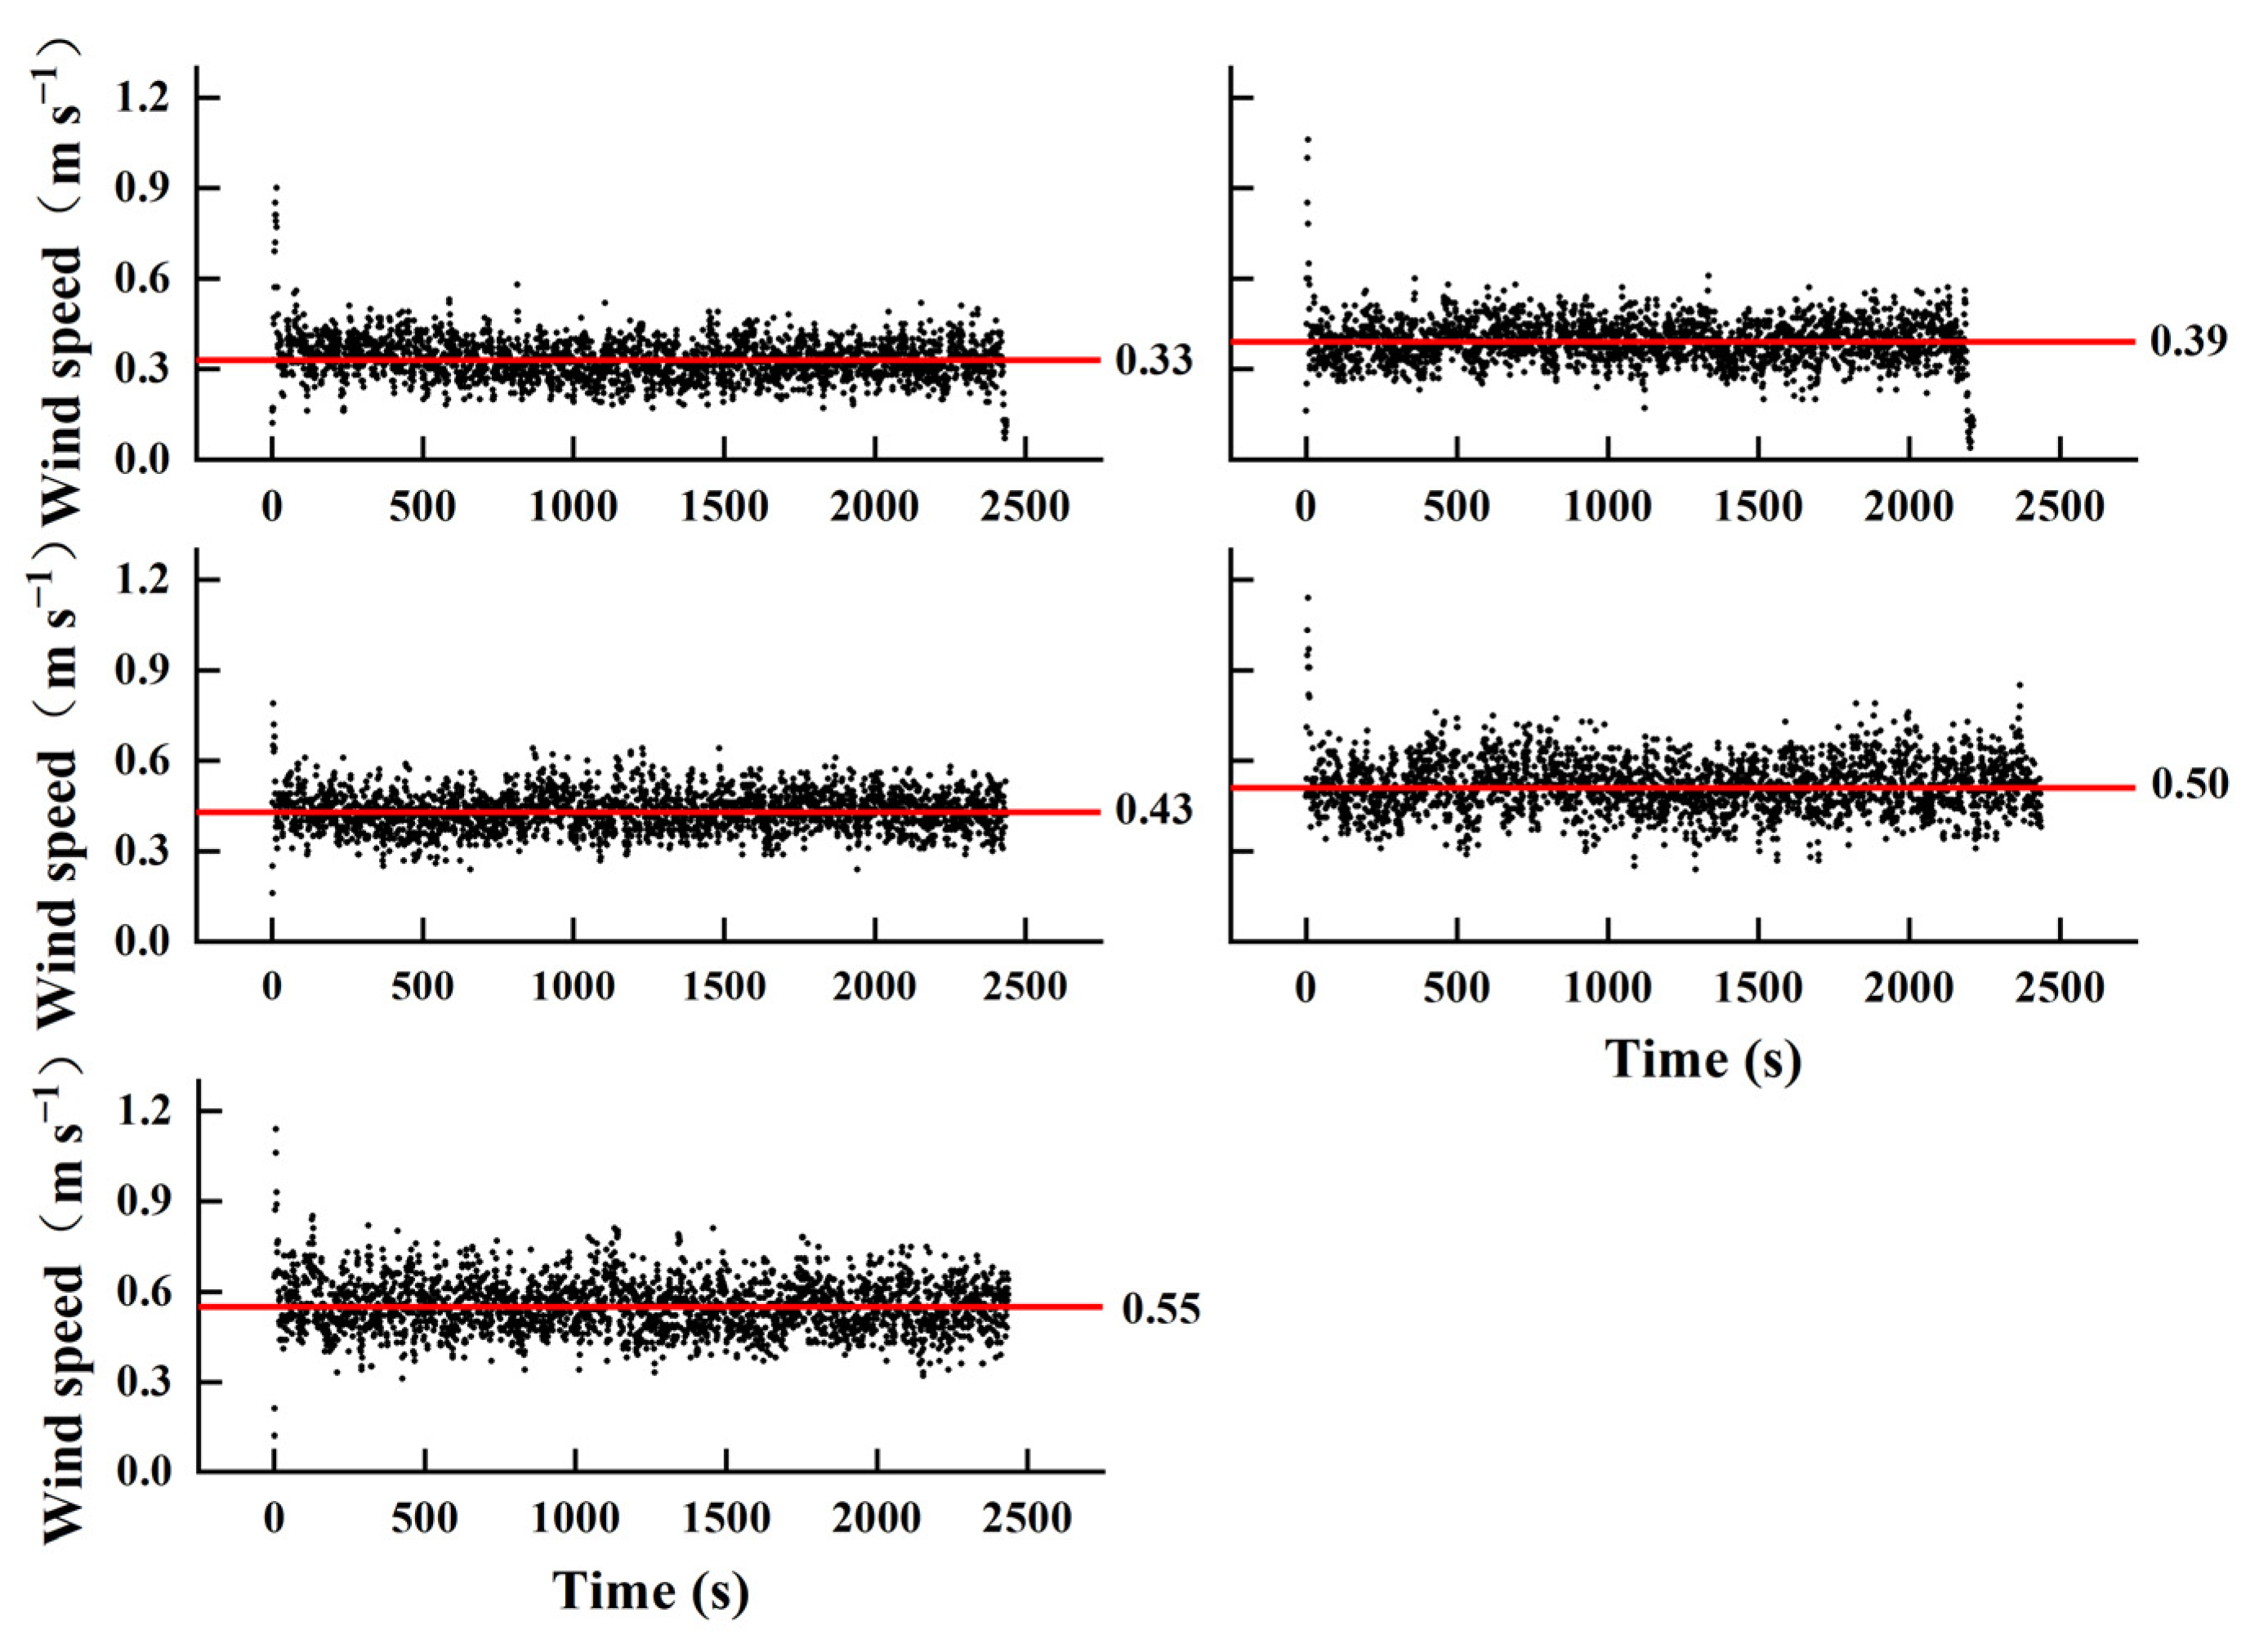
3.1. Wind Turbulence Intensity

Table 2 displays the six wind conditions (W0–W5) used in the experiment, along with their ranges and variances (intensity of wind speed fluctuations).
During the test experiments, the measurements from the closed chamber showed noticeable fluctuations under wind turbulence, even producing negative values when the wind speeds exceeded 1.0 m s−1. As such, the measurements under these wind conditions were considered unreliable and were not referenced. Therefore, the wind speed range selected for this experiment was between 0.3 and 0.6 m s−1. Variance was used to measure the intensity of wind speed fluctuations, because a high variance indicates a wide range of fluctuations, rendering the average wind speed meaningless and unreliable for experimental data. Figure 2 shows a schematic diagram of the five wind speeds used in the experiment; a wind speed lower than 0.1 m s−1 was considered a no-wind condition, with the red line representing the average. In all the media experiments, the wind speed fluctuated within this range and the average was used as a reference. The data spikes at the beginning and end were due to the fan turning on and off; as the closed chamber was already affected by wind turbulence during these times, and these effects were unavoidable, these outliers were not removed to preserve the reliability of the experimental data.

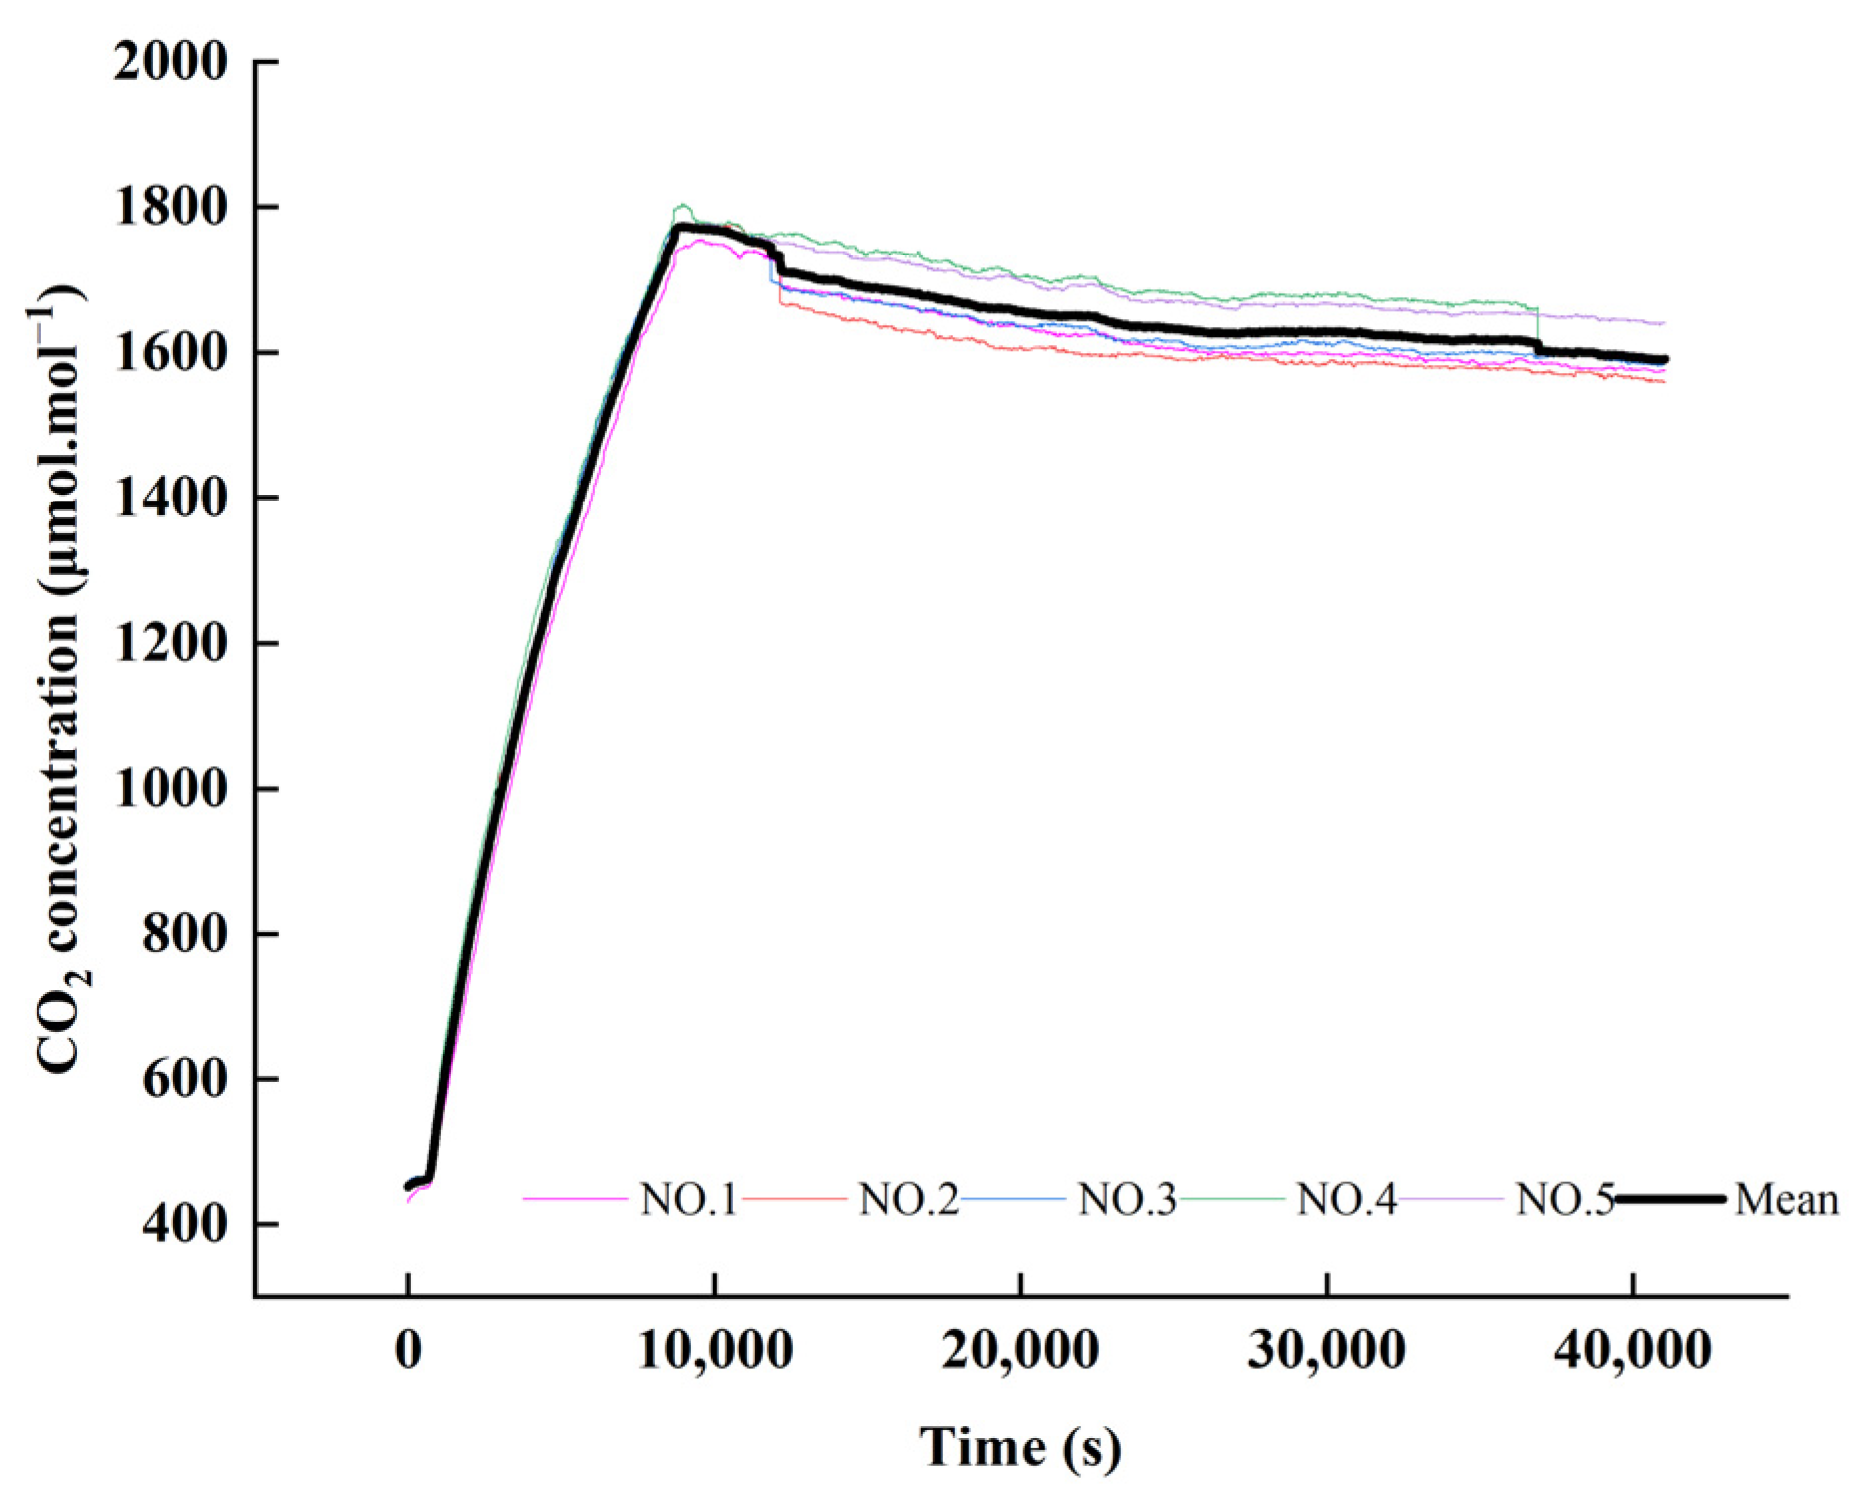
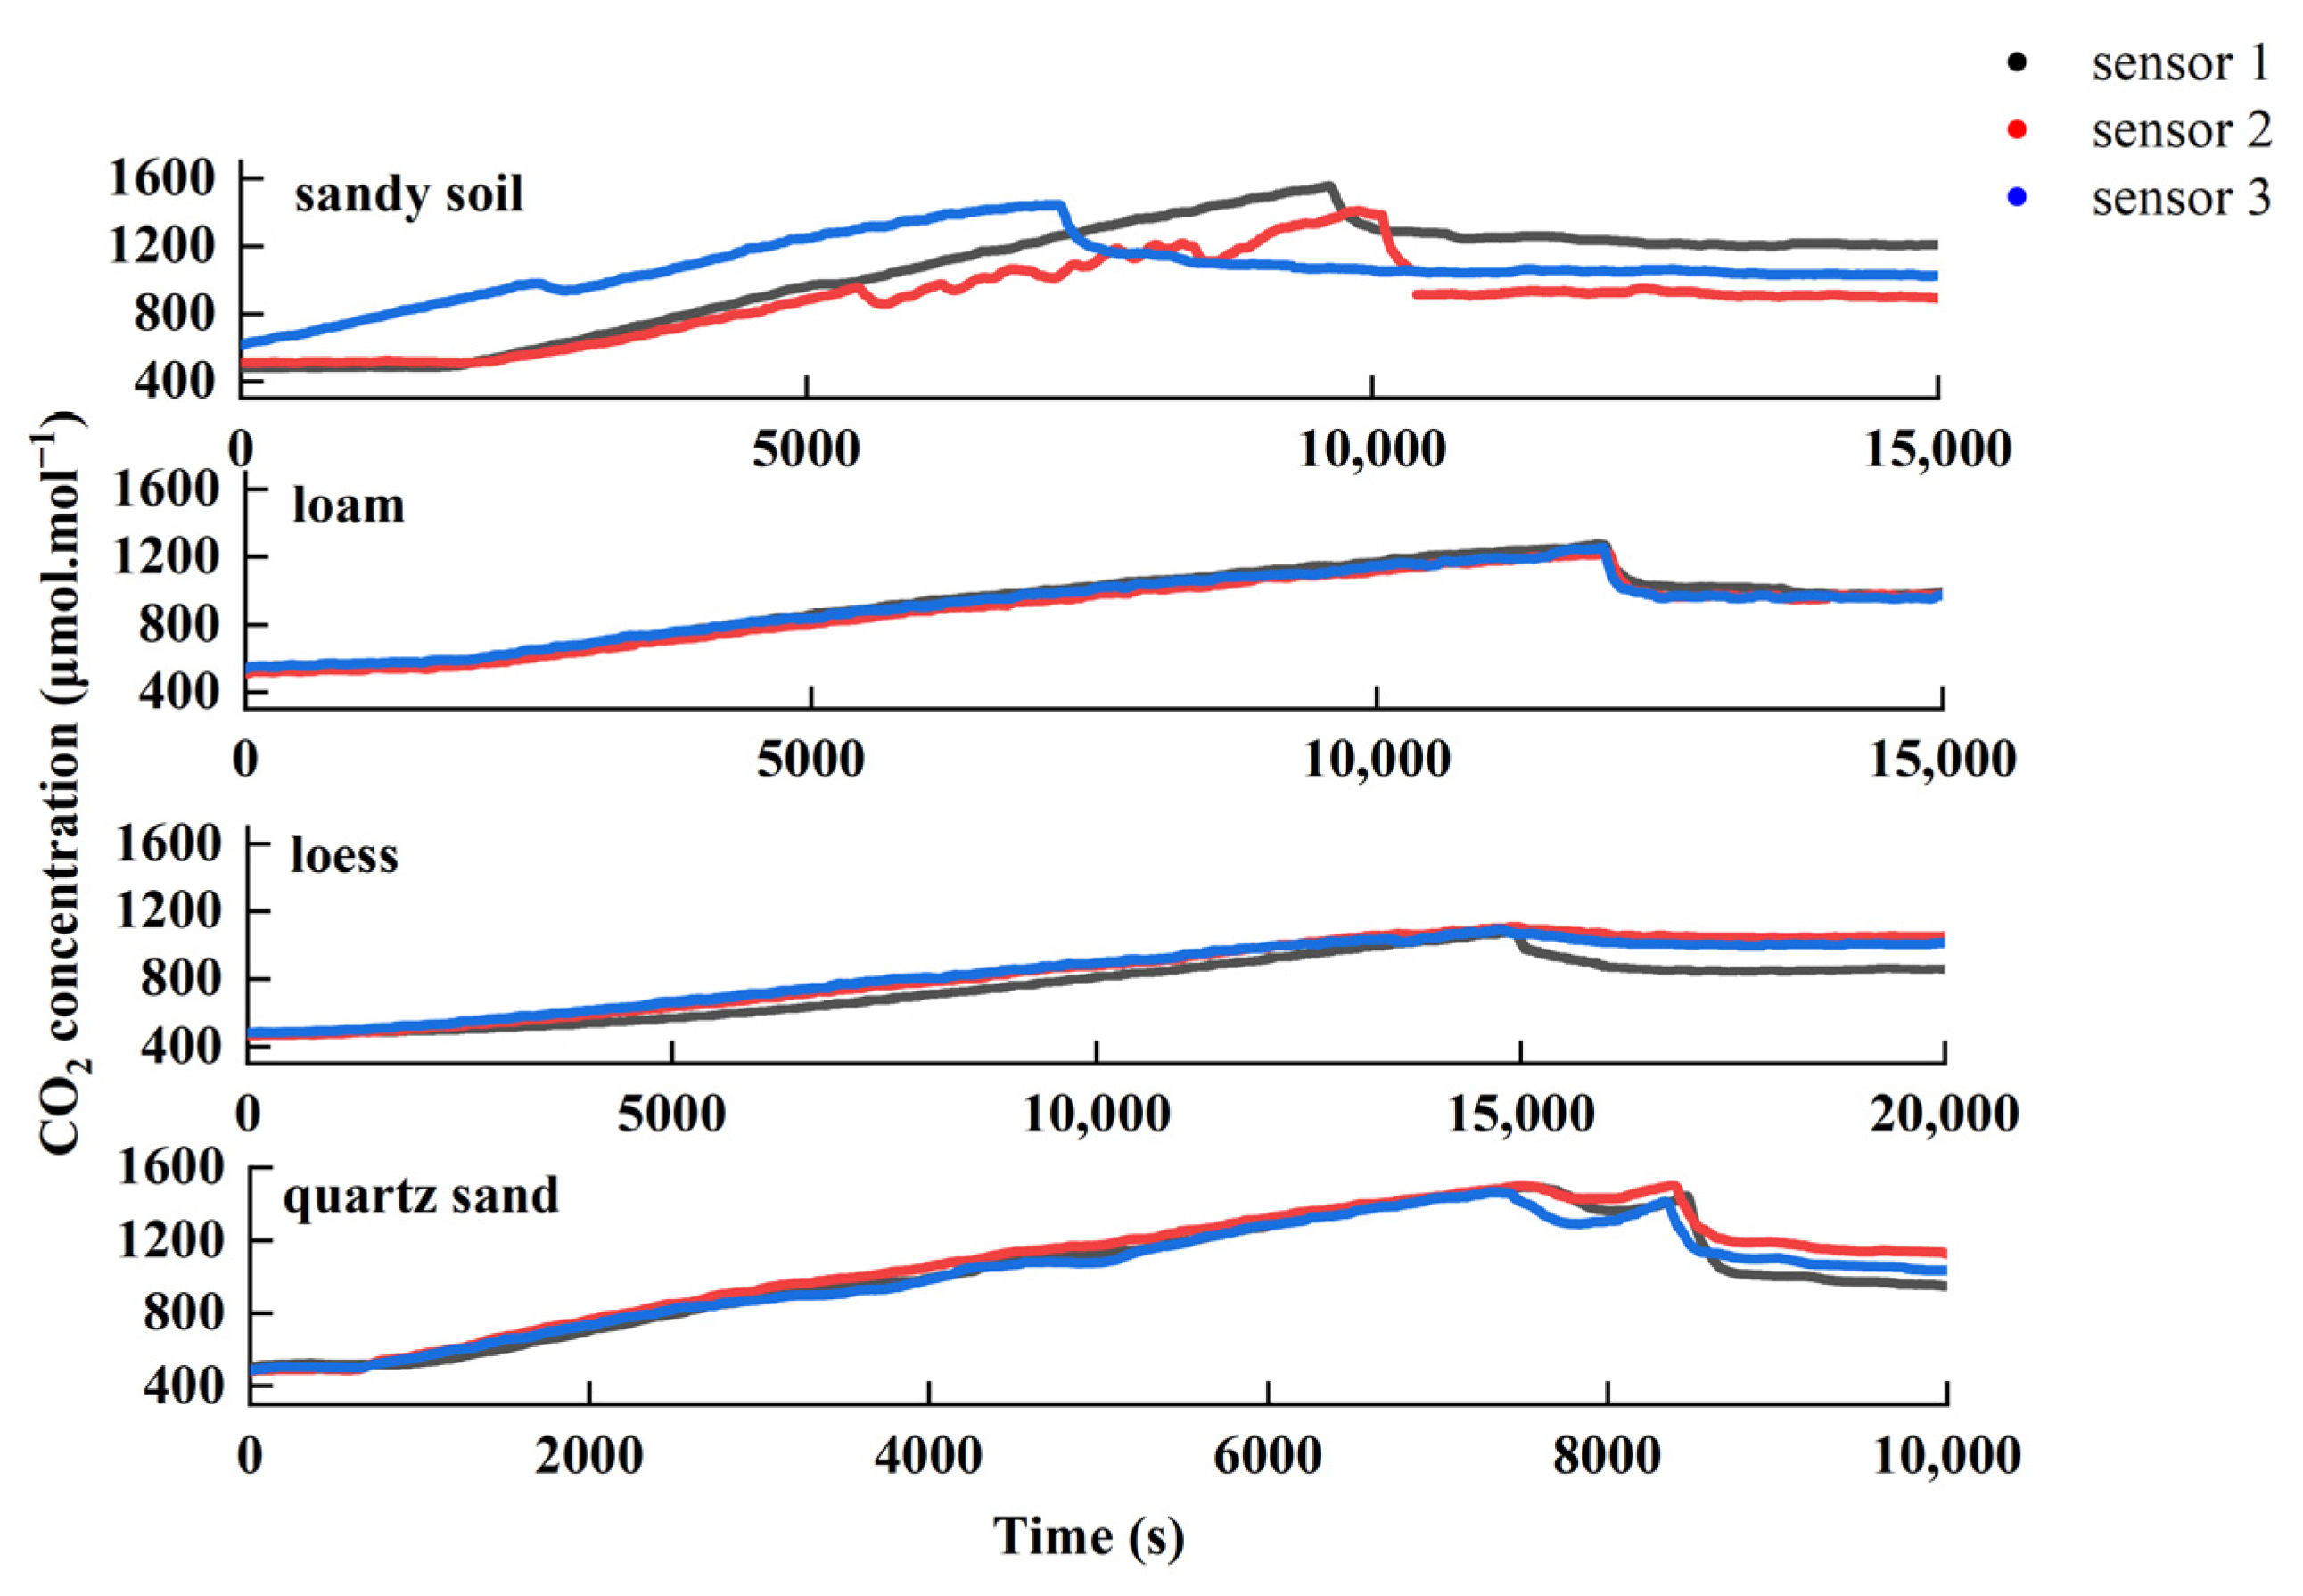
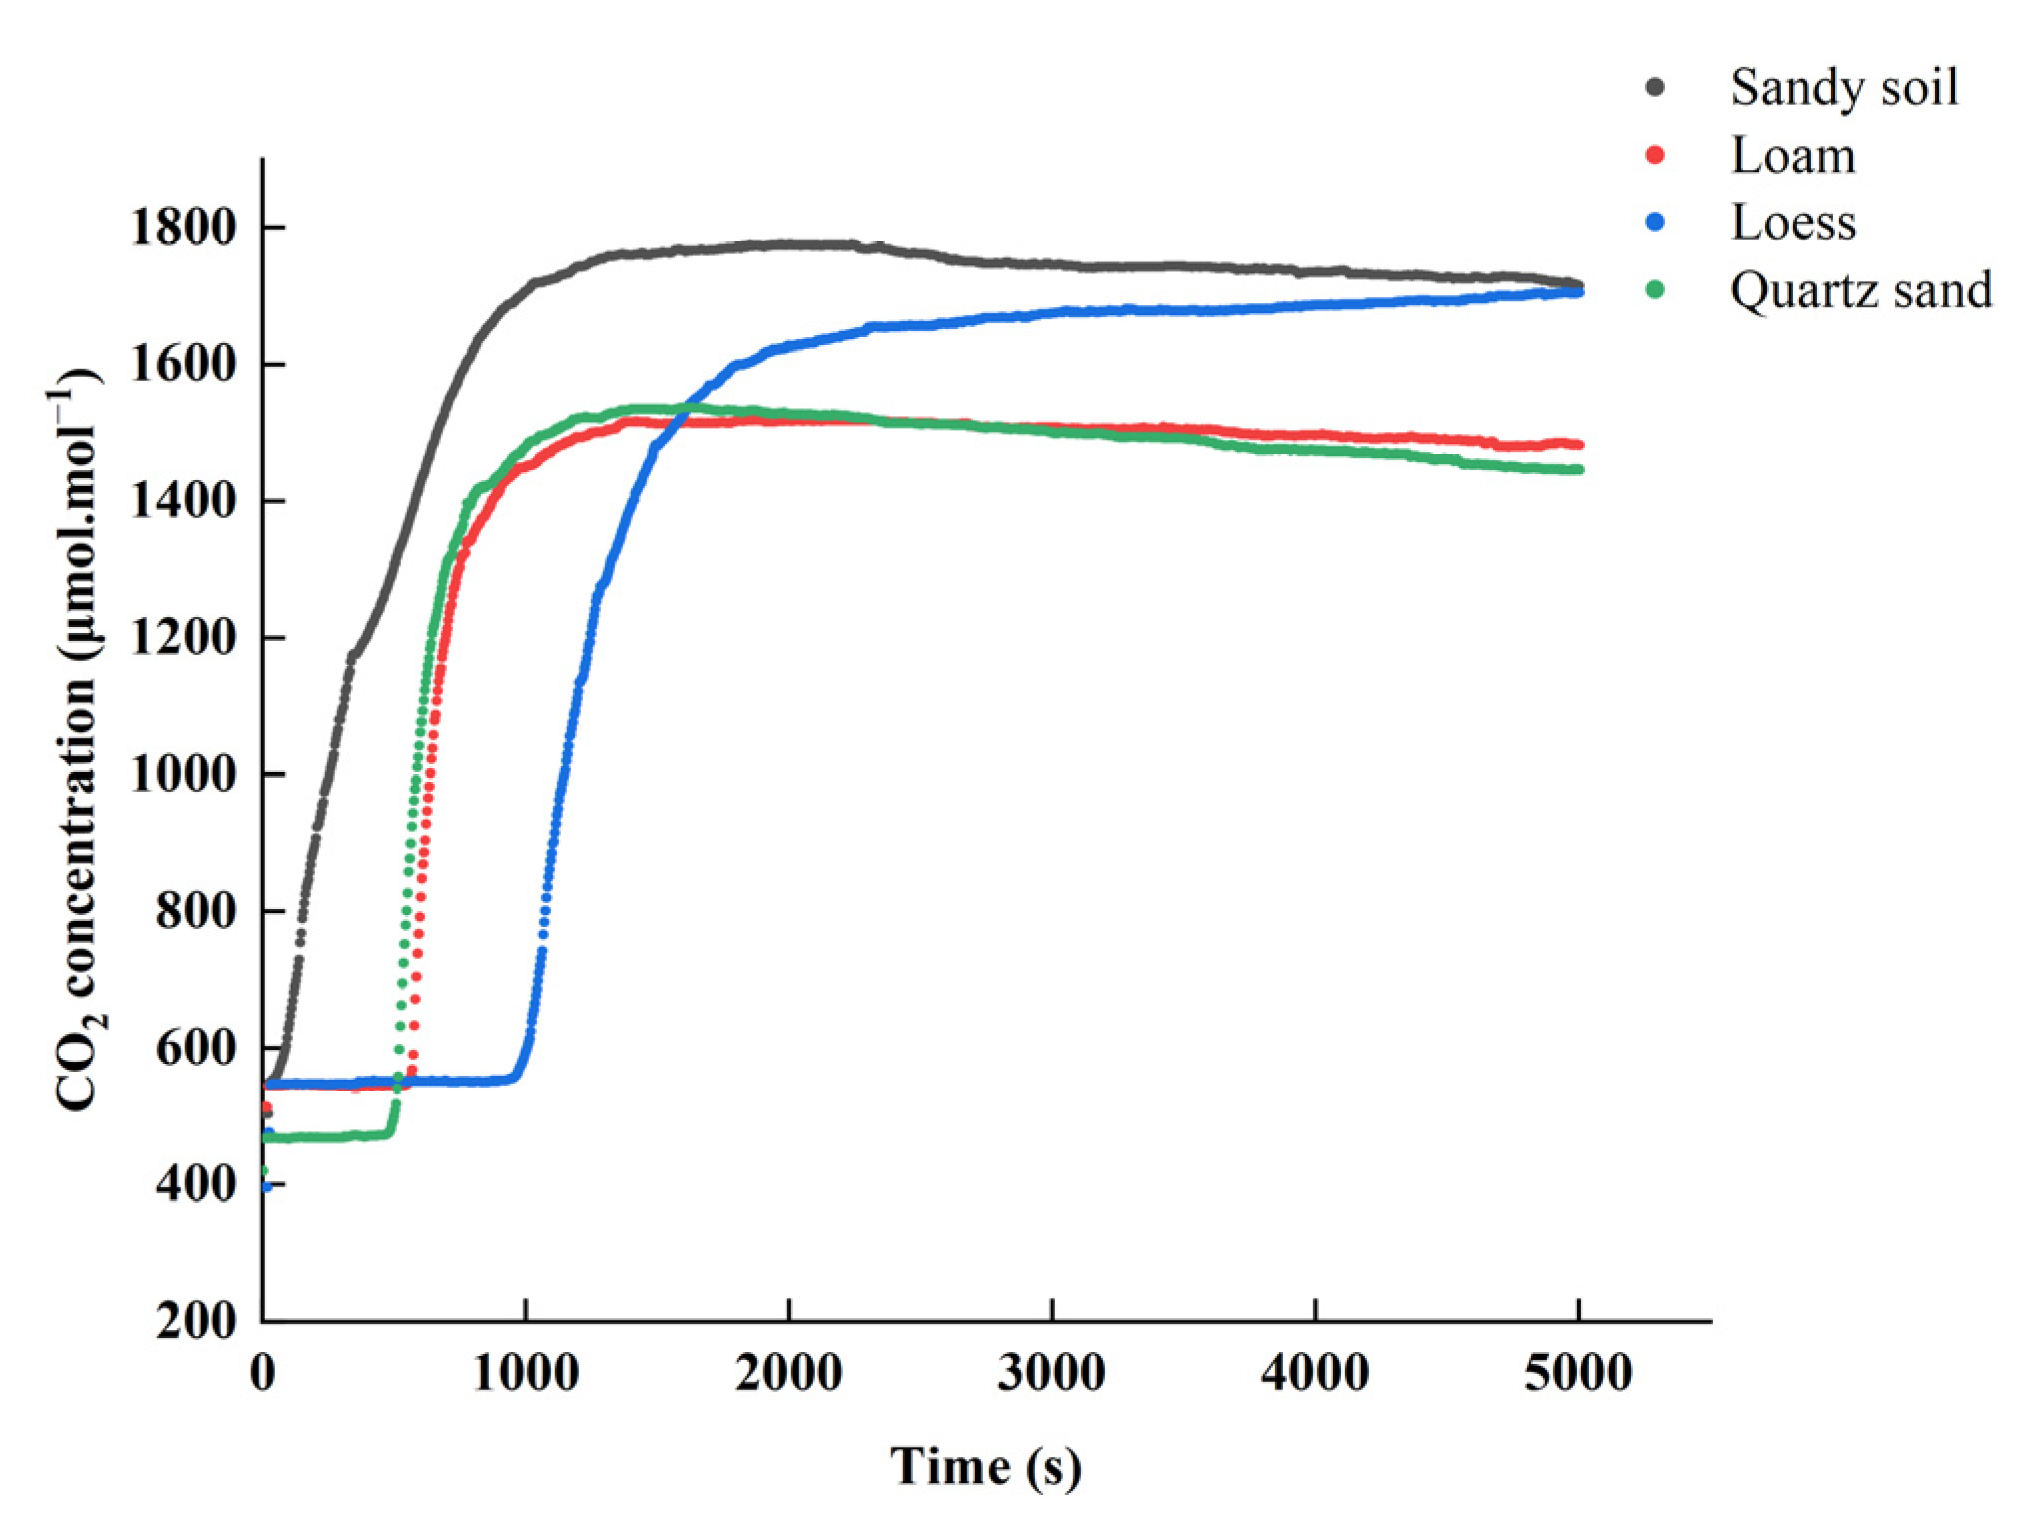
3.2. CO2 Within the Calibration Device

Real-time monitoring of the CO2 concentrations within the device was performed to assess the stability of the calibration device. The gas chamber layer of the calibration device was shown in Figure 3, which displays the change in CO2 concentration measured by five sensors over a day, with data collected every five seconds; the black curve represents the average. The CO2 concentration in the gas chamber remained stable throughout the day, fluctuating within a range of 10 to 20 µmol mol−1. This stability, attributed to the high internal CO2 concentration and the isolation of the medium layer from the near-surface wind turbulence, indicated a minimal impact of wind turbulence, allowing further experiments to proceed. After 3 h of stabilization, the gas chamber reached a steady state with a CO2 concentration of approximately 1660 µmol mol−1. At the steady state, the CO2 concentrations were 1523 µmol mol−1 in loam, 1758 µmol mol−1 in loess, and 1400 µmol mol−1 in quartz sand. The medium layer of the calibration device is illustrated in Figure 4, which shows the CO2 concentration changes over time under four different media conditions sampled at 1 Hz. Due to the different porosity and particle size of the different media, the time required to reach a steady state and the maximum CO2 concentration at a steady state are also different, with the shortest time being about 2.5 h for quartz sand and the longest time being about 4.2 h for loess.
Finally, Figure 5 shows the stability of the calibration device during the wind turbulence experiment, showing the trend of CO2 concentration changes inside the scrubbing bottle over time for the four media, sampled at 1 Hz. Due to the different maximum CO2 concentrations at a steady state for the four different media, the maximum CO2 reached in the gas-washing cylinders was also different. Under the influence of wind turbulence, the CO2 concentration in the scrubbing bottle differed little from that in the calibration gas chamber, indicating a stable internal concentration.

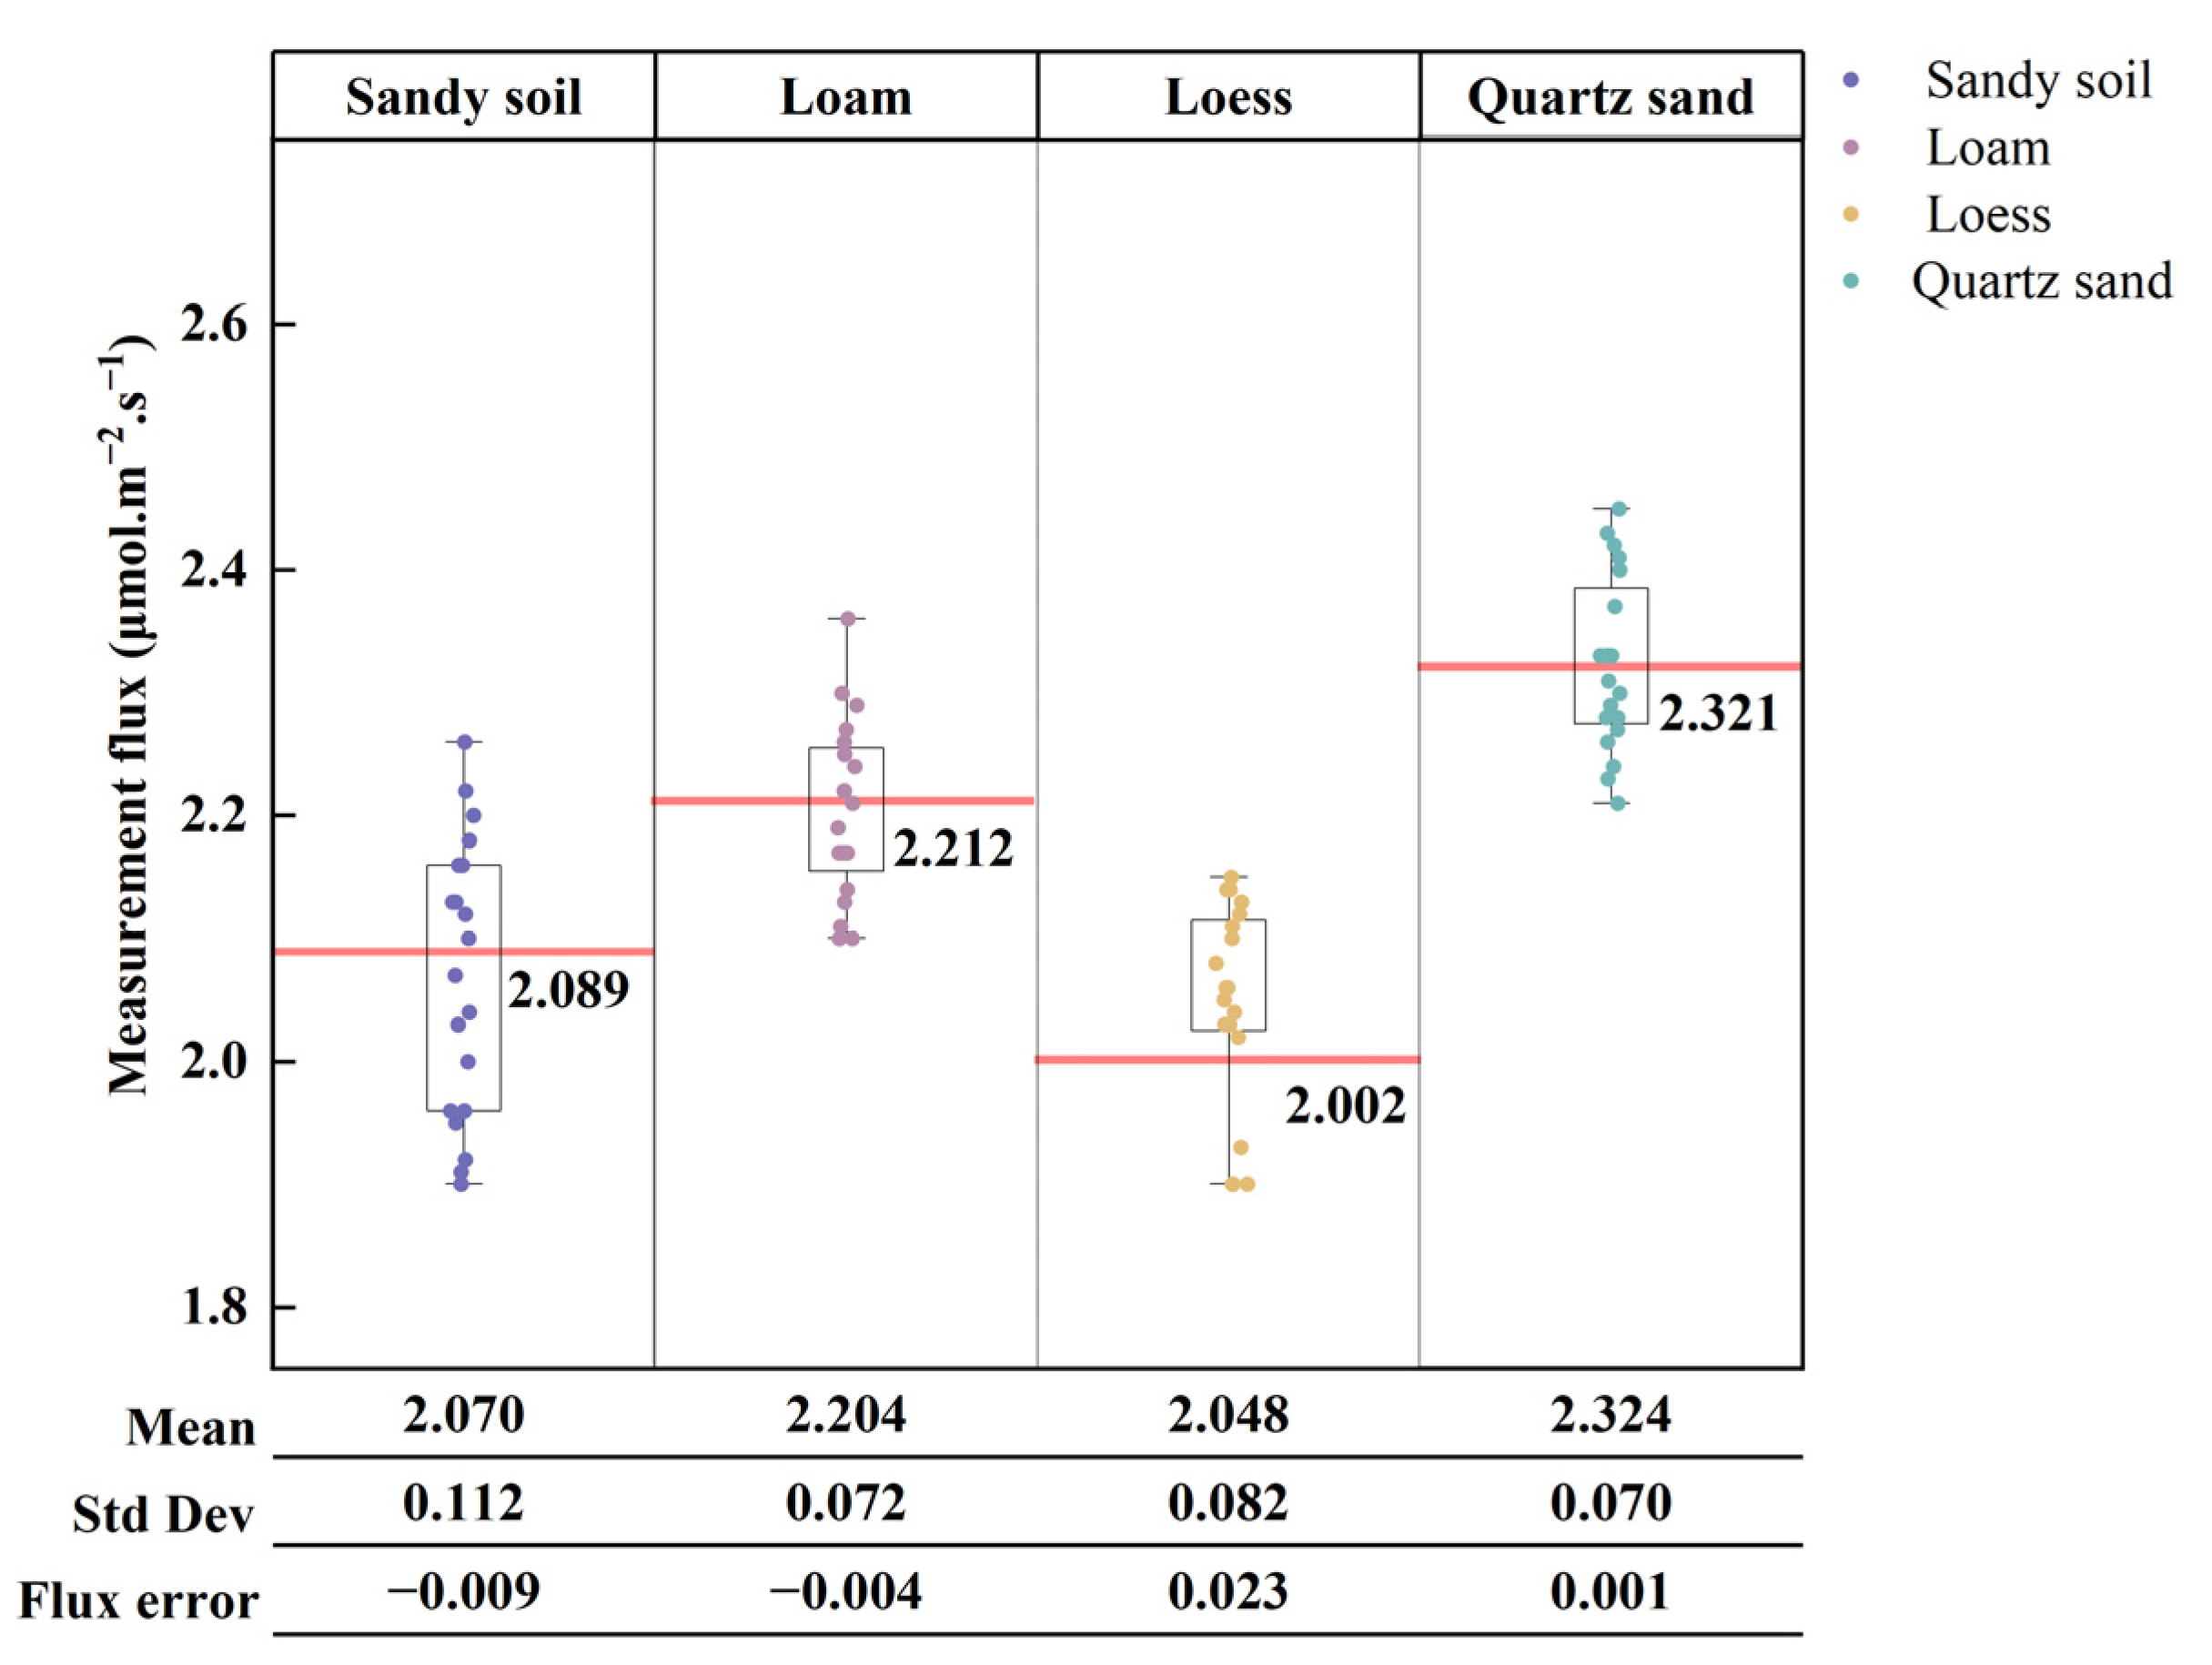
3.3. Measurement Performance Evaluation of Closed Chamber

The measured flux values and calculated flux values were compared to investigate the measurement performance of the closed chamber. Figure 6 compares the measured flux values and calculated flux values for the different media under no-wind, steady-state conditions; the data points represent the measured flux values, 20 times per medium, while the red line represents the calculated flux values. The standard deviation of the measured values in the closed chamber was within 0.112 µmol m−2 s−1, indicating that the continuous measurements under no-wind steady-state conditions were relatively stable. Under steady-state conditions, the CO2 flux was calculated using Equation (5) and variations in the CO2 flux were observed across the different media. The highest was observed for quartz sand, at 2.321 µmol m−2 s−1, and the lowest was observed for loess, at 2.002 µmol m−2 s−1. The deviation between the measured and calculated values of the closed chamber was within 2.3%, demonstrating that the measurements of the closed chamber were relatively accurate under no-wind, steady-state conditions.

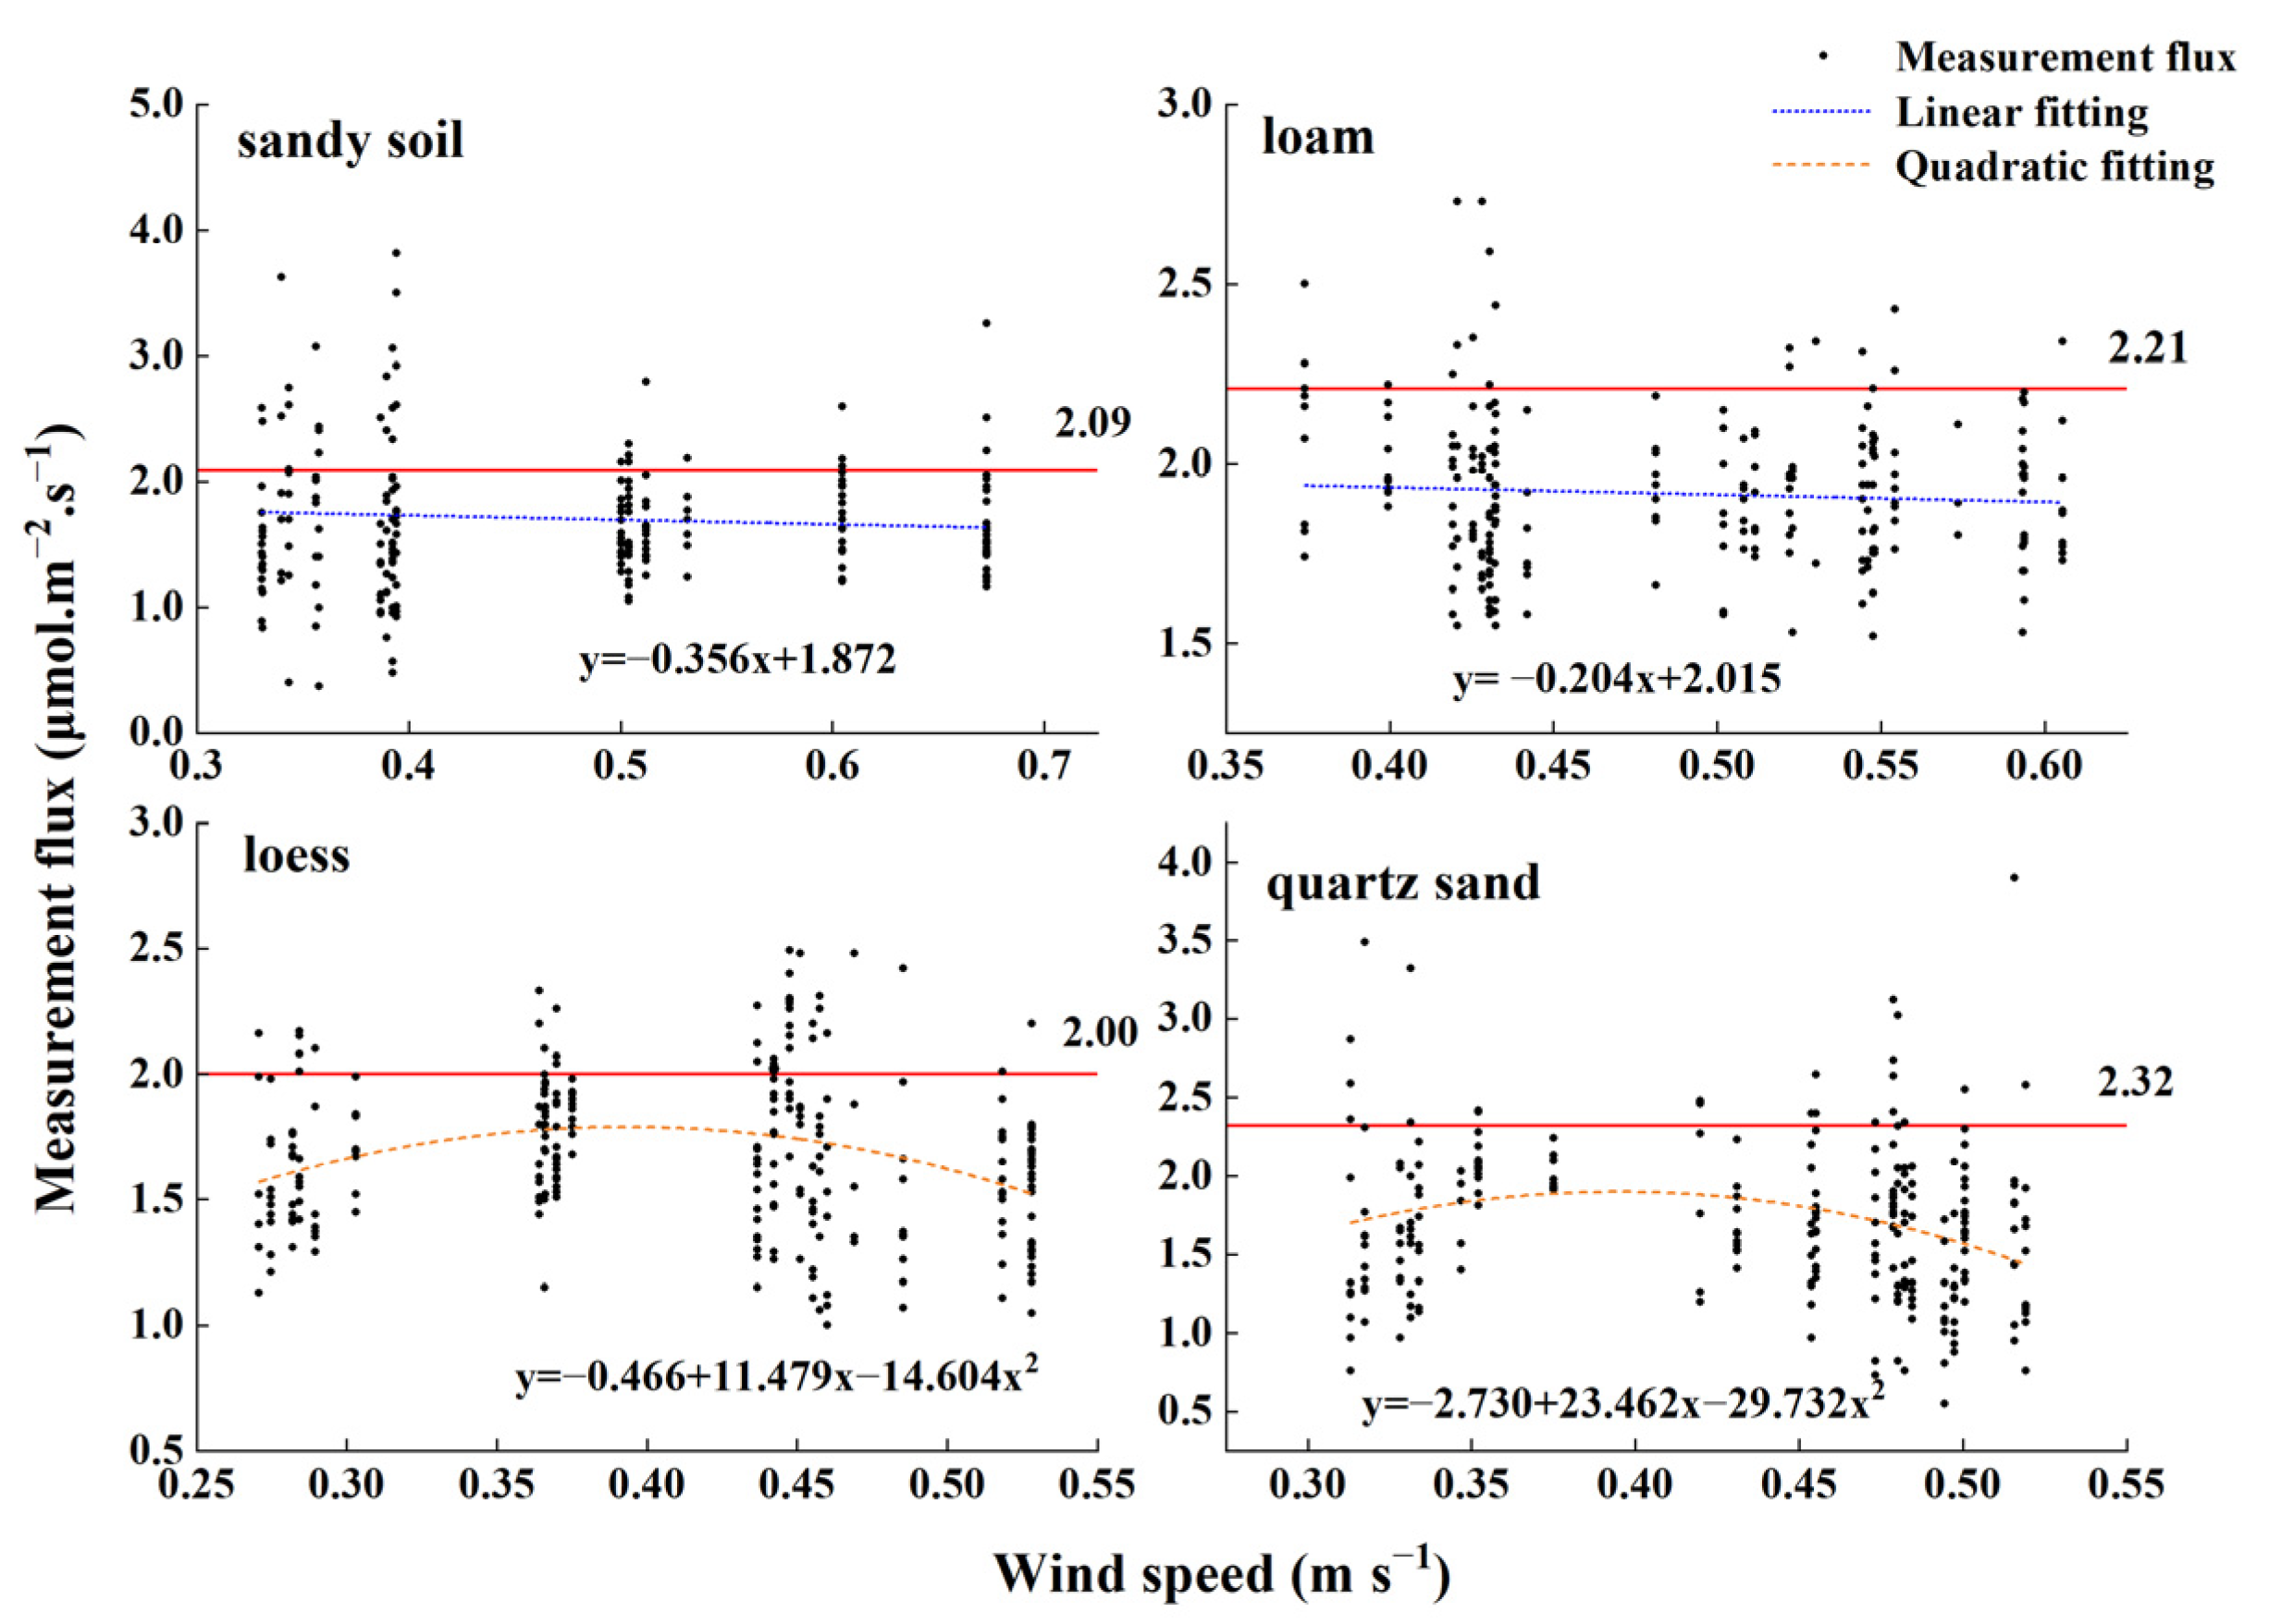
3.4. Relationship Between CO2 Flux and Wind Turbulence Measured in Closed Chamber

To explore the accuracy of the closed-chamber measurements under the influence of wind turbulence, the calibration device and closed chamber were exposed to five different wind speeds under steady-state conditions, with 50 measurements conducted for each medium at each wind speed. The flux measurement results are shown in Figure 7, and the fitted results are shown in Table A1; in the sandy media experiments, when the wind speed was below 0.4 m s−1, the measurement variability was noticeable, fluctuating between 0.4 and 3.8 μmol·m−2 s−1. When the wind speed exceeded 0.4 m s−1, most of the measurements were lower than the calculated values, indicating an underestimation. This might be due to the strong wind turbulence carrying away most of the CO2, causing the CO2 concentration inside the closed chamber to drop faster than that outside, thus leading to a severe underestimation, a phenomenon that was more pronounced in the quartz sand experiments. In the experiments with soil media, wind turbulence also affected the accuracy of the closed-chamber measurements. Wind speeds below 0.4 m s−1 exhibited relatively stable underestimation. When the wind speeds ranged between 0.4 and 0.5 m s−1, the soil media displayed dramatic fluctuations similar to those in the sandy media. We believe that this threshold range indicates whether the media could remain in a steady state. Below or above this range, a stable underestimation occurred, whereas within this range, because of the effects of wind turbulence, the measurements from the closed chamber were extremely unstable, showing both overestimation and underestimation.
The flux measurement results for all four media consistently displayed varying degrees of underestimation, with 70–80% of the data points falling below the standard values. The linear fitting results indicated measurement underestimation under the influence of wind turbulence. The slope (rate of increase in flux underestimation as wind speed increases) for the soil media was −0.204 µmol m−3 (loam), which was less than that of the sandy media at −0.356 µmol m−3 (sandy soil), likely due to the denser structure of the soil media that partially shielded against wind penetration. For the loess and quartz sand, the measured fluxes initially increased and then decreased with increasing wind speed, whereas the measured fluxes for the other media consistently decreased as the wind speed increased. This could have been due to the loose structure and high permeability of loess and quartz sand, which accelerated the gas exchange between the medium and the atmosphere under low wind speeds, while at high wind speeds, a large amount of CO2 inside the medium was carried away by wind turbulence, leading to a severe underestimation of the measured CO2 flux as the closed chamber failed to detect this part of the CO2. When the wind speed was less than 0.5 m s−1, the measured flux from the closed chamber may have exceeded the standard values and the variability in measurements was relatively large; however, when the wind speed exceeded 0.5 m s−1, the measured values were generally below the standard values.

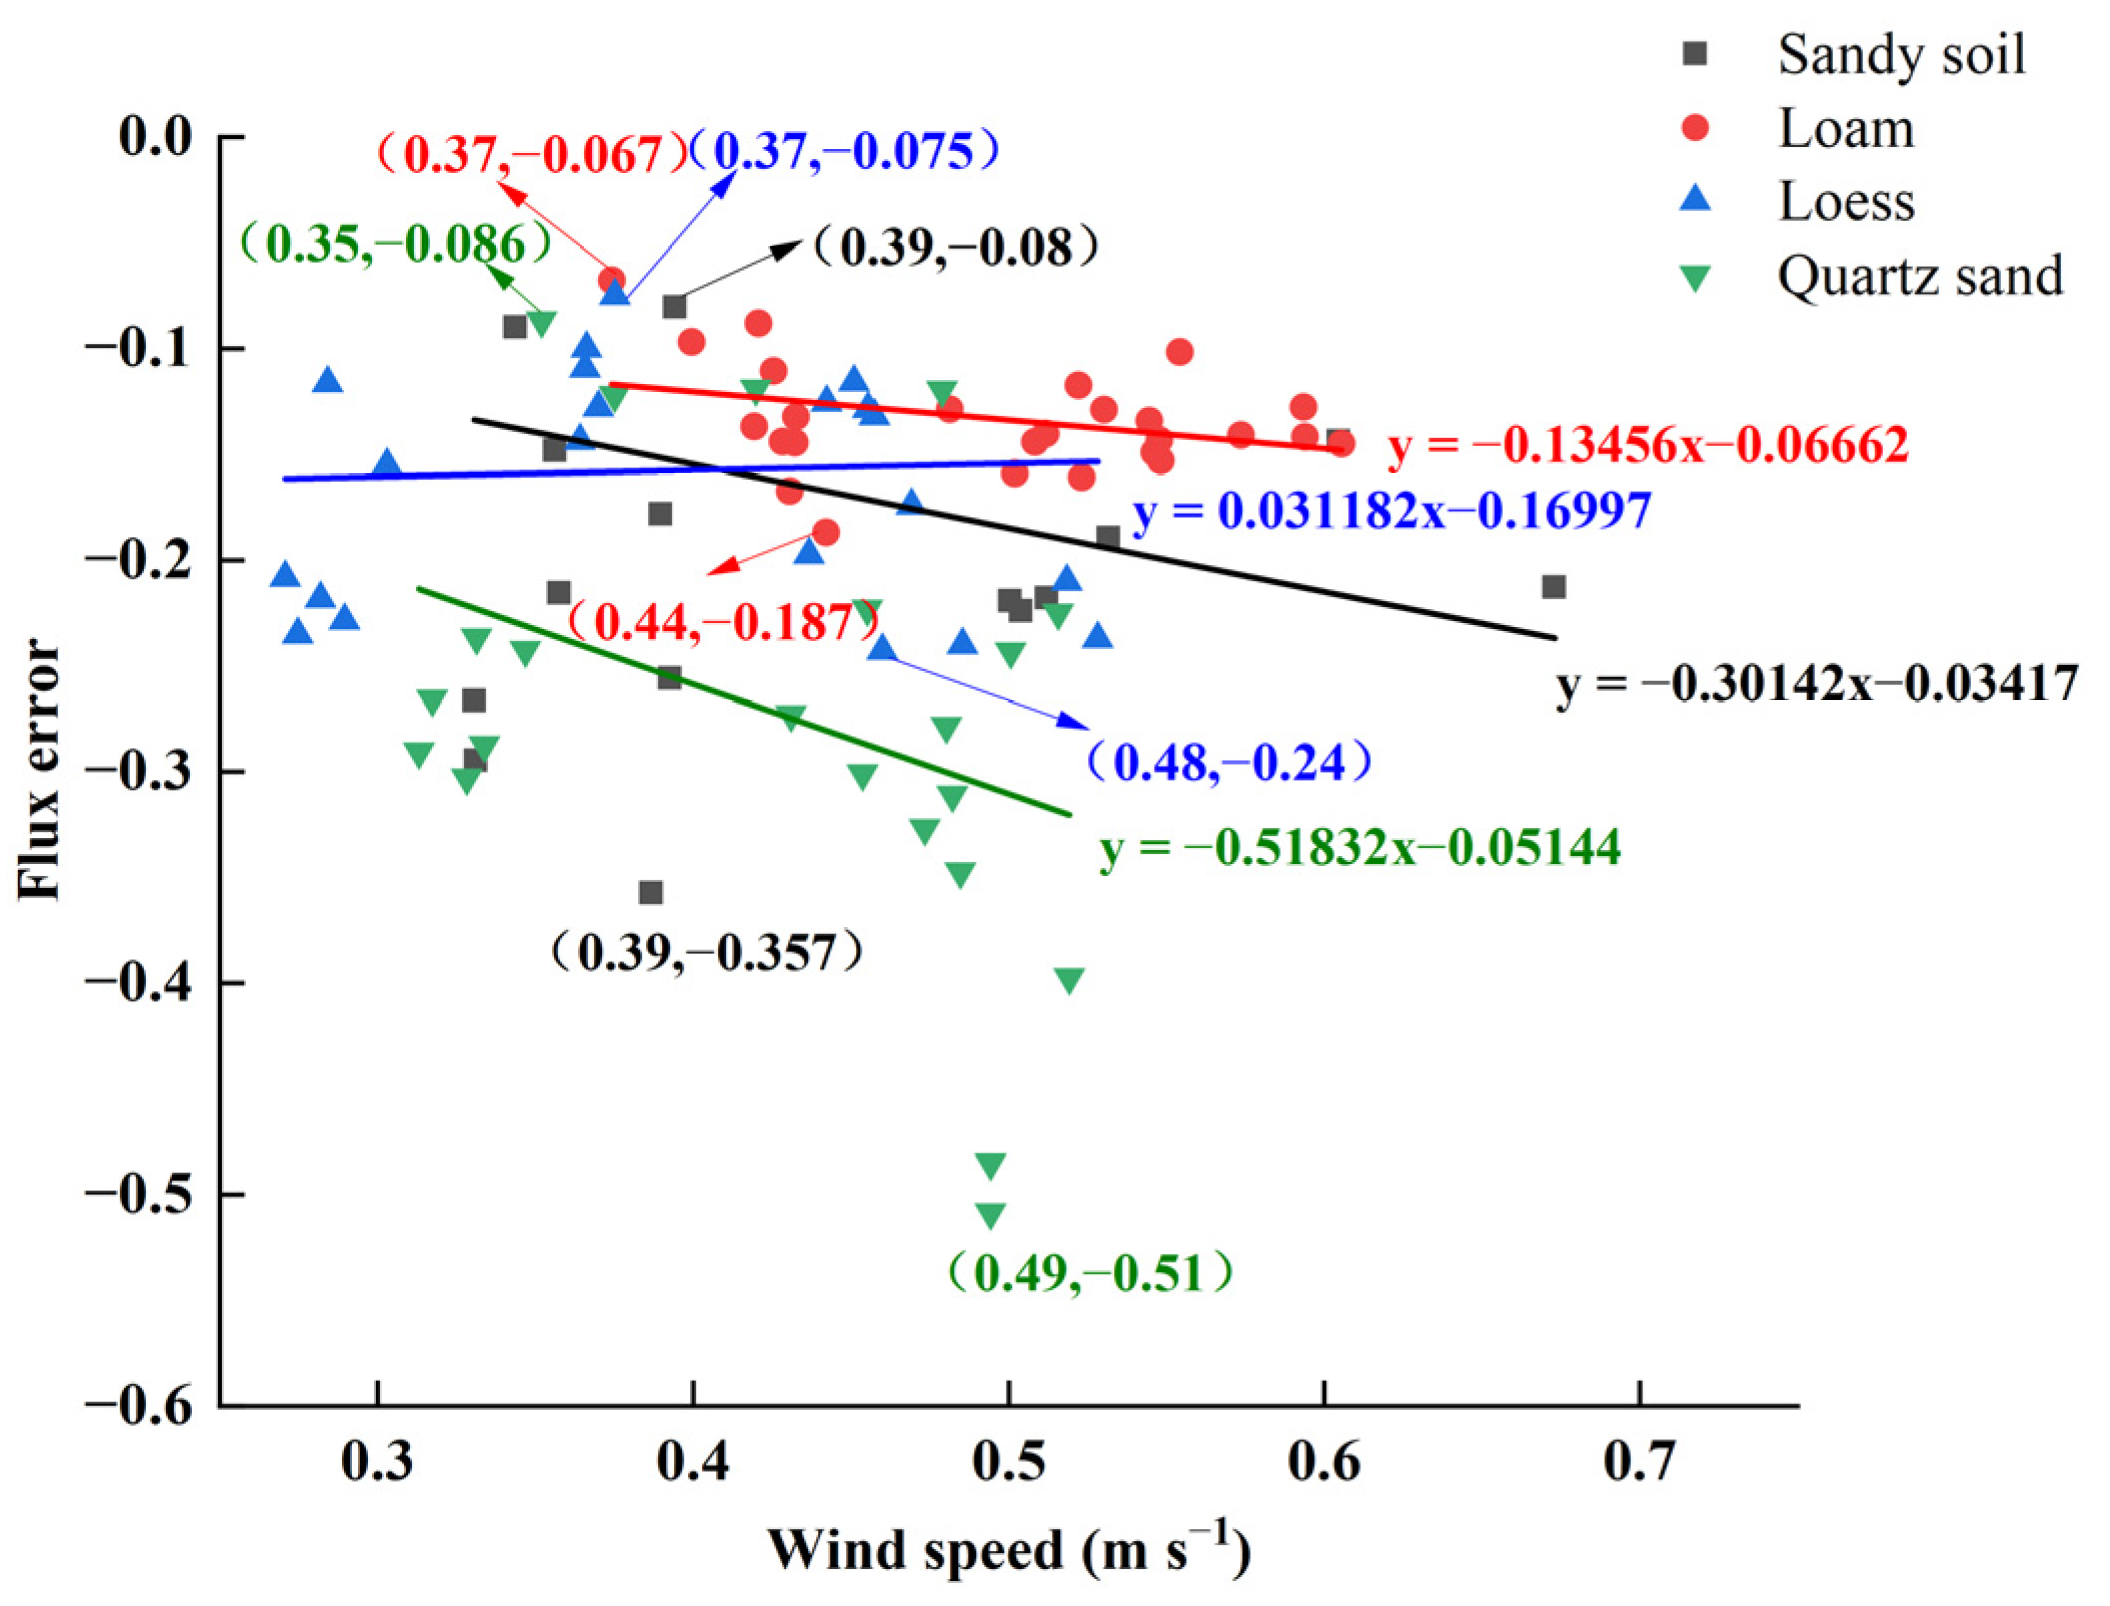
3.5. Measurement Deviation of Closed Chamber

To further observe and analyze the impact of wind turbulence on the measurements of the closed chamber, the underestimation rate was calculated as the ratio of the average measured value from the closed chamber to the calculated value under no-wind, steady-state conditions. The underestimation rates of the measured fluxes for the four media under different levels of wind turbulence are shown in Figure 8 and Table A2. The straight lines represent the linear fits of the data points for the four media. For sandy soil, the minimum underestimation rate of 8% occurred at a wind speed of 0.39 m s−1, while the maximum rate of 35.7% also occurred at 0.39 m s−1. This may have been due to the turbulence over the sandy media causing large deviations in the measurements, leading to both the minimum and maximum values appearing within the same range. For quartz sand, the minimum underestimation rate of 8.6% was observed at a wind speed of 0.35 m s−1, and the maximum rate of 50.8% was observed at 0.49 m s−1. For loam, the minimum rate of 6.7% occurred at 0.37 m s−1, and the maximum rate of 18.6% occurred at 0.44 m s−1. For loess, the minimum underestimation rate of 7.5% was observed at 0.37 m s−1, and the maximum rate of 24% was observed at 0.48 m s−1. Both sandy soil and quartz sand exhibited noticeable increases in underestimation rates with increasing wind speeds, with both fitting lines having negative slopes, especially quartz sand at −0.518 s m−1. Moreover, when the wind turbulence exceeded 0.5 m s−1, the underestimation for quartz sand became even more severe.

4. Discussion

To investigate the performance of the closed chamber and its accuracy under the influence of wind turbulence, measurements were conducted under both windless and windy conditions, with a device used to calibrate the flux. Under windless conditions, the closed chamber measured the CO2 flux from the porous media quite accurately, with errors ranging from −0.9% to 2.3% (as shown in Figure 6). This could have been due to the accumulation of CO2 inside the closed chamber, which decreased the CO2 gradient, thereby decreasing the influx of CO2 from the porous media into the closed chamber and leading to an underestimation of the flux, resulting in negative values. Additionally, pressure fluctuations can cause a pumping effect, driving CO2 from the porous media into the closed chamber and resulting in an overestimation or positive values. This highlights the inherent disadvantages in the design principle of closed chambers.
In the wind turbulence experiments, the closed chamber exhibited varying degrees of underestimation, ranging from −51% to −6% (as shown in Figure 8), indicating that wind turbulence is a noticeable factor affecting the accuracy of CO2 flux measurements in closed chambers. Many studies have found that near-surface winds can create a wind pump effect within the soil, enhancing the rate of gas transport through it. In our experiments, similar phenomena were observed across the different porous media, with more pronounced effects observed in the sandy media. As shown in Figure 8, while the underestimation rates for the soil media showed smaller fluctuations with increasing wind speed, the underestimation rates for sandy media exhibited severe fluctuations, ranging up to 50%. This suggests that the particle size of the porous media is a key factor in assessing the strength of the wind pump effect under similar wind conditions. As shown in Table 1, the particle sizes of the sandy media were all larger than those of the soil media, despite the larger diffusion coefficient of the soil media. Compared with the soil media, the sandy media exhibited a faster decrease in concentration, indicating a more intense wind pump effect. As shown in Figure 9, the rate of CO2 concentration decrease in the quartz sand was approximately 0.040 ppm/s, while in the loess it was about 0.026 ppm/s. The rate of decrease in the quartz sand was 1.5 times that of loess. This was due to the simpler pore structure and lower density of the sandy media, which were more susceptible to the effects of wind turbulence. After the wind passed, the CO2 gas within the media exhibited a lateral movement and was carried away, leading to noticeable fluctuations in concentration. In contrast, owing to their smaller particle size and complex pore structure, the soil media were less affected by wind turbulence, resulting in smaller changes in the internal concentrations (Figure 9).
Wind turbulence affects air movement, both on the soil surface and internally, enhancing the rate of gas exchange at the soil–atmosphere interface. Therefore, owing to the wind pump effect, the closed chamber seldom maintained a stable state when measuring fluxes under windy conditions. This was especially true in the field measurements, where the induced wind conditions and air movements were more complex. Thus, when a closed chamber is used to determine soil respiration, the impact of wind turbulence must be considered. Additionally, the texture of the measured soil affected the accuracy of the closed-chamber measurements. To minimize errors caused by wind turbulence, one could consider using specially designed barriers to decrease the impact of near-surface winds, or choosing periods with little to no wind for multiple measurements, averaging these to reduce measurement errors and enhance the accuracy of the flux measurements. Furthermore, increasing the depth at which the collar is inserted into the medium could isolate some of the horizontal movements caused by the wind within the medium, obstructing the escape of gas from the collar.

5. Conclusions

This experiment was conducted under controlled laboratory conditions to study the measurement performance of a closed chamber with multiple repetitions. The results indicated that the closed chamber performed well under no-wind, steady-state conditions, with flux error values within 2.3% and a standard deviation of less than 0.1 µmol m−2 s−1. However, under turbulent wind conditions, the closed chambers exhibited varying degrees of underestimation. This was due to wind turbulence enhancing the gas exchange between the porous medium and the atmosphere and generating internal gas movement within the medium, leading to deviations as the closed chamber failed to measure some of the CO2. The degree of underestimation of the CO2 flux measured in the closed chamber increased with increasing wind speed. Additionally, variations in the pore size of the porous medium affected the wind-induced transport, and this relationship was complex. In this experiment, the underestimation of the closed chamber due to the wind speed ranged from −51% to −6%. To further analyze this phenomenon, a mathematical model needs to be developed. However, this would require experimental data under a broader range of wind speeds and with various types of porous media.

Author Contributions

Methodology, J.J.; Data curation, L.F. and G.L.; Writing—original draft, Z.W.; Project administration, J.H. All authors have read and agreed to the published version of the manuscript.

Funding

This research was funded by the National Natural Science Foundation of China, grant number: 32371668, 31971493.

Institutional Review Board Statement

Not applicable.

Informed Consent Statement

Not applicable.

Data Availability Statement

Data are contained within the article.

Acknowledgments

We also thank the editor and anonymous reviewers for their contribution to the peer review of our work.

Conflicts of Interest

The authors declare no conflict of interest.

Appendix A

Figure A1. Soil respiration calibration device.
Sustainability 16 10501 g0a1
Table A1. Measurement flux fitted results for the four media.
Soil MediumFitted TypeFitted EquationR2
sandy soilLinear fittingy= −0.356x + 1.8720.003
Quadratic fittingy = 2.776 − 4.185x − 3.820 × 20.002
loamLinear fittingy= −0.204x + 2.0150.004
Quadratic fittingy = 3.558 − 6.584x − 6.470 × 20.018
loessLinear fittingy= −0.225x + 1.7790.003
Quadratic fittingy = −0.466 + 11.479x − 14.604 × 20.074
quartz sandLinear fittingy = −1.164x + 2.2080.027
Quadratic fittingy = −2.730 + 23.462x − 29.732 × 20.053
Table A2. The flux error with different soil media and wind conditions.
Soil MediumWind ConditionWind Speed (m s−1)Flux Error
sandy soilW10.335−0.217
W20.357−0.182
W30.391−0.218
W40.512−0.213
W50.639−0.179
loamW10.391−0.087
W20.429−0.139
W30.481−0.129
W40.528−0.143
W50.584−0.131
loessW10.284−0.194
W20.368−0.111
W30.442−0.090
W40.463−0.172
W50.523−0.224
quartz sandW10.328−0.271
W20.364−0.104
W30.440−0.229
W40.484−0.340
W50.512−0.289

References

  1. Pourbakhtiar, A.; Poulsen, T.G.; Wilkinson, S.; Bridge, J.W. Effect of Wind Turbulence on Gas Transport in Porous Media: Experimental Method and Preliminary Results. Eur. J. Soil Sci. 2017, 68, 48–56. [Google Scholar] [CrossRef]
  2. Bond-Lamberty, B.; Thomson, A. Temperature-Associated Increases in the Global Soil Respiration Record. Nature 2010, 464, 579–582. [Google Scholar] [CrossRef] [PubMed]
  3. Bowling, D.R.; Massman, W.J. Persistent Wind-Induced Enhancement of Diffusive CO2 Transport in a Mountain Forest Snowpack. J. Geophys. Res. Biogeosci. 2011, 116, G04006. [Google Scholar] [CrossRef]
  4. Menon, S.; Denman, K.L.; Brasseur, G.; Chidthaisong, A.; Ciais, P.; Cox, P.M.; Dickinson, R.E.; Hauglustaine, D.; Heinze, C.; Holland, E.; et al. Couplings Between Changes in the Climate System and Biogeochemistry; Lawrence Berkeley National Lab. (LBNL): Berkeley, CA, USA, 2007.
  5. Zhou, G.; Zhou, X.; Zhang, T.; Du, Z.; He, Y.; Wang, X.; Shao, J.; Cao, Y.; Xue, S.; Wang, H.; et al. Biochar Increased Soil Respiration in Temperate Forests but Had No Effects in Subtropical Forests. For. Ecol. Manag. 2017, 405, 339–349. [Google Scholar] [CrossRef]
  6. Feng, L.; Jiang, J.; Hu, J.; Zhu, C.; Wu, Z.; Li, G.; Chen, T. Global Spatial Projections of Forest Soil Respiration and Associated Uncertainties. Forests 2024, 15, 1982. [Google Scholar] [CrossRef]
  7. Jiang, J.; Feng, L.; Hu, J.; Liu, H.; Zhu, C.; Chen, B.; Chen, T. Global Soil Respiration Predictions with Associated Uncertainties from Different Spatio-Temporal Data Subsets. Ecol. Inform. 2024, 82, 102777. [Google Scholar] [CrossRef]
  8. Feng, L.; Jiang, J.; Hu, J. Underestimation of Global Soil CO2 Flux Measurements Caused by Near-Surface Winds. Front. For. Glob. Change 2024, 7, 1459948. [Google Scholar] [CrossRef]
  9. Xu, X.; Du, H.; Zhou, G.; Li, P.; Shi, Y.; Zhou, Y. Eddy Covariance Analysis of the Implications of Drought on the Carbon Fluxes of Moso Bamboo Forest in Southeastern China. Trees 2016, 30, 1807–1820. [Google Scholar] [CrossRef]
  10. Buragienė, S.; Šarauskis, E.; Romaneckas, K.; Adamavičienė, A.; Kriaučiūnienė, Z.; Avižienytė, D.; Marozas, V.; Naujokienė, V. Relationship between CO2 Emissions and Soil Properties of Differently Tilled Soils. Sci. Total Environ. 2019, 662, 786–795. [Google Scholar] [CrossRef]
  11. Craine, J.M.; Wedin, D.A. Determinants of Growing Season Soil CO2 Flux in a Minnesota Grassland. Biogeochemistry 2002, 59, 303–313. [Google Scholar] [CrossRef]
  12. Jacinthe, P.A. Carbon Dioxide and Methane Fluxes in Variably-Flooded Riparian Forests. Geoderma 2015, 241–242, 41–50. [Google Scholar] [CrossRef]
  13. Knoepp, J.D.; Vose, J.M. Quantitative Comparison of In Situ Soil CO2 Flux Measurement Methods; United States Department of Agriculture, Forest Service, Southern Region Station: Asheville, NC, USA, 2002.
  14. Luo, Y. Acclimatization of Soil Respiration to Warming in a Tall Grass Prairie. Nature 2001, 413, 622–625. [Google Scholar] [CrossRef] [PubMed]
  15. Poblador, S.; Lupon, A.; Sabaté, S.; Sabater, F. Temporal and Spatial Decoupling of CO2 and N2O Soil Emissions in a Mediterranean Riparian Forest. Biogeosciences 2017, 14, 4195–4208. [Google Scholar] [CrossRef]
  16. Zhang, D.; Li, J.; Wu, J.; Cheng, X. Soil CO2 and CH4 Emissions and Their Carbon Isotopic Signatures Linked to Saturated and Drained States of the Three Gorges Reservoir of China. Environ. Pollut. 2022, 293, 118599. [Google Scholar] [CrossRef]
  17. Pumpanen, J.; Kolari, P.; Ilvesniemi, H.; Minkkinen, K.; Vesala, T.; Niinistö, S.; Lohila, A.; Larmola, T.; Morero, M.; Pihlatie, M.; et al. Comparison of Different Chamber Techniques for Measuring Soil CO2 Efflux. Agric. For. Meteorol. 2004, 123, 159–176. [Google Scholar] [CrossRef]
  18. Brændholt, A.; Steenberg Larsen, K.; Ibrom, A.; Pilegaard, K. Overestimation of Closed-Chamber Soil CO2 Effluxes at Low Atmospheric Turbulence. Biogeosciences 2017, 14, 1603–1616. [Google Scholar] [CrossRef]
  19. Lai, D.Y.F.; Roulet, N.T.; Humphreys, E.R.; Moore, T.R.; Dalva, M. The Effect of Atmospheric Turbulence and Chamber Deployment Period on Autochamber CO2 and CH4 Flux Measurements in an Ombrotrophic Peatland. Biogeosciences 2012, 9, 3305–3322. [Google Scholar] [CrossRef]
  20. Maier, M.; Schack-Kirchner, H.; Aubinet, M.; Goffin, S.; Longdoz, B.; Parent, F. Turbulence Effect on Gas Transport in Three Contrasting Forest Soils. Soil Sci. Soc. Am. J. 2012, 76, 1518–1528. [Google Scholar] [CrossRef]
  21. Mohr, M.; Laemmel, T.; Maier, M.; Schindler, D. Analysis of Air Pressure Fluctuations and Topsoil Gas Concentrations within a Scots Pine Forest. Atmosphere 2016, 7, 125. [Google Scholar] [CrossRef]
  22. Xu, L.; Furtaw, M.D.; Madsen, R.A.; Garcia, R.L.; Anderson, D.J.; McDermitt, D.K. On Maintaining Pressure Equilibrium between a Soil CO2 Flux Chamber and the Ambient Air. J. Geophys. Res. Atmos. 2006, 111, D08S10. [Google Scholar] [CrossRef]
  23. Levintal, E.; Dragila, M.I.; Kamai, T.; Weisbrod, N. Free and Forced Gas Convection in Highly Permeable, Dry Porous Media. Agric. For. Meteorol. 2017, 232, 469–478. [Google Scholar] [CrossRef]
  24. Moya, M.R.; Sánchez-Cañete, E.P.; Vargas, R.; López-Ballesteros, A.; Oyonarte, C.; Kowalski, A.S.; Serrano-Ortiz, P.; Domingo, F. CO2 Dynamics Are Strongly Influenced by Low Frequency Atmospheric Pressure Changes in Semiarid Grasslands. J. Geophys. Res. Biogeosci. 2019, 124, 902–917. [Google Scholar] [CrossRef]
  25. Kimball, B.A.; Lemon, E.R. Air Turbulence Effects upon Soil Gas Exchange. Soil Sci. Soc. Am. J. 1971, 35, 16–21. [Google Scholar] [CrossRef]
  26. Poulsen, T.G. Measuring Horizontal Pore Gas Velocity Profiles in Porous Media in Response to Near-surface Wind Speed and Gustiness. Eur. J Soil Sci. 2018, 69, 997–1007. [Google Scholar] [CrossRef]
  27. Poulsen, T.G. Linking Below-surface Horizontal Pore Velocity Profiles in Porous Media with Near-surface Wind Conditions and Porous Medium Gas Permeability. Eur. J Soil Sci. 2020, 71, 819–830. [Google Scholar] [CrossRef]
  28. Soussana, J.F.; Allard, V.; Pilegaard, K.; Ambus, P.; Amman, C.; Campbell, C.; Ceschia, E.; Clifton-Brown, J.; Czobel, S.; Domingues, R.; et al. Full Accounting of the Greenhouse Gas (CO2, N2O, CH4) Budget of Nine European Grassland Sites. Agric. Ecosyst. Environ. 2007, 121, 121–134. [Google Scholar] [CrossRef]
  29. Jiang, J.; Hu, J. Effect of Wind Turbulence on Monitoring Soil CO2 Flux Using the Closed Gas Chamber Method—OPscience. Environ. Res. Commun. 2022, 4, 075015. [Google Scholar] [CrossRef]
Figure 1. Schematic diagram of (a) experimental apparatus. (b) Top view, (c) side view. The numbers represent CO2 concentration sensors. The orange as the medium, blue as perforated tubing.
Sustainability 16 10501 g001
Figure 2. Wind speeds used in the experiment. Five levels were recorded with a sampling frequency of 2 Hz. Red lines in the graphs represent the average wind speed.
Sustainability 16 10501 g002
Figure 3. CO2 concentration in the gas chamber of the calibration device as a function of time during the one-day sand soil experiment.
Sustainability 16 10501 g003
Figure 4. CO2 concentration in the media layer of the calibration device.
Sustainability 16 10501 g004
Figure 5. Trend of CO2 concentration inside the scrubbing bottle during the wind turbulence experiments.
Sustainability 16 10501 g005
Figure 6. Measured and calculated flux values for the four different media under no-wind, steady-state conditions. The red solid line represents the calculated flux values, while the data points represent the measured flux values. The flux error was calculated as the difference between the average measured flux values from the closed chamber and the calculated flux values. Negative values indicate that the CO2 flux values measured by the closed chamber were lower than those calculated by the calibration device, demonstrating an underestimation of the measured flux values by the closed chamber.
Sustainability 16 10501 g006
Figure 7. Relationship between measurement flux values and wind speeds across four different media. The black dots represent the flux values measured by the closed chamber, the red solid line indicates the calculated flux values under no-wind conditions, the blue dashed line represents the linear fitting, and the orange dashed line represents the quadratic fitting. The R2 for these fittings is displyed in Table A1.
Sustainability 16 10501 g007
Figure 8. Flux error for the four different media. The vertical axis is scaled in negative values, with more negative values indicating greater underestimation. The linear fit results are represented by straight lines.
Sustainability 16 10501 g008
Figure 9. Variation in CO2 concentration within quartz sand and loess under wind turbulence.
Sustainability 16 10501 g009
Table 1. Physical properties of the soil media used in this study: d10 and d60 are the particle diameters for which 10 and 60% of the particles (by mass) are smaller, respectively; Φ is the total porosity; DS is the CO2 diffusion coefficient; ρ is the density.
Soil Mediumd10/mmd60/mmΦ/m3 m−3Ds/m2 s−1ρ/g cm−3
sandy soil0.0630.1110.4022.180 × 10−61.851
loam0.0450.0750.5183.603 × 10−62.013
loess0.0530.0870.5723.112 × 10−62.139
quartz sand0.1700.3550.4713.477 × 10−61.820
Table 2. Wind speed characteristics for the wind conditions used in this study.
Wind ConditionWind Speed (m s−1)Standard Deviation (m s−1)
W00–0.1/
W10.33–0.350.070
W20.38–0.400.074
W30.41–0.430.067
W40.50–0.530.100
W50.55–0.600.106
Disclaimer/Publisher’s Note: The statements, opinions and data contained in all publications are solely those of the individual author(s) and contributor(s) and not of MDPI and/or the editor(s). MDPI and/or the editor(s) disclaim responsibility for any injury to people or property resulting from any ideas, methods, instructions or products referred to in the content.

