1. Introduction
Passenger safety in urban railways has long been a critical concern for train operators, as it directly affects both the safety and operational efficiency of the entire transit system. Several factors contribute to these risks, including passenger behaviour, station and train design, the availability of information, and prevailing weather conditions [
1]. Additionally, external factors related to the surroundings of metro stations also influence safety, thereby impacting the sustainability of the entire railway system. According to Aprigliano et al. [
2], congestion in metro stations significantly increases the likelihood of accidents involving pedestrians, who are often unable to avoid being exposed to an incident or other risk in such crowded environments.
Each of these factors influences the likelihood and nature of incidents in metro stations across various spaces. As reported by Seriani and Fernández [
3], metro stations can be categorized into five micromobility spaces: the platform–train interface (PTI), platform stairs, concourse, complementary space (e.g., commercial areas), and the city (e.g., station access points). Among these, the platform–train interface (PTI) is widely recognized as one of the most complex and hazardous areas within railway stations [
4].
The PTI, where passengers interact with both the platform and the train, poses unique challenges and risks. For instance, in the Valparaiso Metro system, more than 20 million passengers use the railway network annually. During peak hours, passenger densities at the PTI can reach up to four or more individuals per square meter [
5]. Such extreme crowding significantly increases the risk of incidents, including falls onto the tracks or slips, due to the confined and often congested nature of the space.
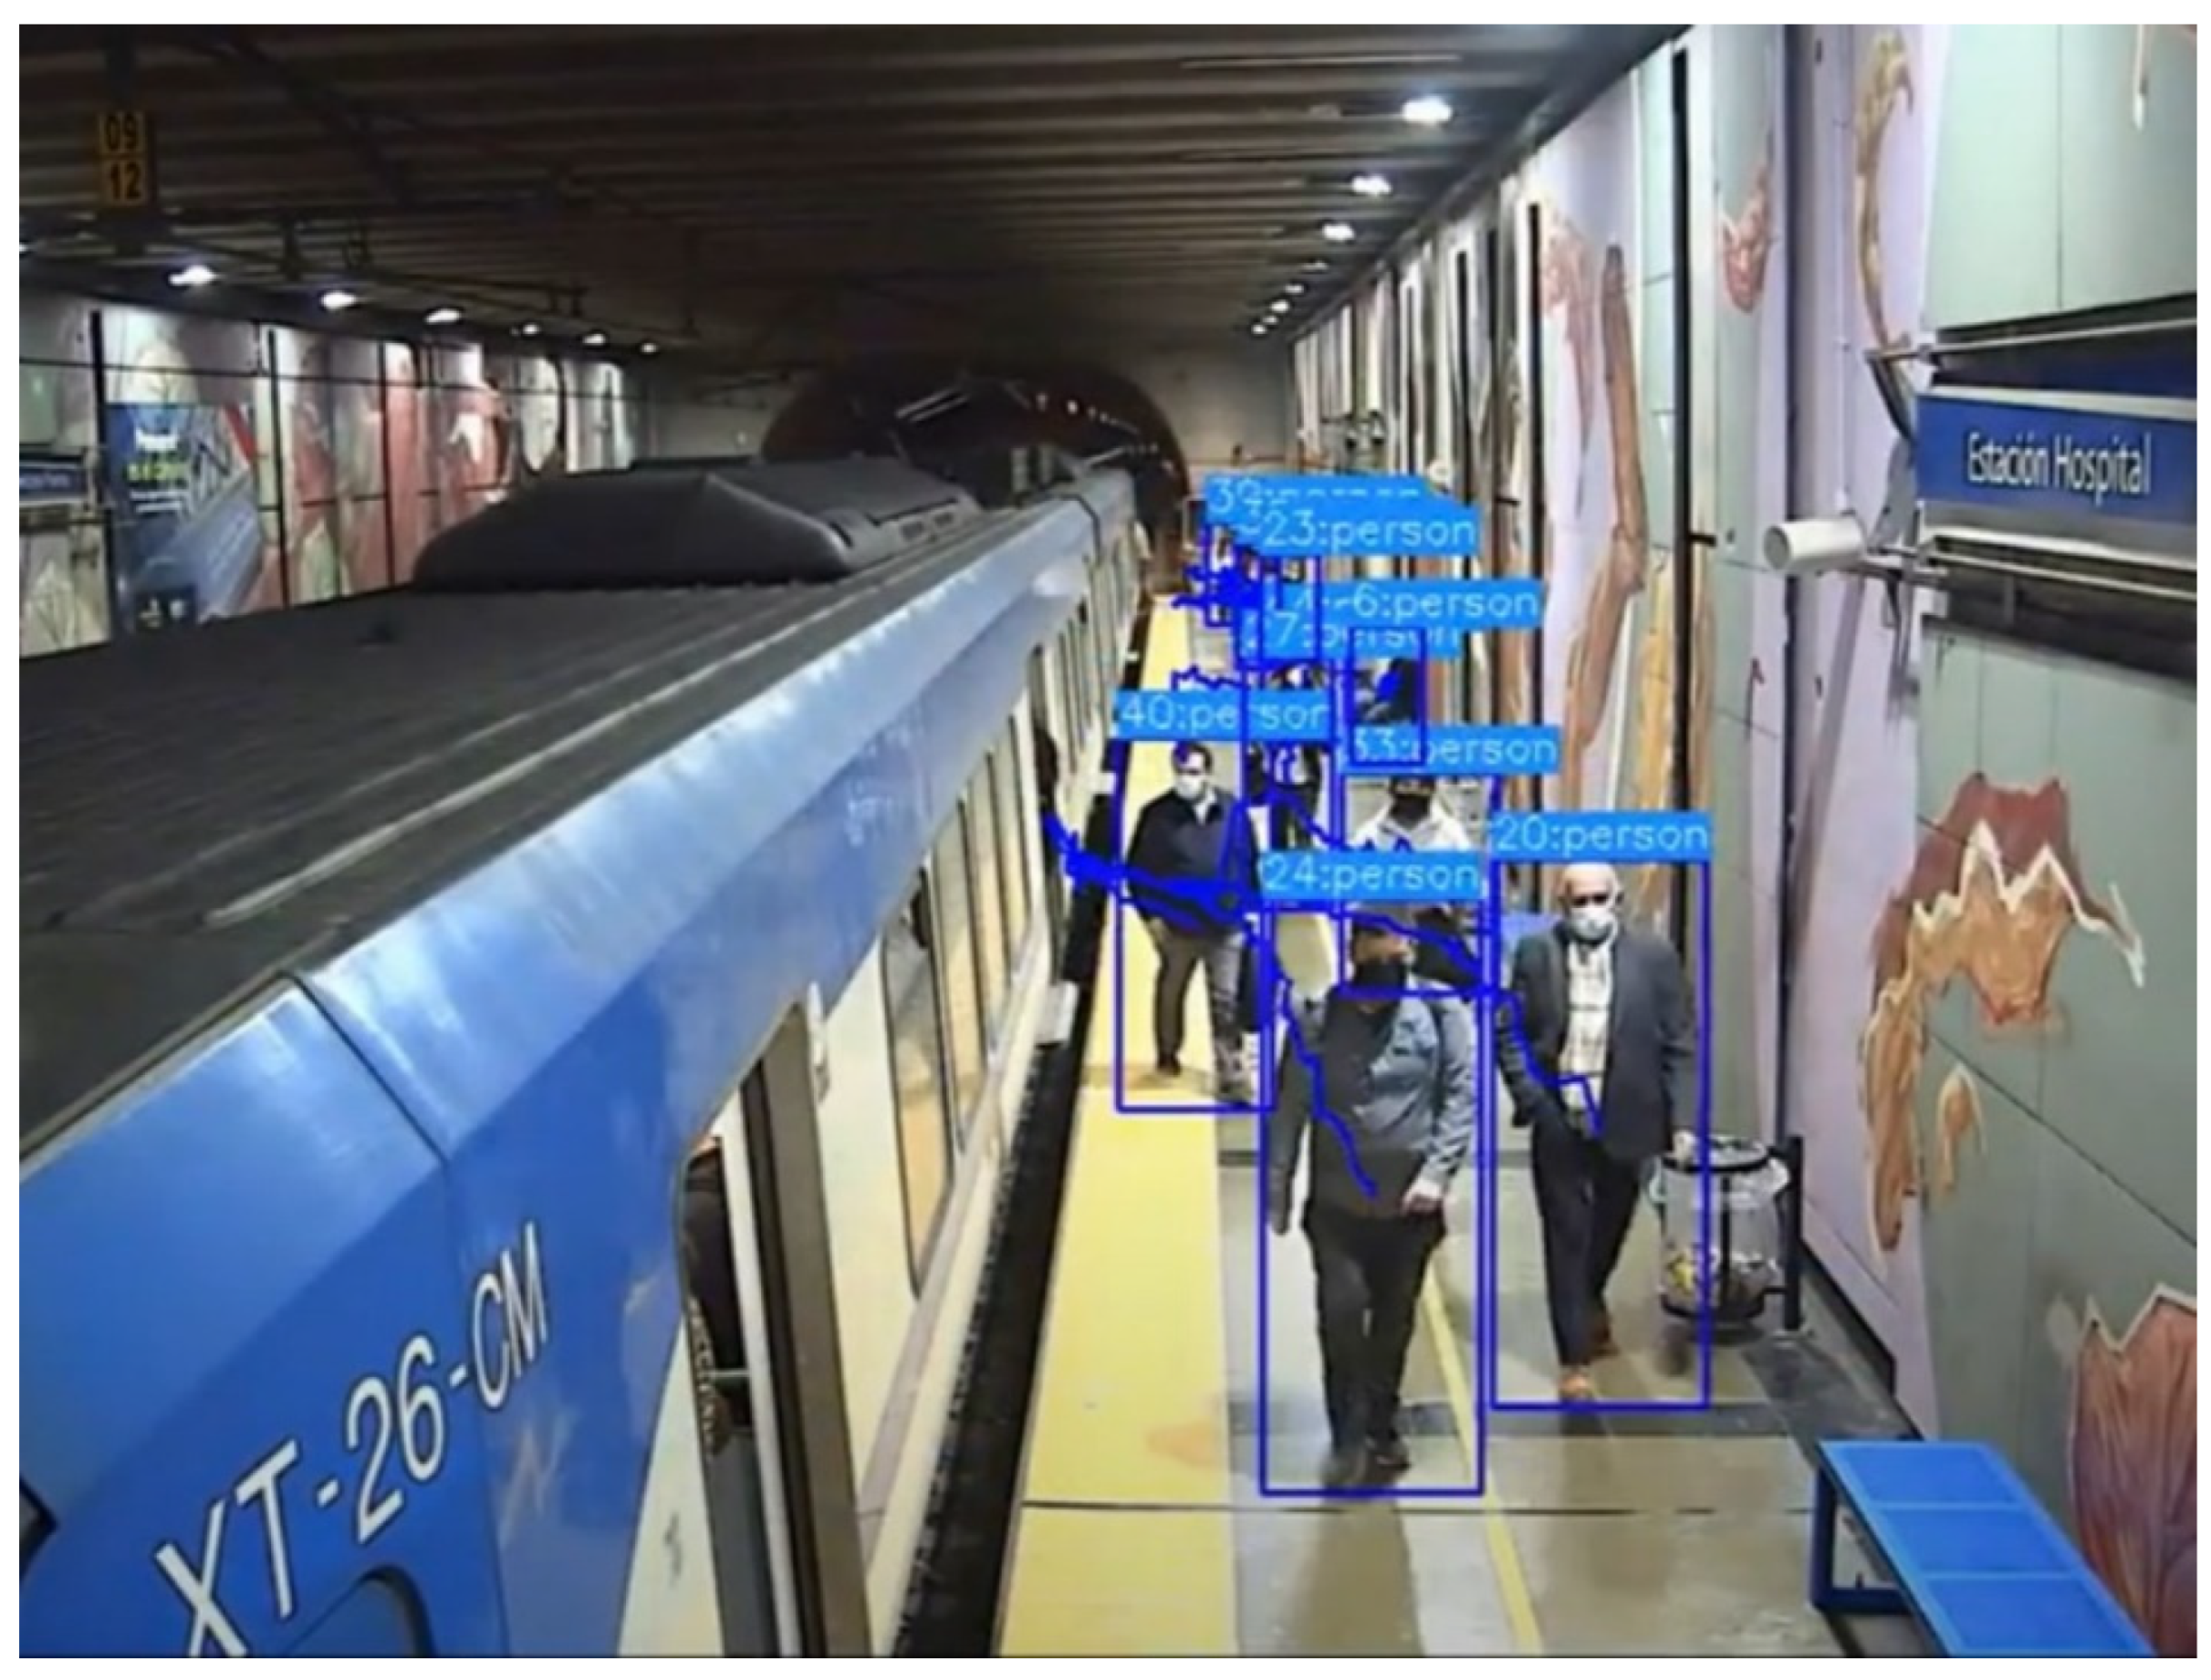
Given these challenges, there is a significant opportunity to improve safety by employing advanced tracking tools and monitoring systems. These technologies provide real-time data on passenger density and movement patterns at the PTI, enabling timely interventions when the space becomes overcrowded. For example, by identifying periods of high congestion, operators can implement measures to manage crowd flow more effectively, reducing the likelihood of accidents and improving overall safety. These proactive measures could include adjusting train schedules, deploying additional staff to assist passengers, or implementing crowd control strategies to prevent incidents.
Garcia et al. [
6] suggest that leveraging such tracking technologies can significantly mitigate risks at the PTI, helping to prevent accidents such as passengers falling onto the tracks or slipping. By continuously monitoring and analyzing crowd conditions, transit authorities can make informed decisions to enhance passenger safety and operational efficiency.
Figure 1 illustrates the use of these tracking tools and their potential impact on improving safety at the PTI, emphasizing the importance of integrating technology into safety management practices.
From a design perspective, the layout of seats inside a train plays a crucial role in shaping passengers’ perceptions of safety and comfort. The arrangement of seating can significantly influence personal space, which in turn affects the likelihood of various incidents occurring. For instance, a cramped seating layout may reduce personal space and contribute to uncomfortable conditions, potentially leading to incidents such as suffocation, especially in situations where the train is crowded or poorly ventilated [
7]. This impact on personal space is an important consideration in train design, as it directly relates to passenger safety and overall satisfaction.
Seriani et al. [
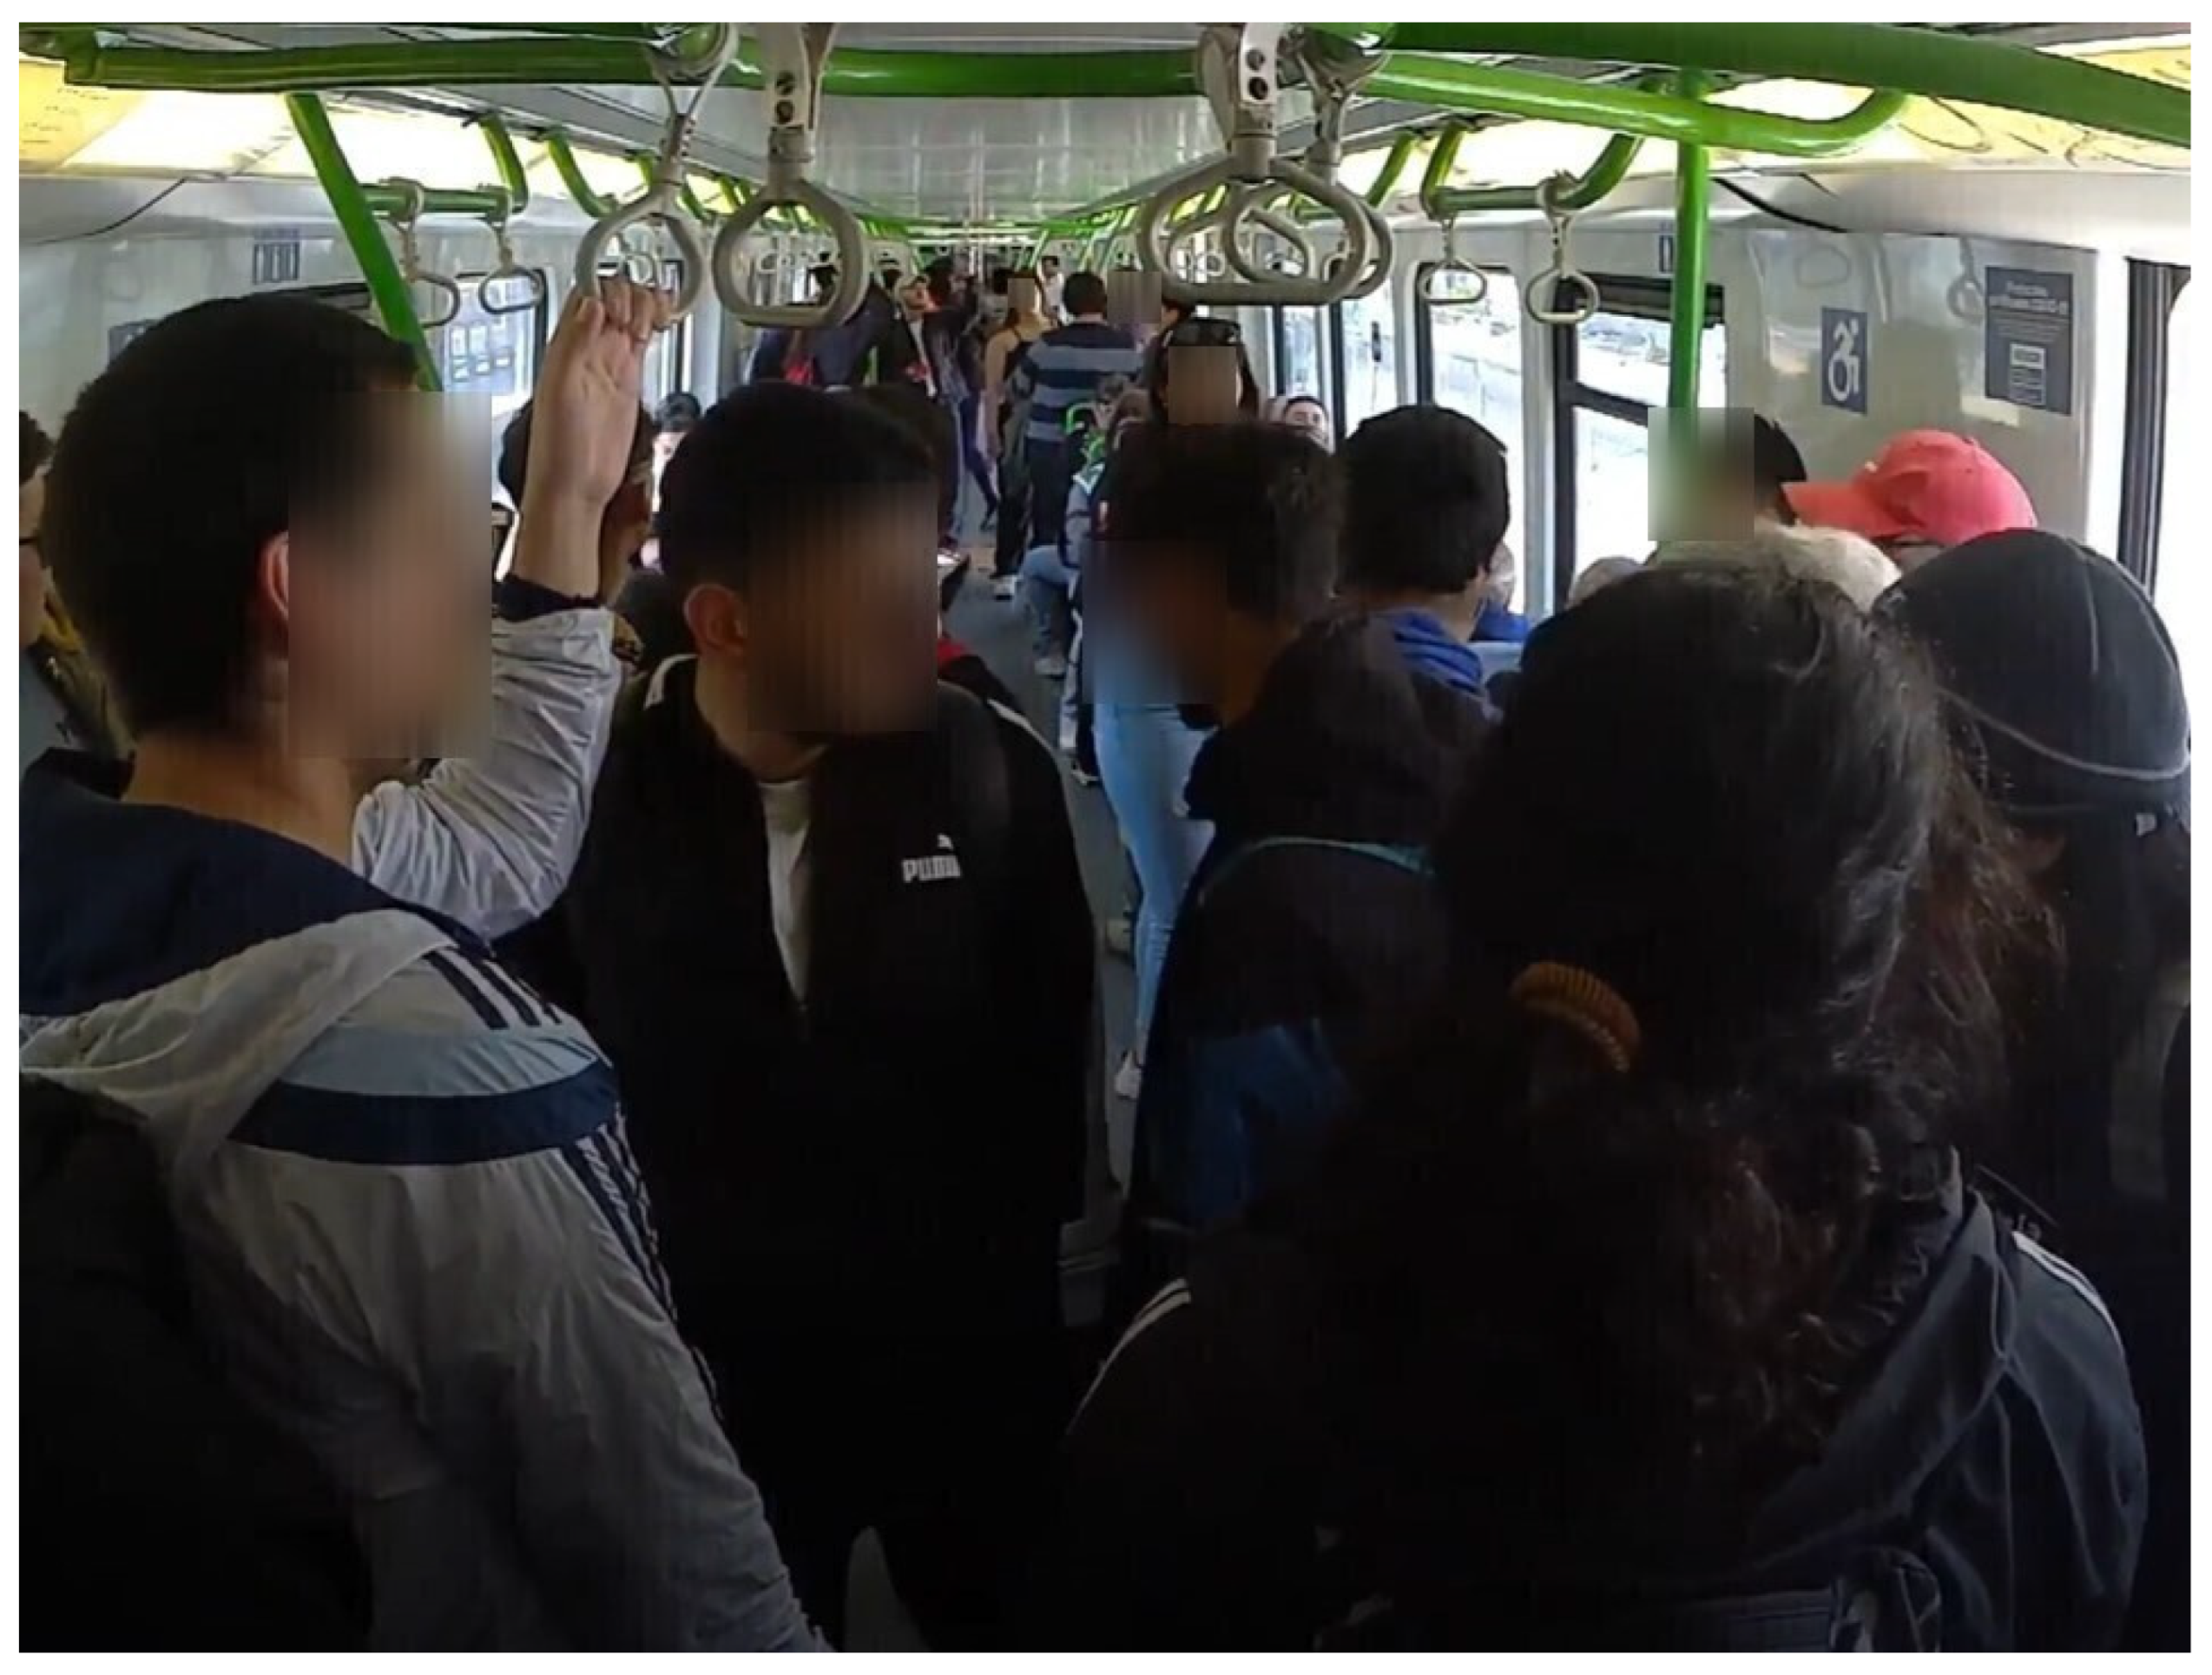
7] highlight varying passenger preferences based on the type of service. For long-distance journeys, passengers generally prefer to use seats, valuing the comfort and support they provide for extended travel. In contrast, in urban services characterized by shorter trips, frequent stops, and quick boarding and alighting, passengers often opt to stand near the train doors. This behaviour is illustrated in
Figure 2, which shows the tendency of urban passengers to position themselves close to the doors, facilitating a swift exit at their destination.
Effective information management is crucial in addressing the impact of train delays on scheduling and operational efficiency, as delays can trigger a cascade of risks throughout the railway system. Extended waiting times at platforms due to delays can create a knock-on effect, increasing the potential for incidents. For example, prolonged waiting periods may cause passengers to become impatient or agitated, escalating the risk of accidents or other safety issues [
8]. Therefore, effective communication and timely updates about delays are essential for mitigating these risks and maintaining smooth operations.
Weather conditions also play a critical role in passenger safety and service performance. Adverse weather, such as rain and strong winds, can compromise safety conditions at the platform–train interface (PTI), leading to delays and a heightened risk of incidents. For instance, rain can create slippery platform surfaces, increasing the likelihood of slips, while strong winds may affect the stability of train operations or the functioning of station facilities [
9]. These weather-related challenges underscore the need for robust contingency plans and preventive measures to ensure passenger safety and maintain reliable service under varying weather conditions.
Overall, the interplay between design, information management, and weather conditions highlights the multifaceted nature of passenger safety in urban rail systems. Each of these factors must be carefully considered and managed to minimize incident risks and enhance the overall travel experience.
According to Seriani et al. [
10], factors influencing safety at the PTI are critical from the passengers’ perspective in achieving a sustainable railway system. These factors include the design of the train and station, the quality of information provided to passengers, and the impact of weather conditions. However, there remains a critical question regarding how these factors are interrelated and how they contribute to the occurrence of incidents.
In particular, further investigation is needed to understand the relationship between these factors and the occurrence of accidents at the PTI. For example, how do design elements—such as station type or the presence of stairs at station access points—impact the likelihood of incidents under various conditions? Additionally, how does the quality and timeliness of information provided to passengers influence their behaviour and safety, especially when comparing weekdays and weekends? Furthermore, how do adverse weather conditions, such as those typical of autumn–winter or spring–summer seasons, interact with these factors to either exacerbate or mitigate risks?
Addressing these questions is challenging due to the lack of a comprehensive passenger risk model capable of analyzing the impact of various factors on incidents at different micromobility spaces in metro stations. Currently, there is no established framework that integrates design, information, and weather conditions to evaluate their combined effect on passenger risk incidents in Valparaiso Metro. This gap in research prevents a clear understanding of how these elements interact and influence the frequency and nature of incidents.
The objective of this paper is to bridge this gap by developing and proposing a passenger risk model specifically designed to analyze the impact of incidents in different micromobility spaces. The model aims to identify and quantify the relationships between key factors—such as design features, information quality, and weather conditions—and the occurrence of incidents. By providing a structured approach to evaluate these interactions, the paper seeks to deliver valuable insights into how various factors contribute to safety risks and to suggest effective strategies for mitigating these risks.
The paper is organized as follows:
Section 2 provides a literature review, identifying key concepts and gaps in understanding risk factors and incidents in railway systems.
Section 3 describes the methodology, including statistical analysis and models based on regression techniques.
Section 4 presents the results, followed by the conclusions in
Section 5.
2. Literature Review
Metro systems are critical components of transportation infrastructure in densely populated urban areas, facilitating sustainable development by reducing congestion and increasing efficient mobility. As described in the study by Aboul-Atta and Elmaraghy [
11], the metro is considered one of the most effective solutions to urban transportation problems, integrating reliability, passenger capacity, and punctuality—essential characteristics to meet the demands of modern cities. However, incidents and accidents that occur at stations pose a constant challenge to the safety and efficiency of the system, making it essential to identify factors contributing to these events in order to implement prevention strategies and improve user experience.
The analysis of risk factors in metro stations requires a comprehensive approach that considers different micromobility spaces within the station, such as the train, platforms, stairs, ticket counters, turnstiles, and access areas. Each of these spaces presents specific risks and requires detailed evaluation to enhance the operational safety of the system.
Passenger incidents in metro stations are influenced by various factors. According to Lu et al. [
12], the timing of disruptions, the location of disruptions, transfer stations, station positioning, and the type of disruption are significant factors that greatly affect the severity of incidents from the perspective of society, metro operators, and passengers. The same authors found that flow and environmental factors are not significantly related to the severity of disruptions in metro stations.
Wang and Fang [
13] emphasized the importance of studying human error in the context of traffic dispatchers, who play a key role in the safe operation of the metro system. Failures in signal detection or decision-making during critical situations can trigger serious accidents on trains. Tragic examples, such as the Daegu metro fire in 2003 and the Shanghai collision in 2011, highlight the importance of effectively managing these dispatcher errors to prevent incidents aboard trains and within critical areas of stations. In this regard, Wang et al. [
14] developed a model to predict disruptions using the Shanghai metro system as a case study. This model considers factors such as the cause of the incident, its location, and its timing, all of which influence the duration of disruptions.
Chen et al. [
15] investigated unplanned disruptions in the Hong Kong metro system, identifying key factors such as the signal control system, line types, and the location of the disruption. Other factors, such as the time of day and weather conditions, had minor effects. Furthermore, Chen et al. [
15] investigated the prediction of incidents and their impact on traffic management. Using a statistical model, they found that the type of incident and the affected line type were the most significant factors in predicting train delays. The researchers noted that their model outperformed those based on machines/assemblies.
Wan et al. [
16] identified human errors and infrastructure failures, such as track and power supply issues, as critical contributors to derailments and collisions. These incidents highlight the importance of properly managing spaces where trains interact with passenger-accessible areas, such as platforms, where errors can have serious consequences.
Suo et al. [
17] emphasized that signalling, communication, and vehicle failures are key determinants of metro operation safety, particularly concerning trains and platforms. These failures can create a domino effect, leading to delays, service suspensions, and increased risks to passenger safety aboard trains and during their movement on the platforms. During peak hours, Abolfazli et al. [
18] observed a higher frequency of incidents affecting train operations. Using integrated operational records from the Montreal metro system, the authors applied clustering analysis and incident data to understand delays and the domino effect.
Terabe et al. [
19] explored the influence of station design, equipment, and user profiles on platform incidents. The authors developed regression models revealing how factors such as the length of narrow platform sections, the gap width between the platform and train, platform curvature, passenger flow, the number of trains passing and stopping, and the use of audio and visual announcements are critical to ensuring safety at the platform–train interface (PTI). According to Harding et al. [
20], the PTI is the space where most incidents occur, with horizontal and vertical gaps between the train and platform presenting a direct relationship with risks and incidents.
Zhou et al. [
21], using smart card data, conducted an analysis of the risk of overcrowding on platforms during period of high passenger flow. Their findings suggest that such data can be instrumental in preventing incidents and improving safety management at railway stations. Li et al. [
22] added that, during emergencies, train delays are highly sensitive to the duration and location of the incident. The response capacity of passengers and staff on platforms and trains plays a crucial role in system recovery.
Regarding incidents on escalators, Xing et al. [
23] noted that passenger behaviours, such as not holding onto the handrail or failing to maintain balance, significantly increase the risk of falls. Women and older adults are the groups most vulnerable to these accidents on escalators, highlighting the importance of enhancing safety in these specific areas. Wang et al. [
24] expanded this analysis using predictive models and found that physical interaction between passengers and1 the electromechanical system is key to understanding the causes of accidents in these areas.
Larue et al. [
25] investigated slip, trip, and fall (STF) incidents in areas with vertical level changes, such as stairs and ramps. The study emphasized that passenger behaviours, such as running or carrying luggage, significantly contribute to incidents, especially in high-traffic areas like ticket counters and stairways. Distractions caused by searching for visual information also increase the risks of accidents in these areas.
Passenger behaviour in high-traffic areas, such as turnstiles and access points, plays a significant role in safety outcomes. Lu et al. [
26] identified unsafe behaviours, such as pushing or attempting to board the train after door-closing alarms sound, as critical factors contributing to stampedes and falls. These incidents often occur in access areas, especially during peak hours when passenger pressure is greater, increasing risks both at access points and on platforms.
Safety concerns also extend to areas around stations. Savage [
27] studied accidents between trains and pedestrians in the Chicago metro system, including data on both intentional and unintentional incidents. Additionally, Wang et al. [
28] analyzed the causes and risks associated with incidents in urban rail transit systems, proposing a framework that identifies risk hotspots and their connection to accidents.
Passenger flow management is crucial for preventing congestion and related accidents at stations. Wang et al. [
29] developed a predictive control system to enhance automatic train regulation and manage passenger flow, highlighting that excessive congestion during peak hours can increase risks on both trains and platforms. This study emphasizes the importance of effectively managing passenger movement to avoid dangerous situations in high-traffic areas of stations.
From a modelling perspective, Luo et al. [
30] created a multi-output deep learning model to provide valuable information to passengers and train dispatchers for predicting delays in the arrival of multiple trains simultaneously. Similarly, Tiong et al. [
31] proposed a data-driven predictive model for train delays, emphasizing the need for a holistic approach to understand the effects of delays on railways. Hu et al. [
32] developed a model to evaluate the difficulty of failure disposal (e.g., signal failures) based on entropy and particle swarm optimization (PSO). Recent studies have further explored hazard prediction and management. Ding et al. [
33] used predictive models to analyze metro operational accidents based on accident victims, train delays, and damage to facilities in a city in China. Likewise, Wang et al. [
34] proposed a matrix-based management framework to analyze and support safety decision-making in urban rail transit operations. Wu et al. [
35] presented an innovative approach that utilized case-based reasoning and natural language processing (CBR and NLP) techniques to manage incidents in metro systems. This approach efficiently addressed risky passenger behaviours contributing to accidents in metro stations, such as irregular actions on escalators like not holding onto handrails or being distracted by mobile devices, which were major causes of injuries. Additionally, boarding or alighting from the train after the door-closing alarms sounded was highlighted as a high-risk behaviour due to the danger of being caught in safety barriers. Another critical factor was passengers pushing against each other during peak times, which led to stampedes and serious injuries. Finally, walking distractedly without paying attention to the ground significantly contributed to falls in stations. By facilitating a rapid response to these behaviours, the system improved safety on trains, platforms, and at access areas, optimizing risk management and preventing serious incidents.
With respect to architectural factors, Mizuno et al. [
36] highlighted how physical barriers, such as the gap between the train and the platform, or poorly positioned tactile pavements, increase the risk of falls for visually impaired individuals. This underscores the need to improve the design of access points and platforms to ensure the safety of the most vulnerable passengers. Sangiorgio et al. [
37] proposed a quantitative index to assess safety levels in rail transport systems, based on the Analytic Hierarchy Process (AHP) and mathematical optimization. This index enables operators to manage risks associated with accident precursors, such as ignored signals or component failures. The authors validated the index using data from 29 European rail networks, highlighting the importance of early identification of technical and human errors in preventing serious accidents. One such incident occurred in Italy in 2016, where railway traffic management errors and inadequate staff training led to the deaths of 23 people.
Despite advances in identifying and managing risk factors in metro systems, a knowledge gap persists, limiting the application of these analyses to specific contexts, such as the Valparaíso Metro. Expanding studies to include safety aspects tailored to diverse micromobility spaces in metro stations would provide a more comprehensive understanding of the associated risks and challenges. This approach would not only provide insights into incidental factors within these spaces but also inform the development of more equitable and sustainable strategies for safety management in public transportation systems.
3. Materials and Methods
3.1. Case of Study
This study focuses on railway stations in Valparaíso, located across the cities of Valparaiso, Viña del Mar, Quilpue, Villa Alemana, and Limache. The city of Valparaíso is part of the Metropolitan Area of Valparaíso (Gran Valparaíso), which includes five municipalities: Valparaíso, Viña del Mar, Quilpué, Villa Alemana, and Concón. This region has an approximate population of 1 million people, according to [
38]. In terms of urban mobility, Gran Valparaíso’s transportation patterns are diverse: 27% of trips are made on foot, 39% by public transport, and 29% by car [
39]. The survey data highlight that most trips within the region are internal to the municipalities, with Valparaíso itself having a higher proportion of internal trips compared to the other municipalities, including a greater share of trips made for work purposes. This is partly due to the concentration of economic activities in certain areas within each municipality, as noted by Caro and Aránguiz [
40]. Despite this, the urban environment of Valparaíso still favours the use of both private and public transportation due to the “tunnel effect” created by these systems [
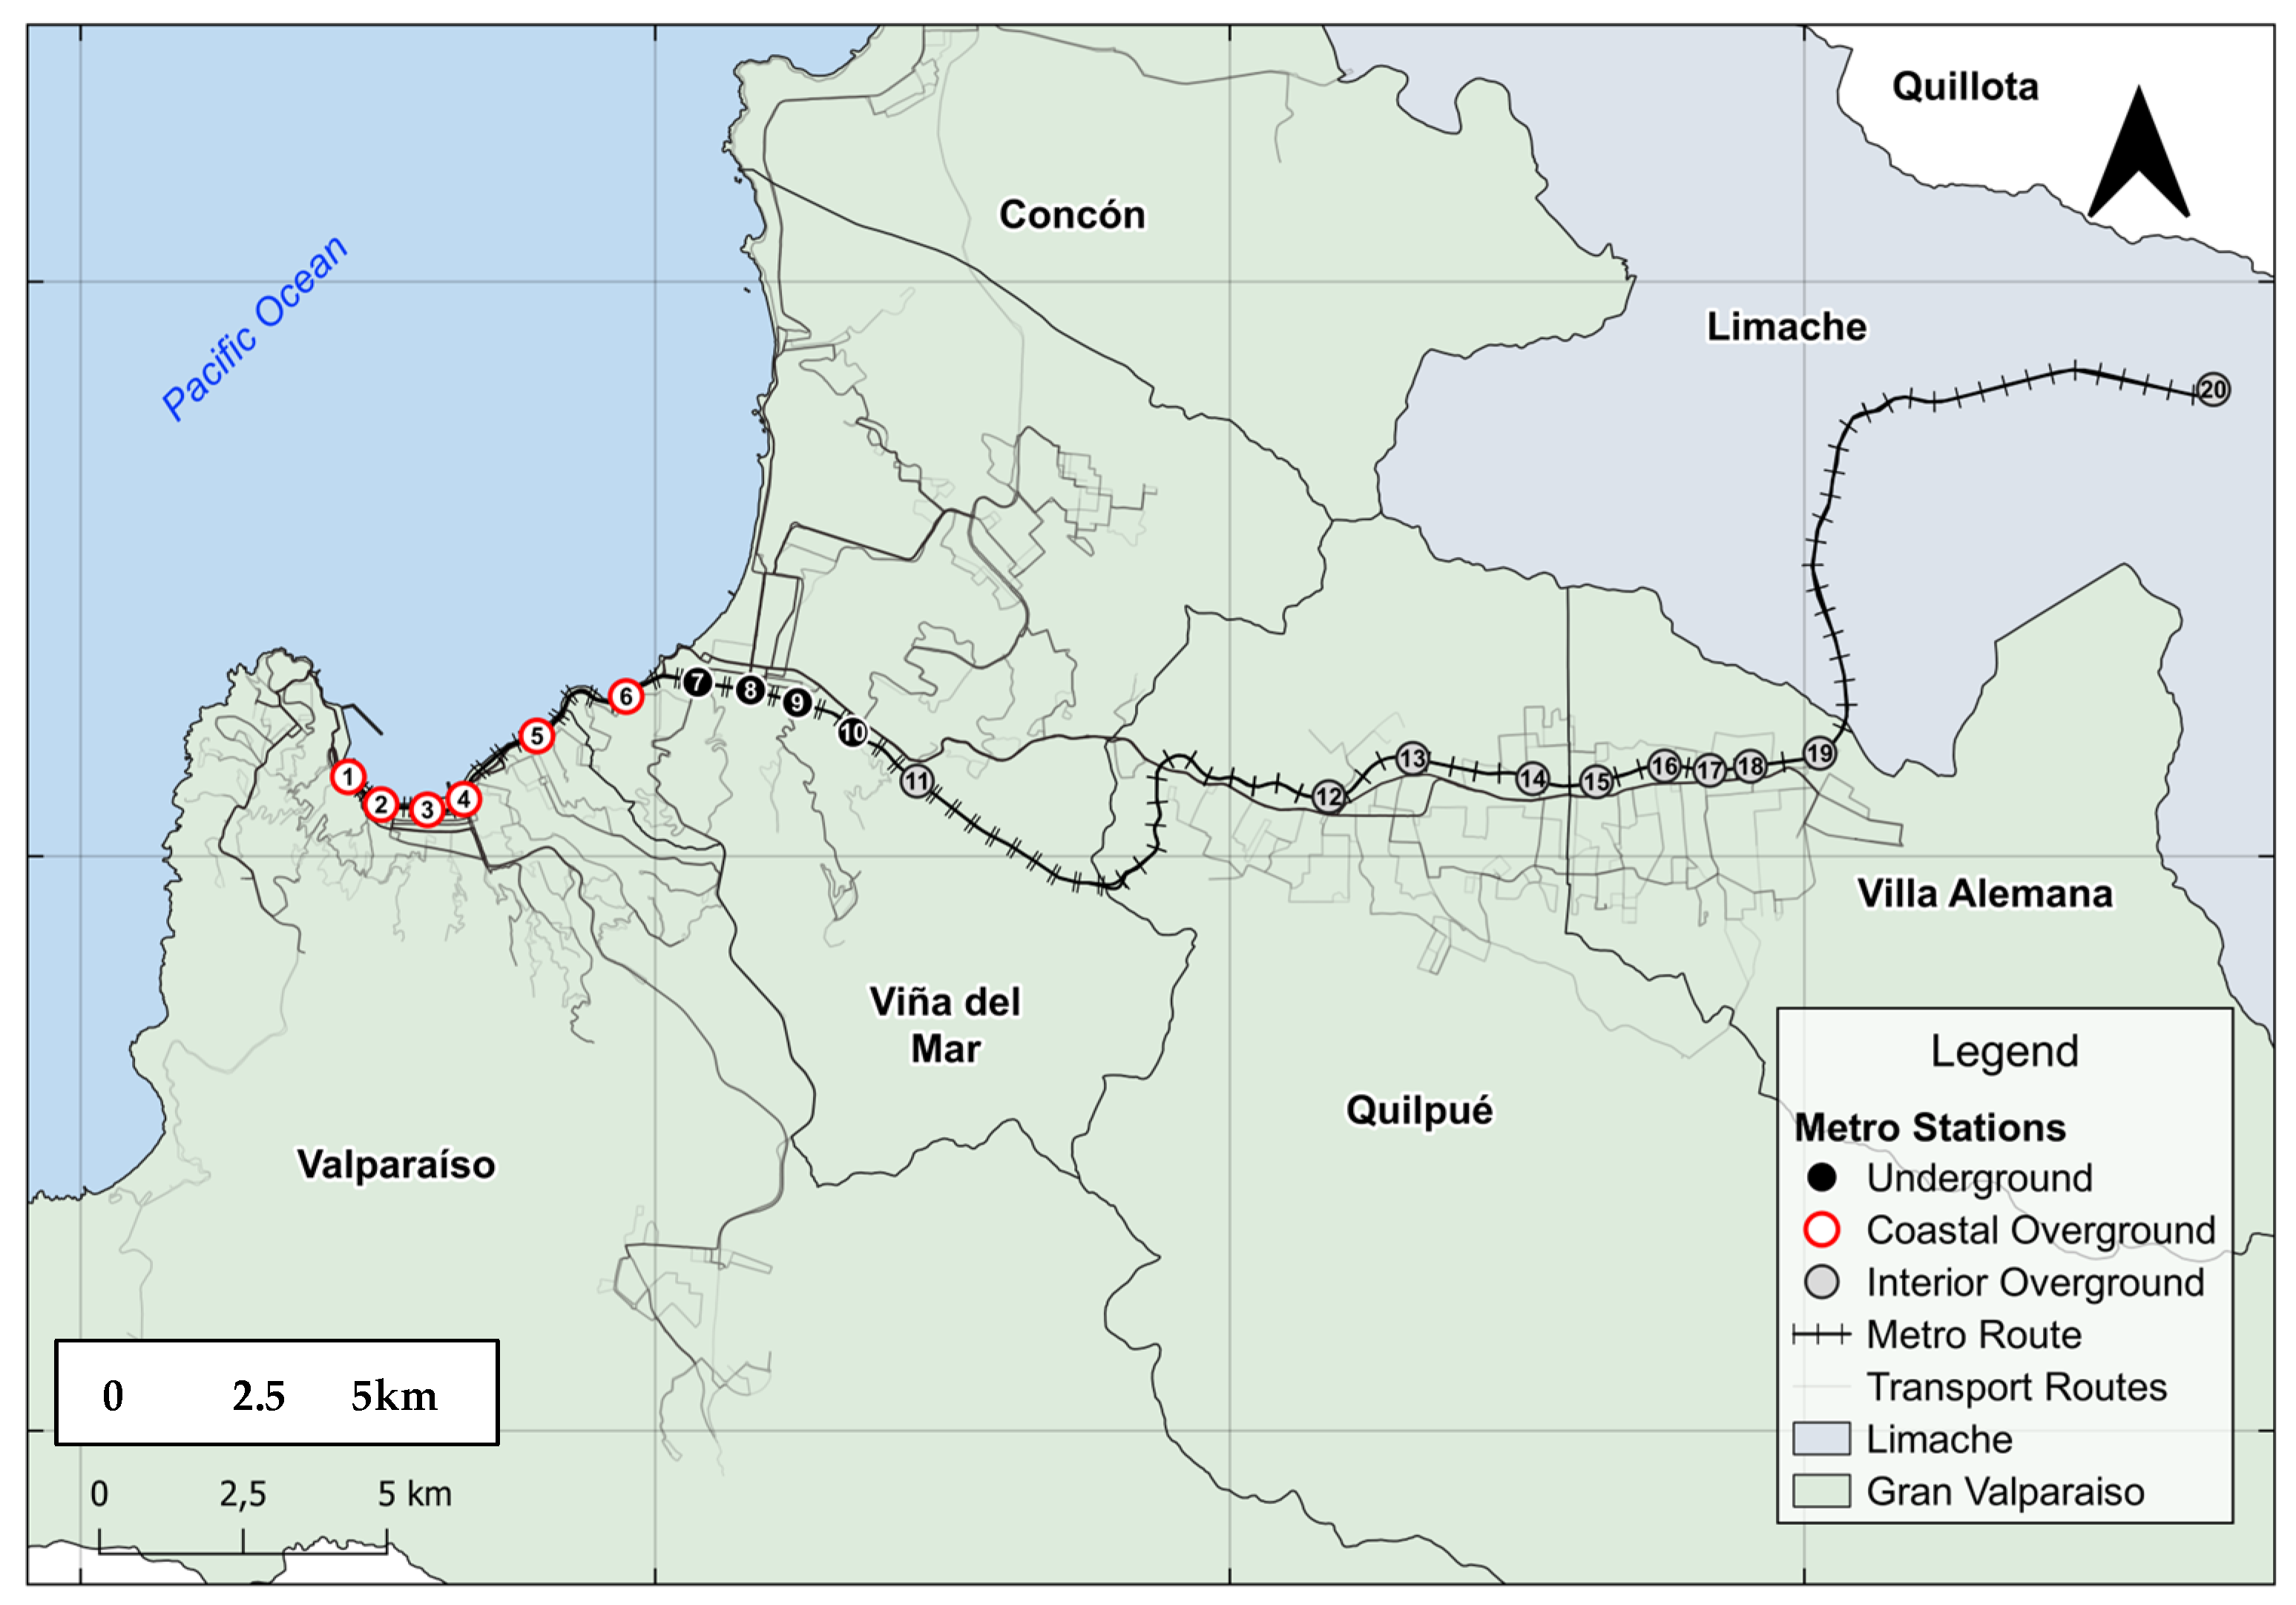
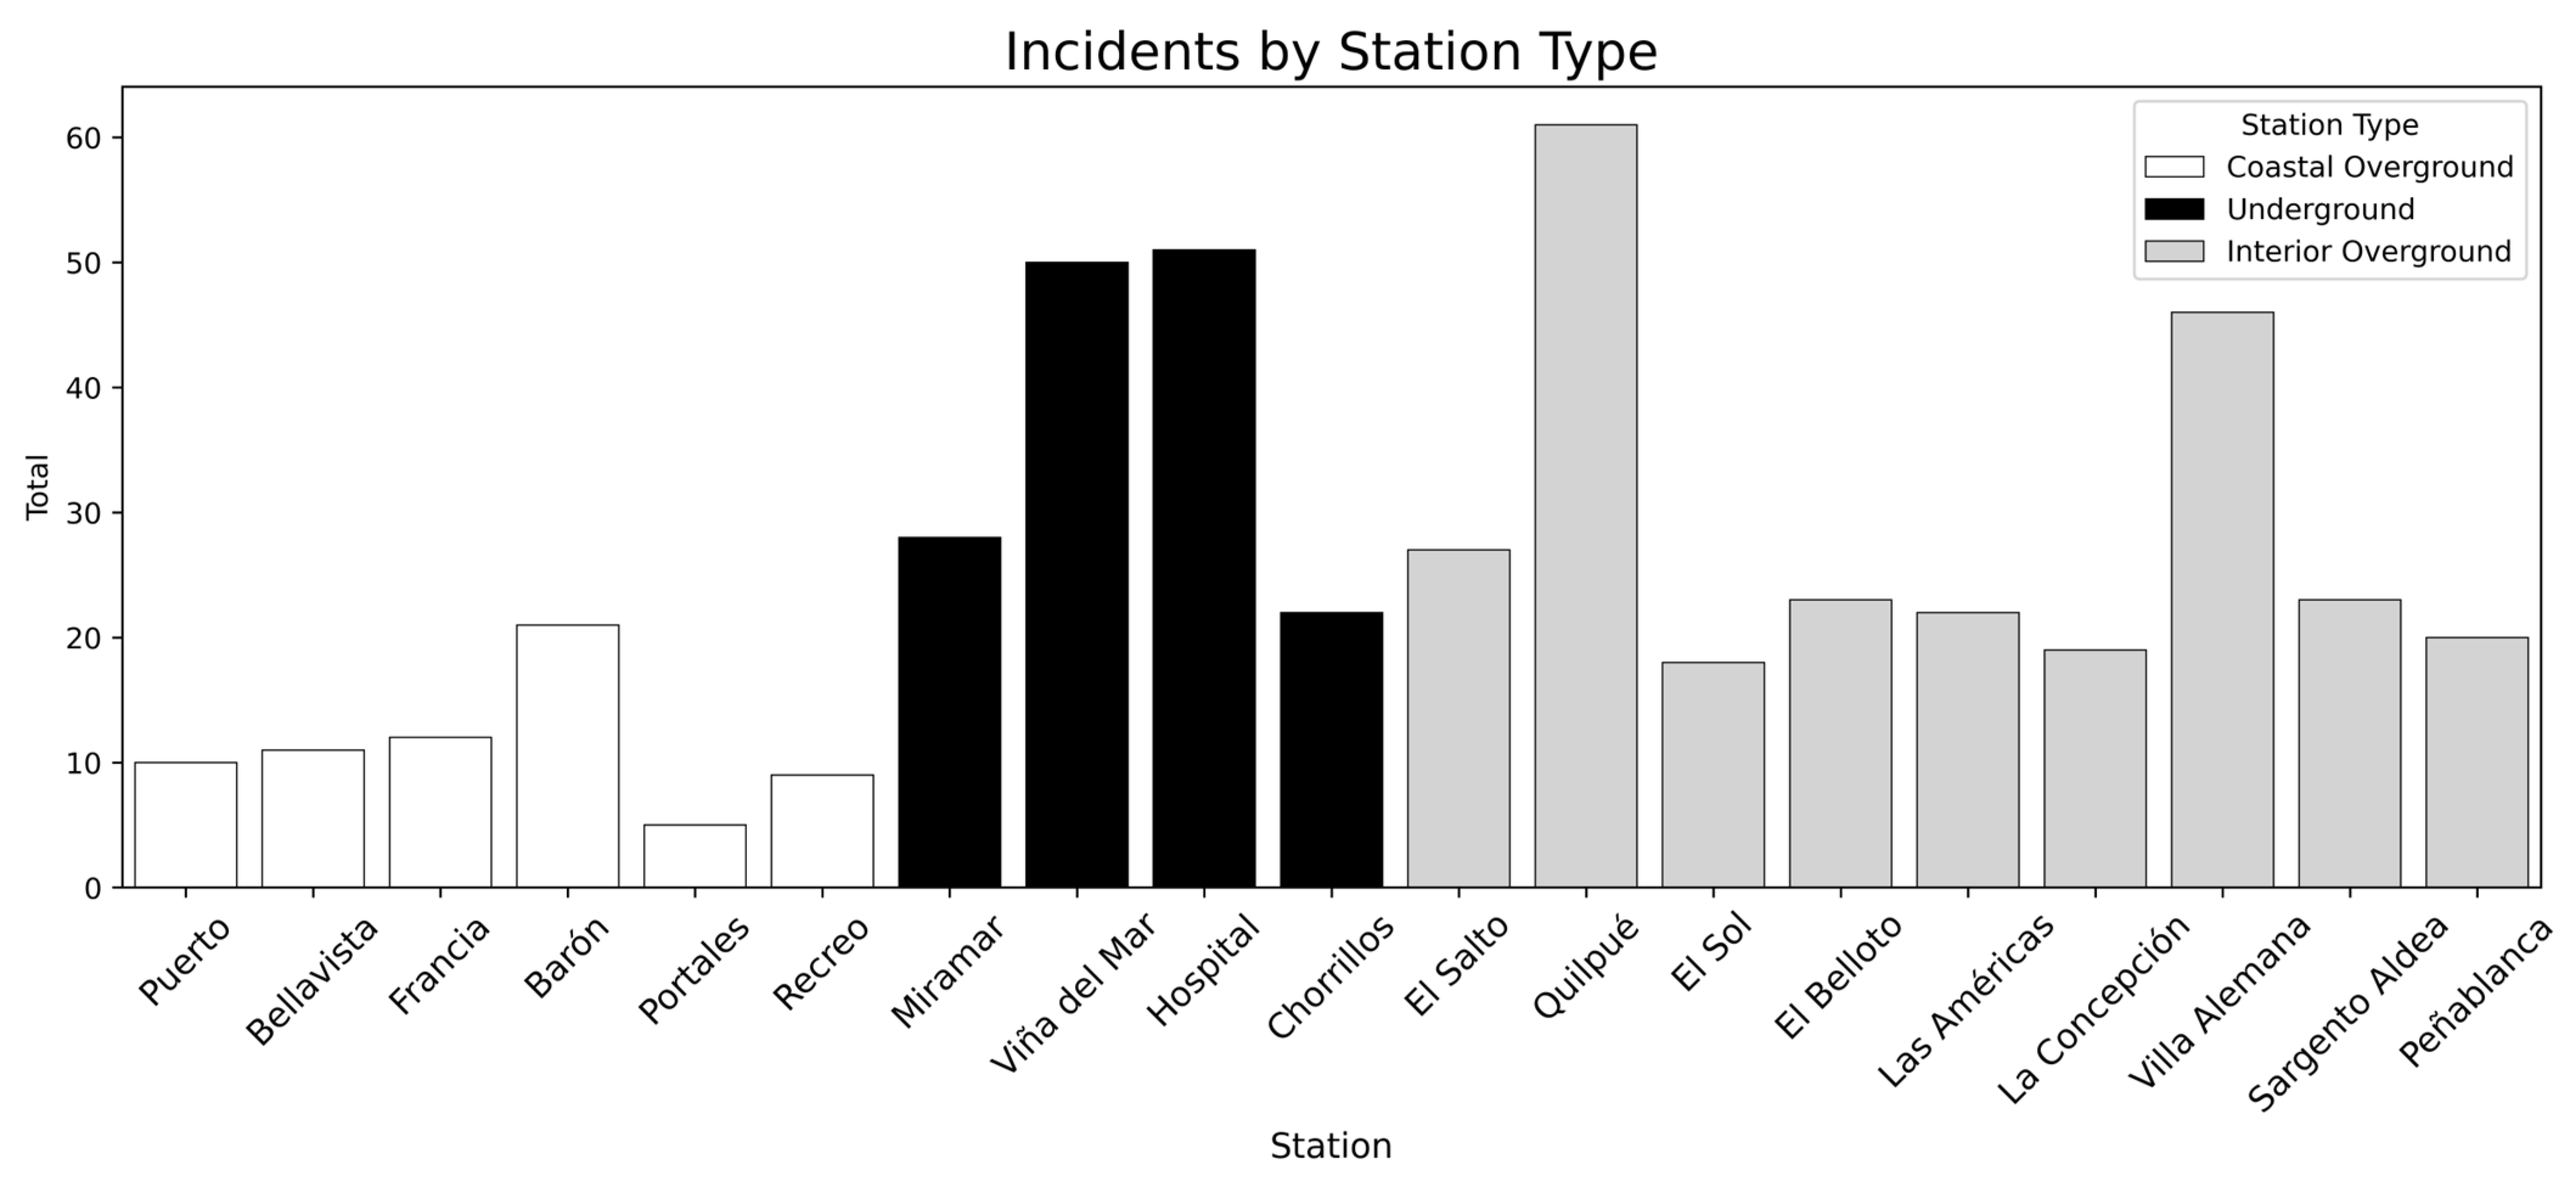
41]. The “tunnel effect” refers to transport infrastructure like highways and public transit systems that connect key hubs of high economic activity, where accessibility is prioritized and transportation options are concentrated. However, areas between these hubs often lack the necessary infrastructure (e.g., bus stops or train/metro stations) to foster local economic development, leading to spatial imbalances in the region’s growth and impacting municipalities like Gran Valparaíso. The metro network consists of 20 stations spread across 42 km, serving five cities. The coastal overground stations (shown in
Figure 3, from 1 to 6) are Puerto, Bellavista, Francia, Baron, and Portales [
5]. The underground stations (shown in
Figure 3, from 7 to 10) are Miramar, Viña del Mar, Hospital, and Chorrillos [
5]. The interior overground stations (shown in
Figure 3, from 11 to 20) are El Salto, Quilpue, El Sol, El Belloto, Las Americas, La Concepcion, Villa Alemana, Sargento Aldea, Peñablanca, and Limache [
5].
Table 1 provides a detailed account of the total passenger flow at the Valparaiso Metro stations for the years 2022 and 2023. These data reveal significant variations in passenger demand across different stations over the two-year period. Notably, the terminal stations, Puerto and Limache, exhibited a remarkably high level of demand compared to other stations on the network. These terminal stations, often serving as major transfer points or end destinations, naturally experience higher passenger volumes, which is reflected in their elevated flow statistics.
Viña del Mar station emerged as the station with the highest passenger flow in 2023. Such a high number of passengers is indicative of its critical role within the network, potentially due to factors such as its strategic location, popularity among commuters, or its status as a major commercial or residential area. Following closely, Quilpue station and Villa Alemana station also recorded substantial flows, highlighting their importance in the network’s overall passenger distribution and suggesting that they too are key nodes in the transit system.
The overall passenger flow in 2023 experienced a dramatic increase, reaching approximately three times the flow recorded in 2022. This surge is largely attributed to the effects of the COVID-19 pandemic, which had significantly impacted passenger numbers in the preceding years. During the pandemic, various restrictions and changes in travel behaviour led to reduced ridership across many transit systems. As restrictions eased and recovery began, passenger numbers rebounded, resulting in a substantial rise in overall flow.
The increase in passenger flow in 2023 reflects a recovery phase as normal routines resumed and travel patterns adjusted. This substantial rise underscores the importance of adapting transit operations to accommodate higher volumes of passengers and address the challenges associated with increased demand. Understanding these flow dynamics is crucial for planning and managing station capacity, scheduling, and resource allocation to ensure efficient and safe service for all passengers.
Overall, the data presented in
Table 1 highlight significant trends and changes in passenger flow at the Valparaiso Metro stations, providing valuable insights into the system’s performance and the impact of external factors such as the pandemic on transit usage patterns.
3.2. Variables and Model Description
The analysis draws upon data from incidents recorded by Valparaiso Metro from April 2022 to October 2023, encompassing approximately 500 incidents across the entire metro network. This comprehensive dataset provides a broad view of safety issues within the system in different mobility spaces at each metro station in the railway system.
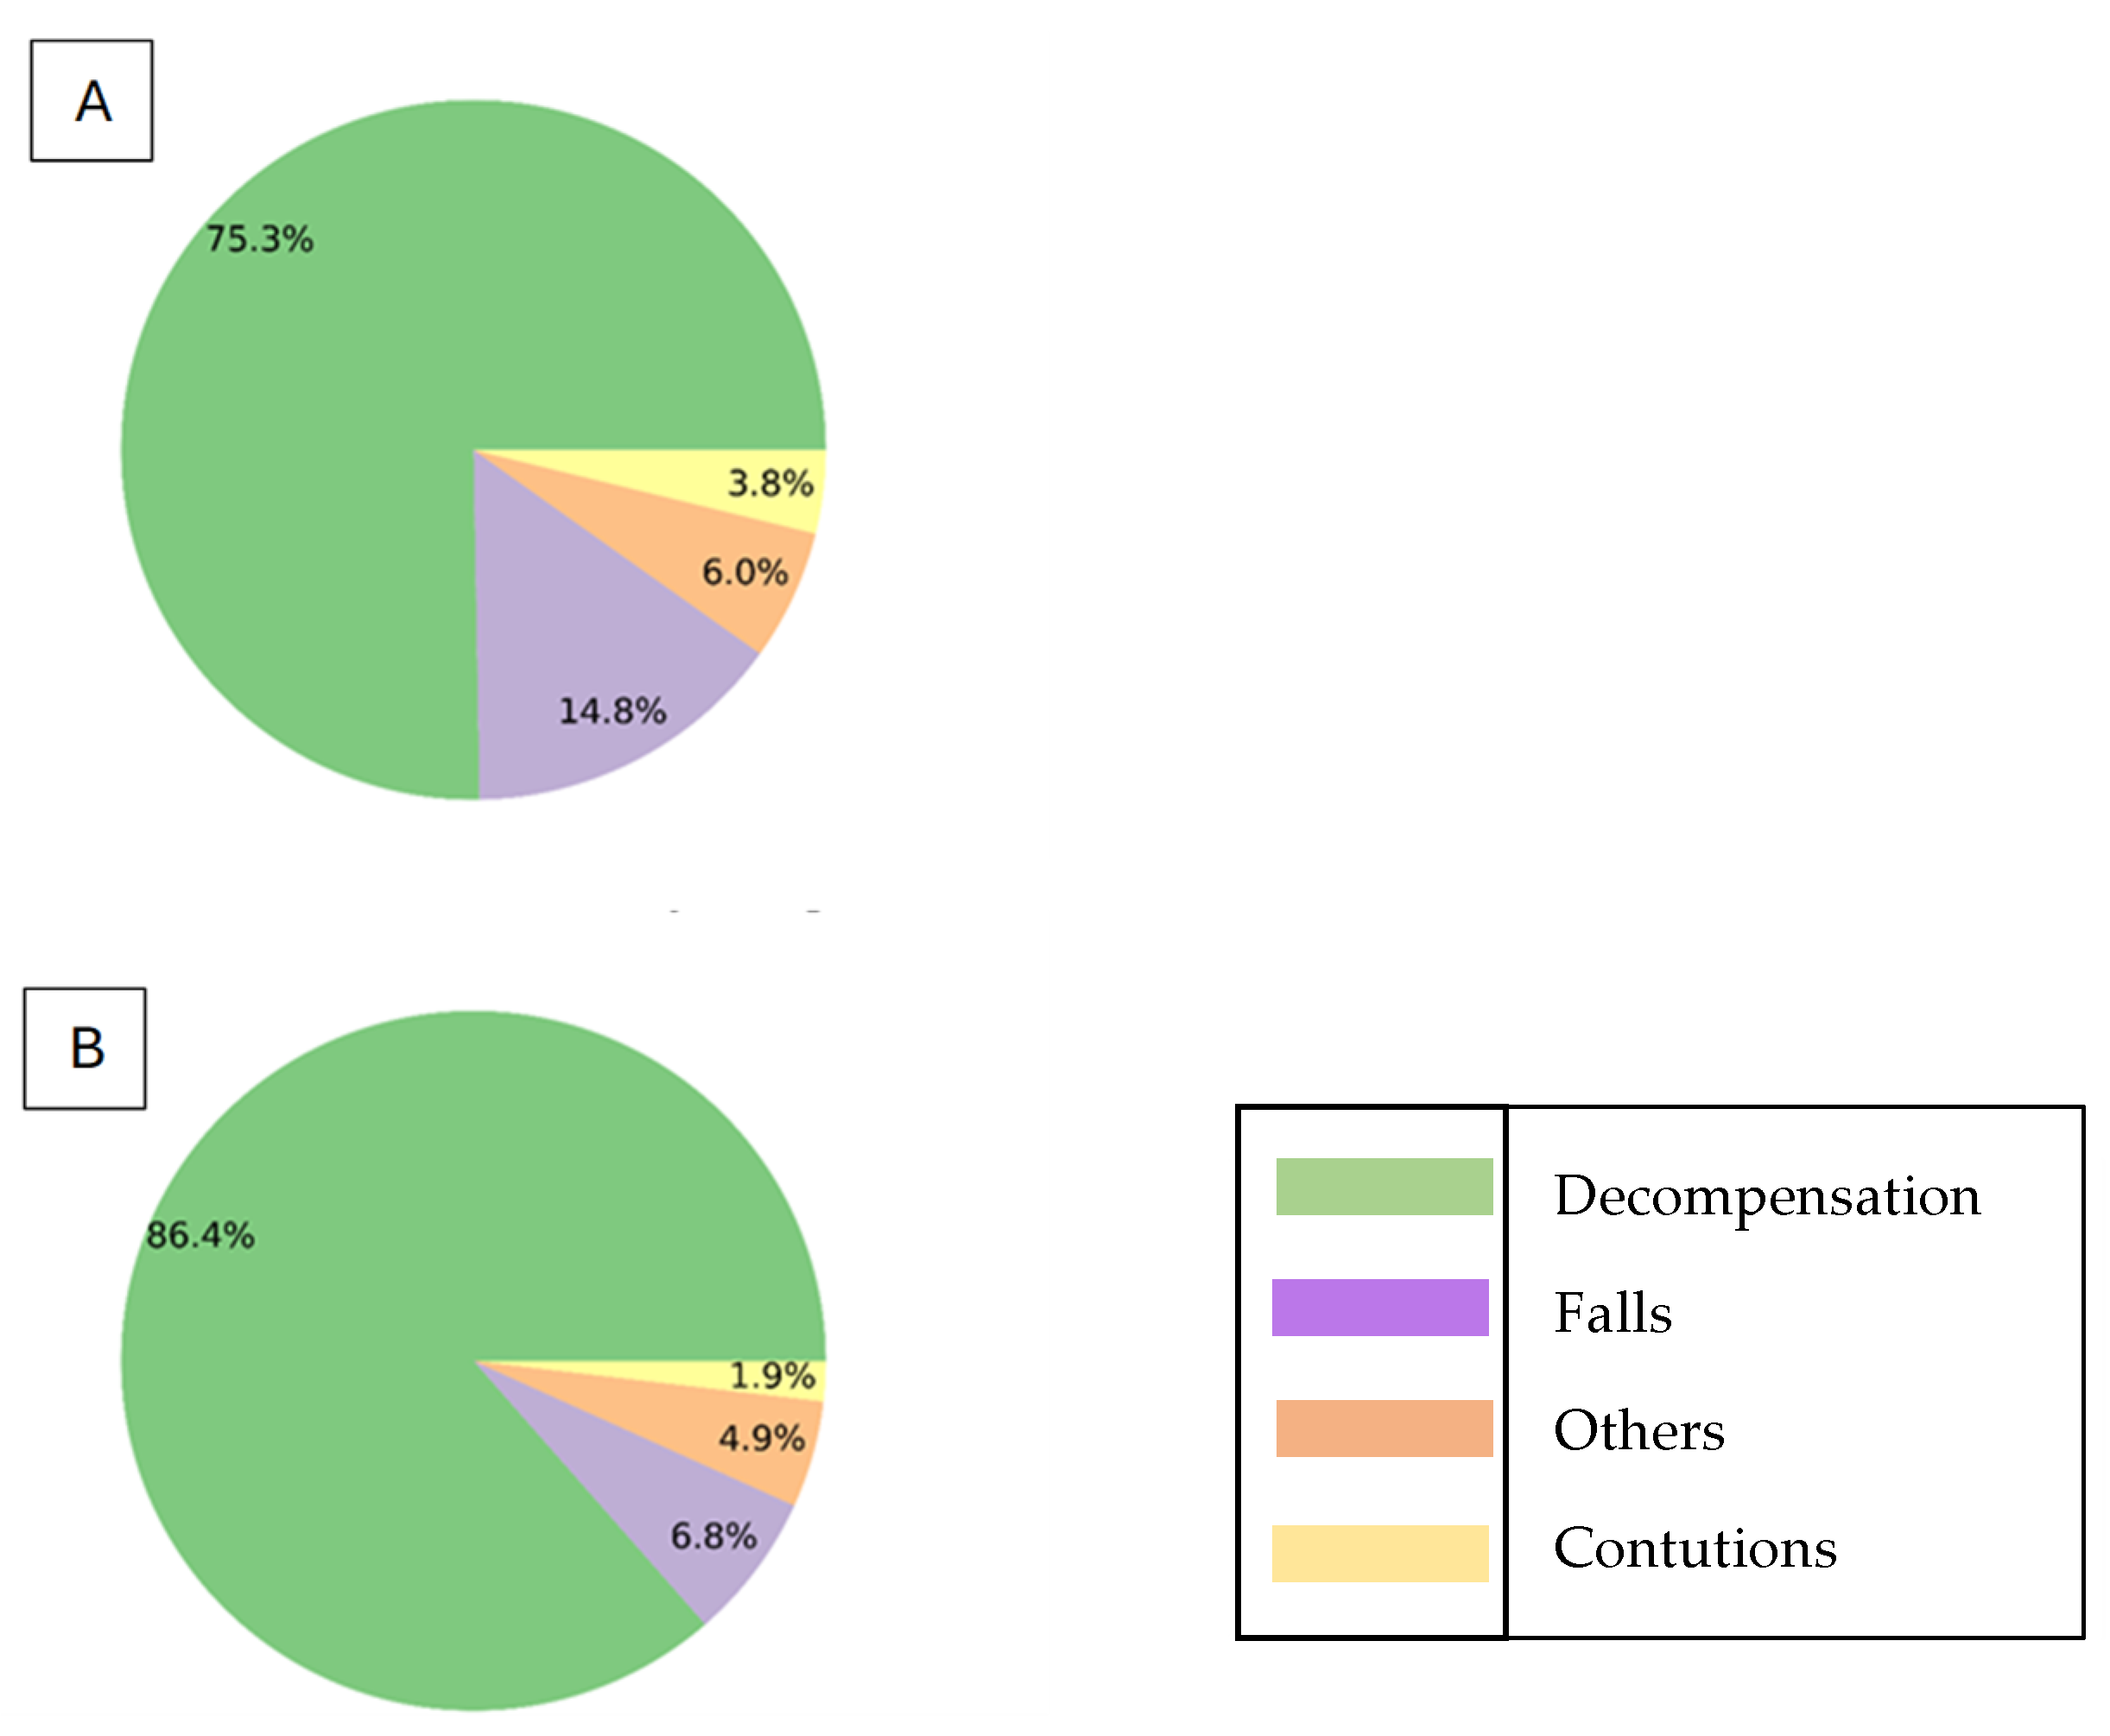
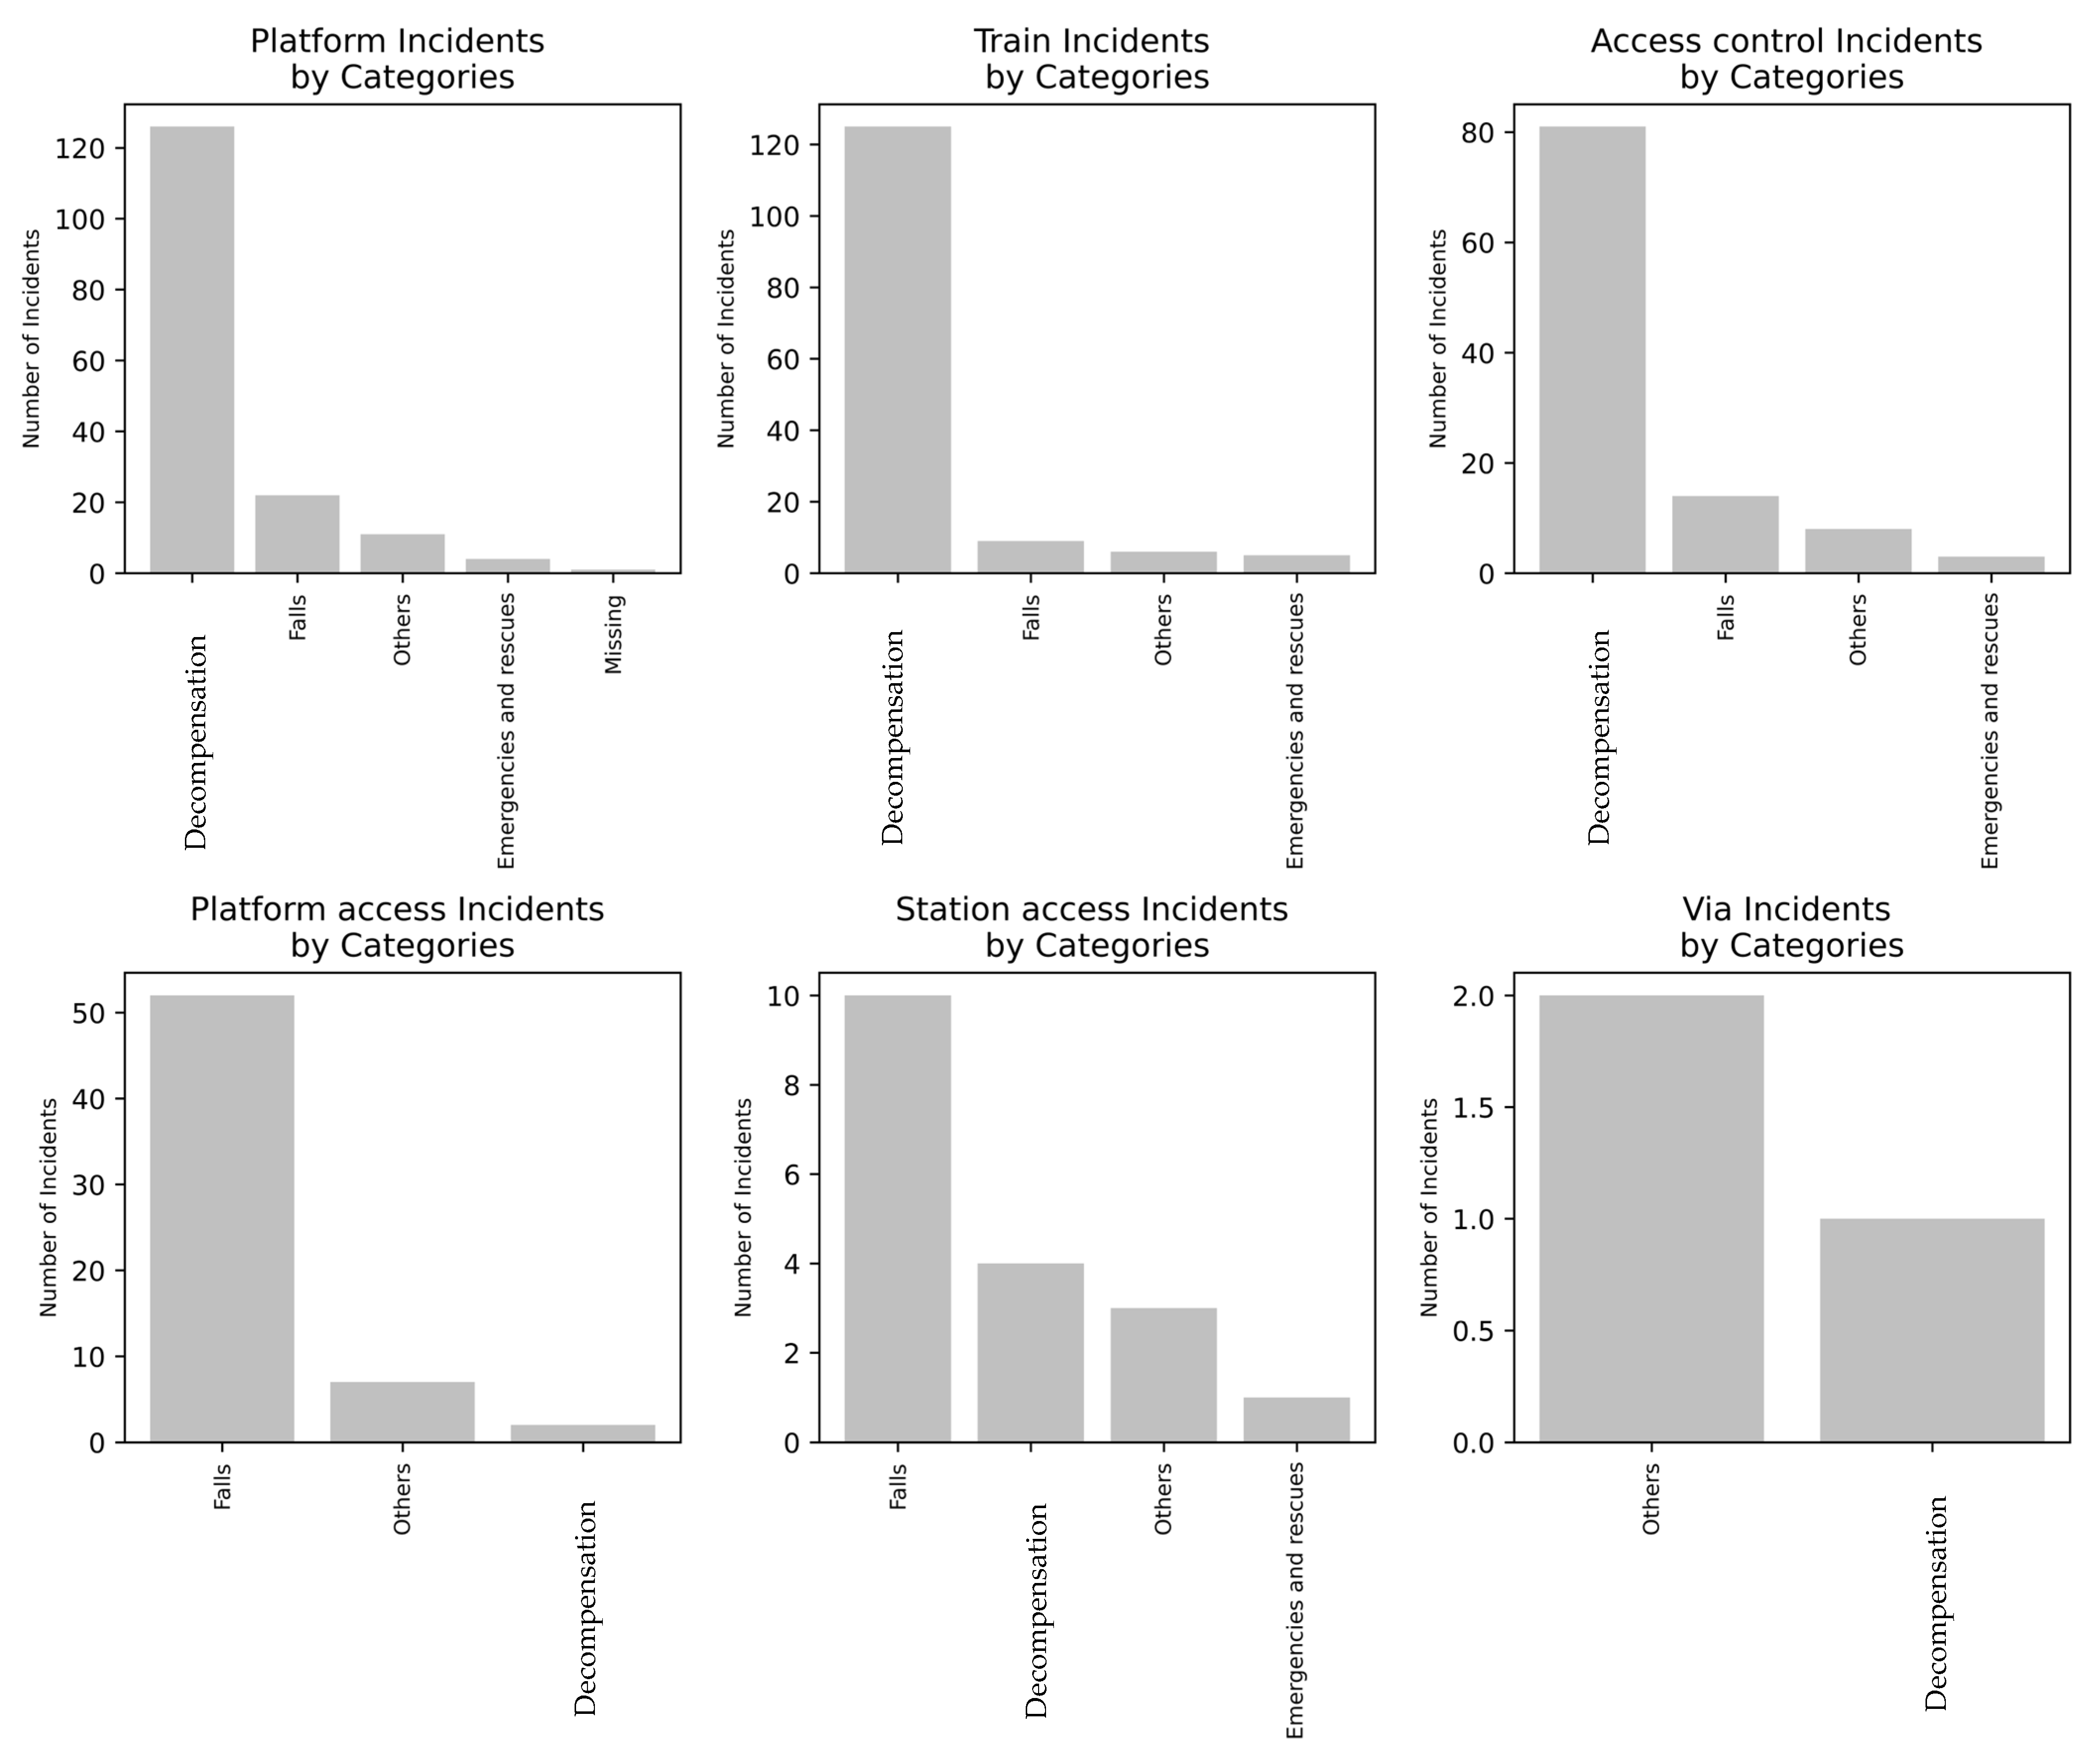
The platform–train interface (PTI) is the most critical area where a high number of incidents occur, with approximately 360 incidents recorded. Concentration on the PTI is crucial because this area represents a complex and high-risk zone where interactions between passengers and the infrastructure are particularly critical. Within this subset of incidents, the predominant categories identified were decompensations, falls, and contusions. Decompensation, which generally refers to medical emergencies or health-related incidents, was the most frequently recorded type of incident at the PTI. These incidents often involve passengers experiencing health crises, such as fainting or other acute medical conditions, exacerbated by factors such as overcrowding or inadequate ventilation.
Following decompensation, falls were the second most common type of incident, occurring when passengers lost their balance or tripped, often due to crowded conditions or obstacles on the platform or within the train. Contusions, or bruises and injuries resulting from impacts, were also noted as frequent incidents, typically occurring when passengers bumped into objects or other people in the confined space of the PTI.
The analysis also included a category labeled “Others”, which encompasses a range of less common incidents such as cuts, physical altercations between passengers, and other miscellaneous events. These are grouped together in
Figure 4, which provides a summary of incidents that do not fall into the primary categories of decompensation, falls, or contusions. By focusing on the PTI and analyzing these specific types of incidents, the study aims to identify patterns and trends that are critical for improving safety measures. Understanding the frequency and nature of these incidents can help in developing targeted interventions that address the most prevalent safety concerns and enhance overall passenger safety and comfort.
Two regression models were developed to analyze the binary variables of Incidents, using the dimensions of Flow, Climate, and Design. The logistic regression model from the Python ‘statsmodels’ library was chosen due to its ability to handle binary dependent variables, providing probabilities of occurrence for each class.
The selection of an ordinary least squares (OLS) regression model with a binary dependent variable presents robust justifications for this specific study. The OLS, interpreted as a linear probability model (LPM), offers significant practical advantages: it facilitates coefficient interpretation by directly representing probability changes, provides computational simplicity, and demonstrates robustness with small samples [
42]. The literature supports this methodological choice: Angrist and Pischke [
43] demonstrate that an LPM produces similar estimates to non-linear models in terms of marginal effects, while Beck [
44] argues that, in practical applications, predictions outside the [0, 1] range are not problematic when the primary interest lies in coefficient analysis, as is the case in this research.
In the specific context of our small sample (fewer than 500 observations), the use of OLS regression presents additional advantages. Cameron and Trivedi [
45] indicate that more complex models, such as machine learning approaches, could incur overfitting, while OLS provides more stable estimates. This advantage is amplified when working with binary regressors, where Greene [
46] has demonstrated that differences between OLS and logit/probit models tend to be minimal, with more straightforward interpretation. Although correlation analyses were conducted between dependent and independent variables for all models, variables were retained even in cases of high correlation, a decision based on the already limited dataset size and the potential loss of relevant information that their elimination could cause. From a methodological perspective, Stock and Watson [
47] maintain that when the primary objective is the analysis of causal relationships rather than prediction, OLS is sufficient, as linearity can be a reasonable approximation within certain variable ranges. These considerations substantiate the preference for OLS over machine learning models for the specific objectives of this research.
From the econometric literature, the theoretical foundation of the OLS model applied to a binary dependent variable (LPM) emerges as an application of the classical linear regression model for binary dependent variables, where the goal is to model the conditional probability of success (Y = 1). As explained by Stock and Watson [
47], the basic specification of the model is expressed as:
The theoretical foundation of this model is based on several key principles. Wooldridge [
42] emphasizes that, despite its technical limitations, the model retains the fundamental properties of the OLS estimator, where the estimated coefficients β are BLUE (Best Linear Unbiased Estimator) under the Gauss–Markov assumptions, although the binary nature of the dependent variable introduces inherent heteroskedasticity.
Cameron and Trivedi [
45] delve deeper into the theoretical basis of the LPM, pointing out that it constitutes a first-order linear approximation to any nonlinear probability model. This foundation is anchored in the Stone–Weierstrass approximation theorem, which ensures that any continuous function can be approximated by a polynomial. Within this theoretical framework, Angrist and Pischke [
43] argue that the LPM can be interpreted as the best linear approximation to the underlying conditional expectation, E[Y∣X].
Greene [
46] argues that while models like logit or probit may appear more appropriate from a theoretical perspective, the LPM has a robust theoretical basis when the primary interest lies in average marginal effects. Beck [
44] supports this position, noting that in many empirical applications, especially with fixed effects, the LPM may even be preferable to nonlinear alternatives.
To evaluate the performance of the models and compare them, metrics such as Log-Likelihood, Pseudo R-squared, AIC (Akaike Information Criterion), and BIC (Bayesian Information Criterion) were used, in addition to the statistical significance of each variable.
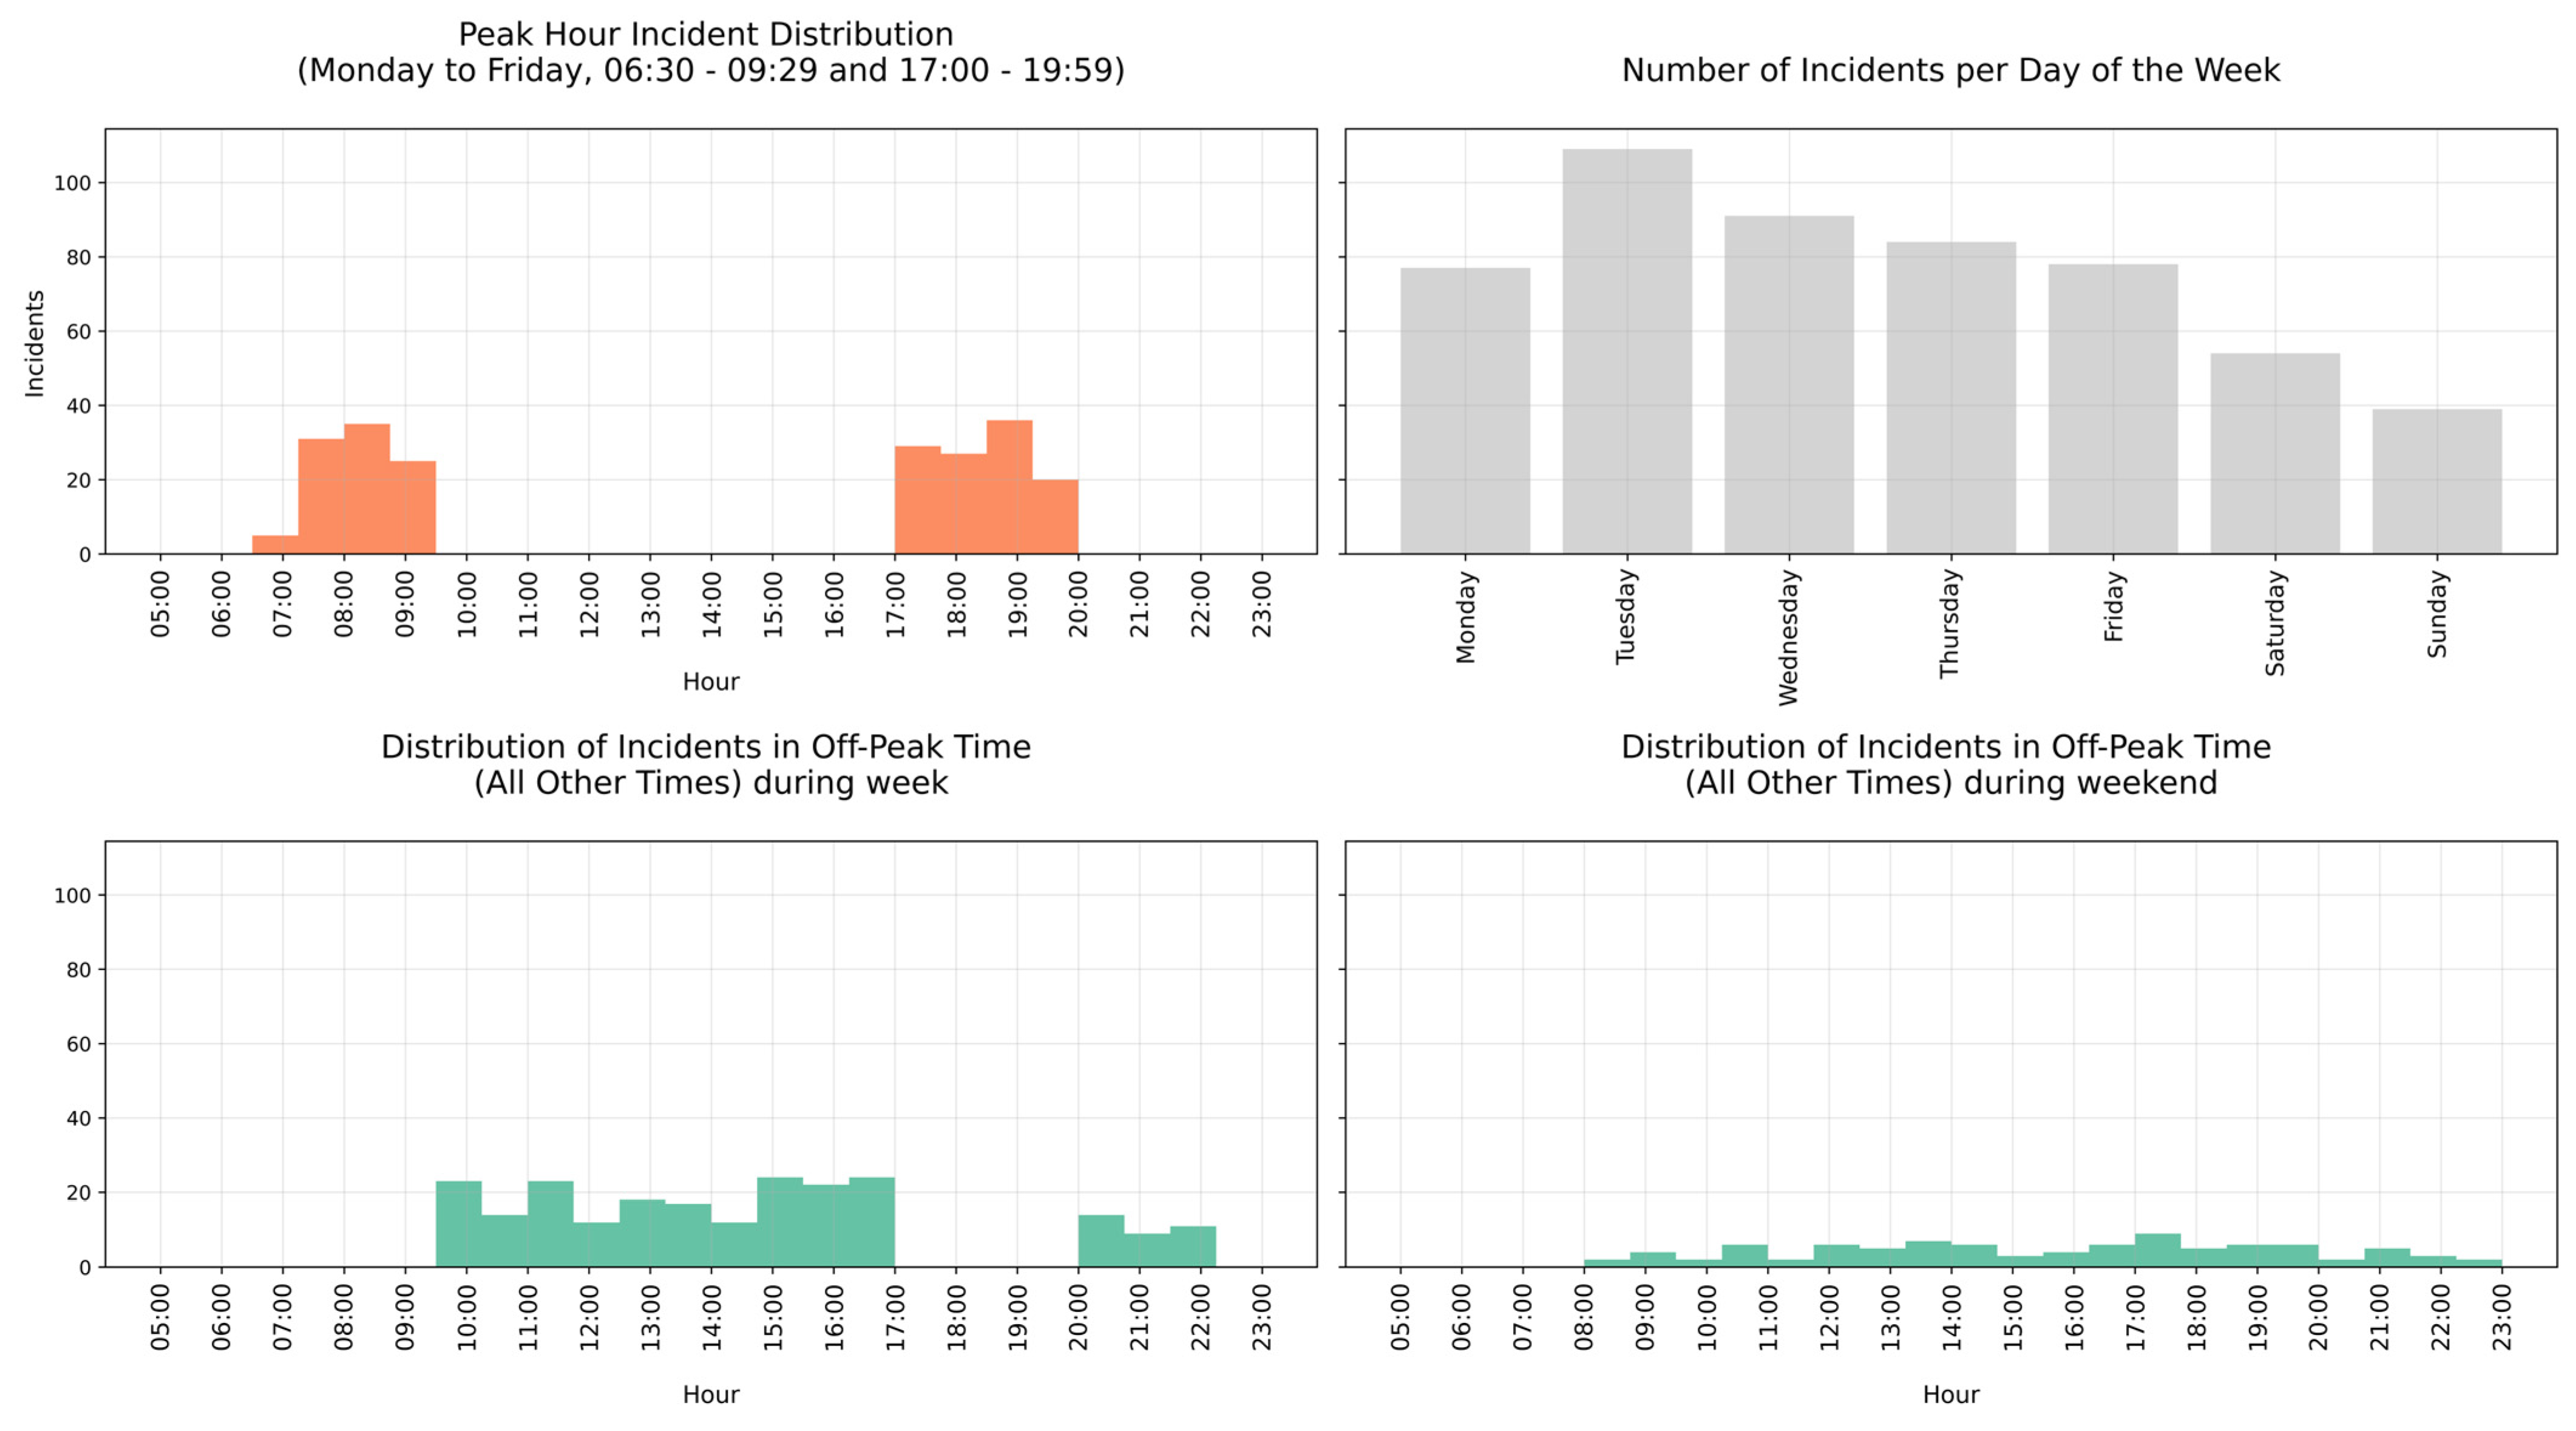
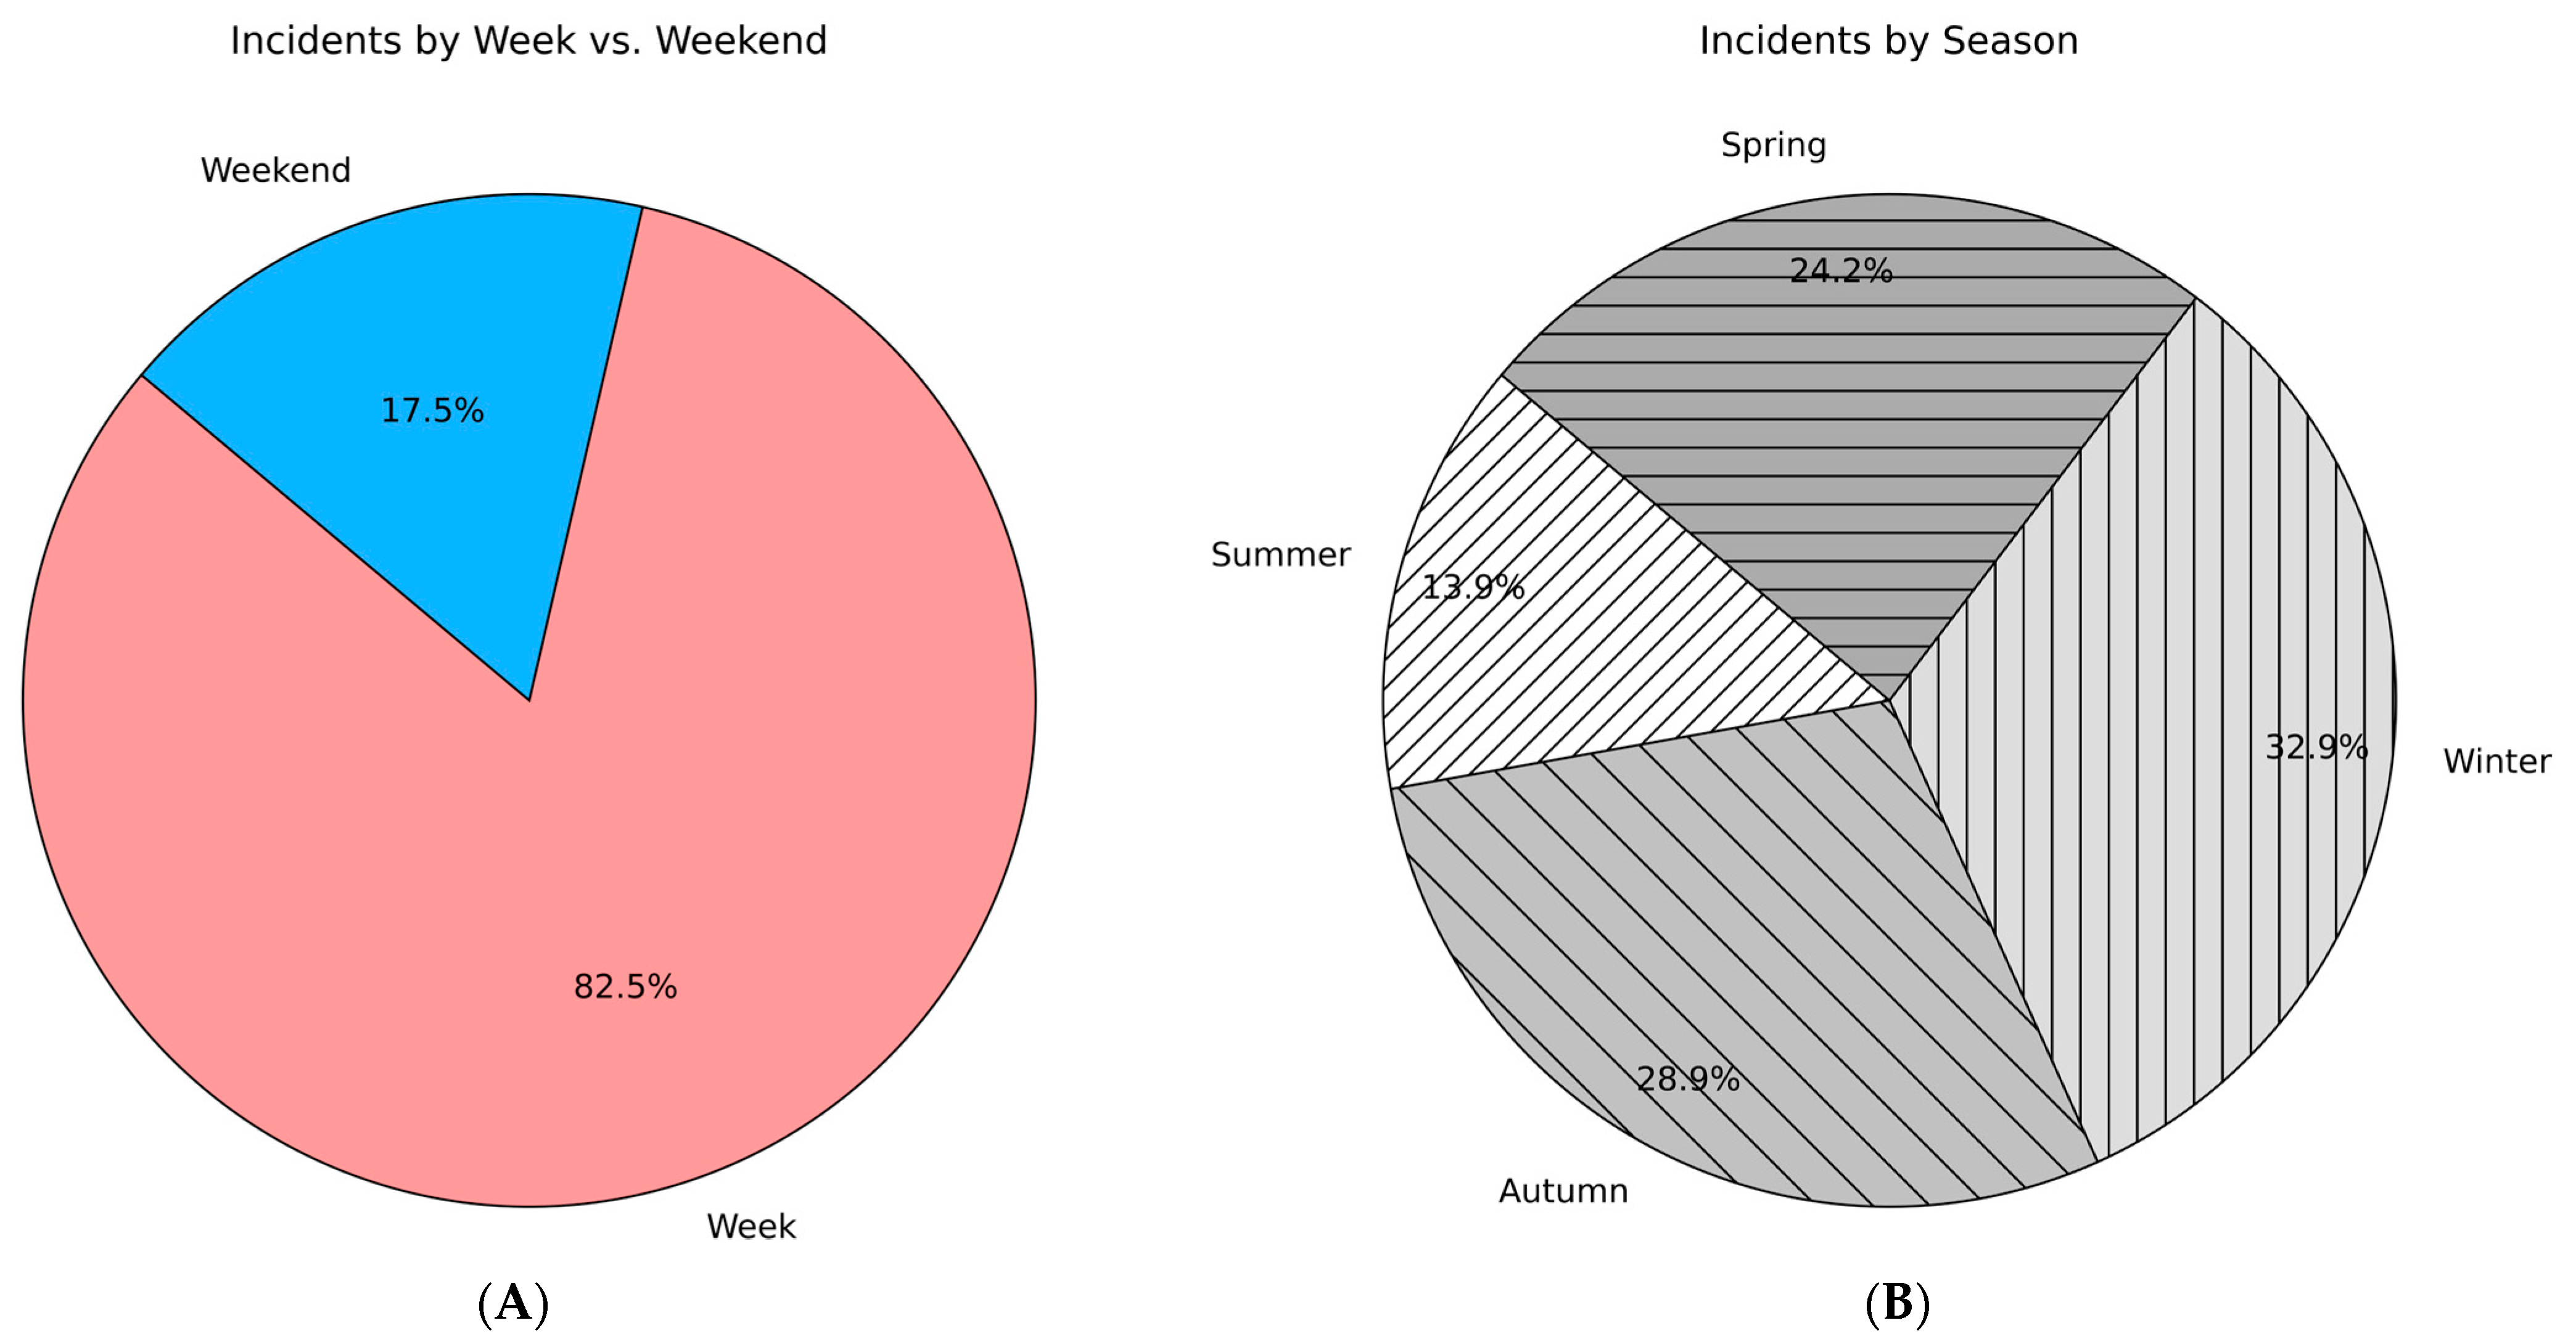
The classification of variables was carried out using Python to process the information on incidents in the Valparaíso Metro. In the Flow dimension, peak times for incidents were considered, which cover the period from Monday to Friday between 6:30 and 09:29 h, and between 17:00 and 19:59 h. Incidents that occurred outside these times were classified as off-peak. In addition, weekdays were grouped into workdays and weekends.
For the Climate dimension, incidents were grouped according to the seasons of the year, dividing the year into Warm Seasons (spring and summer) and Cold Seasons (autumn and winter).
As for the Design dimension, various aspects of the metro were considered, such as the location of the incident (Platform or Train), the type of station (Underground or Overground), and the use of stairs for access to the metro.
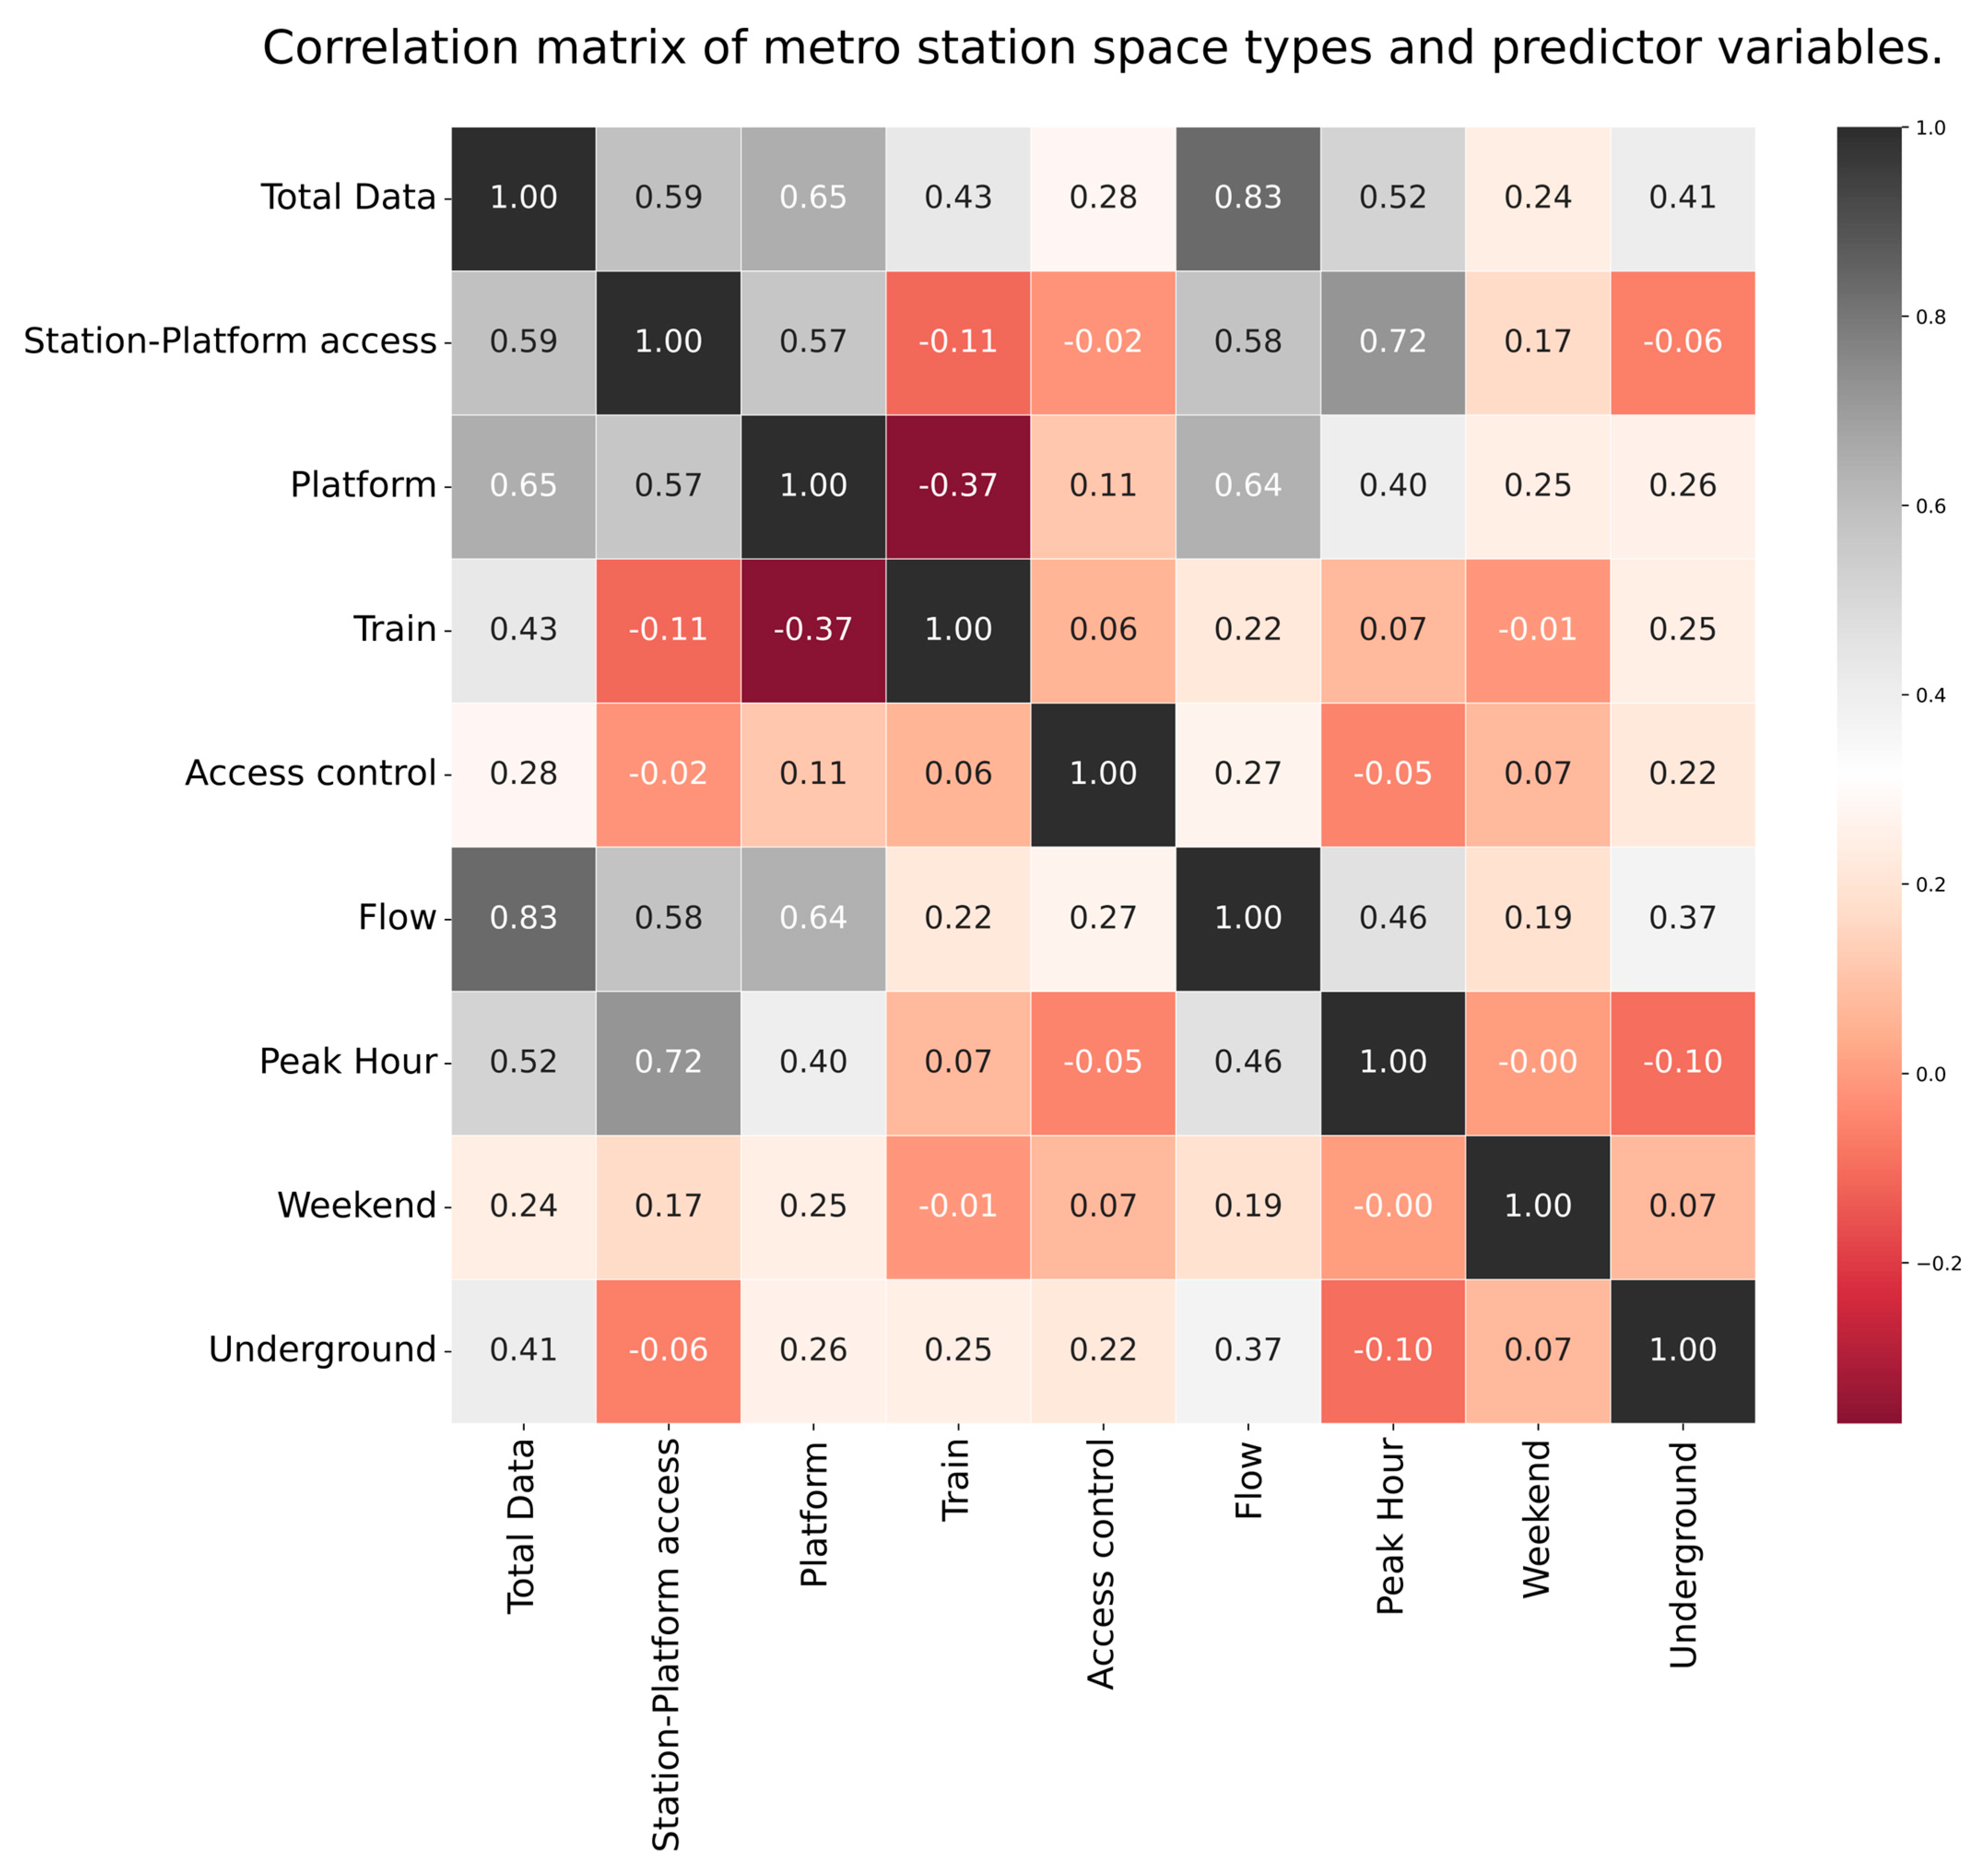
Finally, a correlation matrix was created between the variables to evaluate the possible collinearity between them.
5. Conclusions
This study conducted a thorough analysis to identify various factors that may influence the occurrence and types of incidents, such as decompensation, falls, and contusions, within the Valparaiso Metro. The incidents were specifically measured in different micromobility spaces at metro stations during the 2022–2023 period. This period of observation was chosen to capture a comprehensive view of the incident landscape, encompassing different times of the day, varying crowd densities, and seasonal changes. The platform–train interface (PTI) presented the highest number of incidents compared to other spaces. The study focused on the PTI to better understand incidents related to passenger–train interactions, particularly during boarding, alighting, and waiting on the platform.
The analysis revealed a significant relationship between various factors and the frequency of incidents, particularly during peak hours and weekdays. This correlation is largely attributed to increased crowding during these times, which raises the likelihood and severity of incidents due the higher density of passengers. For instance, during peak hours, the limited space can exacerbate situations where passengers may experience difficulties in maintaining balance or managing sudden movements. Additionally, weather conditions emerged as a significant factor influencing incident types. Specifically, warmer conditions inside the train were found to potentially increase the occurrence of decompensation, as elevated temperatures may affect passengers’ health and wellbeing, leading to incidents related to medical conditions or physical stress.
Regarding station design, the study found that specific design features of different spaces within the station were associated with incident frequency and type. Notably, the presence of stairs for accessing the station and the specific type of station—whether overground or underground—are linked to the frequency of incidents. For example, stations with multiple stairs may present additional hazards that contribute to a higher risk of falls or other incidents during boarding or alighting.
The distribution of incidents showed that decompensations were the most common type, followed by falls and contusions. Among the various stations analyzed, Quilpue station, characterized as an interior overground station, demonstrated a higher risk of incidents compared to other stations. This elevated risk could be attributed to factors specific to the station’s location, design, or passenger demographics. In other words, the high number of incidents in Quilpue may be due to the large volume of traffic the station receives, with over 1.7 million annual trips, making it the second busiest station in the metro network. Design characteristics may also play a role, as the station’s overground layout exposes passengers to environmental elements, such as unprotected platforms and turnstiles in narrow spaces. Conversely, Portales station, a coastal overground station, exhibited the lowest risk of incidents, which might be linked to its design, location, or perhaps more effective safety measures in place.
The insights gained from this analysis are valuable for practitioners and safety managers within the Valparaiso Metro system. Understanding the trends in incident occurrences and their relationship with factors such as time of day, station design, and environmental conditions can help in developing targeted safety measures.
While significant progress has been made in understanding risk factors, a gap remains in applying these analyses to specific contexts, such as Valparaíso. More comprehensive studies are needed to further enhance safety management in metro stations. Consistent with prior research, improving the design of stations, such as reducing gaps between the train and platform and enhancing accessibility features for vulnerable groups, is vital for increasing passenger safety. These findings confirm that design factors such as platform gaps, narrow areas, and station layouts can increase the risk of incidents, particularly in high-risk zones like the PTI.
As reported in the literature, metro systems are considered essential for sustainable urban development, reducing congestion and enhancing mobility, with reliability, capacity, and punctuality being key factors in addressing urban transport challenges. In this sense, safety incidents at metro stations are a significant concern, requiring an analysis of risk factors in different areas like platforms, train areas, ticket counters, and turnstiles to improve safety and efficiency. This study contributes to a more integrated framework for understanding the various factors that influence incidents, complementing other elements reported in the literature, such as disruption timing and location, human errors by traffic dispatchers, infrastructure failures, and environmental conditions. Consistent with the literature, human errors, such as signal detection failures, and infrastructure issues, such as track or power failures, are significant contributors to accidents like derailments and collisions. These areas warrant further investigation.
The model used in this study can be enhanced by integrating databases and predictive models reported in the literature to forecast delays, manage incidents, and improve safety based on factors like passenger flow, incident type, and train delays. Furthermore, passenger behaviour, including actions like failing to hold handrails or rushing, has been identified as a significant cause of accidents, especially in high-traffic areas like escalators, stairs, and turnstiles.
However, it is important to acknowledge the limitations of this study, particularly concerning the period during which it was conducted. The data collected during 2022 and 2023 may have been influenced by the unique conditions of the post-pandemic period, which significantly affected passenger behaviour, station operations, and overall incident rates. The pandemic altered many aspects of daily life, including commuting patterns, with fluctuations in ridership, changes in work habits, and varying levels of public health restrictions all potentially impacting metro usage and safety. For example, reduced ridership during certain months or changes in the typical flow of passengers could have contributed to variations in the frequency and types of incidents. Additionally, operational responses to the pandemic, such as adjustments to safety protocols, could also have influenced the observed trends.
Therefore, it is recommended to extend the framework analysis used in this study to future research in order to update and validate the incident data. By comparing the existing data with findings from new analysis periods, future studies can help clarify how these unique post-pandemic conditions have influenced the metro system’s safety. In this regard, future research should consider including additional timeframes to ensure that the findings are not limited to this specific period. Such updates would provide a more current understanding of incident trends and their contributing factors, offering a clearer picture of the evolving risks in the Valparaíso Metro system.
Continually updating the models with data from different periods would allow researchers to refine their analysis of safety patterns and incident types. This process is instrumental in identifying emerging risks or shifts in passenger behaviour that may not have been fully captured in the initial analysis. In turn, such insights would support the development of improved safety measures and risk mitigation strategies, ensuring that the Valparaíso Metro system remains adaptable to changing circumstances while effectively prioritizing passenger safety.


 ,
, 

