Abstract
Water scarcity is a critical barrier to sustainable food production and food security. To address this issue, China introduced a pilot policy for water rights trading in 2014. Using panel data from 29 provinces (cities and districts) in China from 2006 to 2022, this paper investigates the impact of the water rights trading policy on food security and explores its underlying mechanisms through the DID model. It is found that (1) the water rights trading policy substantially boosts food production in pilot areas and mitigates the effects of water scarcity on food security. (2) The water rights trading policy enhances food security by advancing water-saving irrigation technology and optimizing crop-planting structures. (3) The impact of the water rights trading policy proves more pronounced in areas with lower water use efficiency and higher food production potential. Therefore, it is recommended that the government continue advancing the water rights trading policy and adjust it dynamically based on regional differences. Additionally, strengthening guidance on water-saving irrigation technologies and optimizing cropping structures will further enhance the adaptive capacity of the agricultural system, helping to ensure food security.
1. Introduction
Food security is the fundamental basis for stable economic and social development [1]. In recent decades, climate change, rapid population growth, and accelerated urbanization have introduced unprecedented challenges to global food production and supply [2]. Under these pressures, ensuring stable, adequate, and sustainable food supplies has become a central global concern. For China, a major agricultural and populous nation [3], achieving food security is not only essential for its stability but also has profound implications for the stability of the global food system. Consequently, food security remains a key priority for policymakers within the Chinese government [4]. Historically, China has boosted the ability to produce grain by implementing several strategies, such as creating protected farmland zones, identifying key grain-producing regions, and encouraging soil enhancement efforts [5,6]. However, with the continuous increase in demand [7], climate change [8,9], and water scarcity [10], China’s food security is facing significant challenges.
Climate change alters water cycle patterns, intensifies drought frequency and severity, and creates uncertainty in water availability [11]. This intensifying water resource pressures on food production. Therefore, efficient governance and distribution of water supplies are not only essential for regional food security but are also prerequisites for sustainable agricultural production [12]. China faces severe water shortages, with per capita water resources of 1800 cubic meters—just one-fourth of the global average [13,14]. In years with typical climatic conditions, without extreme droughts or unusually high precipitation, the national water deficit is approximately 50 billion cubic meters, with around 30 billion cubic meters attributed to agriculture [15]. The shortage of water has become a principal “bottleneck” constraining China’s sustainable agricultural development and food security. In China, agricultural irrigation represents the primary consumer of water, using more than 60% of the country’s total water resources [16]. Nevertheless, the general efficiency of water utilization in agricultural irrigation across China remains low [17], despite the government’s ongoing efforts to improve it. As of 2023, the effective utilization rate of agricultural irrigation water in China stands at just 0.576, revealing a notable disparity when compared to global benchmarks. Therefore, due to the ongoing mismatch between agricultural water supply and demand, enhancing water use efficiency via conservation measures and more intensive resource utilization has become an unavoidable approach to maintaining the steady progress of agriculture and safeguarding food security [18].
Experiences from Australia and the United States show that water rights trading fosters equitable water distribution and sustainable use, alleviating pressure on agricultural water resources [19,20]. Recognizing its potential, the Chinese government has actively explored mechanisms and frameworks for water rights trading since 2005 [21]. In July 2014, the Ministry of Water Resources (MWR) initiated a nationwide pilot program on water rights trading in seven provinces, including Ningxia, Jiangxi, Hubei, Inner Mongolia, Henan, Gansu, and Guangdong [22]. Figure 1 displays the geographic distribution of the policy’s implementation. This initiative marked the beginning of a phased approach toward developing a unified national water rights trading market. According to policy plans, this market is anticipated to be completed by 2025, reflecting the gradual and adaptive nature of China’s water rights reforms.
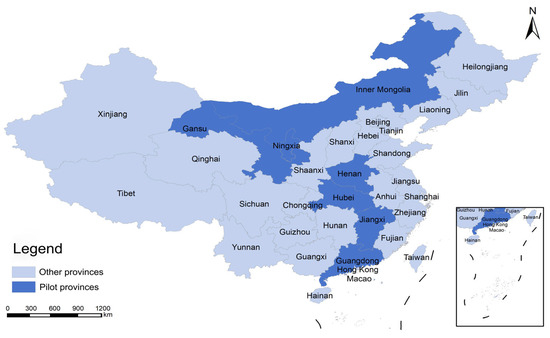
Figure 1.
Map of water rights trading pilot policies. Note: The map is derived from the standard map with review number GS (2024)0650, obtained from the China National Geographic Information Public Service Platform (https://www.tianditu.gov.cn (accessed on 19 October 2024)), and the base map has not been modified.
A key goal of the Chinese government’s experimental policy on water rights trading is to allow farmers to gain benefits from trading these rights, encouraging them to cut back on water use and thus improving the efficiency of agricultural irrigation [23]. Despite its nationwide implementation, progress in water rights trading has varied across regions due to differences in administrative capacity, economic development, and local water resource conditions. Pilot regions like Ningxia and Gansu have made significant strides in establishing trading mechanisms, while others face challenges such as limited awareness and infrastructure gaps. These regional disparities highlight the need for tailored strategies to ensure the reform’s success across diverse contexts.
Previous research has shown that trading water rights helps to optimize water resource distribution and improve irrigation efficiency in agriculture, acting as a vital tool for maintaining food security [24,25,26]. However, certain research has suggested that the trading of water rights could increase water prices [27], raise irrigation costs for farmers [28], reduce cultivation profitability [29], and discourage farmers from farming [30]. Additionally, some researchers argue that higher water prices may compel farmers to reduce their planted area for food crops in the short term and transition to higher-value cash crops to maintain their original income levels [31]. In conclusion, the question of whether water rights trading can effectively promote food security remains contentious and requires further investigation for validation. In addition, current studies have yet to explore the particular mechanisms by which water rights trading influences food security, highlighting the urgent necessity for detailed explanations based on empirical investigation.
Thus, this study seeks to explore if water rights trading policies can improve food security and clarify the mechanisms behind their effects. By focusing on pilot regions within the gradual implementation of water rights trading policies, this study provides insights into the phased development of such reforms and their implications for food security, offering valuable lessons for the future establishment of a unified national market. Accordingly, this study uses a quasi-natural experiment of water rights trading to evaluate its impact on food security through the Difference-in-Differences (DID) method, while also investigating the detailed mechanisms involved, thus overcoming the gaps in previous research. In contrast to existing studies, this paper contributes primarily in two ways: First, this study explores how water rights trading influences food security by examining water-saving irrigation technology promotion and adjustments in crop structure, thus filling the gaps in existing literature concerning mechanism analysis. Second, this research performs a thorough evaluation of the diverse impacts of the water rights trading policy from multiple viewpoints, ultimately providing recommendations for improving related policies.
2. Theoretical Foundations and Research Hypotheses
According to the Interim Measures for the Administration of Water Rights Trading (2016) issued by MWR, water rights trading refers to the reallocation of water use rights among regions, river basins, upstream and downstream areas, industries, and water users through market mechanisms. This process is grounded in the rational definition and allocation of these rights, which forms the foundation of the water rights trading policy, establishing a structured framework for addressing inefficiencies in water allocation and ensuring that limited resources flow to higher-value uses [32]. The core components of the policy include: (1) the confirmation of water use rights, establishing clear ownership and usage boundaries; and (2) the transfer of these rights, facilitated by market mechanisms such as trading. This policy enables the redistribution of water resources to meet competing demands more effectively, balancing agricultural, industrial, and ecological needs [33]. Such mechanisms ensure that water use is aligned with its economic and social value, addressing both immediate and long-term resource challenges. Under the framework of the water rights trading policy, “water rights trading” represents the practical execution of these transfers, wherein market mechanisms enable the efficient reallocation of water resources. By incorporating elements of flexibility and responsiveness to varying regional conditions, such practices not only optimize resource allocation but also support the integration of technological advancements and policy adaptations to address evolving water demands [34]. This flexibility is further reflected in the ability of water rights trading to dynamically link supply and demand, adjusting water prices to promote the efficient utilization of water resources. Therefore, the water rights trading policy provides the institutional and regulatory structure, while water rights trading serves as its operational embodiment, achieving the policy’s objectives through concrete market transactions.
The implementation of market mechanisms will lead to flexible adjustments in water prices based on the conditions of supply and demand [35]. Water rights trading directly affects agriculture by raising the opportunity cost of using water for agricultural purposes [36], a change that will significantly influence farmers’ water use decisions [37], thereby enhancing food security [38]. According to efficient allocation theory in resource economics, scarce resources should be directed to their highest-value uses to maximize overall societal welfare [39]. Water rights trading embodies this principle by ensuring that water—a finite resource—is allocated where it can generate the most value. On the one hand, water rights trading clarifies property rights and helps avoid the “tragedy of the commons” resulting from the public nature of water resources [40]. With the significant increase in the opportunity cost of water usage, farmers are likely to cut down on excessive water consumption [41], thus improving water use efficiency and optimizing the benefits of irrigation under restricted water use rights [42]. On the other hand, water rights trading facilitates the transfer of water use rights between farmers, creating a dynamic market that balances water needs. Aligned with externality theory, water rights trading internalizes the external costs associated with excessive water use, introducing economic incentives for conservation and sustainable practices [43]. Farmers with a higher endowment of water resources will conserve water as much as possible while ensuring their own needs and sell the surplus for economic gain, whereas farmers with a lower water resource endowment will purchase water to mitigate the constraints of water scarcity on their food cultivation areas [44]. Therefore, water rights trading can enable more rational irrigation practices, enhance the efficiency of agricultural water use [45], optimize water resource allocation [46], and thus contribute to increasing food production and expanding the area under cultivation, further promoting food security [47]. Drawing from the previous analysis, this study proposes the following hypothesis:
H1.
The water rights trading policy can contribute to food security.
Based on the analysis above, water rights trading will increase the opportunity cost of water use, thereby altering farmers’ water usage practices. Once agricultural irrigation water can be traded, farmers who continue to use excessive amounts of water will not only incur additional charges but also forfeit the potential revenue from selling surplus water [48]. Consequently, rational farmers may reduce excessive water use to lower irrigation costs and generate additional income [49]. This behavioral shift aligns with externality theory, which posits that market mechanisms can align individual incentives with societal goals by attributing economic value to previously unpriced environmental goods, such as water [50]. Technological advancements are crucial for reducing agricultural water consumption [51]. The increase in water costs and the revenues generated from water rights trading provide farmers with stronger incentives to adopt water-saving irrigation technologies. Water-conserving technologies, including drip and sprinkler irrigation, not only improve irrigation efficiency and lower water usage in agriculture [52,53], but also enhance crop water absorption, more effectively meeting the water requirements for food crop growth [54]. This, in turn, increases food yield per unit area and promotes food security. For this reason, this paper proposes the hypothesis:
H2.
The water rights trading policy enhances food security by encouraging the adoption of water-conserving irrigation technologies in agriculture.
An increase in the opportunity cost of water for farmers results in a corresponding rise in the costs associated with cultivating water-intensive cash crops. While some research indicates that increased water prices might compel farmers to transition to higher-value cash crops in the short term, they will also consider factors like market dynamics and policy subsidies when developing long-term strategies [55]. According to comparative advantage theory, resources should be allocated to activities yielding the highest economic return per unit used. In water rights trading, this principle translates to allocating water toward crops offering the greatest return per unit consumed [56]. If farmers expect that the marginal returns from selling saved water and cultivating low-water-consuming food crops exceed those from growing high-water-consuming cash crops, they may increase the proportion of low-water-consuming, relatively more profitable food crops in their cultivation [57,58]. This behavioral shift will expand the area devoted to food crop cultivation, increase overall food production, and consequently enhance food security. Water rights trading boosts the economic value of water while also making it more financially appealing for farmers to choose low-water-use crops, especially in areas with persistent water shortages [59]. Based on this, this paper presents the following hypothesis:
H3.
The water rights trading policy promotes food security by adjusting crop cultivation structure.
3. Data and Methods
3.1. Data Source
The data for this research are sourced from the official website of the National Bureau of Statistics of China, the China Statistical Yearbook, and the China Rural Statistical Yearbook. This study focuses on provinces participating in China’s water rights trading pilot program initiated in 2014. These regions, including Ningxia, Gansu, and Guangdong, are not only representative of China’s varied climatic, agricultural, and economic conditions but also serve as key testing grounds for water rights trading policies. Analyzing these regions allows for a robust assessment of the policy’s impact while capturing the diverse outcomes across different environmental and institutional contexts. In order to guarantee the temporal consistency of the variable data, this study selects relevant data from 29 provinces (cities and districts) in China for the period from 2006 to 2022 as the research sample. Rice, corn, and wheat are the three primary grains essential for ensuring global food security [60]. Based on data from the China Rural Statistical Yearbook, rice production in Qinghai Province is zero, with the total output of the three major staple grains—rice, corn, and wheat—accounting for approximately 0.12% of the national total. In Hainan Province, wheat production is zero, and corn production has also been zero since 2014, with the total output of the three major staple grains accounting for approximately 0.2% of the national total. Given the extremely low production of the three major staple crops in both Hainan and Qinghai provinces, the data from these provinces lack representativeness. To enhance the authenticity, accuracy, and validity of the research findings, this study excludes data from Hainan and Qinghai provinces and ultimately utilizes panel data from 29 provinces (cities and districts). Furthermore, missing data for some indicators in particular years were handled through interpolation, yielding a total of 493 observations.
3.2. Variable Setting and Descriptive Statistics
Dependent Variable. Food security is considered the dependent variable. Food security is defined as the physical and economic access of all individuals, at all times, to sufficient, safe, and nutritious food that meets their dietary needs and food preferences for a healthy and active life (FAO). Based on this definition and the practices observed in related studies [61,62], this paper employs total food production, yield per unit area, and food production per capita as indicators of food security.
Independent Variables. The water rights trading policy (WRTP) is the core explanatory variable of this study. The WRTP is defined as the interaction between two dummy variables: (1) “treat” which equals 1 if province (or city/district) i is part of the water rights trading pilot, and 0 otherwise; and (2) “post” which equals 1 for the years after the water rights trading pilot started, and 0 otherwise. This interaction is expressed as WRTP = treat × post, where WRTP equals 1 if province i is part of the pilot in year t; otherwise, it equals 0. The seven pilot water rights trading provinces—Ningxia, Jiangxi, Hubei, Inner Mongolia, Henan, Gansu, and Guangdong—are designated as the experimental group, while the remaining provinces serve as the control group.
Mediating Variables. The main mechanisms by which the water rights trading policy impacts food security include the adoption of water-efficient irrigation techniques and the modification of crop-planting patterns. The direct effect of applying water-saving irrigation technology results in an increased area dedicated to such irrigation [63]. Therefore, this study adopts the proportion of land using water-efficient irrigation compared to the total cultivated area as an indicator of the application of water-saving irrigation technologies. The modification of crop-planting patterns is mainly demonstrated by the increase in areas dedicated to low-water-use food crops and the decrease in land assigned to high-water-demanding cash crops. Consequently, the crop-planting pattern is measured by the proportion of land allocated to food crops relative to the total cultivated area.
Control Variables. This study, drawing upon prior research [64], selects effective irrigation rate, fertilizer input, machinery input, labor input, financial support for agricultural inputs, and the degree of disaster as control variables. Including these variables helps control for confounding factors and improves analysis robustness. The definitions and descriptive statistics of the primary variables are presented in Table 1.

Table 1.
Meaning of main variables and results of descriptive statistical analysis.
Several variables in this study, such as total grain yield (TGY), grain yield per unit area (GYUA), grain yield per capita (GYPC), fertilizer inputs (FIs), machinery inputs (MIs), labor inputs (LIs), and financial support to agriculture (FSA), are expressed in their natural logarithmic form. This transformation is commonly applied to stabilize variance, reduce skewness, and facilitate the interpretation of coefficients as elasticities in regression analysis [65]. For example, taking the natural logarithm of grain yield per capita allows us to interpret the impact of explanatory variables in percentage terms. Similarly, the logarithmic transformation of inputs like fertilizer and labor reflects their diminishing marginal returns in agricultural production [66].
3.3. Model Setting
The DID model represents a widely used approach for assessing the impacts of policy interventions by merging cross-sectional and temporal variations, while also including control variables to adjust for confounding factors [67]. This study employs the DID approach for several reasons. First, the staggered implementation of water rights trading policies across different provinces provides a quasi-natural experimental setting, making DID a suitable method for identifying causal effects [68]. Second, the DID model effectively controls for unobservable regional characteristics and time trends, ensuring that the estimated impacts reflect the net effect of the policy rather than confounding factors [69]. Finally, this approach is well-suited for policy evaluations in resource management and environmental governance [70]. Therefore, this study utilizes the DID approach to analyze the effects of the water rights trading policy on food security, with the model defined as follows:
where i denotes the province (city, district) in China, and t signifies the year. FSit serves as the dependent variable, representing the food security condition of the province (city, district), or district i during year t. In this paper, total grain output, grain yield per unit area, and per capita grain output are used as indicators to measure food security. WRTPit is the core explanatory variable, denoting whether province, city, or district i belongs to the water rights trading area in year t. Given the experimental nature of the water rights trading policies, the Difference-in-Differences (DID) approach is particularly suitable for this analysis. Pilot provinces such as Ningxia and Gansu, where water scarcity is severe and agricultural irrigation heavily depends on efficient water management, provide an ideal context to study the causal effects of water rights trading on food security. Furthermore, the inclusion of non-pilot provinces as a control group strengthens the robustness of the analysis by enabling direct comparisons across regions. Meanwhile, to account for other external factors that may influence food security, control variables, denoted as Xit, are introduced into the model. μt denotes the time-fixed effect, λi denotes the region-fixed effect, and εit is the random error term. β1 is the key estimation parameter in this paper, used to measure the net effect of the water rights trading policy on regional food security. If the estimated value of β1 is higher than 0, this indicates that water rights trading has a beneficial effect on food security in pilot provinces compared to non-pilot regions.
FSit = β0 + β1WRTPit + β2Xit + μt + λi + εit
4. Empirical Analysis and Results
This study seeks to evaluate how the water rights trading policy impacts food security using a DID model, with a focus on its influence on total grain production, grain yield per hectare, and per capita grain output. To achieve this objective, a DID model was employed to analyze grain production data before and after the policy implementation, controlling for several potential influencing factors. Next, the empirical findings and interpretations reveal potential benefits of water rights trading for grain production with varying impacts across regions.
4.1. Benchmark Regression Analysis of Water Rights Trading on Food Security
To evaluate the impact of the water rights trading policy on food security, this study utilizes a baseline regression analysis with a two-way fixed effects model, accounting for both provincial and yearly heterogeneity to control for temporal and regional variations. This model facilitates the exclusion of external factors that could influence food security, thereby allowing for a precise estimation of the real impacts of the water rights trading policy. Table 2 presents the benchmark regression results, providing a detailed examination of the impact of water rights trading policies on food production across various dimensions. Column (1) of Table 2 analyzes the effects of the water rights trading policy on total food production. The regression results indicate a significantly positive coefficient (at the 5% level) for pilot water rights trading, suggesting that this policy’s implementation has raised total food production by 12.86% after controlling for other factors. This result tentatively supports the hypothesis that the water rights trading policy positively affects food production. Columns (2) and (3) additionally present regression findings on the policy’s impact on grain yield per unit area and per capita grain production. The analysis reveals that all water rights trading coefficients are significantly positive at the 5% level, supporting the robustness of Table 2 and affirming that this policy bolsters food security.
Table 2.
Benchmark regression results of water rights trading on food security.
In addition to the core variables, the significance and coefficients of the other variables presented in Table 2 also carry economic relevance. The coefficient for fertilizer input is significantly positive at the 1% level, suggesting that fertilizer use is essential for boosting food production. The degree of disaster has a significantly negative effect, indicating that natural disasters significantly impede food production. Labor inputs show a positive correlation with total grain production and yields, indicating that labor input positively affects grain production.
In summary, the findings suggest that water rights trading positively impacts food production and supports national food security.
4.2. Parallel Trend Test
To verify that the parallel trend assumption of the water rights trading policy holds, meaning there are no significant differences between the experimental and control groups before the policy is implemented, this paper conducts a parallel trend test. Additionally, the study examines the dynamic economic impacts on food security in the periods following the policy’s implementation. Specifically, this paper uses the current period of the policy as the baseline. To address the issue of sparsity in observations for extreme time periods, results for periods earlier than −7 are grouped into period −7, while results for periods later than +7 are grouped into period +7. This approach ensures that statistical inference remains robust and does not change the overall results or their interpretation. The results are presented in Figure 2.
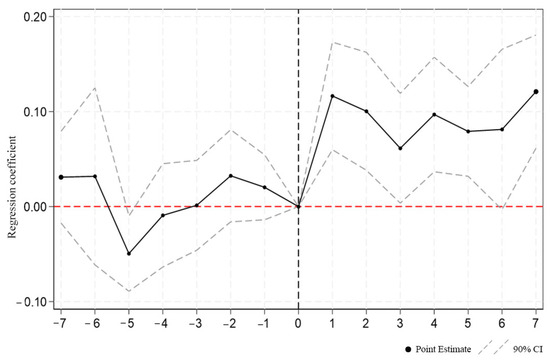
Figure 2.
Parallel trend test results of total grain yield.
Before the water rights trading policy was implemented, the coefficients of the core explanatory variables fluctuated around 0, with confidence intervals covering the y = 0 axis. However, after the policy came into effect, from the very first period, the core explanatory variables showed a significantly positive impact on total grain output. Moreover, their coefficients increased steadily over time. This suggests that pilot water rights trading exerts a profound and enduring impact on total grain production growth.
Figure 3 illustrates how the water rights trading pilot affects grain yield per unit area. Prior to policy implementation, the confidence intervals largely included the y = 0 axis. After implementation, however, the core explanatory variable coefficients rose significantly above 0, suggesting a lasting, positive impact of water rights trading on grain yield growth per unit area.
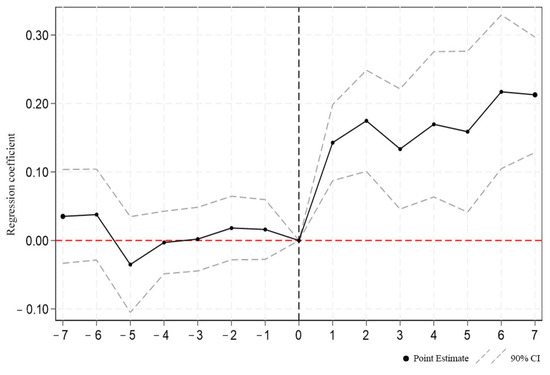
Figure 3.
Parallel trend test results of grain yield per unit area.
Figure 4 demonstrates the effect of the water rights trading pilot on per capita grain production. Before the pilot policy was implemented, the confidence intervals covered the y = 0 axis. However, after the pilot, the coefficients of the core explanatory variables were significantly above 0. This suggests that the water rights trading policy has a sustained and significant positive influence on the growth of per capita grain production.
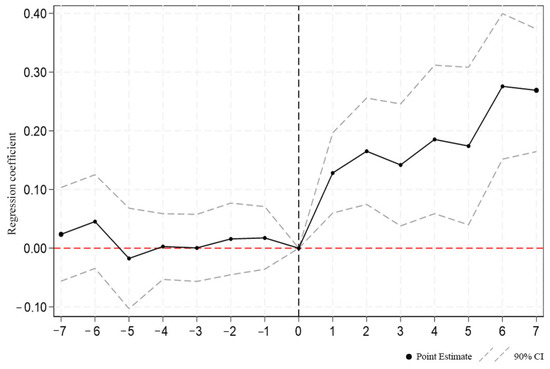
Figure 4.
Parallel trend test results of grain yield per capita.
4.3. Placebo Testing
To rule out potential influences from additional factors arising during water rights trading policy implementation, this paper conducts a placebo test. Figure 5, Figure 6 and Figure 7 present the results of the placebo test for total grain production, yield per unit area, and per capita grain production, obtained through 500 random simulations of the implementation of the water rights trading policy. The solid line in the figures represents the density distribution of the estimated coefficients, exhibiting the typical characteristics of a normal distribution, centered around 0, with a relatively symmetric shape. The scattered points represent the p-values from each simulation. It is important to note that the vertical dashed line on the right side of the figures denotes the actual policy effect coefficients obtained from the main regression.
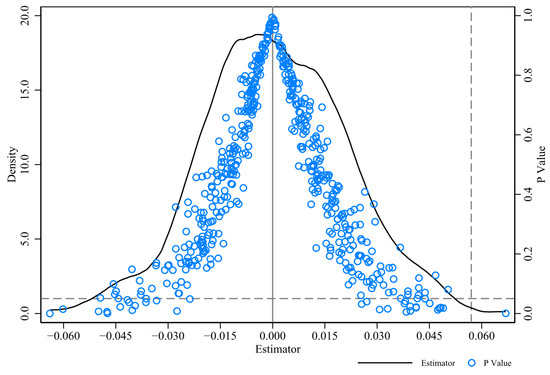
Figure 5.
Placebo test results for total grain production.
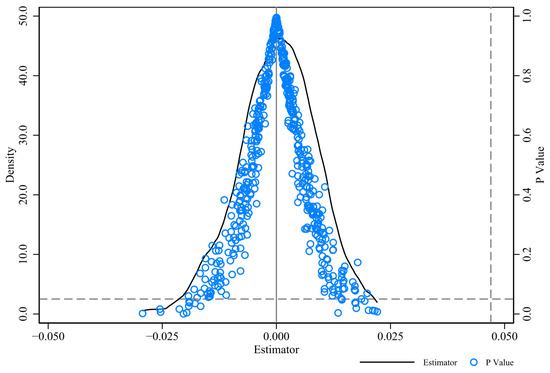
Figure 6.
Placebo test results for grain yield per unit area.
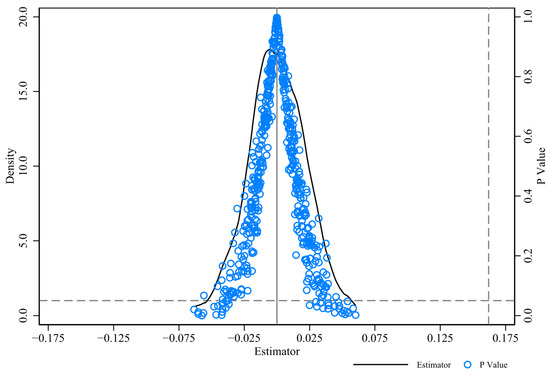
Figure 7.
Placebo test results for food production per capita.
This distributional characteristic indicates that, under a randomized assignment of policy pilots, the impacts on total grain production, yield per unit area, and per capita grain production are predominantly concentrated around 0, while the observed policy effects (right dashed line) clearly diverge from this random distribution, residing in the right tail. This result strongly indicates the significance and non-random nature of the actual policy effects.
Additionally, the majority of the p-values are distributed above 0.05 (above the horizontal dashed line), suggesting that the vast majority of simulations lack statistical significance under random assignment. This finding reinforces the conclusion that observed policy effects are genuine impacts of water rights trading rather than coincidences. The placebo test results effectively remove spurious correlations from unobserved factors or randomness, thus strengthening the study’s credibility.
4.4. Robustness Analyses
4.4.1. Adjusting the Policy Timing
This paper focuses on the pilot water rights trading policy initiated in the second half of 2014. In the benchmark regression analysis, this paper establishes 2014 as the starting year for the policy pilot, with the experimental period extending from 2014 to 2022. Given that the policy was implemented in the latter half of 2014, this paper conducts a robustness test by adjusting the policy pilot to the year following the issuance of the policy document, namely 2015. Therefore, in this robustness test, the experimental period is redefined as spanning from 2015 to 2022.
Table 3 displays the time-adjusted regression results, showing that water rights trading continues to have a significantly positive effect on food security in pilot areas at the 5% level, even after policy timing adjustments. This indicates that the water rights trading policy significantly enhances food security in the pilot regions, regardless of whether 2014 or 2015 is considered the starting year for the policy. This robustness test eliminates potential bias arising from the selection of the policy implementation timing, thereby enhancing the reliability of the study’s conclusions.
Table 3.
Robustness analysis results for policy change timing.
4.4.2. Excluding Anticipated Policy Effects
To comprehensively evaluate the actual effects of the water rights trading policy, this paper also considers the potential impact of governmental expectations before and after the policy’s formulation and implementation on the study results. To achieve this, the paper introduces a new interaction term in the model, specifically the interaction between the water rights trading policy dummy variable and the dummy variable representing the year prior to the policy’s formulation. This approach captures the anticipated effects that may arise between the announcement of the policy and its formal implementation. Table 4 presents the regression results of this expanded model.
Table 4.
Robustness analysis results excluding policy expectations.
Notably, even after accounting for governmental expectations, the effect of water rights trading on water use efficiency in the pilot region remains a significant positive effect at the 5% level. This finding not only mitigates the potential bias introduced by governmental expectations but also reinforces the previous findings of this study. This indicates that the policy pilot itself continues to effectively promote water use efficiency in the pilot region, even after accounting for potential behavioral changes triggered by the policy announcement.
4.5. Mechanisms Analysis
The benchmark regression model supports the hypothesis that water rights trading enhances food security, though its underlying mechanisms warrant further investigation. According to Hypothesis H2 and Hypothesis H3, the impact mechanisms of the water rights trading policy on food security manifest in two aspects: the application of water-saving irrigation technology and the adjustment of crop-planting structures.
To validate the aforementioned research hypotheses, this paper adopts the mediating effect analysis proposed by Ting JIANG in the context of causal inference studies [71]. The causal relationship between the selected mediating variables and the dependent variable “food security” has been discussed in the section on “Theoretical Foundation and Research Hypotheses”. To avoid redundancy, we will now focus on the effect of the explanatory variable “water rights trading policy” on the mediating variables.
Consequently, a mediation effect model is constructed based on Equation (1) to analyze the mechanism by which the water rights trading affects food security. The specific model setup is as follows:
Mit = α0 + α1WRTPit + α2Xit + μt + λi + εit
In this context, Mit represents the mediating variables, which include the application of water-saving irrigation technology and the adjustment of crop-planting structures, while the meanings of the other symbols remain consistent with those in Equation (1). The results of the mediation effect analysis are presented in Table 5.
Table 5.
Mechanism test results.
Column (1) indicates that the water rights trading policy has a significant positive effect on the application of water-saving irrigation technology, with a coefficient of 0.0762 and significance at the 5% level. This suggests that the water rights trading policy enhances water use efficiency and creates more favorable conditions for food crop cultivation by promoting advancements in irrigation technology.
Column (2) reveals that the effect of the water rights trading policy on the proportion of sown area dedicated to food crops is significantly positive at the 1% level, with a coefficient of 6.4244. This indicates that the implementation of the pilot water rights trading policy has significantly increased the proportion of food crops cultivated.
This finding has multiple implications, indicating that the water rights trading policy not only fosters advancements in agricultural production technology but also influences farmers’ crop choices.
4.6. Heterogeneity Analysis
This paper also employs group regression analysis to examine the heterogeneity of the effects of the water rights trading policy resulting from differences in food production zones, levels of economic development, policy pilot regions, and types of policy pilots.
4.6.1. Heterogeneity Test Based on Differences in Grain Production Zones
Based on the classification criteria established in the State Council’s Guidelines on Establishing Functional Areas for Grain Production and Important Agricultural Products Production Protection Areas (2017), this paper designates the 13 provinces of Heilongjiang, Henan, Shandong, Sichuan, Jiangsu, Hebei, Jilin, Anhui, Hunan, Hubei, Inner Mongolia, Jiangxi, and Liaoning as major grain production zones and subsequently divides the samples into two groups: major production zones (MPZ) and non-major production zones (NMPZ) for comparative analysis. The heterogeneity results presented in Table 6 reveal that the water rights trading policy has significantly different effects on these two types of regions. For non-major producing areas, the water rights trading policy has a significant positive impact on total grain production, grain production per unit area, and per capita grain production, with the impacts on total grain production and per capita grain production significant at the 5% level, and the impact on grain production per unit area significant at the 1% level. In contrast, the impact of the water rights trading policy on the major production areas is not statistically significant. This differential impact underscores the evident heterogeneity in the policy’s effects across different regions.
Table 6.
Heterogeneity test results based on differences in grain production zones.
Several factors may account for this result: First, the food production base in non-major producing areas is relatively underdeveloped, and water use efficiency is low, creating greater potential for improvement through the water rights trading policy. Conversely, major producing areas may have already implemented more advanced agricultural techniques and water management practices, resulting in a relatively small marginal effect of the water rights trading policy. Second, non-major producing areas may exhibit a more proactive response to the policy, optimizing water allocation through trading to enhance food production. Lastly, major producing areas, as the core regions of food production, may encounter greater policy constraints and production pressures, thereby restricting the effectiveness of the water rights trading policy.
4.6.2. Heterogeneity Test Based on Differences in Economic Development Levels
This paper divides the sample into two groups based on the mean value of real GDP per capita in each region: regions with economic development levels below the mean (LED) and those with levels above it (HED). This grouping method aims to capture the impact of differences in economic development levels on the effects of water rights trading policies.
The heterogeneity results presented in Table 7 indicate that the water rights trading policy has a significant impact across regions with varying levels of economic development, though the magnitude of the effect differs. In regions with lower levels of economic development, the water rights trading policy exerts a significant positive effect on total food production, food production per unit area, and per capita food production, resulting in increases of 13.39%, 5.92%, and 17.58%, respectively. In regions with higher levels of economic development, the water rights trading policy similarly has a significant positive effect on total food production and per capita food production, which increase by 11.80% and 14.19%, respectively; however, its effect on food production per unit area is not statistically significant. This result indicates that the water rights trading policy may yield more comprehensive and significant effects in regions with lower economic development levels.
Table 7.
Heterogeneity test results based on differences in economic development levels.
The observed results may be due to a combination of factors: First, regions with lower economic development levels may have greater potential for improvement in water management and utilization efficiency, making the benefits of the water rights trading policy more pronounced. Second, these regions may respond more actively to and implement water rights trading policies, viewing them as vital means to promote economic development and agricultural modernization. Lastly, regions with higher economic development levels may have already implemented more advanced water management practices, resulting in relatively small marginal effects of the water rights trading policy.
4.6.3. Heterogeneity Test Based on Regional Differences in Policy Pilots
Among the seven pilot provinces for water rights trading, there are three provinces in the western region (Inner Mongolia, Gansu, and Ningxia), three in the central region (Henan, Jiangxi, and Hubei), and one in the eastern region (Guangdong). Considering the unique geographic environment, climatic conditions, and economic development levels in China’s western region, this study divides the sample into two groups, western (WR) and non-western regions (NWR), for comparative analysis. This classification is driven by the fact that western regions face more severe water scarcity and generally lower levels of economic development compared to other regions. These distinctive characteristics make western regions particularly relevant for evaluating the impacts of water rights trading policies. In contrast, non-western regions, with better water resource conditions and higher levels of economic development, serve as a valuable comparison group to assess heterogeneity in policy effects.
The heterogeneity results presented in Table 8 reveal that the water rights trading policy has significantly different impacts in western and non-western regions. In the western region, the water rights trading policy pilot has significant positive effects on total grain production, grain production per unit area, and per capita grain production, all of which are statistically significant at the 1% level. Specifically, the pilot policy led to increases of 20.18% in total grain production, 11.40% in grain production per unit area, and 24.78% in per capita grain production in the western region. In contrast, the impact of the water rights trading policy pilot in non-western regions was not statistically significant. This notable regional difference illustrates the significant heterogeneity in the policy’s effects across regions with varying geographic and economic development levels.
Table 8.
Heterogeneity test results based on differences in policy pilot regions.
This result can be attributed to various influences: First, western regions facing severe water scarcity issues may respond more actively to and implement the water rights trading policy, resulting in more pronounced effects. Second, non-western regions may have already adopted more advanced water resource management practices, resulting in relatively small marginal effects from the water rights trading policy. Lastly, in the western regions with relatively low economic development levels, the water rights trading policy may have resulted in greater technological spillovers and management improvements, thereby exerting a more substantial positive impact on food production.
4.6.4. Heterogeneity Test Based on Differences in Types of Policy Pilots
Due to differences in resource endowment and marketization levels across regions, the MWR has delineated various focuses for policy pilots in its documents. Ningxia, Jiangxi, and Hubei focus on pilot projects for confirming and registering water resource use rights. Based on the decomposition of regional total water consumption control indicators, and in conjunction with rights registration for small-scale water conservancy projects and rural land, the focus is on exploring various forms of rights registration and systematically promoting the confirmation of water use rights for users. Inner Mongolia, Henan, Gansu, and Guangdong focus on exploring various modes of water rights trading and transfer across alliance cities, river basins, industries, and water users, including upstream and downstream dynamics. This study further categorizes the sample into two groups based on pilot type differences, focusing on analyzing the exploration of rights registration (RR) and trading models (TM), respectively.
The heterogeneity results in Table 9 indicate that variations in pilot types for water rights trading yield different impacts. In regions where the pilot emphasizes the trading model, the water rights trading policy has a significant positive effect on total grain production, grain production per unit area, and per capita grain production. Specifically, the pilot policy led to increases of 15.11% in total grain production, 7.09% in grain production per unit area, and 18.24% in per capita grain production in trading mode regions, all significant at the 1% level. In contrast, in regions where the pilot emphasized rights registration, the impact of the water rights trading policy was not statistically significant, despite the positive coefficient. This notable difference reflects the heterogeneity in the effects of varying policy implementation priorities on food production.
Table 9.
Heterogeneity test results based on differences in policy pilot types.
Several factors may explain this result: First, the water rights trading and transfer model directly involves market-based allocation of water resources, potentially optimizing water resource efficiency more rapidly, thereby having a more direct positive impact on food production. Second, regions prioritizing the trading model may have been more actively engaged in water rights trading, enhancing the optimal allocation of water resources among diverse regions, sectors, and water users, thus improving agricultural water use efficiency and food production. Lastly, while rights registration establishes a foundation for water rights trading, its direct short-term impact on food production is likely to be limited, which explains why the coefficient for regions focused on rights registration is positive yet not statistically significant.
5. Discussion
This study evaluates the impacts of water rights trading policies on food security, providing insights into the mechanisms and contextual factors that shape their effectiveness. The results demonstrate that water rights trading improves food security through two primary pathways: promoting water-saving irrigation technologies and optimizing cropping structures. These mechanisms collectively enhance water use efficiency and mitigate the adverse effects of water scarcity, particularly in regions facing significant resource constraints. The observed improvements in total grain production, per capita grain production, and unit area grain yield provide robust empirical evidence of the effectiveness of these mechanisms.
The analysis also reveals substantial regional heterogeneity in policy outcomes, reflecting the diverse institutional, economic, and infrastructural conditions across different regions. For example, western and economically underdeveloped regions benefit more significantly from water rights trading due to their greater need for resource optimization. However, areas with weaker institutional capacity or limited economic incentives may experience slower progress, leading to disparities in market activity and maturity. These results emphasize the importance of tailoring policy interventions to local conditions and ensuring that resource allocation policies address regional disparities effectively.
The findings of this study align with prior research on the effectiveness of water rights trading in improving resource allocation and agricultural productivity [72,73]. However, this study extends existing knowledge by exploring the mechanisms of water-saving irrigation technologies and cropping structure adjustments, which were not explicitly addressed in previous studies. Furthermore, while some research highlighted the potential of water rights trading to reduce regional disparities [74], our analysis demonstrates stronger impacts in western and economically underdeveloped regions, providing new insights into the spatial heterogeneity of policy effects.
Although this study provides valuable insights, several limitations should be acknowledged. The analysis primarily focuses on cumulative effects and does not explicitly evaluate the dynamic impacts of key time nodes, such as initial water rights allocation or market transactions. Additionally, some potentially relevant factors, such as regional water resource endowments and irrigation methods, were excluded due to data availability constraints. These limitations suggest that future research could explore these aspects further to provide a more comprehensive understanding of water rights trading mechanisms.
By addressing these considerations, this study provides a foundation for future research while underscoring the need for an integrated approach that combines technological, structural, and institutional innovations. Policymakers must balance the flexibility offered by phased policy implementation with efforts to reduce regional disparities, ensuring equitable and sustainable resource allocation across diverse regions.
6. Conclusions
This study investigates the cumulative impacts of water rights trading policies on food security, providing an empirical basis for understanding and evaluating the policy’s effectiveness. Using a quasi-natural experiment and a DID model, the analysis identifies both the mechanisms through which these policies operate and the contextual factors that shape their outcomes.
This study draws the following conclusions: (1) The water rights trading policy positively impacts on food security, increasing total grain production, grain production per unit area, and per capita grain production in the pilot areas by 12.86%, 4.74%, and 16.19%, respectively, compared to pre-implementation levels. Additionally, the results of the parallel trend test and placebo test indicate the validity of the DID model employed in this study. (2) Mechanism analysis reveals that the water rights trading policy enhances water use efficiency by promoting water-saving irrigation technologies and optimizing cropping structures. These mechanisms effectively mitigate the adverse impacts of water shortages on food security. Especially under intensified water pressures due to climate change, water rights trading encourages farmers to adopt low-water-use cultivation methods, ensuring the sustainability of agricultural production. (3) This study also examines regional variations in the impact of water rights trading on food security. Heterogeneity analysis shows that the positive effects of water rights trading policies are more pronounced in non-food-producing areas, economically underdeveloped regions, western areas, and areas focusing on the water rights trading transfer model. These findings highlight the importance of tailoring policies to regional characteristics.
The significance of this study lies in providing an empirical basis for understanding and evaluating the water rights trading policy, offering a scientific reference for policymakers’ decision-making. Based on the study’s findings, this paper offers the following policy recommendations: First, the government should continue to implement and expand water rights trading policies, particularly in regions with water scarcity and significant food production potential, to enhance agriculture’s adaptability and resilience. Second, the promotion and adoption of water-saving irrigation technologies should be strengthened to further improve agricultural water use efficiency. Simultaneously, farmers should be guided to optimize their crop-planting structures, thereby boosting sustainable food production. Finally, policy design should emphasize regional differentiation. Considering the spatial heterogeneity in the effects of water rights trading policies, it is recommended that the government fully account for regional resource endowments and economic development levels, adopting differentiated measures to ensure equitable and sustainable outcomes.
Author Contributions
H.L.: methodology, model development, data analysis, writing original draft, and funding acquisition. H.X.: conceptual, supervision, reviewing, and editing. T.D.: reviewing and editing. All authors have read and agreed to the published version of the manuscript.
Funding
This research was funded by the Fundamental Research Funds for the Central Universities, grant number B240207101.
Institutional Review Board Statement
Not applicable.
Informed Consent Statement
Informed consent was obtained from all subjects involved in the study.
Data Availability Statement
The data used in this study are derived from publicly available data from the National Bureau of Statistics of China.
Conflicts of Interest
The authors declare no conflicts of interest.
References
- Li, J.; Lin, Q. Threshold effects of green technology application on sustainable grain production: Evidence from China. Front. Plant Sci. 2023, 14, 1107970. [Google Scholar] [CrossRef] [PubMed]
- Zhong, Q.; Wang, L.; Cui, S. Urban Food Systems: A Bibliometric Review from 1991 to 2020. Foods 2021, 10, 662. [Google Scholar] [CrossRef] [PubMed]
- Chandio, A.A.; Nasereldin, Y.A.; Anh, D.L.T.; Tang, Y.; Sargani, G.R.; Zhang, H. The Impact of Technological Progress and Climate Change on Food Crop Production: Evidence from Sichuan—China. Int. J. Environ. Res. Public Health 2022, 19, 9863. [Google Scholar] [CrossRef] [PubMed]
- Zhang, K.; Tian, Y. Research on the spatio-temporal coupling relationship between agricultural green development efficiency and food security system in China. Heliyon 2024, 10, e31893. [Google Scholar] [CrossRef]
- Lu, Y.; Zhang, Y.; Hong, Y.; He, L.; Chen, Y. Experiences and Lessons from Agri-Food System Transformation for Sustainable Food Security: A Review of China’s Practices. Foods 2022, 11, 137. [Google Scholar] [CrossRef]
- Niu, Y.; Xie, G.; Xiao, Y.; Liu, J.; Wang, Y.; Luo, Q.; Zou, H.; Gan, S.; Qin, K.; Huang, M. Spatiotemporal Patterns and Determinants of Grain Self-Sufficiency in China. Foods 2021, 10, 747. [Google Scholar] [CrossRef]
- Wu, A.; Elahi, E.; Cao, F.; Yusuf, M.; Abro, M.I. Sustainable grain production growth of farmland-A role of agricultural socialized services. Heliyon 2024, 10, e26755. [Google Scholar] [CrossRef]
- Fouladkhah, A.C.; Thompson, B.; Camp, J.S. Safety of Food and Water Supplies in the Landscape of Changing Climate. Microorganisms 2019, 7, 469. [Google Scholar] [CrossRef]
- Skendžić, S.; Zovko, M.; Živković, I.P.; Lešić, V.; Lemić, D. The Impact of Climate Change on Agricultural Insect Pests. Insects 2021, 12, 440. [Google Scholar] [CrossRef]
- Lan, K.; Chen, X.; Ridoutt, B.G.; Huang, J.; Scherer, L. Closing yield and harvest area gaps to mitigate water scarcity related to China’s rice production. Agric. Water Manag. 2021, 245, 106602. [Google Scholar] [CrossRef]
- Milner, J.; Joy, E.J.M.; Green, R.; Harris, F.; Aleksandrowicz, L.; Agrawal, S.; Smith, P.; Haines, A.; Dangour, A.D. Projected health effects of realistic dietary changes to address freshwater constraints in India: A modelling study. Lancet Planet. Health 2017, 1, e26–e32. [Google Scholar] [CrossRef] [PubMed]
- Bonetti, S.; Sutanudjaja, E.H.; Mabhaudhi, T.; Slotow, R.; Dalin, C. Climate change impacts on water sustainability of South African crop production. Environ. Res. Lett. 2022, 17, 084017. [Google Scholar] [CrossRef] [PubMed]
- Akiyama, T.; Kharrazi, A.; Li, J.; Avtar, R. Agricultural water policy reforms in China: A representative look at Zhangye City, Gansu Province, China. Environ. Monit. Assess. 2017, 190, 9. [Google Scholar] [CrossRef] [PubMed]
- Ma, T.; Sun, S.; Fu, G.; Hall, J.W.; Ni, Y.; He, L.; Yi, J.; Zhao, N.; Du, Y.; Pei, T.; et al. Pollution exacerbates China’s water scarcity and its regional inequality. Nat. Commun. 2020, 11, 650. [Google Scholar] [CrossRef]
- Qi, X. Research on Strengthening Agricultural Water Resource Allocation and Utilization to Provide Strong Support for Food Security and Water Security. J. Irrig. Drain. 2022, 8, 2. (In Chinese) [Google Scholar]
- Wang, K.; Wang, J.; Wang, J.; Ding, L.; Zhao, M.; Wang, Q. Investigating the spatiotemporal differences and influencing factors of green water use efficiency of Yangtze River Economic Belt in China. PLoS ONE 2020, 15, e0230963. [Google Scholar] [CrossRef]
- Huang, C.; Yin, K.; Liu, Z.; Cao, T. Spatial and Temporal Differences in the Green Efficiency of Water Resources in the Yangtze River Economic Belt and Their Influencing Factors. Int. J. Environ. Res. Public Health 2021, 18, 3101. [Google Scholar] [CrossRef]
- Elzaki, R.M.; Al-Mahish, M. Food insecurity and water management shocks in Saudi Arabia: Bayesian VAR analysis. PLoS ONE 2024, 19, e0296721. [Google Scholar] [CrossRef]
- Khanal, R.; Brady, M.P.; Stöckle, C.O.; Rajagopalan, K.; Yoder, J.; Barber, M.E. The Economic and Environmental Benefits of Partial Leasing of Agricultural Water Rights. Water Resour. Res. 2021, 57, e2021WR029712. [Google Scholar] [CrossRef]
- Zhao, M.; Ancev, T.; Vervoort, R.W. Water Market Functionality: Evidence From the Australian Experience. Water Resour. Res. 2024, 60, e2022WR033938. [Google Scholar] [CrossRef]
- Wang, X.; Yang, S. Research on Status Quo of Water Rights Trading in China. IOP Conf. Ser. Earth Environ. 2018, 171, 012033. [Google Scholar] [CrossRef]
- He, N.; Shi, Y.; Ding, R. Does the Water Rights Trading Policy Improve Water-Use Efficiency? An Environmental Policy Evaluation from China. Sustainability 2024, 16, 3454. [Google Scholar] [CrossRef]
- Guan, X.; Du, Q.; Zhang, W.; Wang, B. Study on the Pricing of Water Rights Transaction between Irrigation Water Users Based on Cooperative Game in China. Water 2021, 13, 1672. [Google Scholar] [CrossRef]
- Gohar, A.A.; Amer, S.A.; Ward, F.A. Irrigation infrastructure and water appropriation rules for food security. J. Hydrol. 2015, 520, 85–100. [Google Scholar] [CrossRef]
- Wang, Y.; Wu, P.; Engel, B.A.; Sun, S.K. Comparison of volumetric and stress-weighted water footprint of grain products in China. Ecol. Indic. 2015, 48, 324–333. [Google Scholar] [CrossRef]
- Zeng, X.; Li, Y.; Huang, G.H.; Liu, J. Modeling Water Trading under Uncertainty for Supporting Water Resources Managemnt in an Arid Region. J. Water Resour. Plann. Manag. 2016, 142, 04015058. [Google Scholar] [CrossRef]
- Bekchanov, M.; Bhaduri, A.; Ringler, C. Potential gains from water rights trading in the Aral Sea Basin. Agric. Water Manag. 2015, 152, 41–56. [Google Scholar] [CrossRef]
- Chen, Y.; Zhu, J. Regulation of Water Rights Trading Price Based on Affordability: Taking Water Rights Trading between Irrigation Water Users as an Example. Resources Sci. 2021, 43, 1638–1648. (In Chinese) [Google Scholar]
- Trout, T.J.; Manning, D.T. An Economic and Biophysical Model of Deficit Irrigation. Agron. J. 2019, 111, 3182–3193. [Google Scholar] [CrossRef]
- Zhu, X.; Zhang, G.; Yuan, K.; Ling, H.; Xu, H. Evaluation of Agricultural Water Pricing in an Irrigation District Based on a Bayesian Network. Water 2018, 10, 768. [Google Scholar] [CrossRef]
- Rodrigues, G.C.; da Silva, F.G.; Coelho, J.C. Determining Farmers’ Willingness to Pay for Irrigation Water in the Alentejo Region (Southern Portugal) by the Residual Value Method. Agronomy 2021, 11, 142. [Google Scholar] [CrossRef]
- Li, T.; Zeng, X.; Chen, C.; Kong, X.; Zhang, J.; Zhu, Y.; Zhang, F.; Dong, H. Scenario Analysis of Initial Water-Rights Allocation to Improve Regional Water Productivities. Water 2019, 11, 1312. [Google Scholar] [CrossRef]
- Zeng, X.; Li, Y.; Huang, G.; Zhuang, X.; Nie, S. Sustainable Water-Resources Allocation Through a Trading-Oriented Mechanism Under Uncertainty in an Arid Region. Clean-Soil Air, Water 2018, 46, 1800317. [Google Scholar] [CrossRef]
- Zeng, X.; Li, Y.; Huang, G.; Liu, J. A two-stage interval-stochastic water trading model for allocating water resources of Kaidu-Kongque River in northwestern China. J. Hydroinform. 2015, 17, 551–569. [Google Scholar] [CrossRef]
- Wu, X.; Wu, F.; Li, F.; Xu, X. Dynamic Adjustment Model of the Water Rights Trading Price Based on Water Resource Scarcity Value Analysis. Int. J. Environ. Res. Public Health 2021, 18, 2281. [Google Scholar] [CrossRef]
- Gómez-Limón, J.A.; Gutiérrez-Martín, C.; Montilla-López, N.M. Agricultural Water Allocation under Cyclical Scarcity: The Role of Priority Water Rights. Water 2020, 12, 1835. [Google Scholar] [CrossRef]
- Bontems, P.; Nauges, C. Production choices with water markets and risk aversion: The role of initial allocations and forward trading. Eur. Rev. Agric. Econ. 2019, 46, 579–608. [Google Scholar] [CrossRef]
- Lee, S.H.; Mohtar, R.H.; Yoo, S.H. Assessment of food trade impacts on water, food, and land security in the MENA region. Hydrol. Earth Syst. Sci. 2019, 23, 557–572. [Google Scholar] [CrossRef]
- Kim, J.Y.; Lee, J. Assigning Property Rights to Scarce Resources when Individual Wealth Levels are Observable. Asian J. Law. Econ. 2023, 14, 47–57. [Google Scholar] [CrossRef]
- Leonard, B.; Costello, C.; Libecap, G.D. Expanding Water Markets in the Western United States: Barriers and Lessons from Other Natural Resource Markets. Rev. Environ. Econ. Policy 2019, 13, 43–61. [Google Scholar] [CrossRef]
- Becker, M.; Krupnik, T.J.; Pariyar, S.; Islam, M.A. Changing trends in crop management practices and performance attributes of rice-based systems of coastal Bangladesh. Front. Agron. 2024, 6, 1397474. [Google Scholar]
- Duan, Y.; Zhou, S.; He, J.; Bai, M. Improving the performance of agricultural temporary water markets: The role of technology-based and transaction-based subsidies. Agric. Water Manag. 2024, 303, 109062. [Google Scholar] [CrossRef]
- Liu, Y.; Tang, P.; Xu, T.; Zheng, H. Optimizing Trading Assignments in Water Right Markets. Proc. AAAI Conf. Artif. Intell. 2016, 30, 1. [Google Scholar] [CrossRef]
- Zuo, A.; Nauges, C.; Wheeler, S.A. Farmers’ exposure to risk and their temporary water trading. Eur. Rev. Agric. Econ. 2015, 42, 1–24. [Google Scholar] [CrossRef]
- Dalin, C.; Qiu, H.; Hanasaki, N.; Mauzerall, D.L.; Rodriguez-Iturbe, I. Balancing water resource conservation and food security in China. Proc. Natl. Acad. Sci. USA 2015, 112, 4588–4593. [Google Scholar] [CrossRef]
- Xu, X.; Chen, Y.; Zhou, Y.; Liu, W.-J.; Zhang, X.; Li, M.J.A.W.M. Sustainable management of agricultural water rights trading under uncertainty: An optimization-evaluation framework. Agric. Water Manag. 2023, 280, 108212. [Google Scholar] [CrossRef]
- Zhu, M.; Yu, Q.; Zhang, L. Pricing model of agricultural water rights trading in water-shortage region, China. Environ. Sci. Pollut. Res. Int. 2023, 30, 22000–22012. [Google Scholar] [CrossRef]
- Edwards, E.C.; Hendricks, N.P.; Sampson, G.S. The capitalization of property rights to groundwater. Am. J. Agric. Econ. 2024. prepublish. [Google Scholar] [CrossRef]
- Li, G.; Ma, D.; Zhao, C.; Li, H. The Effect of the Comprehensive Reform of Agricultural Water Prices on Farmers’ Planting Structure in the Oasis–Desert Transition Zone—A Case Study of the Heihe River Basin. Int. J. Environ. Res. Public. Health 2023, 20, 4915. [Google Scholar] [CrossRef]
- Schneider, N. Internalizing Environmental Externalities and the Coase Theorem. World J. Appl. Econ. 2022, 8, 93–100. [Google Scholar] [CrossRef]
- Philip, J.-M.; Sánchez-Chóliz, J.; Sarasa, C. Technological change in irrigated agriculture in a semiarid region of Spain. Water Resour. Res. 2014, 50, 9221–9235. [Google Scholar] [CrossRef]
- Lakhiar, I.A.; Yan, H.; Zhang, C.; Wang, G.; He, B.; Hao, B.; Han, Y.; Wang, B.; Bao, R.; Syed, T.N.; et al. A Review of Precision Irrigation Water-Saving Technology under Changing Climate for Enhancing Water Use Efficiency, Crop Yield, and Environmental Footprints. Agriculture 2024, 14, 1141. [Google Scholar] [CrossRef]
- Yang, P.; Wu, L.; Cheng, M.; Fan, J.; Li, S.; Wang, H.; Qian, L. Review on Drip Irrigation: Impact on Crop Yield, Quality, and Water Productivity in China. Water 2023, 15, 1733. [Google Scholar] [CrossRef]
- Pawar, J.; Khanna, R. More Crop per Drop: Ways to Increase Water Use Efficiency for Crop Production: A Review. Int. J. Chem. Stud. 2018, 6, 3573–3578. [Google Scholar]
- Yigezu, Y.A.; Aw-Hassan, A.; Shideed, K.; Sommer, R.; El-Shater, T. A policy option for valuing irrigation water in the dry areas. Water Policy 2014, 16, 520–535. [Google Scholar] [CrossRef]
- Vichete, W.D.; Méllo Júnior, A.V.; Soares, G.A.d.S. A Water Allocation Model for Multiple Uses Based on a Proposed Hydro-Economic Method. Water 2023, 15, 1170. [Google Scholar] [CrossRef]
- He, L.; Wang, S.; Peng, C.; Tan, Q. Optimization of Water Consumption Distribution Based on Crop Suitability in the Middle Reaches of Heihe River. Sustainability 2018, 10, 2119. [Google Scholar] [CrossRef]
- Naik, A.; Chandrakanth, M. Do Farmers Gain by More Crop Per Drop? Indian J. Agric. Econ. 2023, 77, 592–609. [Google Scholar]
- Tai, X.; Feng, F.; Sun, F. Farmers’ Willingness and Adoption of Water-Saving Agriculture in Arid Areas: Evidence from China. Sustainability 2024, 16, 8112. [Google Scholar] [CrossRef]
- Yadav, M.; Chavan, L.; Chavan, A.; Rajemahadik, V. Effect of Establishment Methods and Nutrient Management on Yield and Economics of Kharif Rice. Int. J. Curr. Microbiol. Appl. Sci. 2019, 8, 2040–2045. [Google Scholar] [CrossRef]
- Ali, A.; Rahut, D.B.; Mottaleb, K.A. Improved water-management practices and their impact on food security and poverty: Empirical evidence from rural Pakistan. Water Policy 2018, 20, 692–711. [Google Scholar] [CrossRef]
- Wei, Y.; Fang, D.; Wei, X.; Ye, Z. Assessing the equilibrium of food supply and demand in China’s food security framework: A comprehensive evaluation, 1980–2017. Front. Sustain. Food Syst. 2024, 8, 1326839. [Google Scholar] [CrossRef]
- Pérez-Blanco, C.D.; Hrast-Essenfelder, A.; Perry, C. Irrigation Technology and Water Conservation: A Review of the Theory and Evidence. Rev. Environ. Econ. Policy 2020, 14, 216–239. [Google Scholar] [CrossRef]
- Liu, X.; Xu, Y.; Engel, B.A.; Sun, S.; Wang, Y. The impact of urbanization and aging on food security in developing countries: The view from Northwest China. J. Clean. Prod. 2021, 292, 126067. [Google Scholar] [CrossRef]
- West, R.M. Best practice in statistics: The use of log transformation. Ann. Clin. Biochem. 2022, 59, 162–165. [Google Scholar] [CrossRef]
- Liang, X. Research on the Influence of the Law of Diminishing Marginal Returns in Agriculture. Adv. Econ. Manag. Political Sci. 2023, 8, 262–267. [Google Scholar] [CrossRef]
- Wang, G.; Hamad, R.; White, J.S. Advances in Difference-in-differences Methods for Policy Evaluation Research. Epidemiology 2024, 35, 628–637. [Google Scholar] [CrossRef]
- Chen, S.; Cao, Y.; Li, J. The Effect of Water Rights Trading Policy on Water Resource Utilization Efficiency: Evidence from a Quasi-Natural Experiment in China. Sustainability 2021, 13, 5281. [Google Scholar] [CrossRef]
- Fang, L.; Wu, F. Can Water Rights Trading Scheme Promote Regional Water Conservation in China? Evidence from a Time-Varying DID Analysis. Int. J. Environ. Res. Public. Health 2020, 17, 6679. [Google Scholar] [CrossRef]
- Le, D.; Ren, F.; Li, Y. The Effect of Energy Use Rights Trading Policy on Environmental Performance: Evidence from Chinese 262 Cities. Int. J. Environ. Res. Public. Health 2023, 20, 3570. [Google Scholar] [CrossRef]
- JIANG, T. Mediating Effects and Moderating Effects in Causal Inference. China Ind. Econ. 2022, 5, 100–120. (In Chinese) [Google Scholar]
- Pan, J.; Peng, J.; Yang, X.; Xuan, S. Does water rights trading promote resources utilisation efficiency and green growth? Evidence from China’s resources trading policy. Resour. Policy 2023, 86, 104235. [Google Scholar] [CrossRef]
- Zhang, W.; He, Y.; Yin, H. Research on Water Rights Allocation of Coordinated Development on Water–Ecology–Energy–Food. Water 2022, 14, 2140. [Google Scholar] [CrossRef]
- Tian, G.; Liu, J.; Li, X.; Li, Y.; Yin, H. Water rights trading: A new approach to dealing with trans-boundary water conflicts in river basins. Water Policy 2020, 22, 133–152. [Google Scholar] [CrossRef]
Disclaimer/Publisher’s Note: The statements, opinions and data contained in all publications are solely those of the individual author(s) and contributor(s) and not of MDPI and/or the editor(s). MDPI and/or the editor(s) disclaim responsibility for any injury to people or property resulting from any ideas, methods, instructions or products referred to in the content. |
© 2024 by the authors. Licensee MDPI, Basel, Switzerland. This article is an open access article distributed under the terms and conditions of the Creative Commons Attribution (CC BY) license (https://creativecommons.org/licenses/by/4.0/).