Article

Intelligent Manufacturing and Green Innovation—Evidence from China’s Listed Manufacturing Firms

School of Economics, Shanghai University, Shanghai 200444, China
*
Author to whom correspondence should be addressed.
Sustainability 2024, 16(23), 10376; https://doi.org/10.3390/su162310376
Submission received: 9 October 2024 / Revised: 22 November 2024 / Accepted: 25 November 2024 / Published: 27 November 2024

Abstract

:
The realization of intelligent and green manufacturing represents two core challenges currently faced by manufacturing enterprises. The “Intelligent Manufacturing Pilot Demonstration List” issued by the Ministry of Industry and Information Technology (MIIT) of the People’s Republic of China provides a sample of firms that have undergone stringent selection processes, demonstrating secure and controllable technological capabilities, with no intellectual property disputes. Using data from manufacturing firms listed on the Shanghai and Shenzhen stock exchanges from 2011 to 2020, we identify those that implemented intelligent manufacturing based on the aforementioned pilot list from 2015 to 2019 as the treatment group and the remaining firms as the control group to investigate whether intelligent manufacturing increases the number of green patent applications. The findings indicate that the implementation of intelligent manufacturing significantly increases green patent applications by 3.676% through three main pathways: reducing the level of financing constraints, improving resource utilization efficiency, and increasing R&D investment. Heterogeneity analysis reveals that state-owned enterprises exhibit a significantly stronger promotion effect on green innovation post-implementation of intelligent manufacturing compared to non-state-owned enterprises, with enterprises in the western region demonstrating the most pronounced enhancement in green innovation. Based on these findings, we propose corresponding recommendations from the perspectives of policy support and enterprise strategy.

1. Introduction

With the rapid advancements in artificial intelligence, big data, and cloud computing, internet technology, as part of the new generation of information technologies, is identified as a hallmark of the fifth Kondratieff Cycle in the global economy [1]. Digital technologies have not only penetrated daily life but have also transformed various aspects of industrial production. The 20th National Congress of the Communist Party of China emphasized that high-quality development is the foremost task in the country’s comprehensive push for modernization, and digitalization has become a key driver of this high-quality growth.
Manufacturing remains a cornerstone of China’s current economic structure. As digital technologies continue to integrate with traditional manufacturing, digital transformation has become a vital force in driving the upgrade of these industries, forming the unique model of “intelligent manufacturing”. Intelligent manufacturing is characterized by the deep integration of next-generation information and communication technologies (ICT) with advanced manufacturing processes, embedding digitalization into all stages of manufacturing activities—design, production, and services. This model introduces a new production paradigm marked by self-perception, self-learning, self-decision-making, self-execution, and self-adaptation, reflecting the digital and intelligent features of modern production systems.
However, as environmental issues become increasingly prominent in the 21st century, the green transformation of industries, particularly pollution-intensive sectors such as manufacturing, has emerged as a critical policy agenda. Balancing economic growth with environmental sustainability is a key challenge faced by many nations [2], with firms grappling with the dual pressures of intelligent transformation and green transition under resource constraints.
Existing research on corporate digitalization largely focuses on two main dimensions: internal digital management and the utilization of digital factors. Some studies examine the impact of the digital economy on firm management transformation from a microeconomic perspective, addressing topics such as strategic management [3], organizational management [4], and innovation management [5]. In terms of digital factor utilization, research indicates that firms can leverage data as a production input to facilitate the supply of products and services [6]. Digital resources have vast applications and can be integrated into various stages of production and service processes [7], creating “invisible” value through their circulation [8].
Although the literature has explored the influence of the digital economy on firm behavior and its mechanisms, demonstrating that the digital economy enhances innovation [9], reduces risk [10], and boosts total factor productivity [11], as well as contributing positively to corporate social responsibility [12], few studies have analyzed the interplay between digitalization and green transformation, or whether an interactive mechanism exists between them.
Discussing the impact of intelligent manufacturing on the number of green patents helps address the challenges of identifying resource allocation for green innovation. Since green innovation is often intertwined with other forms of innovation and intelligent manufacturing’s outcomes typically feature both digital and green characteristics, it is difficult to separately quantify the resource inputs. However, using green patent counts as an indicator provides a more direct measure of the actual technological advancements driven by intelligent manufacturing in the green sector. Patents, as a tangible output of technological innovation, reflect firms’ investments and progress in green technologies, avoiding the confounding effects associated with traditional resource input measurements [13]. Thus, examining the impact of intelligent manufacturing on green patents not only offers a clearer and more direct standard for measuring green innovation but also reveals the actual contributions of intelligent manufacturing to green technological advancements, effectively overcoming the challenges of accurately identifying resource allocation [14].
To contribute to this nascent field of research, this study investigates whether the adoption of intelligent manufacturing enhances green patent applications and explores the mechanisms underlying this relationship. The “Intelligent Manufacturing Pilot Demonstration List” published by the Ministry of Industry and Information Technology (MIIT) of the People’s Republic of China serves as an ideal dataset for this study. Each year, MIIT undertakes a rigorous selection process for intelligent manufacturing pilot demonstration projects. Participating firms are required to conduct a self-assessment of their intelligent manufacturing capability maturity and actively engage in MIIT’s on-site evaluations and subsequent promotional activities. Firms that are ultimately selected must meet stringent criteria, including the use of secure and controllable key technologies and industrial software, and ensuring that their solutions are free from any intellectual property disputes.
Using a sample of manufacturing firms listed on the Shanghai and Shenzhen stock exchanges prior to 2019, we identified firms that implemented intelligent manufacturing from 2015 to 2019 based on the Ministry of Industry and Information Technology’s intelligent manufacturing pilot demonstration list. These firms constitute the treatment group, while those not included in the list form the control group. Employing a multi-period difference-in-differences (DID) model, the results show that the adoption of intelligent manufacturing significantly increases the number of green patent applications among manufacturing firms. Furthermore, when the dependent variable is replaced with the proportion of green patents relative to total patent applications, the findings remain robust.
To further investigate the mechanisms through which intelligent manufacturing promotes green patent applications, we use the Kaplan–Zingales (KZ) index to measure firms’ financial constraints, current depreciation to capture resource utilization efficiency, and R&D investment as a proxy for research and development intensity. The findings suggest that intelligent manufacturing increases green patent applications through three primary mechanisms: alleviating financial constraints, enhancing resource utilization efficiency, and boosting R&D investment.
Additionally, heterogeneity analysis reveals that the impact of intelligent manufacturing on green innovation is more pronounced in state-owned enterprises (SOEs) compared to private firms, and the positive effect is most significant for firms located in western China. Finally, we provide policy recommendations and strategic suggestions based on the empirical findings.

2. Theoretical Background

2.1. Intelligent Manufacturing and Green Innovation

Technological progress has always been a significant driver of productivity growth in human society. The application of digital technologies, represented by information systems, in production is referred to as the “Fourth Industrial Revolution”. Unlike previous industrial revolutions, which achieved productivity gains at the cost of extensive resource consumption and severe environmental pollution, digital technology is characterized by high technological content and low environmental pressure. It enhances productivity while causing minimal environmental damage [15]. Therefore, the intelligence-driven production brought by digital technologies not only improves resource allocation efficiency but also contributes to environmental protection [16]. As a product of the deep integration between digital technology and manufacturing, intelligent manufacturing aligns with the principles of green development in both inputs and outputs [17]. On the input side, intelligent manufacturing transforms enterprises from high input, high energy consumption, and low efficiency to low pollution, low energy consumption, and high efficiency. On the output side, intelligent manufacturing enables enterprises to balance their economic interests with minimizing environmental impact, assisting them in achieving a green transition. An important indicator of this green transition is the increase in the number of green patent applications. Based on this, the following hypothesis is proposed:
H1. 
Intelligent manufacturing boosts enterprises’ green transition, increasing green patent applications.

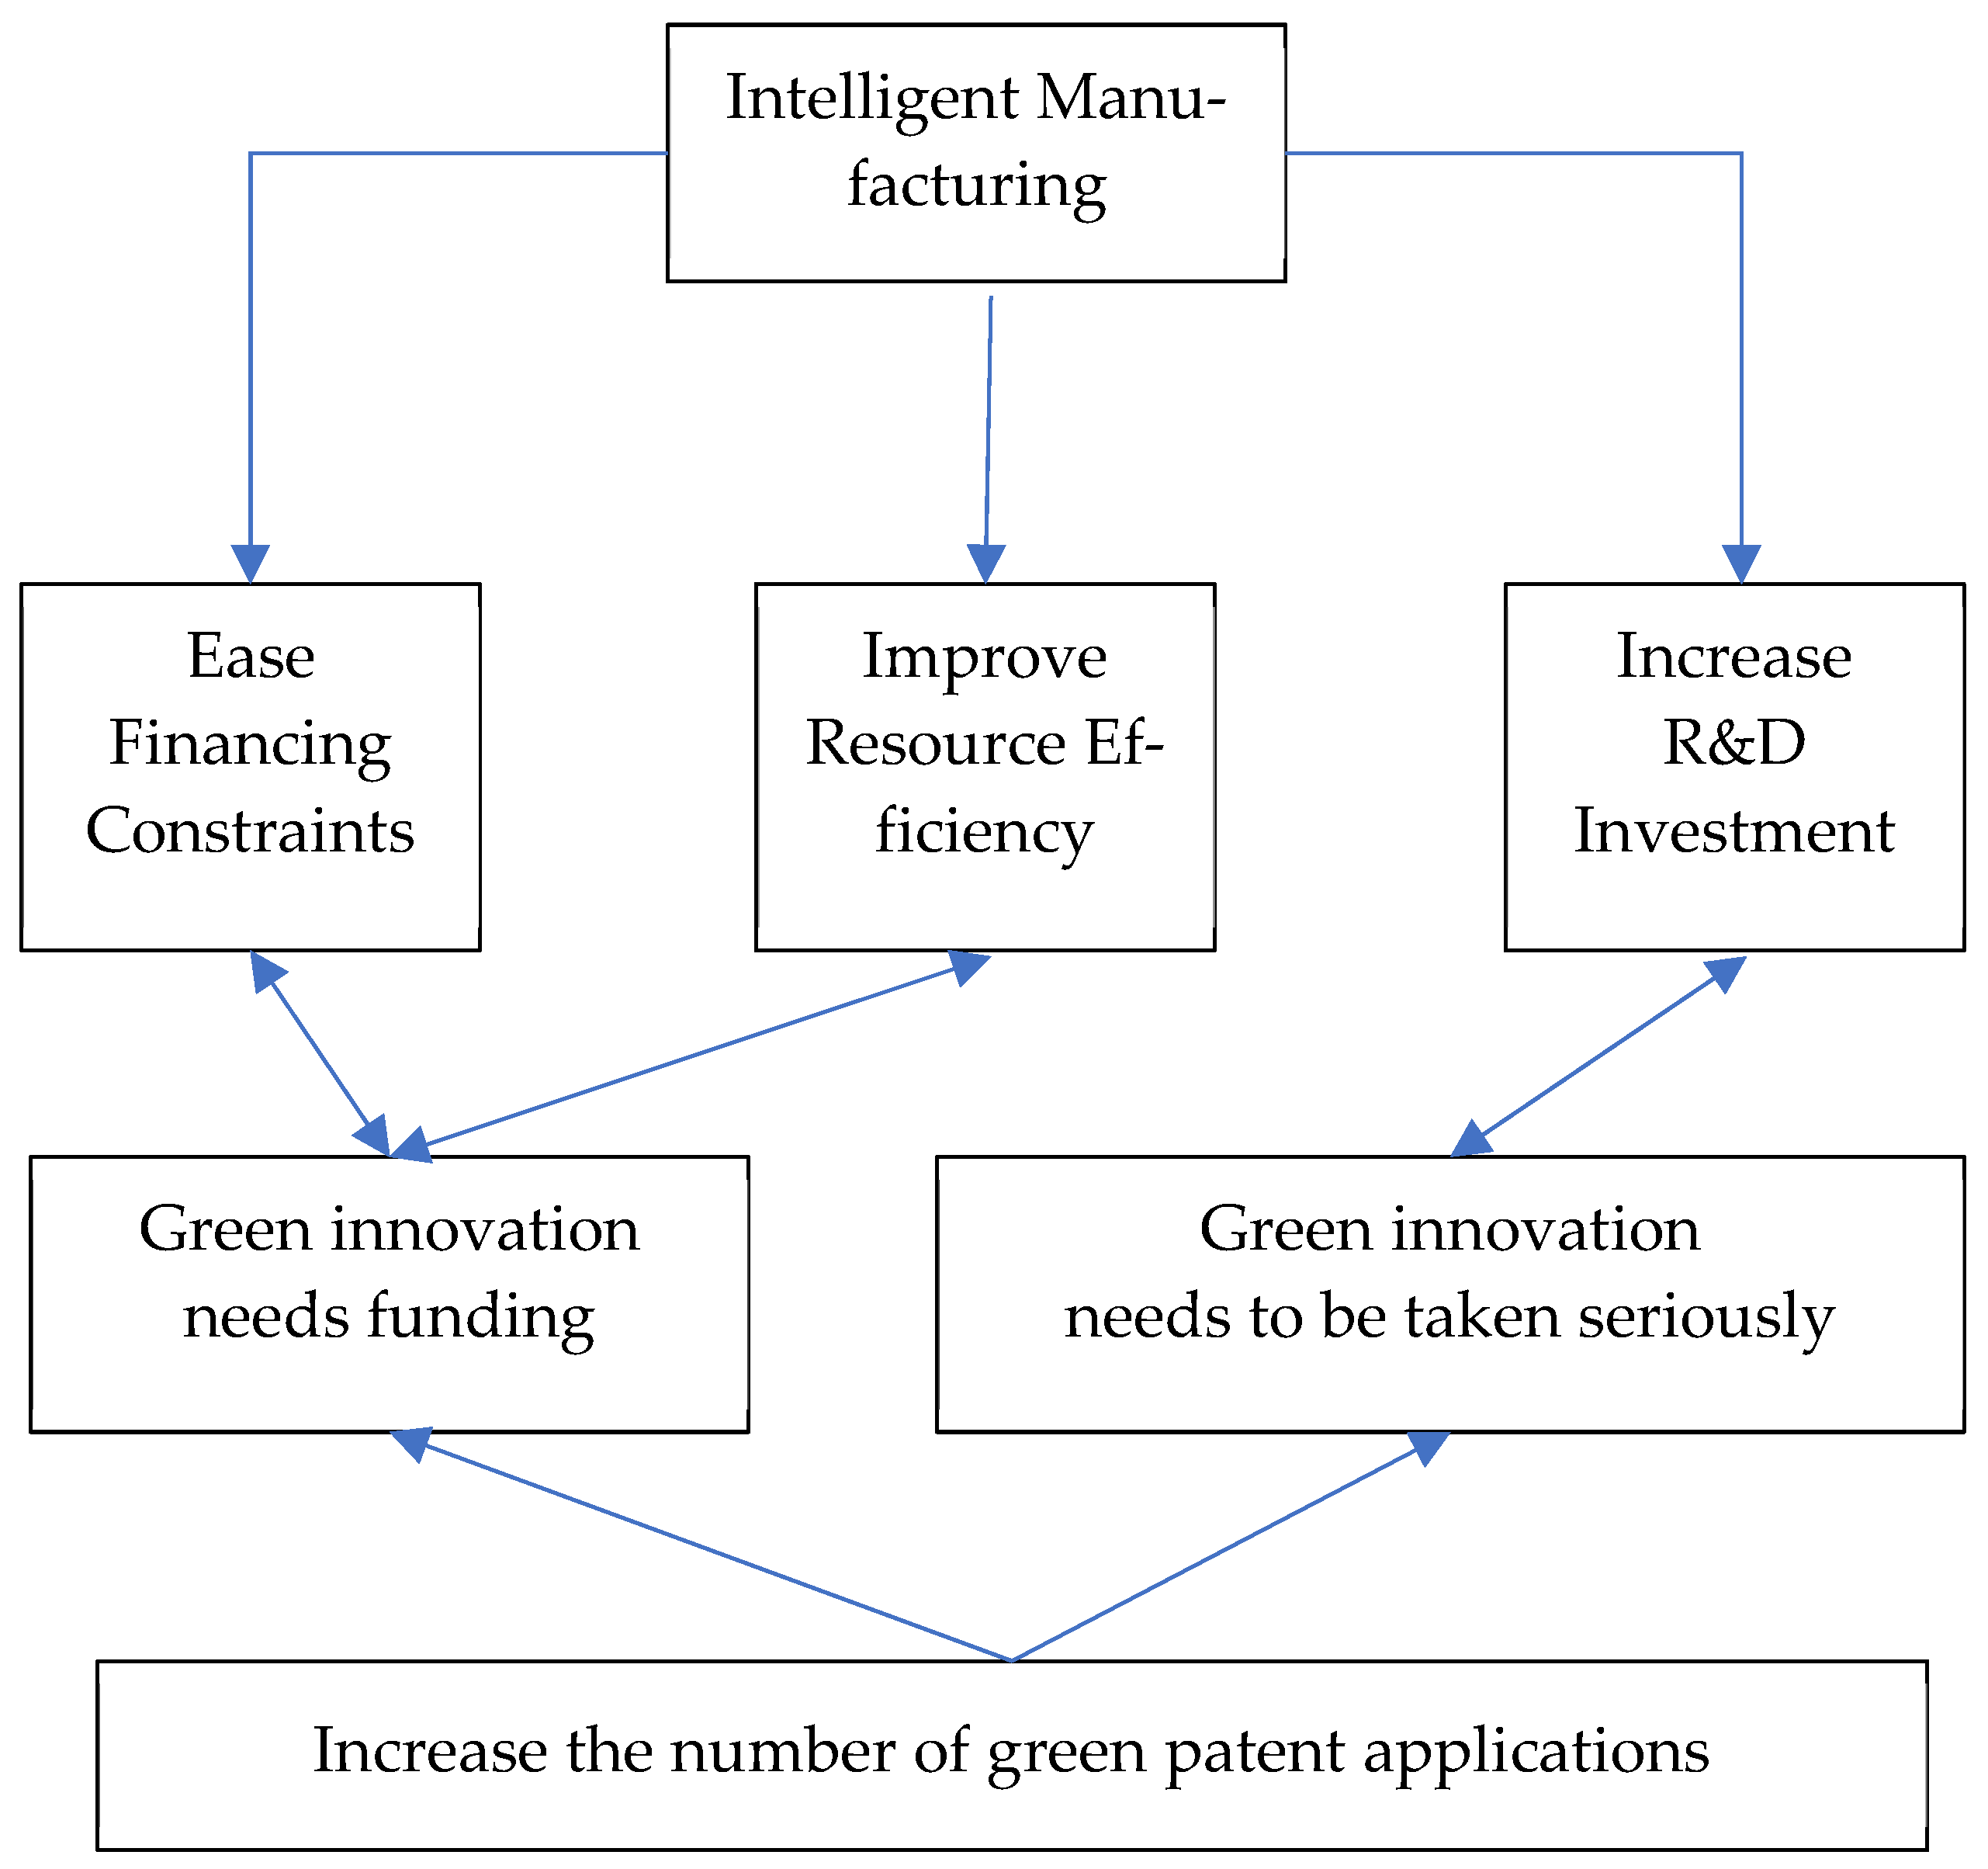
2.2. How Intelligent Manufacturing Drives a Green Transition

The increase in green patent applications depends on financial support, while innovation investment aimed at technological advancement is characterized by high costs, long cycles, high risks, and significant uncertainty. This requires sustained, stable, and sufficient financing. Financial constraints significantly inhibit firms’ innovation activities [18], whereas alleviating these constraints enhances green innovation efficiency [19]. After adopting intelligent manufacturing, reduced communication costs through interconnected business networks promote cooperation and ease financial constraints within supply chains. Additionally, digital information collection and disclosure improve banks’ risk assessment, facilitating access to financing. Thus, alleviating financial constraints is a key mechanism by which intelligent manufacturing increases green patent applications.
Efficient allocation of funds for green innovation is also crucial. Intelligent manufacturing requires the implementation of Enterprise Resource Planning (ERP) systems, integrated with production processes. This optimization enhances management and production efficiency, reducing operational costs and freeing up resources for green innovation. Furthermore, advanced information technologies reduce information acquisition and integration costs, increase the availability and quality of information, and enhance the absorption of intangible resources, minimizing resource wastage. Improving resource efficiency is therefore another key mechanism by which intelligent manufacturing boosts green patent applications.
Stricter environmental regulations also shift R&D investment in the industrial sector towards green technology [20]. As green products gain market preference, firms increasingly allocate R&D resources to green technologies, leading to higher overall R&D investment. Hence, increasing R&D investment is another pathway through which intelligent manufacturing drives green patent growth.
In conclusion, the following hypothesis is proposed in Figure 1.
H2. 
Intelligent manufacturing increases green patent applications by easing financial constraints, enhancing resource efficiency, and boosting R&D investment.

2.3. The Impact of Business Ownership and the Region

Firms’ green innovation may be influenced by intrinsic factors, such as ownership heterogeneity [21]. In China, state-owned enterprises (SOEs) benefit from larger, more stable funding and stricter regulation, differentiating their competitiveness from non-SOEs. Therefore, ownership heterogeneity is a crucial factor. Additionally, green innovation, being high-risk, requires substantial green knowledge reserves [22], meaning the regional green knowledge stock also impacts green innovation, reflecting regional heterogeneity. Accordingly, the following hypothesis is proposed:
H3. 
The impact of intelligent manufacturing on green patent applications is contingent on ownership and regional heterogeneity.

3. Data Source and Research Methods

3.1. Sample Selection and Data Source

Most studies identify intelligent manufacturing adoption by searching relevant terms in annual reports. However, text analysis has a key limitation in analyzing listed firms: companies may exaggerate their performance for financing or compliance reasons. For instance, firms may frequently mention intelligent manufacturing in reports to secure funding, without meaningful implementation. Thus, verifying actual intelligent manufacturing adoption requires reliable third-party certification.
Since 2015, China’s Ministry of Industry and Information Technology (MIIT) has conducted annual intelligent manufacturing pilot programs. Firms apply voluntarily, and the MIIT conducts verification before publishing the “Intelligent Manufacturing Pilot Demonstration Enterprises” list, which provides credible evidence of a firm’s intelligent manufacturing adoption.
This study selects manufacturing firms listed on the Shanghai and Shenzhen A-share markets before 2019. We identify pilot firms based on MIIT announcements from 2015 to 2018. Given the publication timing and the impact of COVID-19, the sample period spans 2011–2020. Financial data are sourced from the CSMAR database, and the sample is processed as follows:
(1)
Exclude firms listed after 2019;
(2)
Exclude financial and insurance sectors;
(3)
Exclude non-manufacturing firms;
(4)
Exclude firms with missing key data;
(5)
Exclude firms marked as ST or delisted;
(6)
For firms selected multiple times for the pilot, only the first selection is retained.
This results in a sample of 17,132 firm–year observations, with 76 firms in the treatment group (selected for the pilot) and 2223 in the control group (not selected).
The dependent variable, green patent applications, is used to represent firms’ green transition, with a higher number indicating greater success. This is justified by two factors:
(1)
Green patents are a direct output of green technological innovation and are easily quantifiable;
(2)
Since intelligent manufacturing in China is in its early stages, using green patent applications allows for a more timely assessment, avoiding delays in patent approvals that could introduce confounding factors.
Following Qi et al. (2018) [23], we obtain patent data from the State Intellectual Property Office (SIPO) and classify green patents based on the World Intellectual Property Organization (WIPO) “Green Inventory”. The sample firms’ green and total patent applications are tracked from 2011 to 2020.

3.2. Definitions of Variables

In this study, the total number of green patent applications is selected as the dependent variable for the baseline regression, denoted as G P A i , j , which represents the total number of green patents applied for by firm i in year j . The independent variable for the baseline regression is I M i , j , which indicates whether the firm has adopted intelligent manufacturing. If firm i was selected for the intelligent manufacturing pilot in year j ., then I M i , j = 1 ; otherwise, I M i , j = 0 .
Referring to the research by Song et al. (2021) [24], we designed the following control variables as shown in the Table 1:
The control variables in this paper encompass three aspects: firm performance, firm characteristics, and macroeconomic conditions. Firm performance includes labor input, capital investment, debt-to-asset ratio, and basic earnings per share, reflecting the firm’s labor scale, capital expenditures, financial leverage, and profitability. Firm characteristics cover the size of the enterprise and the age of listing, used to control for the basic attributes of the firm. Macroeconomic conditions are represented by regional GDP per capita, indicating the level of economic development in the region where the firm operates. This design of control variables helps account for both internal and external factors influencing firms, ensuring the accuracy and robustness of the analysis results.

3.3. Model Setting

In this study, the total number of green patent applications is selected as the dependent variable, while the implementation of intelligent manufacturing is used as the independent variable. The main regression equation is specified as follows:
G P A i , j = α 0 + α 1 I M i , j + k = 1 k K k , i , j + μ j + π i + ε i , j
We used G P A i , j to represents the total number of green patents applied for by firm i in year j , while I M i , j is the indicator variable for whether the firm has implemented intelligent manufacturing. K k , i , j represents the k-th control variable for firm i in year j . μ j captures time-fixed effects, and π i accounts for individual fixed effects.
The study also acknowledges that unobservable motives for patent applications may introduce confounding factors, potentially biasing the conclusions of the main regression model. To address this, following the approach proposed by Popp (2006) [25], the proportion of green patent applications to total patent applications ( P G P A i , j ) is used for robustness testing. This measure helps further eliminate confounding factors that could simultaneously affect both the numerator (green patent applications) and the denominator (total patent applications), such as undifferentiated patent subsidies, which influence both the total patent count and the green patent count.

4. Empirical Analysis

4.1. Descriptive Statistics

To mitigate the impact of outliers on the results, we add a double-sided winsorization test at 1%. To address potential endogeneity issues, we employed Propensity Score Matching (PSM), which reduces the likelihood of endogeneity problems, particularly reverse causality. The matching variables are consistent with the aforementioned control variables.
The descriptive statistics for the sample are shown in Table 2, which provides an overview of the key variables used in the analysis, including their mean, standard deviation, minimum, and maximum values.
The descriptive statistics indicate that, on average, the sample firms applied for approximately 1.992 green patents per year during the 2011–2020 period, reflecting a relatively low level of green innovation activity. Furthermore, the high variance in green patent applications suggests considerable heterogeneity across firms and years. Regarding the proportion of green patents to total patent applications, the mean value is only 5.5%, indicating a small share. Additionally, the presence of firms with no green patent applications and those with green patents accounting for 100% of their applications underscores the uneven emphasis on green innovation among firms. These findings suggest that research on the impact of intelligent manufacturing on green patent applications in manufacturing firms is particularly relevant, given the increasing importance of both digitalization and sustainability in contemporary economic development.

4.2. Benchmark Regression and Robust Test

The main regression results, controlling for both time and individual fixed effects, are presented in Table 3.
By replacing the dependent variable with the proportion of green patents ( P G P A i , j ) and running the regression again while controlling for time and individual fixed effects, the results remain robust, as reported in the third column of Table 3.
In summary, Table 3 shows that the implementation of intelligent manufacturing significantly boosts the number of green patent applications in manufacturing firms, increasing it by 2.705%. Even when considering unobservable motivations for patent applications, intelligent manufacturing still significantly increases the proportion of green patents in total applications. This provides strong support for Hypothesis 1.

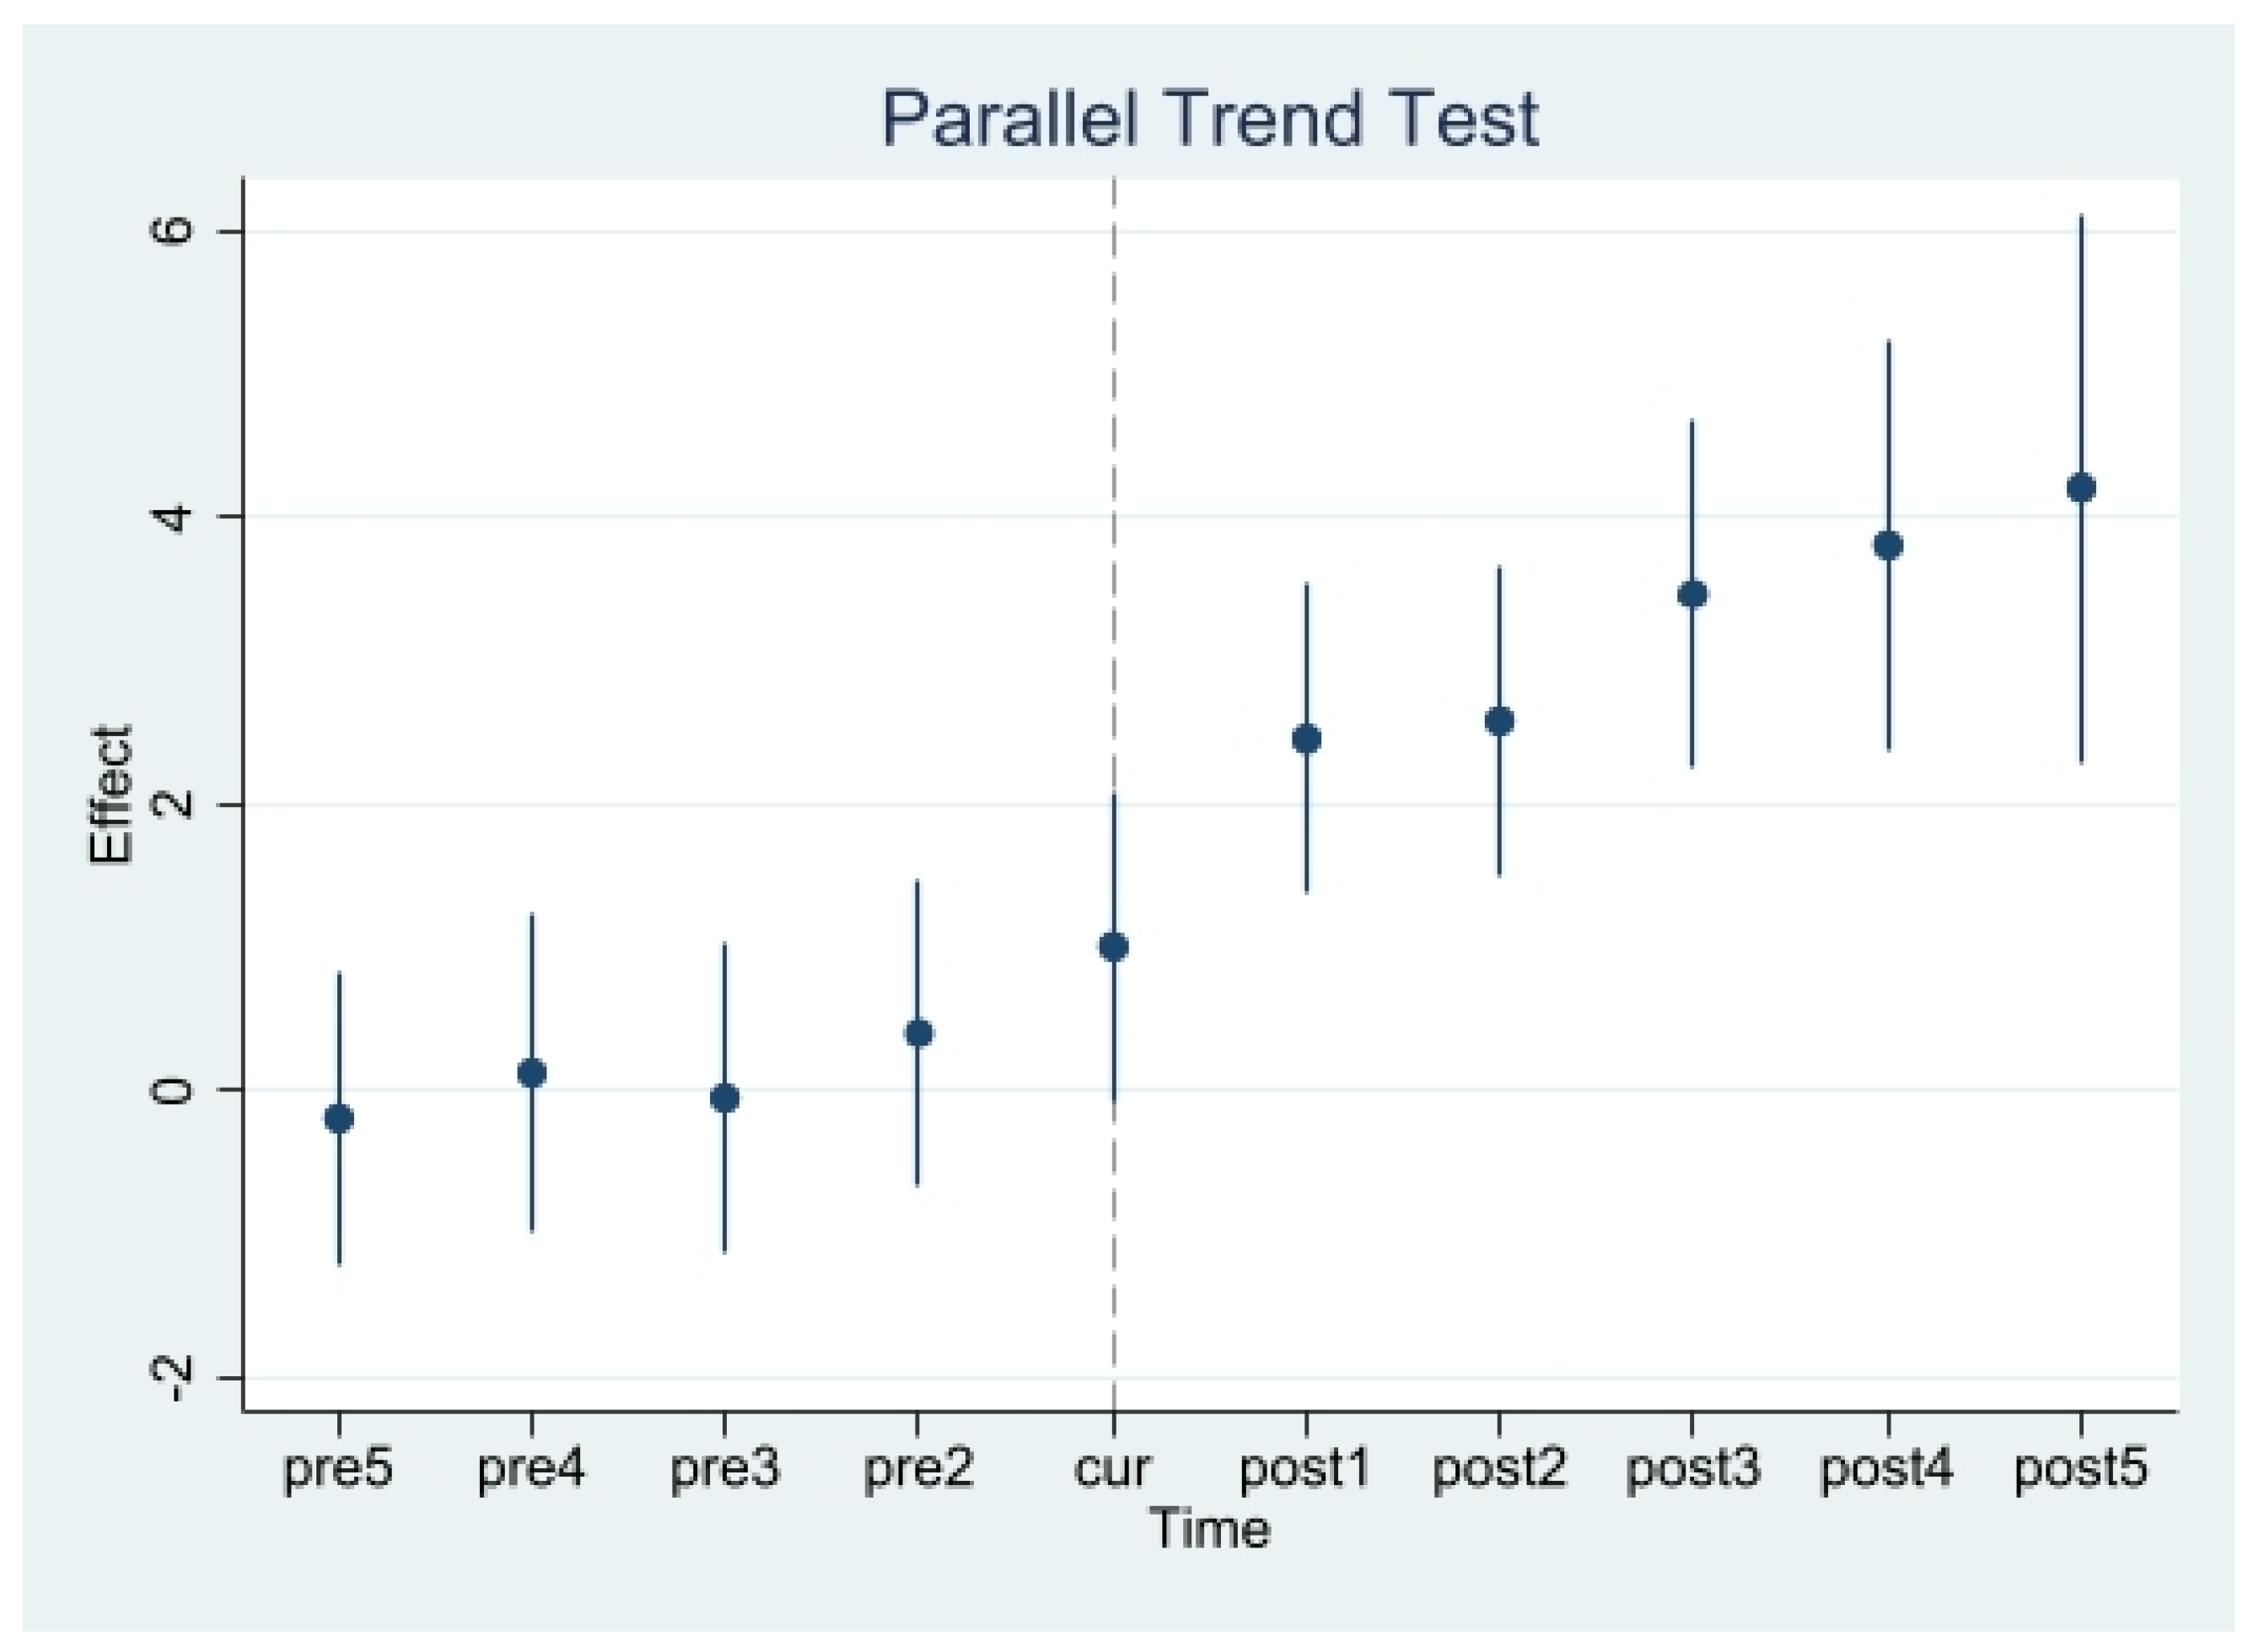
4.3. Parallel Trend Test

The parallel trend test is a crucial component of the multi-period difference-in-differences (DID) method, employed to verify whether the treatment and control groups exhibit similar trends prior to the intervention. The parallel trend test for this study’s sample is illustrated in Figure 2.
Figure 2 clearly demonstrates that the parallel trend assumption is satisfied. In the absence of the intervention, the outcome variables for the treatment and control groups follow similar trends over time. After the implementation of intelligent manufacturing, there is a marked and significant increase in green patent applications in the treatment group. This result confirms the validity of the parallel trend assumption, indicating that intelligent manufacturing has a significant positive impact on green patent applications.

5. Mechanism Analysis

5.1. Mechanism Test Methods

In terms of financial constraints, the Kaplan–Zingales (KZ) index is a commonly used measure to assess the level of financial constraints faced by firms [26]. A higher KZ index indicates a greater degree of financial constraint. The KZ index for the sample firms in this study is calculated using the following formula:
K Z = K Z 1 + K Z 2 + K Z 3 + K Z 4 + K Z 5
I f   c a s h f l o w   i s   b e l o w   t h e   i n d u s t r y   a n n u a l   m e d i a n ,   K Z 1 = 1 , o t h e r w i s e   K Z 1 = 0     I f   d i v i d e n d   i s   b e l o w   t h e   i n d u s t r y   a n n u a l   m e d i a n ,   K Z 2 = 1 , o t h e r w i s e   K Z 2 = 0 I f   c a s h h o l d   i s   b e l o w   t h e   i n d u s t r y   a n n u a l   m e d i a n ,   K Z 3 = 1 , o t h e r w i s e   K Z 3 = 0 I f   l e v e r a g e   i s   b e l o w   t h e   i n d u s t r y   a n n u a l   m e d i a n ,   K Z 4 = 1 , o t h e r w i s e   K Z 4 = 0 I f   T o b i n Q   i s   b e l o w   t h e   i n d u s t r y   a n n u a l   m e d i a n ,   K Z 5 = 1 , o t h e r w i s e   K Z 5 = 0
Intelligent manufacturing enhances production efficiency, optimizes resource allocation, and reduces operational costs, leading to a significant improvement in a firm’s cash flow. By maintaining or increasing output while lowering production costs, firms can strengthen their operating cash flow, reduce reliance on external financing, and thereby alleviate financial constraints (as measured by the KZ index). Although the initial investment in intelligent manufacturing may result in a temporary increase in leverage, the subsequent improvements in profitability and cash flow enhance a firm’s debt servicing capacity, ultimately reducing leverage. Thus, we believe that intelligent manufacturing mitigates financial constraints by improving cash flow, optimizing capital structure, and increasing profitability, leading to a reduction in the KZ index over time.
Following the study by Dai and Yang (2022) [17], we use annual depreciation as a measure of resource efficiency for manufacturing firms. Depreciation facilitates the timely renewal of fixed assets and serves a dual role in that it is included in product costs while also being regarded as a source of investment [27].
Depreciation reflects capital utilization and the rate of technological renewal. Higher depreciation indicates increased investment in equipment and technology, enhancing production efficiency and resource use. In the context of intelligent manufacturing, firms’ capital expenditures on advanced technologies often lead to higher depreciation, which not only improves resource efficiency but also drives green innovation by reducing waste and environmental impact. Thus, using depreciation as a measure of intelligent manufacturing’s effect on green innovation is appropriate, as it captures firms’ investments in both resource optimization and environmental sustainability.
For R&D investment, the study directly uses the amount of R&D expenditure as the indicator for R&D investment, denoted as R D .
The equation used for the mechanism test is specified as follows:
K Z i , j = Z 0 + Z 1 I M i , j + k = 1 z k K k , i , j + μ j + π i + ε i , j D a A i , j = D 0 + D 1 I M i , j + k = 1 d k K k , i , j + μ j + π i + ε i , j R D i , j = R 0 + R 1 I M i , j + k = 1 r k K k , i , j + μ j + π i + ε i , j
where K k , i , j refers to the same set of control variables as mentioned earlier, ensuring consistency in the model. μ j represents time-fixed effects, and π i denotes individual fixed effects, both included to ensure the validity of the mechanism test results. These elements help control for unobserved heterogeneity across firms and time, ensuring the robustness and reliability of the findings.

5.2. Mechanism Test Results and Analysis

The descriptive statistics for the KZ index, annual depreciation, and R&D investment are presented in Table 4.
The mechanism test results, incorporating both time and individual fixed effects, are presented in Table 5.
The regression coefficient of I M i , j with K Z i , j is −0.266 and statistically significant at the 5% level, indicating a negative relationship between the adoption of intelligent manufacturing and financial constraints. This suggests that implementing intelligent manufacturing significantly reduces firms’ financial constraints. As environmental performance becomes increasingly valued by investors, firms with higher environmental performance—achieved through green patent applications and improved production efficiency—attract more capital, thereby alleviating financial constraints.
The regression coefficient of I M i , j with D a A i , j is 96.86 and significant at the 1% level, suggesting a positive relationship between intelligent manufacturing and resource utilization efficiency. Intelligent manufacturing not only enhances production processes but also optimizes resource allocation by leveraging data from production lines, enabling more efficient recycling of reusable resources, thus reducing costs and increasing the availability of funds for green innovation.
The regression coefficient of I M i , j with R D i , j is 242.9 and significant at the 1% level, indicating that intelligent manufacturing is positively associated with R&D intensity. In the current context of increased environmental awareness, the simultaneous pursuit of intelligent and green transitions pushes firms to increase R&D investment, driving the development of more environmentally friendly technologies. Faced with intense competition and stringent environmental regulations, firms are incentivized to enhance their R&D efforts to secure green patents and maintain competitive advantage.
In conclusion, the results confirm that the implementation of intelligent manufacturing increases green patent applications through the mechanisms of reducing financial constraints, improving resource utilization efficiency, and increasing R&D intensity, thus validating Hypothesis 2.

6. Heterogeneity

6.1. Business Ownership

Based on the analysis of ownership data from firms’ annual reports and following the equity calculation logic stipulated by the “Regulations on the Supervision of State-Owned Asset Transactions” of the People’s Republic of China, firms with more than 50% state ownership are classified as state-owned enterprises (SOEs), while the remaining firms are categorized as private enterprises. The heterogeneity test based on firm ownership yields the following results in Table 6.
The heterogeneity analysis based on ownership structure shows a differential impact of intelligent manufacturing on green patent applications between SOEs and private enterprises. The results indicate that intelligent manufacturing has a more pronounced effect on promoting green patent applications in SOEs. This is likely due to the unique resource advantages held by Chinese SOEs [28]. SOEs benefit from more stable funding sources, which enable them to engage in green innovation even when market returns are uncertain. In contrast, private firms often face greater market competition and financial constraints, which limits their incentives and capacity for green innovation. Additionally, SOEs are required to meet broader social objectives, including national green targets, and thus face more comprehensive regulatory oversight. This may explain why SOEs tend to have higher levels of green innovation.

6.2. Location

According to the National Bureau of Statistics of China, the country is divided into several regions: the Eastern region, which includes 10 provinces/municipalities (Beijing, Tianjin, Hebei, Shanghai, Jiangsu, Zhejiang, Fujian, Shandong, Guangdong, and Hainan), the Northeastern region, which includes 3 provinces (Liaoning, Jilin, Heilongjiang), the Central region, which includes 6 provinces (Shanxi, Anhui, Jiangxi, Henan, Hubei, and Hunan), and the Western region, which includes 12 provinces/municipalities/autonomous regions (Inner Mongolia, Guangxi, Chongqing, Sichuan, Guizhou, Yunnan, Tibet, Shaanxi, Gansu, Qinghai, Ningxia, and Xinjiang). For analytical convenience, the Northeastern region is merged with the Eastern region and collectively referred to as Eastern provinces.
Firms’ registration information was used to identify their location, and the regional heterogeneity test was conducted according to the aforementioned classification. The results are presented in the following Table 7.
The results indicate that the effect of intelligent manufacturing on green patent applications is not significant in Eastern China but is most pronounced in Western China and Central regions. There are three potential reasons for this outcome:
First, disparities in regional economic development play a central role. In the more advanced eastern regions, firms already possess higher technological capabilities, meaning the marginal effect of intelligent manufacturing on green innovation is limited, resulting in an insignificant impact on green patent applications. In contrast, the central and western regions, with lower technological levels, experience more significant gains from adopting intelligent manufacturing, as it serves as a key mechanism for improving productivity and driving innovation, thereby increasing green patent filings, particularly in the western region, where the effect is most pronounced.
Second, differential policy support and resource allocation across regions exacerbate these disparities. The Chinese government has provided substantial support for intelligent manufacturing and green development in the central and western regions through fiscal incentives, R&D subsidies, and infrastructure investment. This targeted policy support fosters a more conducive environment for innovation in these regions, amplifying the impact of intelligent manufacturing on green patent applications. In contrast, the already-developed eastern regions face diminishing returns from additional policy interventions, limiting the influence of intelligent manufacturing on green innovation.
Third, the pressure for industrial transformation in the central and western regions is a crucial driver. These regions, which are heavily reliant on high-pollution, energy-intensive industries, have a more pressing need to adopt cleaner technologies. Intelligent manufacturing offers a critical pathway for reducing environmental impact and fostering green innovation, thereby leading to more significant increases in green patent applications. In contrast, the eastern regions, with more advanced and cleaner industries, have less immediate need for green innovation through intelligent manufacturing.
From the perspective of technological diffusion and absorptive capacity, firms in the central and western regions benefit more from the diffusion of advanced technologies, allowing for rapid adoption and subsequent green innovation. Conversely, firms in the eastern regions, already near the technological frontier, experience lower marginal returns from adopting intelligent manufacturing, limiting its impact on green patent output.
Finally, differences in industrial structure further contribute to regional variation. The eastern regions are characterized by more high-tech and low-pollution industries, where the drive for green innovation is largely market-driven, while the central and western regions depend more on policy incentives to reduce environmental externalities and promote green innovation, amplifying the role of intelligent manufacturing in increasing green patent applications.
In conclusion, the regional differences in the impact of intelligent manufacturing on green patent applications stem from the interplay of factors such as economic development levels, policy support, industrial structure, and technological absorptive capacity. These factors collectively shape the varying effectiveness of intelligent manufacturing in driving green innovation across regions.

7. Concluding Remarks

We utilize data from manufacturing firms listed on the Shanghai and Shenzhen stock exchanges from 2011 to 2020, identifying those that implemented intelligent manufacturing based on the ‘Intelligent Manufacturing Pilot Demonstration List’ issued by China’s Ministry of Industry and Information Technology (MIIT) from 2015 to 2019 as the treatment group, and the remaining firms as the control group, to investigate whether intelligent manufacturing enhances the number of green patent applications. The results show that intelligent manufacturing significantly increases the green patent applications of listed manufacturing firms by 3.676%. Further analysis reveals that intelligent manufacturing promotes green patent applications through three channels: reducing firms’ financial constraints, enhancing resource utilization efficiency, and increasing R&D investment. Additionally, a heterogeneity analysis indicates that the effect of intelligent manufacturing on green innovation is more pronounced in state-owned enterprises (SOEs) compared to private firms and that firms located in the western regions exhibit the strongest impact from intelligent manufacturing adoption on green innovation.
The implications of this study are as follows:
At the policy level, multi-dimensional support policies should be developed to promote the adoption of intelligent manufacturing among firms. Currently, government policies primarily rely on fiscal subsidies and funding to guide the industrial transition toward intelligent manufacturing. However, greater emphasis should be placed on providing comprehensive support in the areas of reputation, technological development, and financial systems. Moreover, the government should recognize the role of intelligent manufacturing in fostering green development and introduce incentive policies that reward firms for achieving green outcomes through intelligent manufacturing.
At the firm level, intelligent manufacturing, as an advanced production mode that spans all stages of manufacturing—design, production, and service—not only enhances firm-level operational efficiency but also contributes to improved environmental performance. Firms should integrate intelligent manufacturing into all operational stages based on their specific characteristics and needs to achieve sustainable, high-quality development for both the firm and the environment. Additionally, it is crucial that firms ensure that intelligent manufacturing strategies are aligned with both internal and external market conditions, as a misalignment may reduce its effectiveness and undermine its potential benefits.

Author Contributions

Conceptualization, X.X.; methodology, J.P.; software, X.M.; formal analysis, J.P.; investigation, X.X. and J.P.; resources, X.M.; data curation, X.X.; writing—original draft preparation, J.P. and X.M.; writing—review and editing, X.X.; supervision, X.X.; funding acquisition, X.M. All authors have read and agreed to the published version of the manuscript.

Funding

Xuechen Meng thanks the financial support from Shanghai Philosophy and Social Science Planning Project (Grant number: 2023EJB012).

Institutional Review Board Statement

Not relevant.

Informed Consent Statement

Not relevant.

Data Availability Statement

Data are avaiable upon request.

Conflicts of Interest

The authors declare no conflict of interest.

References

  1. Huang, Q.-H.; Yu, Y.-Z.; Zhang, S.-L. Internet Development and Productivity Growth in Manufacturing Industry: Internal Mechanism and China Experiences. China Ind. Econ. 2019, 8, 5–23. (In Chinese) [Google Scholar]
  2. Nordhaus, W. Climate Change: The Ultimate Challenge for Economics. Am. Econ. Rev. 2019, 109, 1991–2014. [Google Scholar] [CrossRef]
  3. Chen, D.; Wang, L.; Chen, A. Digitalization and Strategic Management Theory: Review, Challenges and Prospects. J. Manag. World 2020, 36, 220–236+20. (In Chinese) [Google Scholar]
  4. Qi, Y.; Xiao, X. Transformation of Enterprise Management in the Era of Digital Economy. J. Manag. World 2020, 36, 135–152+250. (In Chinese) [Google Scholar]
  5. Liu, Y.; Dong, J.; Wei, J. Digital Innovation Management: Theoretical Framework and Future Research. J. Manag. World 2020, 36, 198–217+219. (In Chinese) [Google Scholar]
  6. Bukht, R.; Heeks, R. Defining, Conceptualizing and Measuring the Digital Economy; Development Informatics Working Papers 68; University of Manchester: Manchester, UK, 2017. [Google Scholar]
  7. Jones, I.C.; Tonetti, C. Nonrivalry and the Economics of Data. Am. Econ. Rev. 2020, 110, 2819–2858. [Google Scholar] [CrossRef]
  8. He, Y.; Wang, W. Theoretical Explanation of Marketization of Data Elements. Contemp. Econ. Res. 2021, 4, 33–44. (In Chinese) [Google Scholar]
  9. Li, J.; Zhang, J.-J.; Dong, X.-F. How Digital Economy Affects Enterprise Innovation Ability: Internal Mechanism and Empirical Evidence. Bus. Manag. J. 2022, 44, 5–22. (In Chinese) [Google Scholar]
  10. Qi, H.-J.; Cao, X.-Q.; Liu, Y.-X. The Influence of Digital Economy on Corporate Governance: Analyzed from Information Asymmetry and Irrational Behavior Perspective. Reform 2020, 4, 50–64. (In Chinese) [Google Scholar]
  11. Chen, X.-H.; Zhang, H.-W. How does the Digital Economy Affect the Level of Enterprise Risk-taking? Bus. Manag. J. 2021, 43, 93–108. (In Chinese) [Google Scholar]
  12. Xiao, H.; Li, P. Ecological Governance of Platform Enterprises’ CSR. J. Manag. World 2019, 35, 120–144+196. (In Chinese) [Google Scholar]
  13. Wan, P.-B.; Yang, M.; Chen, L. How Do Environmental Technology Standards Affect the Green Transition of China’s Manufacturing Industry—A Perspective from Technological Transformation. China Ind. Econ. 2021, 9, 118–136. (In Chinese) [Google Scholar]
  14. Wang, J.; Liu, B. Environmental Regulation and Enterprises’ TFP—An Empirical Analysis Based on China’s Industrial Enterprises Data. China Ind. Econ. 2014, 3, 44–56. (In Chinese) [Google Scholar]
  15. Bao, J.; Miao, Y.; Chen, F. Low Carbon Economy: Revolution in the Way of Human Economic Development. China Ind. Econ. 2008, 4, 153–160. (In Chinese) [Google Scholar]
  16. Levinson, A. Technology, International Trade, and Pollution from US Manufacturing. Am. Econ. Rev. 2009, 99, 2177–2192. [Google Scholar] [CrossRef]
  17. Dai, X.; Yang, S.-Z. Digital Empowerment, Source of Digital Input and Green Manufacturing. China Ind. Econ. 2022, 9, 83–101. (In Chinese) [Google Scholar]
  18. Aghion, P.; Askenazy, P.; Berman, N.; Cette, G.; Eymard, L. Credit Constraints and the Cyclicality of R&D Investment: Evidence from France. J. Eur. Econ. Assoc. 2012, 10, 1001–1024. [Google Scholar]
  19. Xu, J.; Cui, J.-B. Low-Carbon Cities and Firms’ Green Technological Innovation. China Ind. Econ. 2020, 12, 178–196. (In Chinese) [Google Scholar]
  20. Xiong, L.; Yan, S.; Yang, M. Financial Development, Environmental Regulation and Industrial Green Technological Innovation: From the Perspective of Directed Endogenous Growth. China Ind. Econ. 2023, 12, 99–116. (In Chinese) [Google Scholar]
  21. Lu, J.; Yan, Y.; Wang, T.-X. The Microeconomic Effects of Green Credit Policy—From the Perspective of Technological Innovation and Resource Reallocation. China Ind. Econ. 2021, 1, 174–192. (In Chinese) [Google Scholar]
  22. Yuan, L.; Zhou, Z. Environmental Trading Program and Reallocation of Green Patents. China Ind. Econ. 2022, 12, 127–145. (In Chinese) [Google Scholar]
  23. Qi, S.Z.; Lin, S.A.; Cui, J.B. Do Environmental Rights Trading Schemes Induce Green Innovation? Evidence from Listed Firms in China. Econ. Res. J. 2018, 53, 129–143. (In Chinese) [Google Scholar]
  24. Song, M.; Zhou, P.; Si, H.-T. Financial Technology and Enterprise Total Factor Productivity—Perspective of “Enabling” and Credit Rationing. China Ind. Econ. 2021, 4, 138–155. (In Chinese) [Google Scholar]
  25. Popp, D. International innovation and diffusion of air pollution control technologies: The effects of NOX and SO2 regulation in the US, Japan, and Germany. J. Environ. Econ. Manag. 2005, 51, 46–71. [Google Scholar] [CrossRef]
  26. Kaplan, S.N.; Zingales, L. Do investment-cash flow sensitivities provide useful measures of financing constraints? Q. J. Econ. 1997, 112, 169–215. [Google Scholar] [CrossRef]
  27. Li, B.; Zhao, F. Fixed Capital, Accelerated Depreciation and Economic Fluctuation Effects. China Rev. Political Econ. 2017, 8, 190–202. (In Chinese) [Google Scholar]
  28. Zhang, C.-S.; Liu, G.-C. The Existence, Dynamic Characteristics, and Economic Growth Effects of Optimal Financial Structure. J. Manag. World 2016, 1, 66–77. (In Chinese) [Google Scholar]
Figure 1. Mechanisms of Intelligent Manufacturing’s Impact on Green Patent Applications. NOTE: This figure visually explains the pathways laid out in Hypothesis 2. (1) Alleviating Financial Constraints: Intelligent manufacturing reduces communication and cooperation costs, easing financing constraints through improved risk assessment and access to funding. (2) Enhancing Resource Efficiency: By optimizing ERP systems and leveraging advanced information technologies, intelligent manufacturing improves resource management, lowering costs and minimizing waste. (3) Increasing R&D Investment: Stricter environmental regulations and market preference for green products push firms to increase R&D in green technologies, contributing to more green patents.
Sustainability 16 10376 g001
Figure 2. Parallel Trend Test.
Sustainability 16 10376 g002
Table 1. Control variables.
Variable NameVariable SymbolVariable Description
Labor input L Number of employees in the enterprise
Capital investment K Net fixed assets ($M)
Debt-to-asset ratio D A R Total Liabilities/Total Assets
Basic earnings per share R O E Net income for the period attributable to shareholders of common stock/weighted average number of common shares outstanding for the period
The size of the enterprise l n s i z e The logarithm of the total number of assets
The age of listing A g e Current year—the year in which the company was listed
GDP per capita in a region P G D P The per capita GDP of the enterprise in the current period (million CNY/person)
Table 2. Descriptive Statistics of the Sample.
VariableMeanStd.MinMax
G P A i , j 1.9926.3260.00045.000
P G P A i , j 0.0550.1420.0001.000
I M i , j 0.0150.1200.0001.000
L 4915.63511,294.9869.000229,154.000
K 2294.6177356.1210.000224,866.586
D A R 0.4121.405−0.195178.345
R O E 0.3940.869−16.46037.170
l n s i z e 21.9661.20814.12729.216
A g e 8.9267.0460.00030.000
P G D P 0.0740.0310.0160.165
Table 3. Main Regression and Robustness Test.
GPAGPAR
IM2.705 ***0.0178 **
(0.277)(0.00867)
L0.0000288 ***0.000000168
(0.00000801)(0.000000251)
K0.0000874 ***0.000000662 **
(0.00000978)(0.000000306)
DAR0.00435−0.000142
(0.0200)(0.000627)
ROE−0.0102−0.000273
(0.0479)(0.00150)
lnsize0.263 ***−0.00256
(0.0785)(0.00246)
Age−3.072 **0.0100
(1.273)(0.0399)
PGDP0.0723−0.147
(3.381)(0.106)
_cons23.21 **0.0298
(10.98)(0.344)
Fe_idYESYES
Fe_yearYESYES
N17,13217,132
R20.6490.518
adj. R20.5960.447
Standard errors in parentheses: * p < 0.1, ** p < 0.05, *** p < 0.01.
Table 4. Descriptive Statistics for Mechanism Test Variables.
VariableMeanStd.MinMax
K Z i , j 0.9902.378−10.98714.823
D a A i , j 242.234771.0670.00122,562.813
R D i , j 188.166857.8900.00073,839.000
Table 5. Mechanism Test Results.
VariableKZDaARD
IM−0.266 **96.86 ***242.9 ***
(0.123)(16.25)(45.89)
L0.0000103 ***0.0133 ***0.0310 ***
(0.00000356)(0.000470)(0.00133)
K−0.00000896 **0.0766 ***0.0338 ***
(0.00000435)(0.000574)(0.00162)
DAR0.0541 ***−0.483−1.057
(0.00890)(1.176)(3.320)
ROE−0.774 ***−9.660 ***14.55 *
(0.0213)(2.811)(7.938)
lnsize0.0717 **−12.12 ***−27.41 **
(0.0349)(4.606)(13.01)
Age−0.730−160.1 **−126.4
(0.565)(74.70)(211.0)
PGDP9.984 ***1682.5 ***2173.6 ***
(1.502)(198.4)(560.3)
_cons5.4451573.6 **1518.6
(4.876)(644.1)(1819.0)
Fe_idYESYESYES
Fe_yearYESYESYES
N17,13217,13117,132
R20.6530.9430.631
adj. R20.6010.9340.577
Standard errors in parentheses: * p < 0.1, ** p < 0.05, *** p < 0.01.
Table 6. Ownership Heterogeneity Test.
State-Owned EnterprisesPrivate Enterprise
IM4.522 **2.713 ***
(2.030)(0.804)
L0.000195 ***0.000316 ***
(0.0000527)(0.0000254)
K0.000459 ***0.000659 ***
(0.0000581)(0.0000404)
DAR−0.217−0.0182
(2.334)(0.0434)
ROE0.1140.106
(0.359)(0.143)
lnsize−0.519−0.698 ***
(0.727)(0.216)
Age3.2052.216
(16.00)(3.017)
PGDP25.38−2.610
(28.10)(9.730)
_cons−36.340.234
(229.5)(19.60)
Fe_idYESYES
Fe_yearYESYES
N457212498
R20.6270.731
adj. R20.5740.688
Standard errors in parentheses: * p < 0.1, ** p < 0.05, *** p < 0.01.
Table 7. Regional Heterogeneity Test.
EASTMIDWEST
IM1.5853.251 **12.28 ***
(1.419)(1.407)(0.854)
L0.000308 ***−0.000002930.000144 ***
(0.0000361)(0.0000536)(0.0000457)
K0.000581 ***−0.0001610.000172 ***
(0.0000439)(0.000120)(0.0000364)
DAR−0.5400.03360.599
(0.718)(0.0552)(0.525)
ROE0.609 **−0.282−0.0799
(0.273)(0.318)(0.110)
lnsize−1.043 ***1.496 ***−0.392
(0.404)(0.470)(0.253)
Age3.177−6.9420.0245
(6.032)(6.253)(9.577)
PGDP−10.915.275−0.437
(15.18)(45.59)(22.89)
_cons−1.59543.568.456
(46.50)(62.94)(112.1)
Fe_idYESYESYES
Fe_yearYESYESYES
N12,24326092274
R20.6480.6780.694
adj. R20.5930.6310.650
Standard errors in parentheses: * p < 0.1, ** p < 0.05, *** p < 0.01.
Disclaimer/Publisher’s Note: The statements, opinions and data contained in all publications are solely those of the individual author(s) and contributor(s) and not of MDPI and/or the editor(s). MDPI and/or the editor(s) disclaim responsibility for any injury to people or property resulting from any ideas, methods, instructions or products referred to in the content.

