
Long-Term Monitoring and Early Warning of Coal Mine Underground Reservoirs—A Case Study in Shigetai Coal Mine

Abstract
1. Introduction
2. Field-Monitoring Information of CMUR in Shigetai Coal Mine
2.1. Geological Conditions for Shigetai CMUR
2.2. Monitoring Principle
2.3. General Installation Information
3. Field-Monitoring Results and Analysis
3.1. Overview of Field Monitoring
3.2. CPD Field-Monitoring Results Analysis
3.2.1. Goaf 31201
3.2.2. Goaf 31203
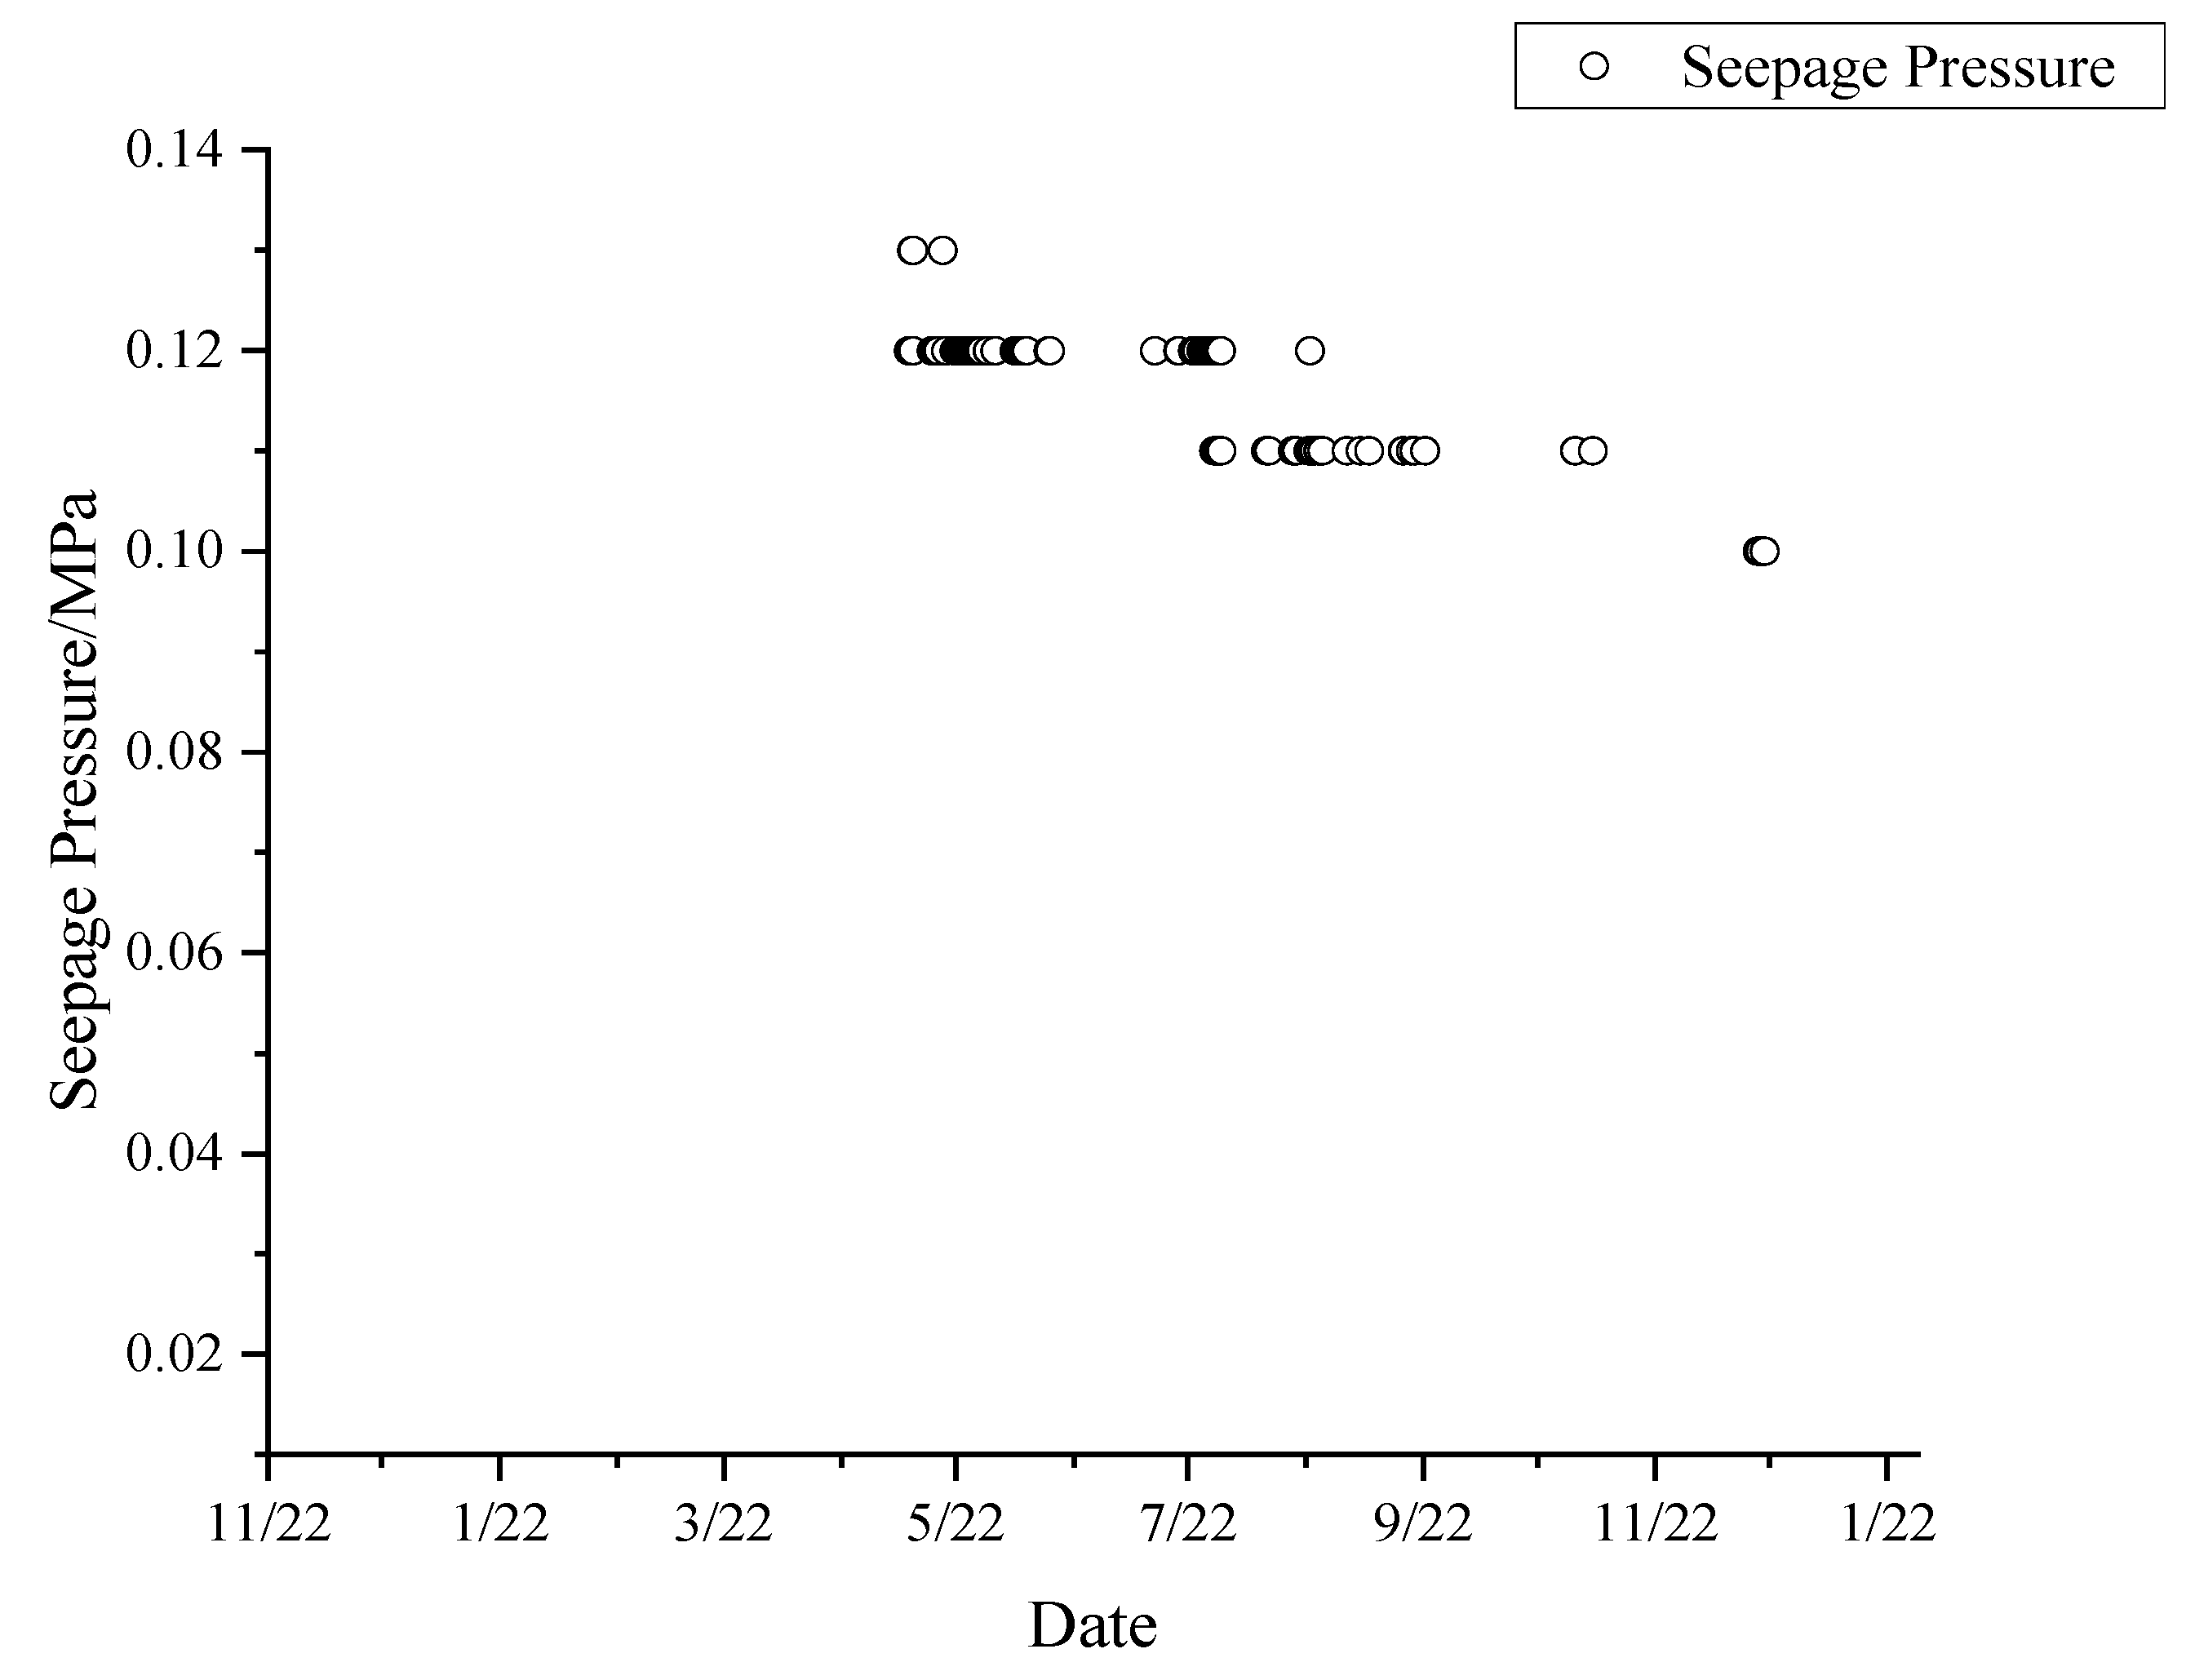
3.3. AD Field-Monitoring Results Analysis
3.3.1. Goaf 31201
3.3.2. Goaf 31203
4. Early-Warning Model of CPD and AD
4.1. Basic Introduction and Theory for the Early-Warning Model of CPD and AD
4.1.1. Analytic Hierarchy Process (AHP) Method Introduction
4.1.2. Objective Weight and Total Weight Calculation
4.1.3. Membership Function Method [22]
4.2. Early Warning of CPD in Shigetai CMUR
4.2.1. Single-Parameter Warning Values
4.2.2. Subjective Weights θi Determination
4.2.3. Standard Evaluation Matrix Establishment kih
4.2.4. Objective Weight Determination and Field Verification
- (1)
- Calculation parameter selection for the Shigetai CMUR;
- (2)
- Total weight wi calculation;
- (3)
- Membership function calculation and eigenvalue determination.
4.3. Early Warning of AD in Shegetai CMUR
4.3.1. Single-Parameter Warning Values
4.3.2. Subjective Weights θi Determination
4.3.3. Objective Weight Determination and Field Verification
- (1)
- Calculation parameter selection for the Shigetai CMUR;
- (2)
- Total weight wi calculation;
- (3)
- Membership function calculation and eigenvalue determination.
5. Conclusions
Author Contributions
Funding
Institutional Review Board Statement
Informed Consent Statement
Data Availability Statement
Conflicts of Interest
References
- Gu, D.Z.; Cao, Z.G.; Li, J.F.; Wu, B.Y.; Zhang, Y.; Jiang, B.B.; Guo, Q.; Wang, H.P.; Wu, Y.; Shi, X.M.; et al. Original Experimental Platform System and Application of Underground Coal Mine Reservoirs. J. China Coal Soc. 2024, 49, 100–113. [Google Scholar]
- Gu, D.Z. Water resource and surface ecology protection technology of modern coal mining in China’s energy “Golden Triangle”. Eng. Sci. 2013, 15, 102–107. [Google Scholar]
- Gu, D.Z. Theory framework and technological system of coal mine underground reservoir. J. China Coal Soc. 2015, 40, 239–246. [Google Scholar]
- Gu, D.Z.; Zhang, Y.; Cao, Z.G. Technical progress of water resource protection and utilization by coal mining in China. Coal Sci. Technol. 2016, 44, 1–7. [Google Scholar]
- Gu, D.Z.; Li, J.F.; Cao, Z.G.; Wu, B.Y.; Jiang, B.B.; Yang, Y.; Yang, J.; Chen, Y.P. Technology and engineering development strategy of water protection and utilization of coal mine in China. J. China Coal Soc. 2021, 46, 3079–3089. [Google Scholar] [CrossRef]
- Chen, S.S.; Huang, Q.X.; Xue, G.; Li, R.Q. Technology of underground reservoir construction and water resource utilization in Daliuta Coal Mine. Coal Sci. Technol. 2016, 44, 21–28. [Google Scholar]
- Wen, Z.J.; Jiang, P.F.; Song, Z.Q.; Jiang, Y.J.; Wen, J.H.; Jing, S.L. Structural model and capacity determination of underground reservoir in goaf: A case study of Shendong mining area in China. Geomech. Geophys. Geo-Energy Geo-Resour. 2023, 9, 143. [Google Scholar] [CrossRef]
- Yao, Q.L.; Tang, C.J.; Xia, Z.; Liu, X.L.; Zhu, L.; Chong, Z.H.; Hui, X.D. Mechanisms of failure in coal samples from underground water reservoir. Eng. Geol. 2020, 267, 105494. [Google Scholar] [CrossRef]
- Wang, B.F.; Xing, J.C.; Liang, B.; Zhang, J. Experimental study on deformation characteristics of rock and coal under stress-fluid interactions in coal mine underground water reservoir. Energy Sources Part A Recovery Util. Environ. Eff. 2020, 46, 1760968. [Google Scholar] [CrossRef]
- Gu, D.Z.; Yan, Y.G.; Zhang, Y.; Wang, E.Z.; Cao, Z.G. Experimental study and numerical simulation for dynamic response of coal pillars in coal mine underground reservoir. J. China Coal Soc. 2016, 41, 1589–1597. [Google Scholar]
- Zhang, B.; Ni, W.; Hao, X.Q.; Li, H.Q.; Shen, Y.P. A Study on the Development and Evolution of Fractures in the Coal Pillar Dams of Underground Reservoirs in Coal Mines and Their Optimum Size. Processes 2023, 11, 1677. [Google Scholar] [CrossRef]
- Fan, J.Y.; Li, Z.; Feng, G.R.; Zhang, H.D.; Qi, C.E.; Zhang, J.Y. Failure analysis of coal pillars and overburden from underground water reservoir under the mining-water invasion coupling effect. Eng. Fail. Anal. 2023, 151, 107406. [Google Scholar] [CrossRef]
- Fang, J. Study on Deformation Failure Mechanism and Stability Evaluation of Artificial Dam of Underground Reservoir in Coal Mine. Ph.D. Thesis, China University of Mining and Technology (Beijing), Beijing, China, 2021. [Google Scholar]
- Kong, X.S.; Xu, Z.Z.; Shan, R.L.; Liu, S.; Xiao, S.C. Investigation on groove depth of artificial dam of underground reservoir in coal mines. Environ. Earth Sci. 2021, 80, 214. [Google Scholar] [CrossRef]
- Ma, J.P.; Zhang, G.C.; Zhou, G.L.; Zhang, Y.; Meng, X.J.; Zhao, Y.Q.; Chen, M. Stability analysis of artificial dam in coal mine underground water reservoir based on the hydro-mechanical damage model. Geomat. Nat. Hazards Risk 2023, 14, 2190855. [Google Scholar] [CrossRef]
- Bai, D.Y.; Ju, J.F.; Xu, J.L.; Li, J.H. Stability analysis of mine underground reservoir artificial dam in Lijiahao Mine. J. China Coal Soc. 2017, 42, 1839–1845. [Google Scholar]
- Wang, B.F.; Liang, B.; Wang, J.G.; Sun, K.M.; Sun, W.J.; Chi, H.B. Experiment study on rock bulking of coal mine underground reservoir. Rock Soil Mech. 2018, 39, 4086–4101. [Google Scholar]
- Chi, M.B.; Wu, B.Y.; Cao, Z.G.; Li, P.; Liu, X.Q.; Li, H.X.; Zhang, Y.; Yang, Y. Research on Instability Mechanism and Precursory Information of Coal Pillar Dam of Underground Reservoir in Coal Mine. Coal Sci. Technol. 2023, 51, 36–49. [Google Scholar]
- Chi, M.B.; Li, P.; Cao, Z.G.; Wu, Y.; Zhang, Y.; Li, H.X.; Wu, B.Y. Seismic performance analysis of flat artificial dam of underground reservoir in coal mine. J. China Coal Soc. 2023, 48, 1179–1191. [Google Scholar]
- Wang, P.T.; Qi, Z.W.; Ma, C.; Cai, M.F. Anisotropic behavior of the seepage-stress coupling mechanical model of coal pillars of underground reservoirs. Geomech. Geophys. Geo-Energy Geo-Resour. 2023, 9, 3. [Google Scholar] [CrossRef]
- Chen, S.Y. Sustainable development trend forecast theory and method of water resources system based on variable sets. J. Dalian Univ. Technol. 2013, 53, 108–113. [Google Scholar]
- Zhang, S.R.; Zhang, F.H.; Sa, W.Q.; Du, C.B.; Xue, L. Development of A Variable Sets-based Method and System for Dynamic Evaluation of Slope's Observed Behavior. China Saf. Sci. J. 2013, 23, 132–138. [Google Scholar]

| No. | Device/Method Name | Installation Area and Device Name | Parameters | Accuracy |
|---|---|---|---|---|
| 1 | Strain Gauge | 4 on each AD | Measurement Range: 0–3000 με | Resolution: ±0.1 με |
| 2 | Osmometer | 2 on each CPD | Measurement Range: 0–0.5 MPa | Accuracy: ±0.5% F.S |
| 3 | Stress Gauge | 2 on each CPD | Measurement Range: 0–30 MPa | Accuracy: ±0.5% F.S |
| 4 | Fiber Optic Pressure Sensor | 1 on the AD in each goaf | Measurement Range: 0–0.5 MPa | Accuracy: ±0.5% F.S |
| 5 | Micro-seismic Sensor | 1 on the AD in each goaf | Frequency Range: 0.5–200 Hz | Sensitivity: 10−3 m/s2 @ 30 Hz |
| 6 | Water-Measuring Weir Meter | 1 on the AD in each goaf | Flow Rate Range: 0–2 m3/s | Accuracy: ±2% |
| 7 | Direct current (DC) detection | Each CPD in 31203 goaf | Depth Detection: up to 50 m | Accuracy: ±5% |
| Evaluation Set u | Standardized Marking Criteria | Setting Accordance | |||||||||||||||
|---|---|---|---|---|---|---|---|---|---|---|---|---|---|---|---|---|---|
| 0 | 0.1 | 0.2 | 0.3 | 0.4 | 0.5 | 0.6 | 0.7 | 0.8 | 0.9 | 1.0 | |||||||
| Graded Indicators for CPD | |||||||||||||||||
| Goal | Criteria | Alternatives | Safe | Relatively Safe | Mildly Hazardous | Hazardous | |||||||||||
| A1 Early Warning of CPD in Shigetai CMUR | B1 Design Parameters | x1 CPD width/m | ≥30 | 20~30 | 10~20 | ≤10 | Numerical Simulation | ||||||||||
| x2 CPD height/m | ≤3.5 | 3.5~5.0 | 5.0~7.0 | ≥7.0 | Numerical Simulation | ||||||||||||
| x3 CMUR burial depth/m | ≤100 | 100~200 | 200~500 | ≥500 | Numerical Simulation | ||||||||||||
| B2 Occurrence Conditions | x4 Elastic Modulus/GPa | ≥40 | 8~40 | 1~8 | ≤1 | Lab test | |||||||||||
| x5 Compressive Strength/MPa | ≥40 | 15~40 | 10~15 | ≤10 | Lab test | ||||||||||||
| x6 Dip Angle of Coal Seam/° | 0~3 | 3~18 | 18~36 | 36~90 | Similar Simulation | ||||||||||||
| x7 Hydraulic Conductivity/cm·s−1 | <10−10 | 10−10~10−8 | 10−8~10−4 | ≥10−4 | Similar Simulation | ||||||||||||
| x8 Seismicity and Mining-induced response | No mining activity, no mine earthquake | No mining activity, rare mine earthquake | Mining activity exists, medium mine earthquake frequency | Constant mining activity, frequent mine earthquake | Field Monitoring | ||||||||||||
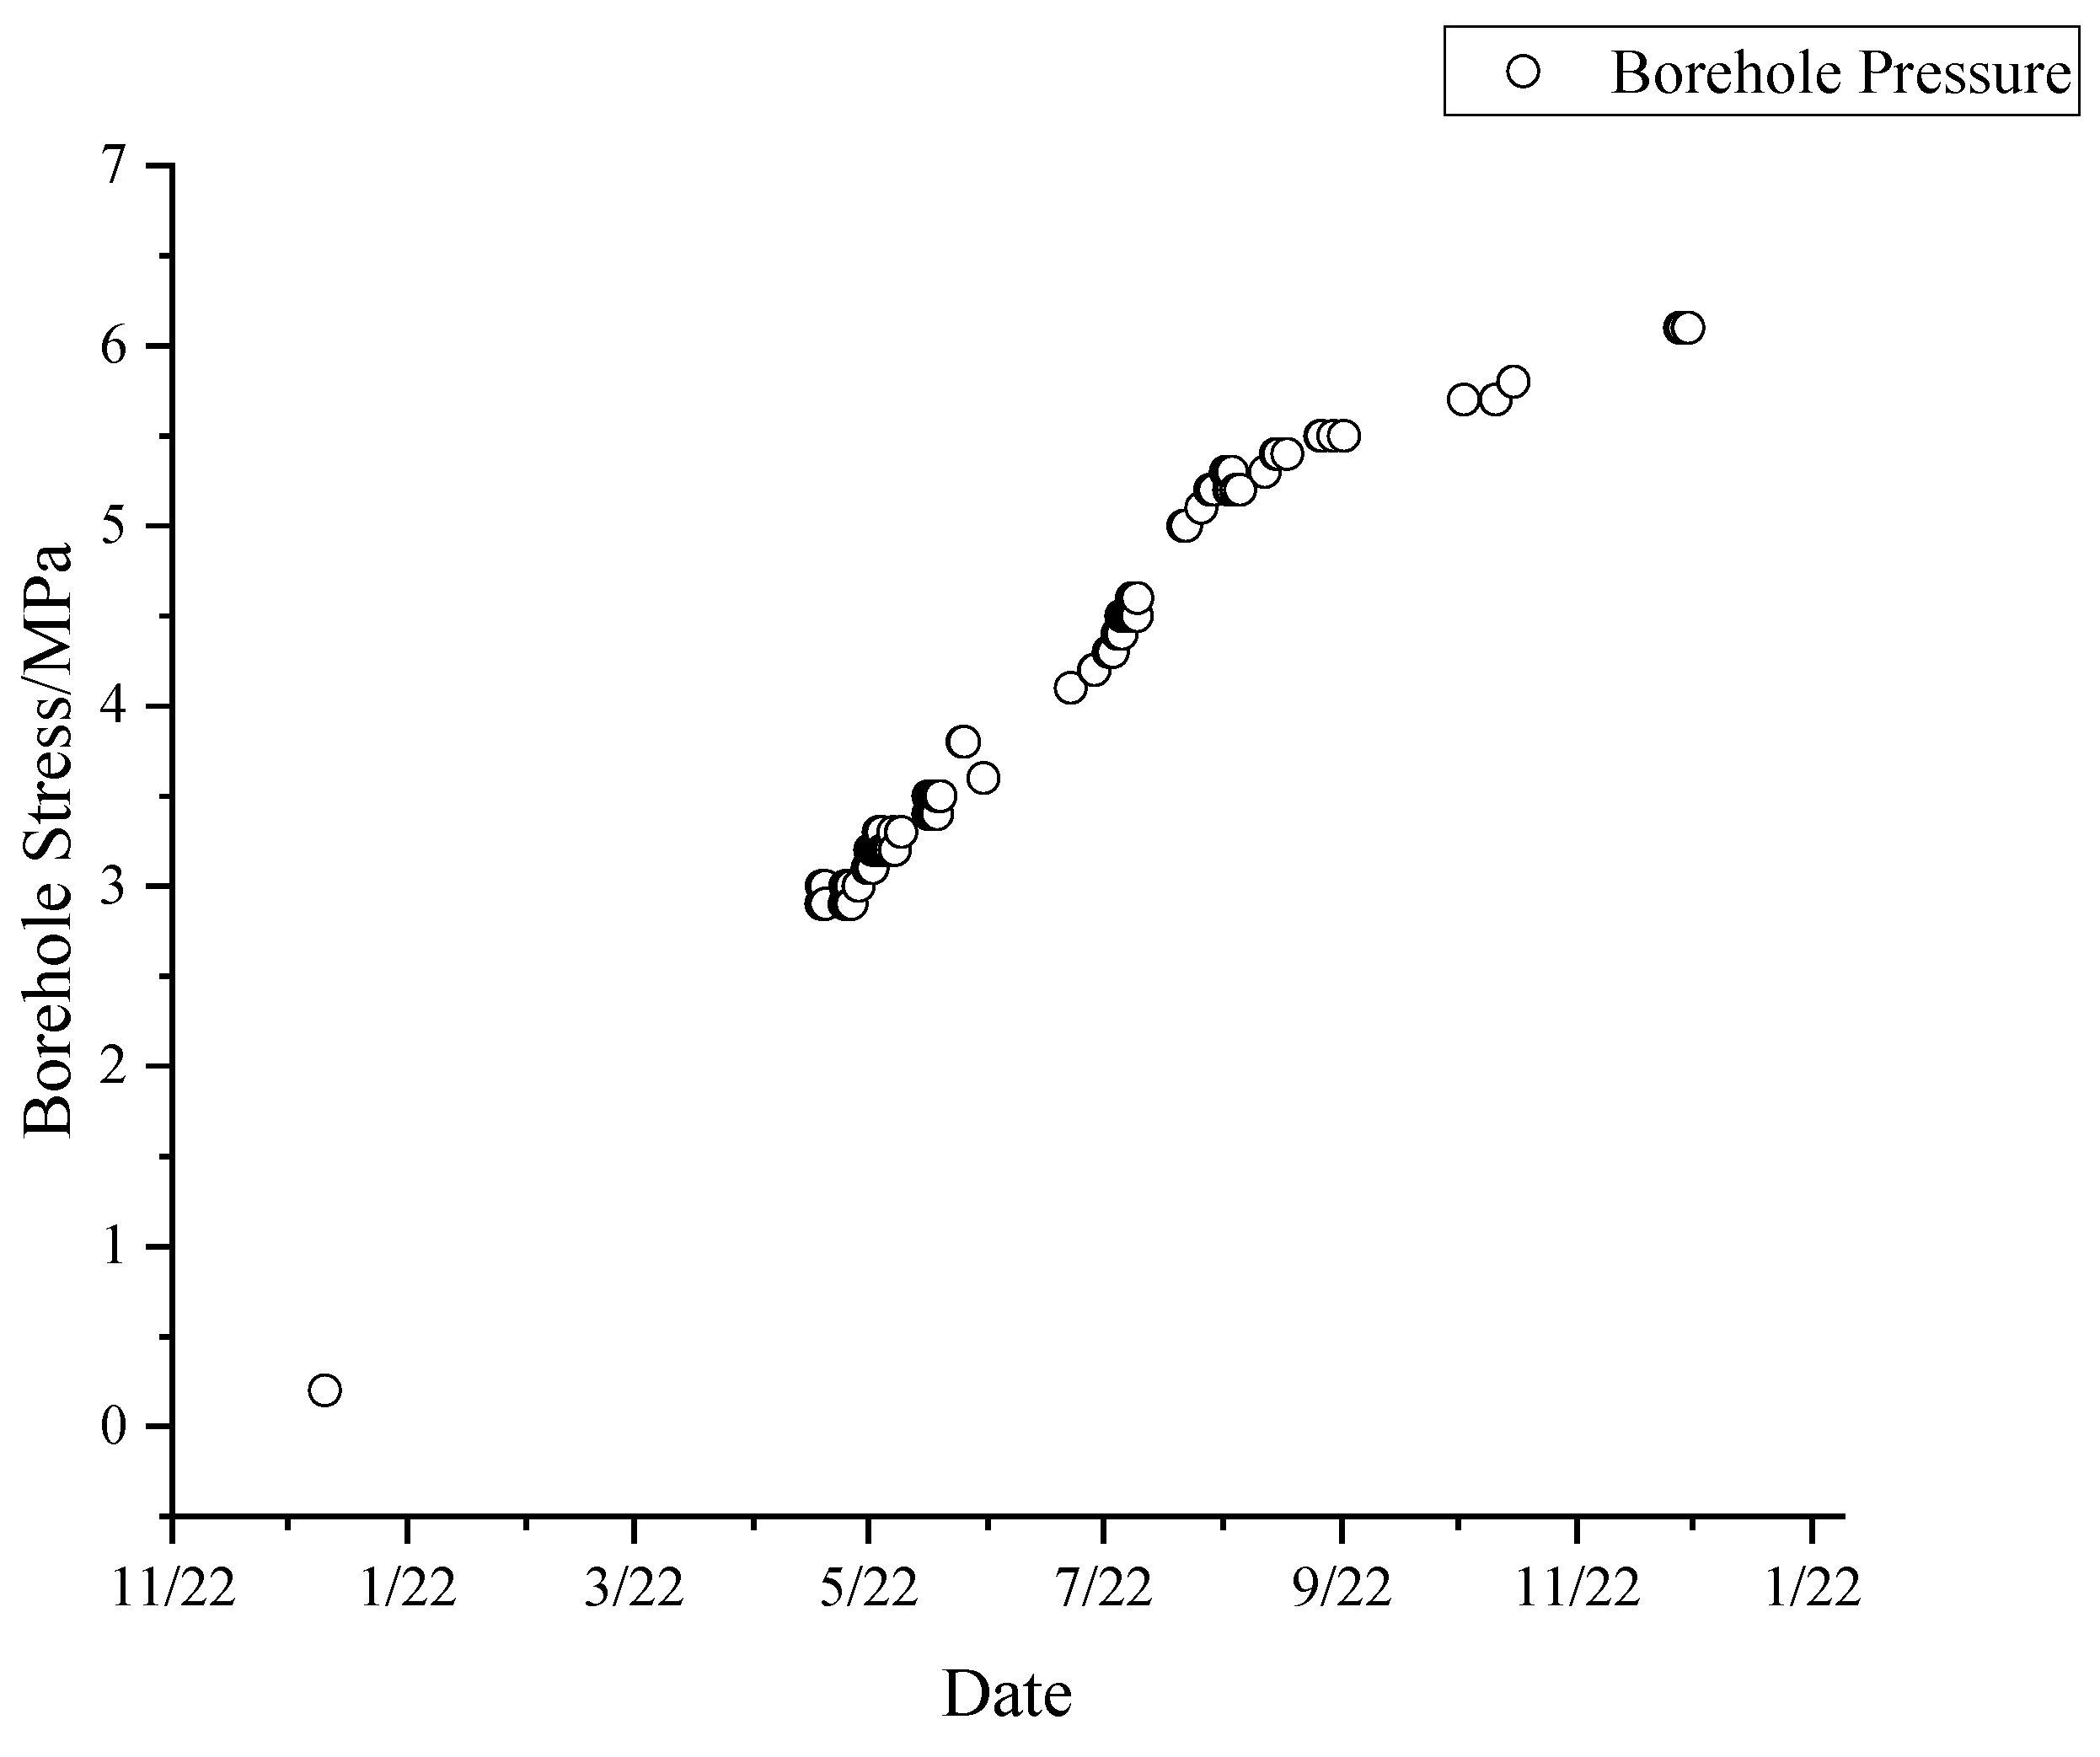
| B3 Deformation Parameters | x9 Borehole Pressure/MPa | ≤5 | 5~10 | 10~20 | ≥20 | Field Monitoring | |||||||||||
| x10 Vibration speed/mm·s−1 | ≤1.5 | 1.5~3 | 3~6 | ≥6 | Small Probability Event | ||||||||||||
| B4 Seepage Parameters | x11 Seepage Pressure/MPa | ≤0.2 | 0.2~0.4 | 0.4~1.0 | ≥1.0 | Field Monitoring | |||||||||||
| x12 Underground Water Level/m | ≤3 | 3~6 | 6~10 | ≥10 | Field Monitoring | ||||||||||||
| x13 Daily Fluctuations of Water Level/m·d−1 | ≤0.6 | 0.6~1.2 | 1.2~2.4 | ≥2.4 | Small Probability Event | ||||||||||||
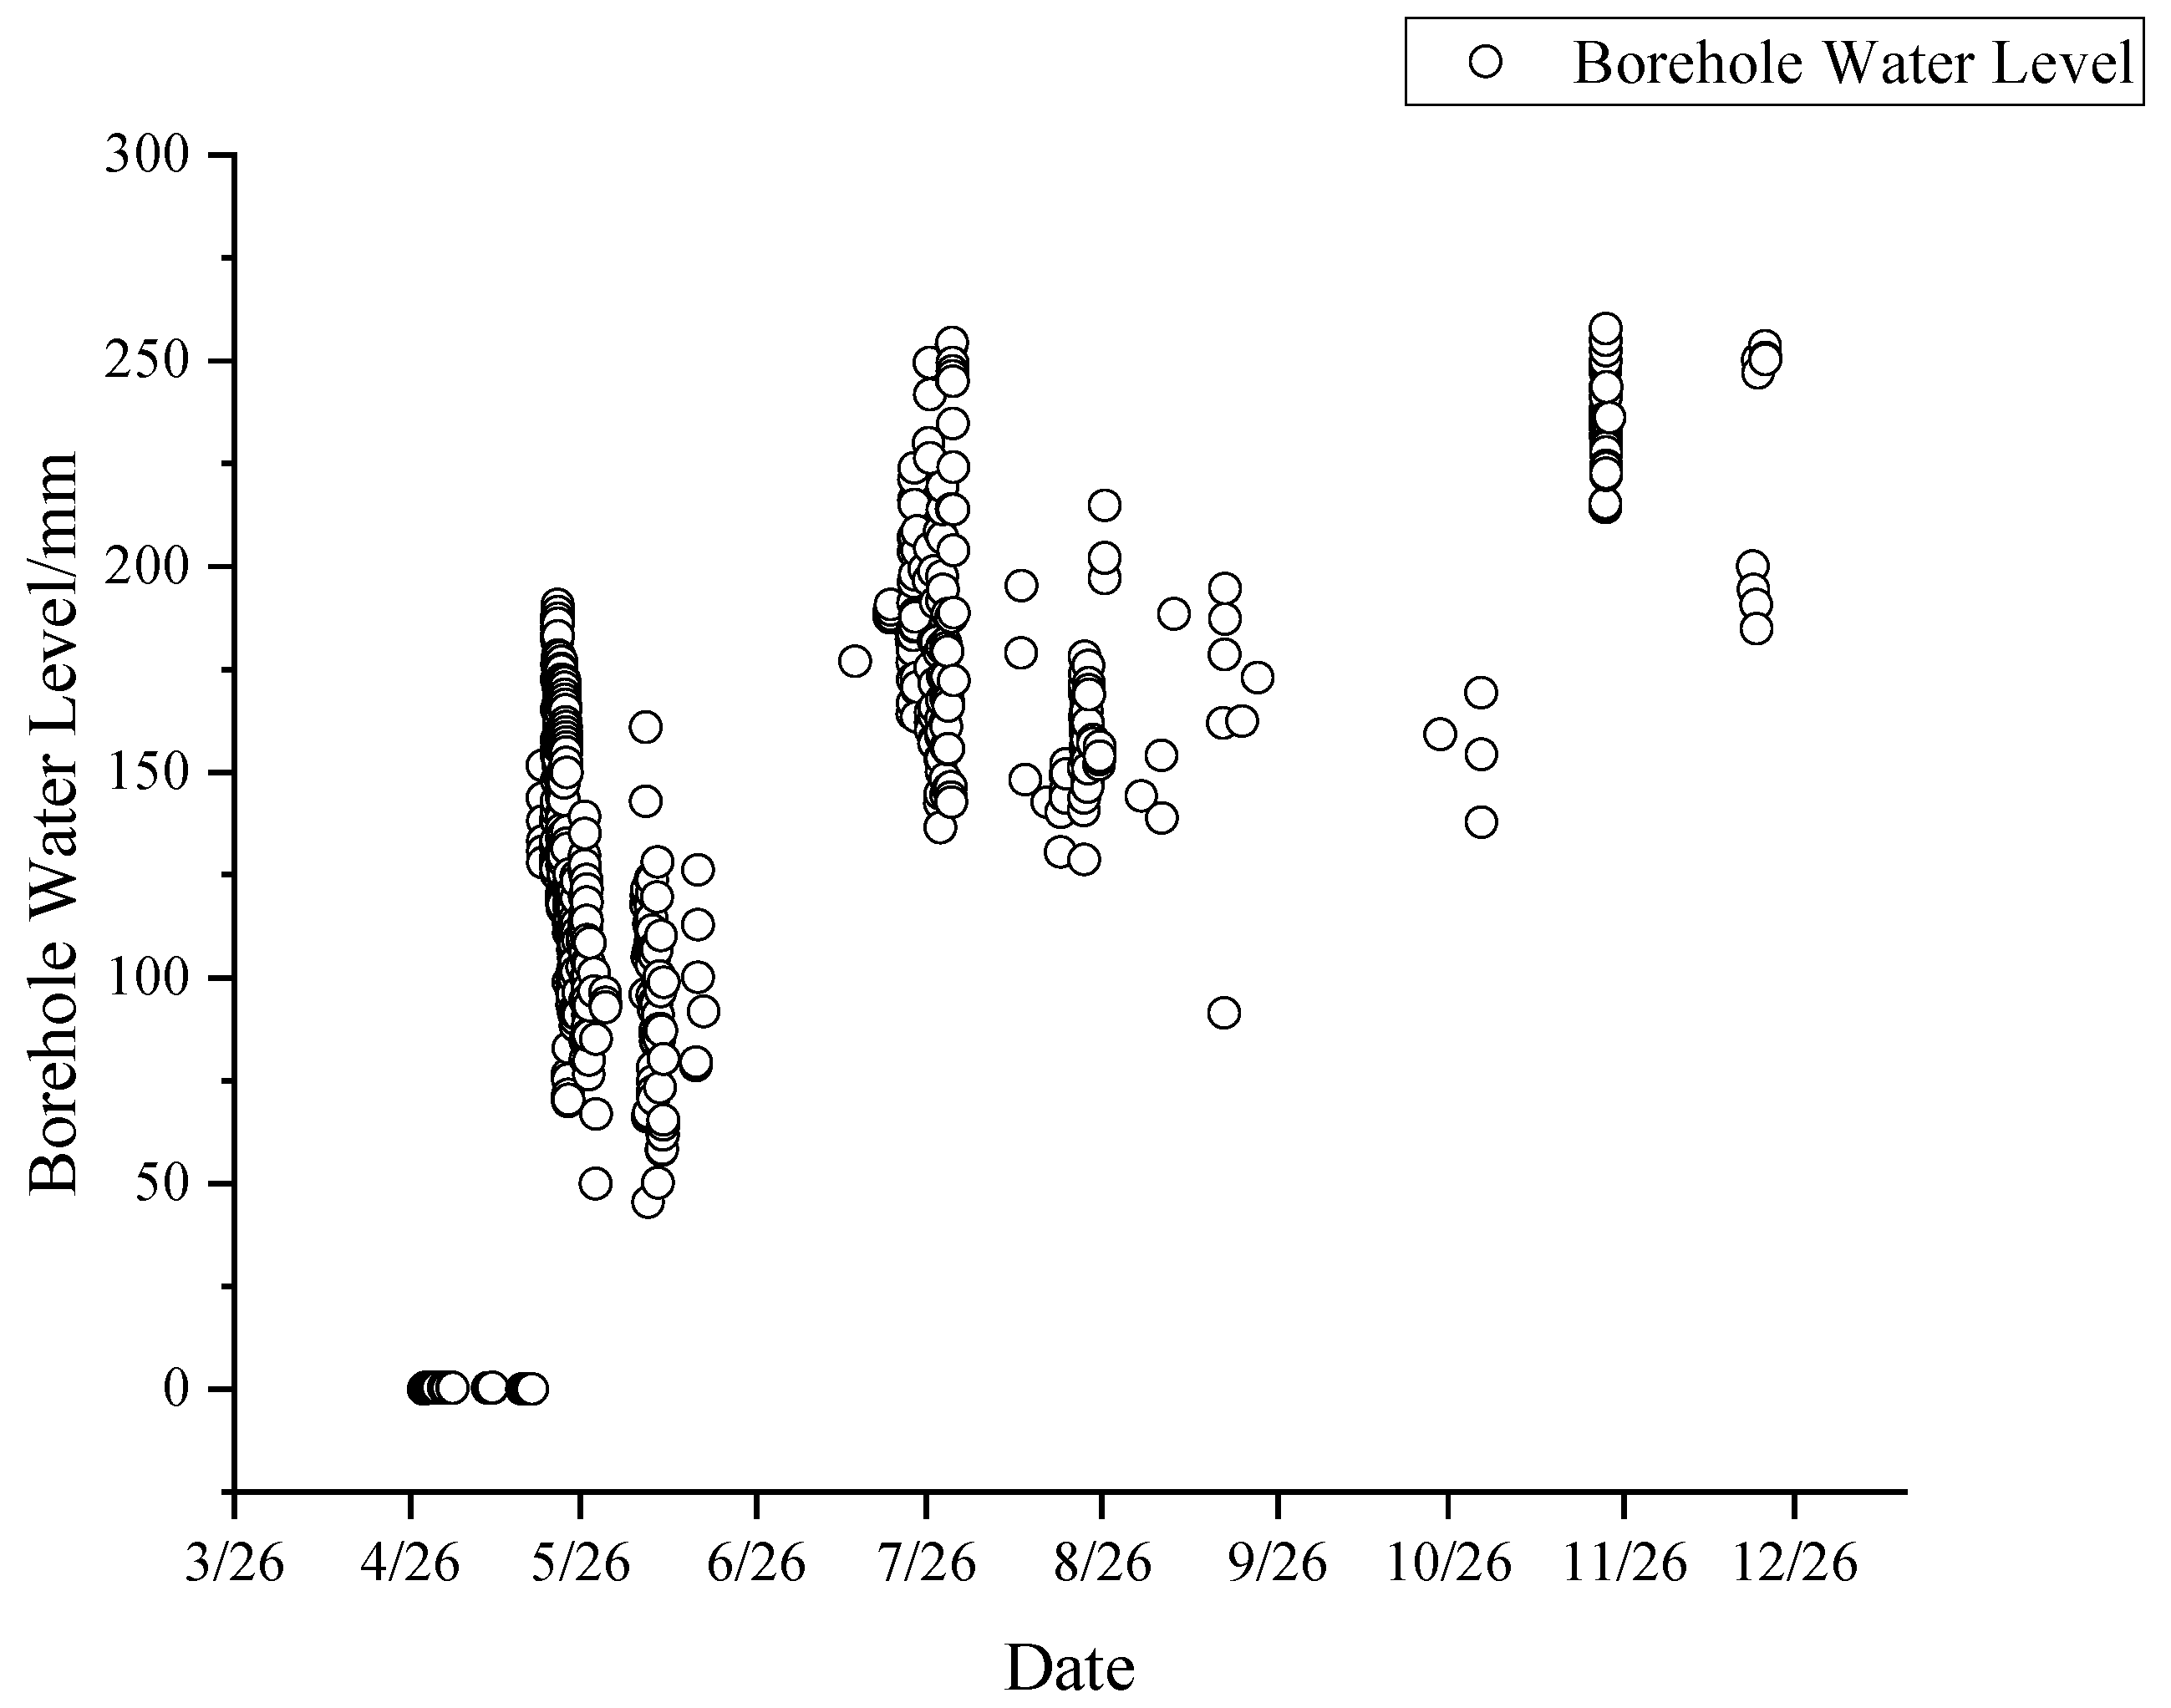
| x14 Borehole Water Level/mm | ≤300 | 300~600 | 600~900 | ≥900 | Confidence Interval | ||||||||||||
| x15 Leakage Points within single CPD | ≤1 | 1~3 | 3~5 | ≥5 | Confidence Interval | ||||||||||||
| Goal | Criteria | Weight | Alternatives | Weight | Subjective Weight θi |
|---|---|---|---|---|---|
| A1 Early Warning of CPD in Shigetai CMUR | B1 Design Parameters | 0.0516 | x1 CPD width | 0.1429 | 0.0074 |
| x2 CPD height | 0.1429 | 0.0074 | |||
| x3 CMUR burial depth | 0.7143 | 0.0369 | |||
| B2 Occurrence Conditions | 0.5289 | x4 Elastic Modulus | 0.3438 | 0.1818 | |
| x5 Compressive Strength | 0.3438 | 0.1818 | |||
| x6 Dip Angle of Coal Seam | 0.1287 | 0.0681 | |||
| x7 Hydraulic Conductivity | 0.1287 | 0.0681 | |||
| x8 Seismicity and Mining-induced response | 0.0550 | 0.0291 | |||
| B3 Deformation Parameters | 0.2097 | x9 Borehole Pressure | 0.8333 | 0.1747 | |
| x10 Vibration speed | 0.1667 | 0.0350 | |||
| B4 Seepage Parameters | 0.2097 | x11 Seepage Pressure | 0.0800 | 0.0168 | |
| x12 Underground Water Level | 0.3525 | 0.0739 | |||
| x13 Daily Fluctuations of Water Level | 0.1676 | 0.0351 | |||
| x14 Borehole Water Level | 0.0474 | 0.0099 | |||
| x15 Leakage Points within single CPD | 0.3525 | 0.0739 |
| Alternatives | Safe | Relatively Safe | Mildly Hazardous | Hazardous | ||||
|---|---|---|---|---|---|---|---|---|
| ai1 | bi1 | ai2 | bi2 | ai3 | bi3 | ai4 | bi4 | |
| x1 CPD width index | 0 | 10 | 20 | 30 | 40 | |||
| x2 CPD height | 0 | 3.5 | 5.0 | 7.0 | 10 | |||
| x3 CMUR burial depth | 0 | 100 | 200 | 500 | 100 | |||
| x4 Elastic Modulus index | 0 | 20 | 52 | 59 | 60 | |||
| x5 Compressive Strength index | 0 | 20 | 45 | 50 | 60 | |||
| x6 Dip Angle of Coal Seam | 0 | 3 | 18 | 36 | 90 | |||
| x7 Hydraulic Conductivity | 0 | 10−10 | 10−8 | 10−4 | 1 | |||
| x8 Seismicity and Mining-induced response | 0 | 0.25 | 0.5 | 0.75 | 1 | |||
| x9 Borehole Pressure | 0 | 5 | 10 | 20 | 30 | |||
| x10 Vibration speed | 0 | 1.5 | 3 | 6 | 9 | |||
| x11 Seepage Pressure | 0 | 0.2 | 0.4 | 1.0 | 2.0 | |||
| x12 Underground Water Level | 0 | 3 | 6 | 10 | 15 | |||
| x13 Daily Fluctuations of Water Level | 0 | 0.6 | 1.2 | 2.4 | 3.6 | |||
| x14 Borehole Water Level | 0 | 300 | 600 | 900 | 1500 | |||
| x15 Leakage Points within single CPD | 0 | 1 | 3 | 5 | 10 | |||
| 31201-4# | 31202-4# | 31203-1# | 31204-3# | 31205-1# | |
|---|---|---|---|---|---|
| x1 CPD width index | 20 | ||||
| x2 CPD height | 3.4 | ||||
| x3 CMUR burial depth | 120 | ||||
| x4 Elastic Modulus index | 52.5 | ||||
| x5 Compressive Strength index | 44.1 | ||||
| x6 Dip Angle of Coal Seam | 3 | ||||
| x7 Hydraulic Conductivity | 10−9 | ||||
| x8 Seismicity and Mining-induced response | Mining activity exists, no mining earthquake = 0.6 | ||||
| x9 Borehole Pressure | 0 | 0 | 6.1 | 0 | 0.1 |
| x10 Vibration speed | 0 | 2.06 | 0 | 0 | 0 |
| x11 Seepage Pressure | 0.04 | 0.08 | 0.1 | 0.12 | 0.19 |
| x12 Underground Water Level | 0.78 | 4.97 | 4.00 | 2.90 | 4.04 |
| x13 Daily Fluctuations of Water Level | 0 | 0.20 | 0.90 | 0.34 | 0.1 |
| x14 Borehole Water Level | 119 | 550.7 | 374.8 | 423.5 | 300 |
| x15 Leakage Points within single CPD | 0 | 1 | 3 | 0 | 1 |
| 31201-4# | 31202-4# | 31203-1# | 31204-3# | 31205-1# | |
|---|---|---|---|---|---|
| x1 CPD width index | 0.0107 | 0.0096 | 0.0086 | 0.0103 | 0.0099 |
| x2 CPD height | 0.0071 | 0.0063 | 0.0057 | 0.0068 | 0.0065 |
| x3 CMUR burial depth | 0.0393 | 0.0350 | 0.0316 | 0.0377 | 0.0361 |
| x4 Elastic Modulus index | 0.2702 | 0.2406 | 0.2170 | 0.2591 | 0.2483 |
| x5 Compressive Strength index | 0.2608 | 0.2322 | 0.2094 | 0.2500 | 0.2396 |
| x6 Dip Angle of Coal Seam | 0.0659 | 0.0587 | 0.0529 | 0.0632 | 0.0606 |
| x7 Hydraulic Conductivity | 0.0824 | 0.0734 | 0.0662 | 0.0790 | 0.0757 |
| x8 Seismicity and Mining-induced response | 0.0479 | 0.0426 | 0.0385 | 0.0459 | 0.0440 |
| x9 Borehole Pressure | 0.0845 | 0.0753 | 0.1507 | 0.0811 | 0.0792 |
| x10 Vibration speed | 0.0169 | 0.0358 | 0.0136 | 0.0162 | 0.0156 |
| x11 Seepage Pressure | 0.0098 | 0.0101 | 0.0098 | 0.0125 | 0.0146 |
| x12 Underground Water Level | 0.0451 | 0.0846 | 0.0670 | 0.0674 | 0.0771 |
| x13 Daily Fluctuations of Water Level | 0.0170 | 0.0202 | 0.0341 | 0.0255 | 0.0182 |
| x14 Borehole Water Level | 0.0067 | 0.0121 | 0.0087 | 0.0111 | 0.0088 |
| x15 Leakage Points within single CPD | 0.0358 | 0.0637 | 0.0862 | 0.0343 | 0.0657 |
| h = 1 | h = 2 | h = 3 | h = 4 | |
|---|---|---|---|---|
| x1 CPD width index | 0.000 | 0.500 | 0.000 | 0.000 |
| x2 CPD height | 0.514 | 0.000 | 0.000 | 0.000 |
| x3 CMUR burial depth | 0.300 | 0.000 | 0.000 | 0.000 |
| x4 Elastic Modulus index | 0.000 | 0.429 | 0.000 | 0.000 |
| x5 Compressive Strength index | 0.000 | 0.536 | 0.000 | 0.000 |
| x6 Dip Angle of Coal Seam | 0.500 | 0.000 | 0.000 | 0.000 |
| x7 Hydraulic Conductivity | 0.000 | 1.000 | 0.000 | 0.000 |
| x8 Seismicity and Mining-induced response | 0.000 | 0.100 | 0.000 | 0.000 |
| x9 Borehole Pressure | 1.000 | 0.000 | 0.000 | 0.000 |
| x10 Vibration speed | 1.000 | 0.000 | 0.000 | 0.000 |
| x11 Seepage Pressure | 0.900 | 0.000 | 0.000 | 0.000 |
| x12 Underground Water Level | 0.870 | 0.000 | 0.000 | 0.000 |
| x13 Daily Fluctuations of Water Level | 1.000 | 0.000 | 0.000 | 0.000 |
| x14 Borehole Water Level | 0.802 | 0.000 | 0.000 | 0.000 |
| x15 Leakage Points within single CPD | 1.000 | 0.000 | 0.000 | 0.000 |
| 31201-4# Integrated Relative Affiliation | 31201-4# Eigenvalue H(u) | Warning Level | ||||
|---|---|---|---|---|---|---|
| h | 1 | 2 | 3 | 4 | ||
| α = 1, p = 1 | 0.256 | 0.348 | 0.000 | 0.000 | 0.952 | I |
| α = 2, p = 1 | 0.106 | 0.222 | 0.000 | 0.000 | 0.550 | I |
| α = 1, p = 2 | 0.218 | 0.454 | 0.000 | 0.000 | 1.127 | II |
| α = 2, p = 2 | 0.072 | 0.409 | 0.000 | 0.000 | 0.891 | I |
| 31202-4# integrated relative affiliation | 31202-4# eigenvalue H(u) | Warning Level | ||||
| h | 1 | 2 | 3 | 4 | ||
| α = 1, p = 1 | 0.175 | 0.391 | 0.000 | 0.000 | 0.956 | I |
| α = 2, p = 1 | 0.043 | 0.291 | 0.000 | 0.000 | 0.625 | I |
| α = 1, p = 2 | 0.194 | 0.463 | 0.000 | 0.000 | 1.120 | II |
| α = 2, p = 2 | 0.055 | 0.427 | 0.000 | 0.000 | 0.908 | I |
| 31203-1# integrated relative affiliation | 31203-1# eigenvalue H(u) | Warning Level | ||||
| h | 1 | 2 | 3 | 4 | ||
| α = 1, p = 1 | 0.105 | 0.383 | 0.000 | 0.000 | 0.871 | I |
| α = 2, p = 1 | 0.014 | 0.278 | 0.000 | 0.000 | 0.570 | I |
| α = 1, p = 2 | 0.105 | 0.459 | 0.000 | 0.000 | 1.023 | II |
| α = 2, p = 2 | 0.014 | 0.418 | 0.000 | 0.000 | 0.850 | I |
| 31204-3# integrated relative affiliation | 31204-3# eigenvalue H(u) | Warning Level | ||||
| h | 1 | 2 | 3 | 4 | ||
| α = 1, p = 1 | 0.228 | 0.348 | 0.000 | 0.000 | 0.925 | I |
| α = 2, p = 1 | 0.081 | 0.222 | 0.000 | 0.000 | 0.524 | I |
| α = 1, p = 2 | 0.209 | 0.454 | 0.000 | 0.000 | 1.118 | II |
| α = 2, p = 2 | 0.065 | 0.409 | 0.000 | 0.000 | 0.884 | I |
| 31205-1# integrated relative affiliation | 31205-1# eigenvalue H(u) | Warning Level | ||||
| h | 1 | 2 | 3 | 4 | ||
| α = 1, p = 1 | 0.198 | 0.348 | 0.000 | 0.000 | 0.894 | I |
| α = 2, p = 1 | 0.057 | 0.222 | 0.000 | 0.000 | 0.501 | I |
| α = 1, p = 2 | 0.196 | 0.454 | 0.000 | 0.000 | 1.105 | II |
| α = 2, p = 2 | 0.056 | 0.409 | 0.000 | 0.000 | 0.874 | I |
| Evaluation Set u | Standardized Marking Criteria | Setting Accordance | |||||||||||||
|---|---|---|---|---|---|---|---|---|---|---|---|---|---|---|---|
| 0 | 0.1 | 0.2 | 0.3 | 0.4 | 0.5 | 0.6 | 0.7 | 0.8 | 0.9 | 1 | |||||
| Graded Indicators for AD | |||||||||||||||
| Goal | Criteria | Goal | Safe | Relatively Safe | Mildly Hazardous | Hazardous | |||||||||
| A2 Early Warning of AD in Shigetai CMUR | B1 management system | x1 Construction Quality | Good construction quality, complete documentation | Satisfactory construction quality, generally complete documentation | Average construction quality, loss of documentation | Bad construction quality, no documentation | Expert advice | ||||||||
| x2 Operation and Maintenance System | Well-established daily inspections system | Basically completed daily inspection system | Daily inspection system to be improved | No daily inspection system | Expert advice | ||||||||||
| B2 Parameters of the dam body | x3 Dam concrete marking | ≥C25 | C20~ C25 | C15~ C20 | ≤C15 | Similar Simulation | |||||||||
| x4 Dam Height/m | ≤4 | 4~6 | 6~8 | ≥8 | Numerical Simulation | ||||||||||
| x5 Dam Embedding Depth/m | ≥1.0 | 0.5~1.0 | 0.1~0.5 | ≤0.1 | Numerical Simulation | ||||||||||
| x6 CMUR burial depth/m | ≤100 | 100~200 | 200~500 | ≥500 | Numerical Simulation | ||||||||||
| x7 Seismicity and Mining-induced response | No mining activity, no mine earthquake | No mining activity, rare mine earthquake | Mining activity exists, medium mine earthquake frequency | Constant mining activity, frequent mine earthquake | Expert advice | ||||||||||
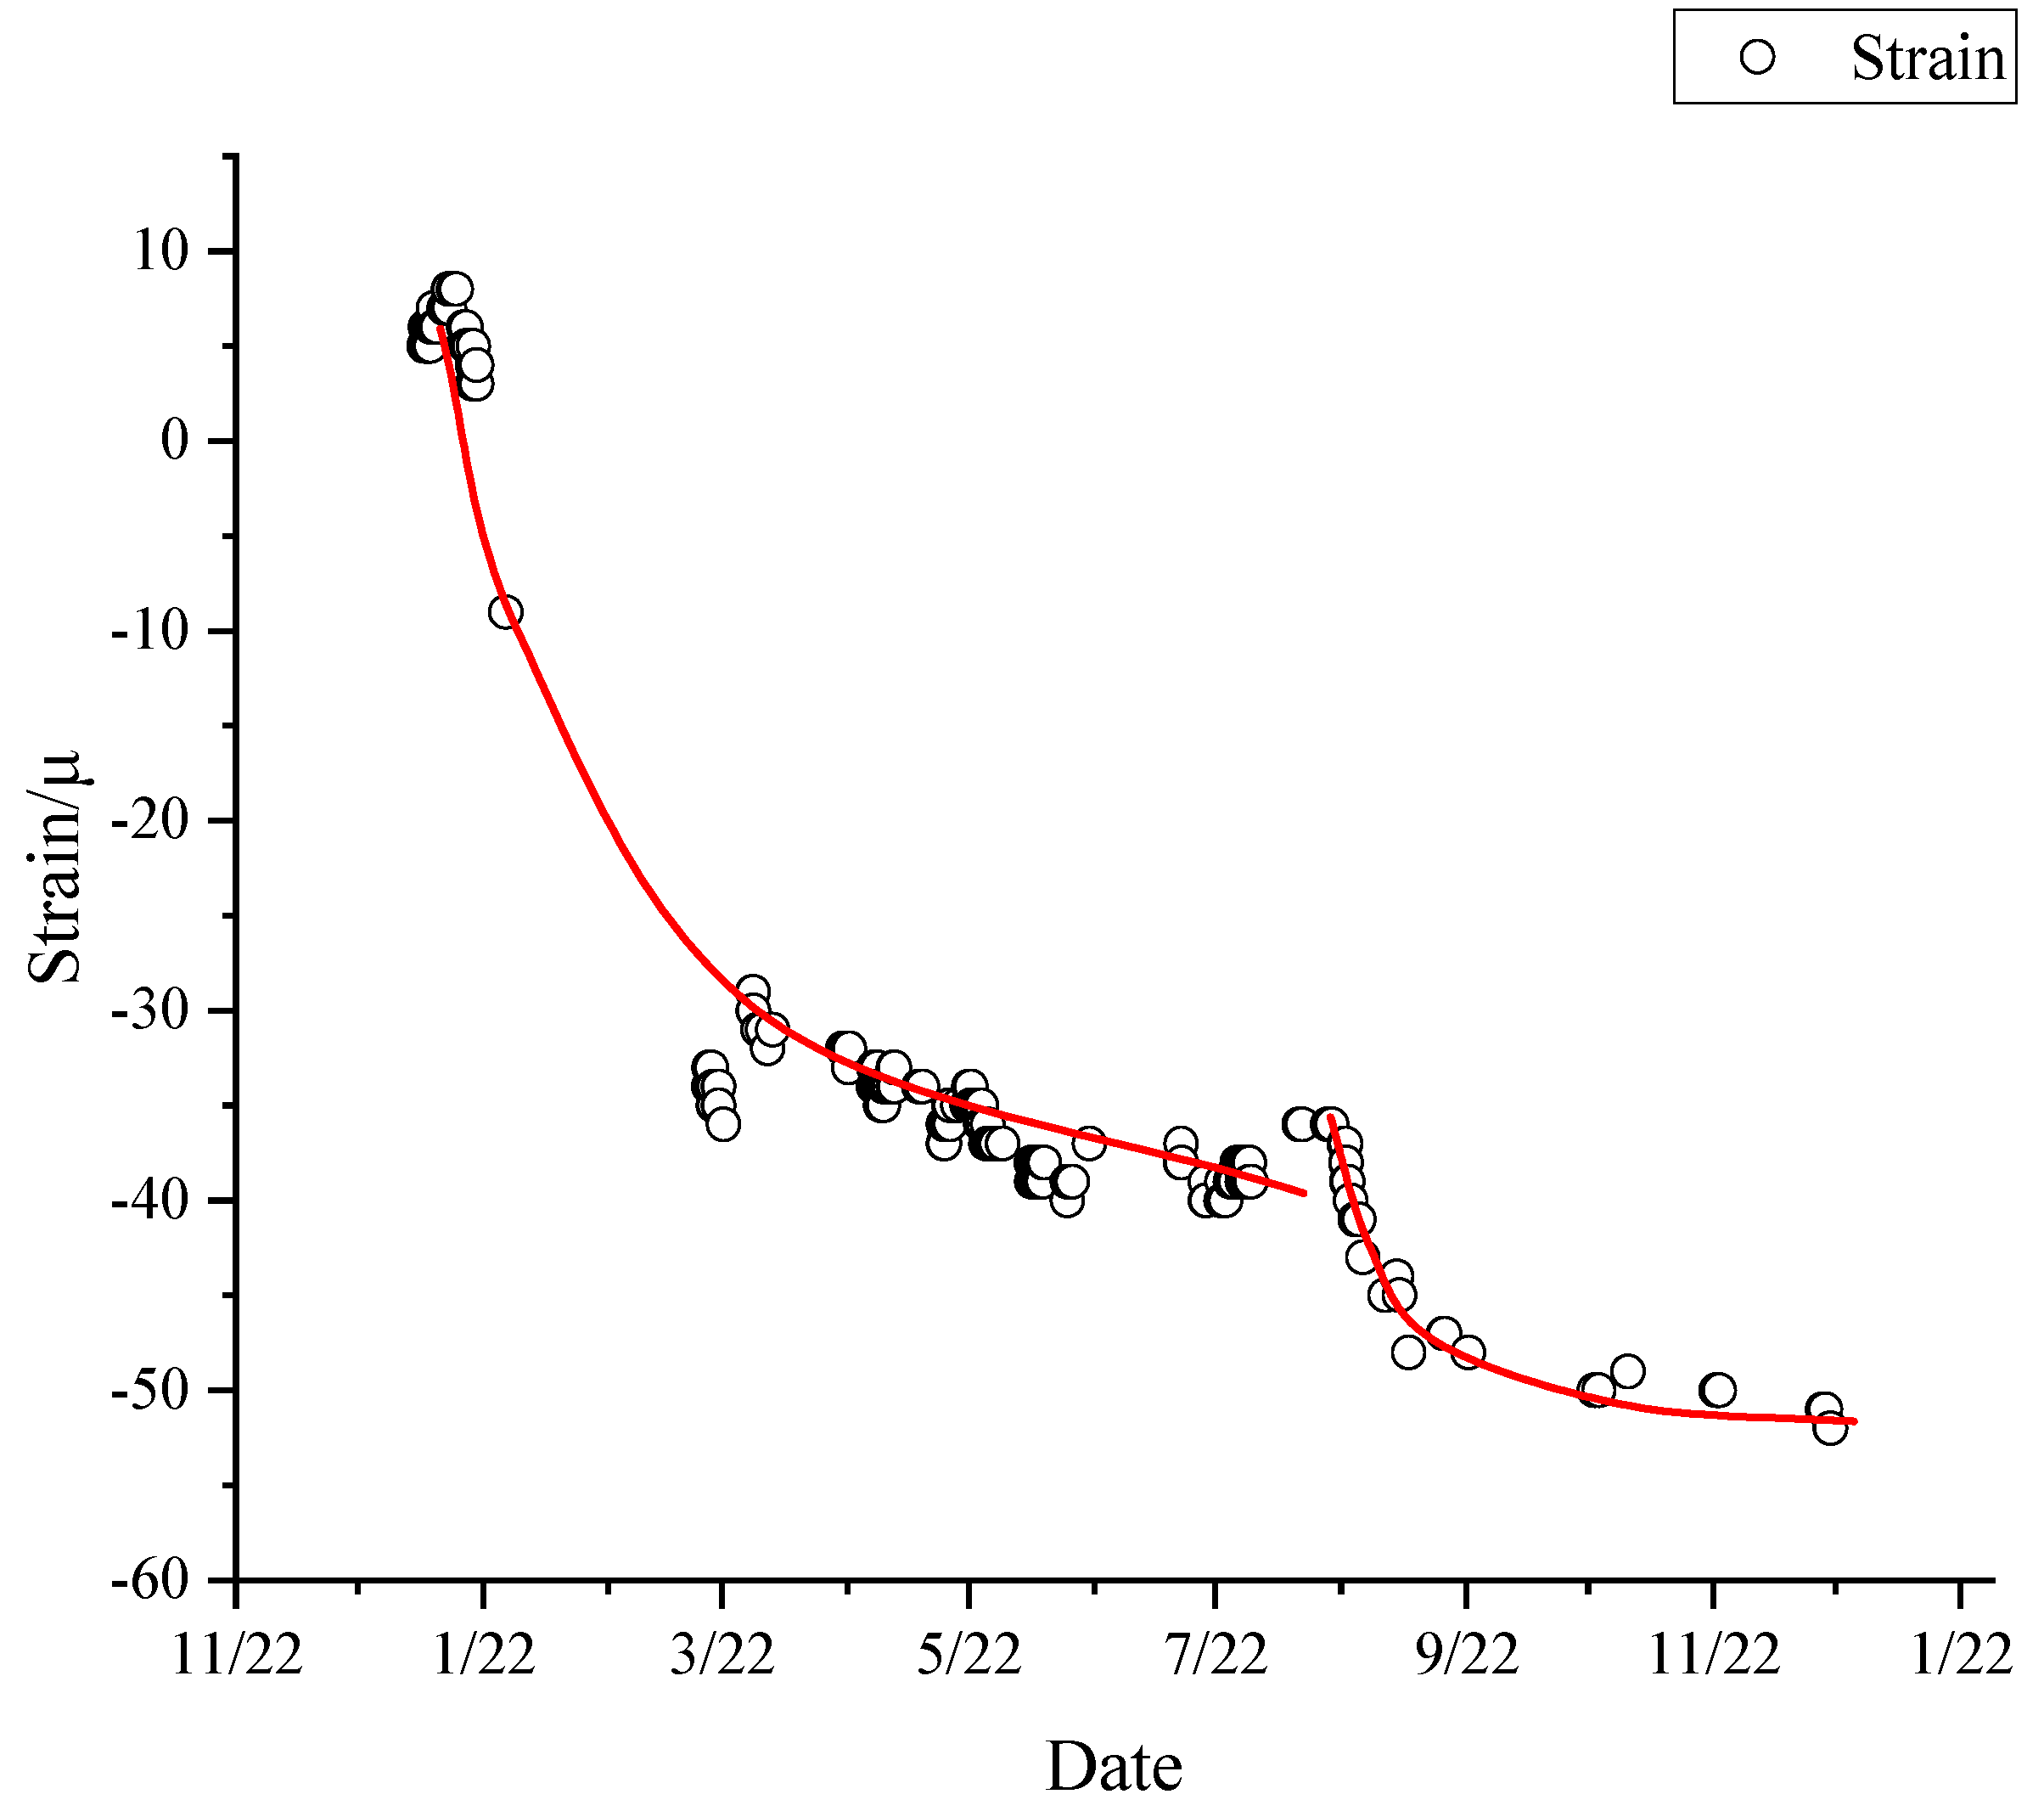
| B3 Deformation Parameters | x8 Tensile Strain/μ | ≤80 | 80~160 | 160~320 | ≥320 | Field Monitoring | |||||||||
| x9 Compressive Strain/μ | ≤100 | 100~200 | 200~400 | >400 | Field Monitoring | ||||||||||
| B4 Seepage Parameters | x10 Seepage Pressure/MPa | ≤0.2 | 0.2~0.4 | 0.4~1.0 | ≥1.0 | Field Monitoring | |||||||||
| x11 Underground Water Level/m | ≤3 | 3~6 | 6~10 | ≥10 | Theoretical Calculation | ||||||||||
| x12 Daily Fluctuations of Water Level/m·d−1 | ≤0.6 | 0.6~1.2 | 1.2~2.4 | ≥2.4 | Small Probability Event | ||||||||||
| x13 Borehole Water Level/mm | ≤300 | 300~600 | 600~900 | ≥900 | Confidence Interval | ||||||||||
| x14 Leakage Points within single CPD | ≤1 | 1~3 | 3~5 | ≥5 | Confidence Interval | ||||||||||
| Goal | Criteria | Weight | Alternatives | Weight | Subjective Weight θi |
|---|---|---|---|---|---|
| A2 Early Warning of AD in Shigetai CMUR | B1 management system | 0.0597 | x1 Construction Quality | 0.8333 | 0.0497 |
| x2 Operation and Maintenance System | 0.1667 | 0.0100 | |||
| B2 Parameters of the dam body | 0.1749 | x3 Dam concrete marking | 0.4440 | 0.0777 | |
| x4 Dam Height/m | 0.1653 | 0.0289 | |||
| x5 Dam Embedding Depth/m | 0.2596 | 0.0454 | |||
| x6 CMUR burial depth/m | 0.0847 | 0.0148 | |||
| x7 Seismicity and Mining-induced response | 0.0464 | 0.0081 | |||
| B3 Deformation Parameters | 0.3827 | x8 Tensile Strain/μ | 0.5000 | 0.1914 | |
| x9 Compressive Strain/μ | 0.5000 | 0.1914 | |||
| B4 Seepage Parameters | 0.3827 | x10 Seepage Pressure/MPa | 0.0800 | 0.0306 | |
| x11 Underground Water Level/m | 0.3525 | 0.1349 | |||
| x12 Daily Fluctuations of Water Level/m·d−1 | 0.1676 | 0.0641 | |||
| x13 Borehole Water Level/mm | 0.0474 | 0.0181 | |||
| x14 Leakage Points within single CPD | 0.3525 | 0.1349 |
| 31201-4# | 31202-4# | 31203-1# | 31204-3# | 31205-1# | |
|---|---|---|---|---|---|
| x1 Construction Quality | Satisfactory construction quality, complete documentation = 0.2 | ||||
| x2 Operation and Maintenance System | Completed daily inspections system = 0.2 | ||||
| x3 Dam concrete marking | 10 | ||||
| x4 Dam Height/m | 3.9 | ||||
| x5 Dam Embedding Depth/m | 1.5 | ||||
| x6 CMUR burial depth/m | 120 | ||||
| x7 Seismicity and Mining-induced response | Mining activity exists, no mining earthquake = 0.6 | ||||
| x8 Tensile Strain/μ | 150 | 30 | 105 | 11 | 8 |
| x9 Compressive Strain/μ | 48 | 0 | 55 | 17 | 38 |
| x10 Seepage Pressure/MPa | 0.04 | 0.08 | 0.1 | 0.12 | 0.19 |
| x11 Underground Water Level/m | 0.78 | 4.97 | 4.00 | 2.90 | 4.04 |
| x12 Daily Fluctuations of Water Level/m·d−1 | 0 | 0.20 | 0.90 | 0.34 | 0.1 |
| x13 Borehole Water Level/mm | 119 | 550.7 | 374.8 | 423.5 | 300 |
| x14 Leakage Points within single CPD | 0 | 1 | 3 | 0 | 1 |
| 31201-4# | 31202-4# | 31203-1# | 31204-3# | 31205-1# | |
|---|---|---|---|---|---|
| x1 Construction Quality | 0.0673 | 0.0455 | 0.0427 | 0.0600 | 0.0539 |
| x2 Operation and Maintenance System | 0.0135 | 0.0091 | 0.0085 | 0.0120 | 0.0108 |
| x3 Dam concrete marking | 0.1168 | 0.0788 | 0.0740 | 0.1041 | 0.0936 |
| x4 Dam Height/m | 0.0429 | 0.0290 | 0.0272 | 0.0383 | 0.0344 |
| x5 Dam Embedding Depth/m | 0.1024 | 0.0692 | 0.0649 | 0.0913 | 0.0821 |
| x6 CMUR burial depth/m | 0.0245 | 0.0165 | 0.0155 | 0.0218 | 0.0196 |
| x7 Seismicity and Mining-induced response | 0.0207 | 0.0140 | 0.0131 | 0.0185 | 0.0166 |
| x8 Tensile Strain/μ | 0.1439 | 0.0971 | 0.2024 | 0.1282 | 0.1176 |
| x9 Compressive Strain/μ | 0.1439 | 0.2306 | 0.0912 | 0.1282 | 0.1153 |
| x10 Seepage Pressure/MPa | 0.0276 | 0.0218 | 0.0219 | 0.0328 | 0.0360 |
| x11 Underground Water Level/m | 0.1278 | 0.1819 | 0.1500 | 0.1778 | 0.1907 |
| x12 Daily Fluctuations of Water Level/m·d−1 | 0.0482 | 0.0434 | 0.0764 | 0.0673 | 0.0451 |
| x13 Borehole Water Level/mm | 0.0190 | 0.0261 | 0.0194 | 0.0293 | 0.0219 |
| x14 Leakage Points within single CPD | 0.1014 | 0.1370 | 0.1928 | 0.0904 | 0.1625 |
| h = 1 | h = 2 | h = 3 | h = 4 | |
|---|---|---|---|---|
| x1 Construction Quality | 0.600 | 0.000 | 0.000 | 0.000 |
| x2 Operation and Maintenance System | 0.600 | 0.000 | 0.000 | 0.000 |
| x3 Dam concrete marking | 0.500 | 0.000 | 0.000 | 0.000 |
| x4 Dam Height/m | 0.513 | 0.000 | 0.000 | 0.000 |
| x5 Dam Embedding Depth/m | 0.750 | 0.000 | 0.000 | 0.000 |
| x6 CMUR burial depth/m | 0.300 | 0.000 | 0.000 | 0.000 |
| x7 Seismicity and Mining-induced response | 0.000 | 0.100 | 0.000 | 0.000 |
| x8 Tensile Strain/μ | 0.000 | 0.625 | 0.000 | 0.000 |
| x9 Compressive Strain/μ | 0.760 | 0.000 | 0.000 | 0.000 |
| x10 Seepage Pressure/MPa | 0.900 | 0.000 | 0.000 | 0.000 |
| x11 Underground Water Level/m | 0.870 | 0.000 | 0.000 | 0.000 |
| x12 Daily Fluctuations of Water Level/m·d−1 | 1.000 | 0.000 | 0.000 | 0.000 |
| x13 Borehole Water Level/mm | 0.802 | 0.000 | 0.000 | 0.000 |
| x14 Leakage Points within single CPD | 1.000 | 0.000 | 0.000 | 0.000 |
| 31201-4# Integrated Relative Affiliation | 31201-4# Eigenvalue H(u) | Warning Level | ||||
|---|---|---|---|---|---|---|
| h | 1 | 2 | 3 | 4 | ||
| α = 1, p = 1 | 0.623 | 0.092 | 0.000 | 0.000 | 0.807 | I |
| α = 2, p = 1 | 0.733 | 0.010 | 0.000 | 0.000 | 0.753 | I |
| α = 1, p = 2 | 0.570 | 0.235 | 0.000 | 0.000 | 1.040 | II |
| α = 2, p = 2 | 0.636 | 0.087 | 0.000 | 0.000 | 0.810 | I |
| 31202-4# integrated relative affiliation | 31202-4# eigenvalue H(u) | Warning Level | ||||
| h | 1 | 2 | 3 | 4 | ||
| α = 1, p = 1 | 0.575 | 0.172 | 0.000 | 0.000 | 0.920 | I |
| α = 2, p = 1 | 0.647 | 0.041 | 0.000 | 0.000 | 0.730 | I |
| α = 1, p = 2 | 0.566 | 0.329 | 0.000 | 0.000 | 1.225 | II |
| α = 2, p = 2 | 0.630 | 0.194 | 0.000 | 0.000 | 1.019 | II |
| 31203-1# integrated relative affiliation | 31203-1# eigenvalue H(u) | Warning Level | ||||
| h | 1 | 2 | 3 | 4 | ||
| α = 1, p = 1 | 0.285 | 0.174 | 0.000 | 0.000 | 0.634 | I |
| α = 2, p = 1 | 0.137 | 0.043 | 0.000 | 0.000 | 0.223 | I |
| α = 1, p = 2 | 0.263 | 0.286 | 0.000 | 0.000 | 0.835 | I |
| α = 2, p = 2 | 0.113 | 0.138 | 0.000 | 0.000 | 0.389 | I |
| 31204-3# integrated relative affiliation | 31204-3# eigenvalue H(u) | Warning Level | ||||
| h | 1 | 2 | 3 | 4 | ||
| α = 1, p = 1 | 0.683 | 0.002 | 0.000 | 0.000 | 0.686 | I |
| α = 2, p = 1 | 0.822 | 0.000 | 0.000 | 0.000 | 0.822 | I |
| α = 1, p = 2 | 0.672 | 0.006 | 0.000 | 0.000 | 0.683 | I |
| α = 2, p = 2 | 0.808 | 0.000 | 0.000 | 0.000 | 0.808 | I |
| 31205-1# integrated relative affiliation | 31205-1# eigenvalue H(u) | Warning Level | ||||
| h | 1 | 2 | 3 | 4 | ||
| α = 1, p = 1 | 0.557 | 0.002 | 0.000 | 0.000 | 0.561 | I |
| α = 2, p = 1 | 0.613 | 0.000 | 0.000 | 0.000 | 0.613 | I |
| α = 1, p = 2 | 0.503 | 0.005 | 0.000 | 0.000 | 0.512 | I |
| α = 2, p = 2 | 0.505 | 0.000 | 0.000 | 0.000 | 0.505 | I |
Disclaimer/Publisher’s Note: The statements, opinions and data contained in all publications are solely those of the individual author(s) and contributor(s) and not of MDPI and/or the editor(s). MDPI and/or the editor(s) disclaim responsibility for any injury to people or property resulting from any ideas, methods, instructions or products referred to in the content. |
© 2024 by the authors. Licensee MDPI, Basel, Switzerland. This article is an open access article distributed under the terms and conditions of the Creative Commons Attribution (CC BY) license (https://creativecommons.org/licenses/by/4.0/).
Share and Cite
Zha, E.; Li, P.; Wu, Y.; Wu, B.; Zhang, Y.; Li, Z.; Zhang, Z. Long-Term Monitoring and Early Warning of Coal Mine Underground Reservoirs—A Case Study in Shigetai Coal Mine. Sustainability 2024, 16, 10350. https://doi.org/10.3390/su162310350
Zha E, Li P, Wu Y, Wu B, Zhang Y, Li Z, Zhang Z. Long-Term Monitoring and Early Warning of Coal Mine Underground Reservoirs—A Case Study in Shigetai Coal Mine. Sustainability. 2024; 16(23):10350. https://doi.org/10.3390/su162310350
Chicago/Turabian StyleZha, Ersheng, Peng Li, Yang Wu, Baoyang Wu, Yong Zhang, Zhengdai Li, and Zetian Zhang. 2024. "Long-Term Monitoring and Early Warning of Coal Mine Underground Reservoirs—A Case Study in Shigetai Coal Mine" Sustainability 16, no. 23: 10350. https://doi.org/10.3390/su162310350
APA StyleZha, E., Li, P., Wu, Y., Wu, B., Zhang, Y., Li, Z., & Zhang, Z. (2024). Long-Term Monitoring and Early Warning of Coal Mine Underground Reservoirs—A Case Study in Shigetai Coal Mine. Sustainability, 16(23), 10350. https://doi.org/10.3390/su162310350