Article

Spatial Spillover Effects of Smallholder Households’ Adoption Behaviour of Soil Management Practices Among Push–Pull Farmers in Rwanda

1
International Centre of Insect Physiology and Ecology, ICIPE, Duduville, Kasarani, Nairobi P.O. Box 30772-00100, Kenya
2
USAID, BHA, TPQ, 1300 Pennsylvania Avenue, NW, Washington, DC 20523, USA
3
African Union Inter-African Phytosanitary Council (AU-IAPSC), Yaoundé P.O. Box 4170, Cameroon
4
Department of Zoology and Entomology, Faculty of Natural and Agricultural Sciences, University of Pretoria, Hatfield, Pretoria 0028, South Africa
*
Author to whom correspondence should be addressed.
Sustainability 2024, 16(23), 10349; https://doi.org/10.3390/su162310349
Submission received: 28 September 2024 / Revised: 3 November 2024 / Accepted: 8 November 2024 / Published: 26 November 2024

Abstract

:
Push–pull technology (PPT) integrates maize with the legume fodder Desmodium sp. and the border crop Brachiaria sp., aiming to enhance maize production in Rwanda. Despite its potential, the adoption of complementary soil management practices (SMP), vital for PPT’s success, remains low. This study employs spatial econometric methods to evaluate the determinants of SMP adoption and the interdependencies in decision-making among PPT-practicing farmers. We constructed a spatial weight matrix based on a global Moran’s I index and identified optimal model parameters through principal component analysis. Utilizing a spatial Durbin probit model (SDPM), we assessed the spatial interdependence of SMP adoption decisions among maize farmers. Our findings reveal significant spatial dependence in SMP adoption within a 1.962 km radius, with improved seed usage, household income, yield, farmer group membership and size of land cultivated being key factors positively influencing adoption. We propose a “nonequilibrium promotion strategy” to enhance SMP adoption, emphasizing the establishment of pilot regions to broaden outreach. Additionally, fostering technical training and selecting farmers with adequate resources as demonstration leaders can enhance spatial spillover effects. This research provides insights for developing policies to scale up push–pull technology in Rwanda and across Sub-Saharan Africa.

1. Introduction

Sub-Saharan Africa remains the world’s most food-insecure region [1]. As of 2010, the region had the highest percentage of under-nourished persons in the world, at an estimated 30% of the total population. In addition, food production per capita in Africa has been declining; farmers experience low crop-productivity levels, resulting in lower yields [2].
The low performance of the agricultural sector is attributable to several factors, such as climate change, use of low-yielding seed varieties, poor management of pests and diseases, limited use and adaptation of up-to-date agronomic practices, slumped infrastructure, gender inequality, land tenure systems and socio-cultural factors causing a deficiency in access to appropriate extension services and agricultural inputs [3,4,5,6,7,8].
In Rwanda, a large portion of the population depends heavily on rain-fed agriculture and experiences frequent and prolonged dry spells, low soil fertility, and widespread pests and diseases, such as fall armyworm (FAW), stemborers and Striga weed [9]. The combination of these factors is associated closely with reduced maize yield or complete crop failure [9,10,11]. Farm-level estimates of yield losses attributable to FAW in the region range between 20% and 50% [10,12,13,14], stemborer losses range from 10% to 88% [15], while the parasitic Striga weed destroys entire crop fields if left uncontrolled [16]. Consequently, the food security, nutrition and livelihood status of smallholder farmers are constantly threatened [17]. Therefore, there is a need to adopt sustainable farming practices to mitigate these production constraints and maintain food-secure households [18].
For pest management, extension services have often recommended using pesticides as a faster and more effective control measure. However, because of their adverse effects on non-target organisms, humans and the environment, agro-ecological approaches that are cost-effective and easy to apply for eco-friendly soil-management practices (SMP) and pest control are recommended for sustainability. Indeed, agro-ecological farming practices mitigate pests and abiotic factors and are usually more accessible or affordable to smallholder farmers [19]. One such practice is push–pull technology (PPT), an ecological approach for pest and soil management that relies on on-farm biodiversity [19,20]. This technology entails a stimulo-deterrent diversionary tactic involving pests and their natural enemies, whereby pests are deterred away from the main crop (“push effect”) and simultaneously attracted (“pull effect”) to trap plants [20,21,22]. The legume intercrop Desmodium spp. repels (the ‘push’) stemborers and suppresses Striga, and the border crop Brachiaria or Napier grass Pennisetum purpureum attracts (the ‘pull’) the pest away from the main cereal crop. The legume intercrop improves soil fertility through nitrogen fixation, erosion control, and enhancing soil organic matter content [23,24]. Since PPT simultaneously reduces the impact of the major cereal crop production constraints of pests, adopting it plays a major role in attaining food security and poverty reduction [25]. For instance, adopting the push–pull strategy in East Africa could improve maize yields by 1.96 times if this method were to be widely adopted [26].
PPT was introduced in Rwanda in 2017, with satisfactory results following support from national government, but its overall adoption remains relatively low. This can be expected, as PPT is a knowledge-intensive technology that requires step-by-step application of agroecological principles to achieve optimal results [26]. It also requires aptitude in soil fertility improvement, plot measurements and layout, crop spacing, weeding, and harvesting of companion crops/plants for optimal productivity. Soil management practices, such as composting, manure application and root pruning, are guiding principles for capturing the full benefits of the technology. These practices are even more critical when considering the fact that most of the land in Rwanda is on inclined terrain and, consequently, farmers face challenges such as soil degradation, moisture conservation, and low fertility attributable to large-scale erosion [27]. This, in addition to other biophysical and socioeconomic challenges, can influence the adoption of the technology. Thus, the decision to adopt new practices occurs through a dynamic and complex process that varies between communities, countries and between studies. Most adoption studies have primarily focused on evaluating the socio-economic factors affecting farmers’ decisions to adopt eco-friendly practices. Despite the potential of PPT to improve maize production in SSA, no empirical study has been undertaken to establish the neighbourhood effects of adopting soil management practices as complementary packages of PPT.
Spatial dependence suggests that farms within proximity to one another exhibit similar choice behaviours. This could be attributed to greater communication between the farmers, which raises awareness, changes preference, and reduces information costs [28]. The endogenous interaction effect (also known as the neighbourhood effect) is the best-known effect that explains this. It implies a spillage effect among neighbouring farms and communities [29]. An existing social network structure shapes a farmer’s behaviour towards innovations and their adoption [30]. This concept dates back to Manski’s [31] study on the analysis of endogenous social effects, where an individual’s likelihood to behave in a specific way changes with the individual’s social group behaviours. This diffusion can be measured as a percentage of the farming population that adopts innovation and the total land share it can utilise [32]. Studies such as the one by Krishnan and Patnam [33] found social learning to be more effective than structured extension services were when it came to adopting fertilisers and new seed varieties in Ethiopia. Conversely, Ward and Pede [34] found the neighbourhood effect as being a significant determinant in the use of hybrid rice in Bangladesh. Other studies that have also employed spatial analysis of technology adoption include [34,35,36,37,38,39].
Geographical locations can be used to model spatial dependence but are often ignored [40]. Ignoring such effects, where they exist, leads to the formation of biased and inconsistent estimates of technology adoption determinants [41]. Furthermore, understanding the neighbourhood effects of technology adoption with a spatial dimension is important for designing technology and knowledge dissemination strategies and, ultimately, in identifying cost-effective strategies for transferring knowledge-based technologies such as PPT and other similar integrated pest management (IPM) technologies.
The implementation of PPT in Rwanda is relatively new (less than six years), and its adoption, although low, is steadily growing. Previous studies have shown that the number of farmers who learn how to use PPT in a typical area varies between 6 and 17 [41,42,43]. However, the extent to which farmers’ adoption of soil management practices and related technologies is influenced by neighbourhood factors has not been investigated.
The current study, therefore, seeks to understand the spatial factors that influence the uptake of soil management practices under PPT usage. Specifically, it evaluates the determinants of adopting soil management practices, focusing on farmers who practise PPT. This paper uses spatial econometric approaches to estimate the direct and indirect spatial spillover effects in the adoption behaviour of soil management practices among PPT farmers in Rwanda. The results obtained are expected to inform policymakers on integrating soil management technology scaling programmes in spatial dimensions and optimising resources for scaling up PPT in Rwanda, in particular, and other regions in general.

2. Materials and Methods

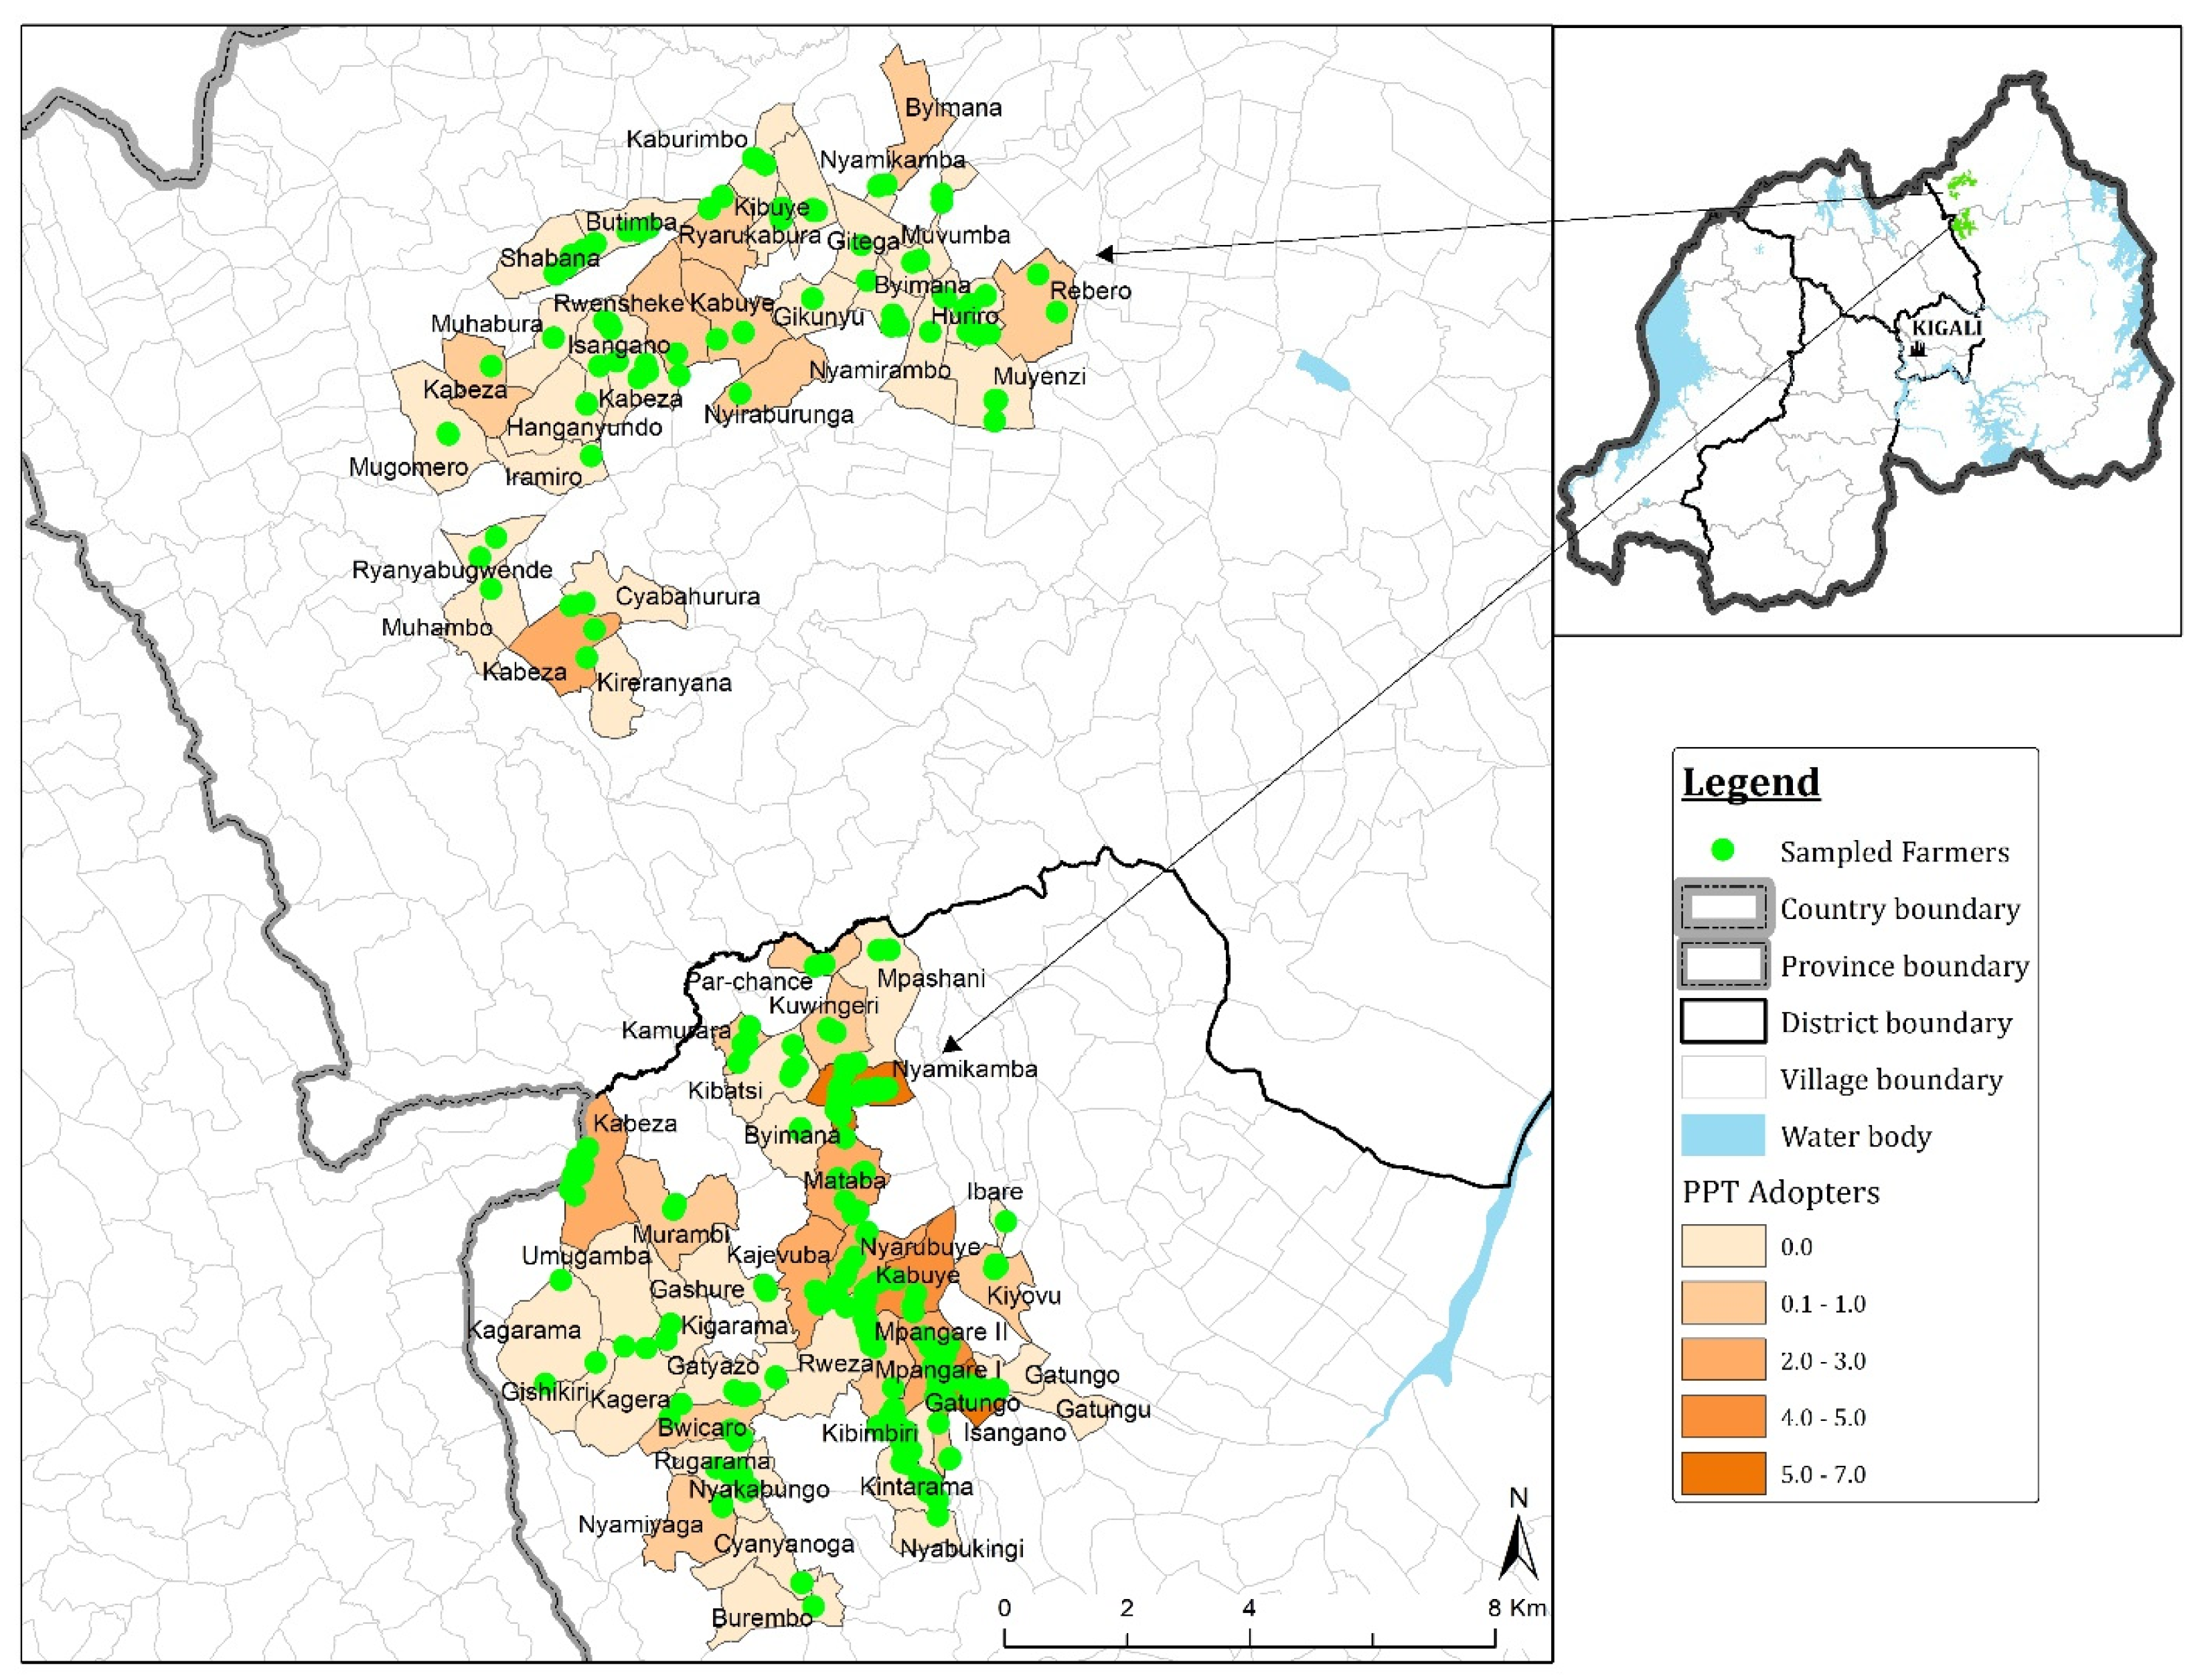
2.1. Study Site and Data Collection

This study uses data derived from a survey carried out in the Eastern province of Rwanda in 2019 within Nyagatare and Gatsibo districts (Figure 1), covering 522 households that had adopted PPT. Eastern Rwanda was selected as the study area due to its significant challenges with soil degradation, Striga weed infestation, and insect pest pressures. Additionally, the region supports livestock production, which can benefit from the PPT companion plants as fodder, making it an ideal region for the optimal deployment of push–pull technology. The sample was derived using simple random sampling on lists of households consisting of households that had worked with an implementing partner organization (Food for the Hungry (FH)) as adopters and another of non-adopters’ as those that had not been contacted by FH. Household data were collected by trained enumerators through using pre-tested structured questionnaires designed in CSPro version 7.1 and uploaded on computer-assisted personal interview (CAPI) devices. The questionnaire comprised a range of modules that captured household identification and characteristics, socio-economic status, crop production and plot information, PPT adoption, non-adoption and potential adoption, livestock ownership and production, food security, and access to capital and information.

2.2. Methodology

A spatial correlation test is essential for assessing spatial effects in a spatial econometric model [44]. To confirm the appropriateness of the spatial Durbin probit model (SDPM) for this study, we calculated the global Moran’s I index, which is commonly used to detect spatial dependence across locations. This test verified spatial correlation in the sampled field data. If the spatial correlation falls within −1 ≤ Moran’s I < 0, it indicates negative spatial correlation, while 0 < Moran’s I ≤ 1 reflects positive spatial correlation. A Moran’s I of 0 signifies no correlation. In our data, the Moran’s I result demonstrated significant positive spatial correlation, indicating that soil management practices (SMPs) adopted by one farm could influence similar practices among neighbouring farms. This justified the use of the SDPM, as it allows for modelling such spatial interdependencies directly.
Data Analysis Procedures and Application of the Spatial Durbin Probit Model (SDPM).
We began our analysis with a thorough descriptive and exploratory analysis of the data. This step included examining variable distributions and checking for multicollinearity among variables to ensure they were suitable for spatial modelling. For instance, where variables such as yield and its natural logarithmic transformation were highly correlated, we retained only the transformed variable to prevent multicollinearity issues in the model. This pre-analysis step was crucial to facilitate a robust application of the SDPM by ensuring the reliability and interpretability of the coefficients.
In our study, we categorized soil management practices (SMPs) into two main types: organic and chemical-based practices. Organic SMPs included grass strips, terraces, zero tillage, soil bunds, tree planting, manure, and compost, while chemical practices consisted of insecticides, herbicides, urea, and DAP. This classification was integral for specifying the model structure, as it allowed us to create distinct variables representing each SMP type within the SDPM. This categorization not only clarified the direct effects of SMP adoption on each farm but also enabled us to assess spatial spillover effects of different SMP types across neighbouring farms.
The SDPM was specified to include both direct and spatially lagged variables. Direct effects account for the influence of a farm’s characteristics (such as farm size, soil quality, and access to agricultural support) and its chosen SMPs on its own adoption behaviour. The spatial lag terms, however, capture indirect effects, which estimate how SMP adoption on one farm influences the likelihood of SMP adoption in neighbouring farms. By including spatially lagged versions of the SMP variables, the SDPM can quantify the spatial spillovers associated with both organic and chemical SMPs, revealing the extent to which these practices spread through neighbouring farms.
To further clarify, the SDPM in this study was structured to measure these direct and indirect effects separately for organic and chemical SMPs. For example, the spatial lag of organic SMPs assessed whether the likelihood of a farm adopting organic practices increased if nearby farms also used organic SMPs. Similarly, the spatial lag of chemical SMPs captured the spatial influence of chemical usage in neighbouring farms on a farm’s own adoption choices. This approach enabled us to analyse not only the immediate determinants of SMP adoption for each farm but also the broader spatial dynamics that influence SMP adoption within the study area.
The results of the SDPM thus provide a nuanced understanding of SMP adoption behaviour by quantifying both individual and spatially dependent influences. Specifically, this model allowed us to identify how the adoption of SMPs among neighbouring farms impacts adoption decisions in the focal farm, highlighting the role of spatial spillover in shaping soil management practices.
A detailed breakdown of the descriptive and spatial analysis, including variable selections and pre-modelling steps, is presented in the Appendix A.
Because of the dichotomous nature of the dependent variable (i.e., integration of a soil management practice), the spatial Durbin probit model (SDPM) was chosen to determine the interdependence of decisions among PPT-practising farmers in Rwanda to integrate soil management practices, following ([45]). The SDPM presents several advantages, including allowing one to study the effects of spatial dependence on the adoption decisions of several farmers in the same vicinity. The model also enables the assessment of the significance of this impact on farmers’ decision-making choices. In addition, the approach also allows adoption decisions to be grouped into direct and indirect, if spatial dependence is present, and reducing the endogeneity bias, since the model accounts for a significant proportion of confounding factors [46].
The SDPM model is specified as follows:
yi* = λWyi* + WXi y + εi
where:
y i * is an n × 1 vector of realisations of the decision for PPT farmers to integrate soil management practices, and X i is an n × k matrix of observations in terms of farm characteristics as well as decision-making characteristics of the ith farmer. The terms λ W y i * and W X i γ are defined as the spatial terms that indicate the indirect effect of adoption of soil management practices of neighbouring farmer j on farmer i [47]; further, W y i * is the spatially lagged dependent term representing the weighted average of neighbouring farmers’ utility, and it captures the spatial dependence of the choice of adoption among farmers. The term W X i , on the other hand, which is the spatially lagged independent term, captures the weighted average characteristics of neighbouring farms. The former captures endogenous effects, while the latter captures exogenous effects. W is an n × n spatial weights matrix, based on a neighbouring criterion chosen about distance or contiguity between farmer i and j (ij)
w i j = d i j 1 ,   0 d i j d 0 , d i j > d
where d represents the threshold distance beyond which the spatial spillover effects are null. These weights are normally row-standardised in that the sum of elements on each row totals to 1. E   is a vector comprising error terms, where E i are independently and identically distributed (i.i.d.) for all i with a mean of zero and a variance of σ 2 . The terms λ and   β are the unknown regression parameters to be estimated. The data were analysed through RStudio software version 4.3.0, using the above model. The map in Figure 1 was generated using ArcGIS 10.8 (Environmental Systems Research Institute, Redlands, CA, USA).

3. Results and Discussion

3.1. Description of the Data

This section describes the characteristics of representative PPT households. First, a variable describing soil management as a practice was created, using the previously mentioned sample size (n = 522), together with a follow-up survey of the same farmers. The dichotomous variable described households that employed two soil management practices, namely the use of grass strips and soil bunds, and those that were not using these practices. It was coded as a binary variable indicating a farmer’s choice of soil management practices: coded as 1 representing adoption (if the farmer reported using any of the above two practices) and coded as 0 representing non-adoption (if the farmer used neither of them). The description of the variables is shown in Table 1.

3.2. Spatial Correlation Test Results

The global Moran’s I analysis for the spatial weight matrix, based on a geographic distance, was 0.03 (p-value = 0.17), with a significance level of 0.5. This result indicated that the behavioural adoption characteristics of soil management by PPT farmers are significantly and positively correlated to the adoption behaviours of adjacent PPT farmers; thus, the adoption behaviour amongst the farmers is not randomly distributed across space but is spatially correlated. This positive correlation can be attributed to the daily interactions through communication and business activities that usually occur between adjacent farmers, thus indicating a strong peer effect [48]. Spatial dependence is greatly influenced by a decay noted along a geometric distance; thus, there is a need to determine a suitable distance that ensures each household has at least one neighbouring family [49].
A total of 10 nearest neighbours (K) value thresholds, ranging from 1 to 10, were tested to establish the optimum value of K that would generate a suitable weight matrix for the SDPM. As shown in Table 1, when the K value was set to 5, the geographic distance between neighbours was optimal at 1.962 km, and the number of disjoint regions was 8; thus, this model was considered optimal. The results of the distance estimation are presented in Table 1. The results present the optimal value of K that generated distinct disjoint regions that form a pseudo-sphere of influence with regard to technology and information transfer among the adopting farmers, as shown in Figure 2 below. This finding implies that the adoption of soil management has a spatial lag; a farmer is likely to adopt soil management practices if their neighbouring PPT-adopting farmer within a distance of 1.962 km also practises soil management practices, beyond which the spatial spillover effect of adopting SMP amongst PPT farmers diminishes to zero
The spatial Durbin probit model described in the previous section was then estimated, using the above-created soil management variable as the dependent variable. The longitude and latitude coordinates of the farmers’ plots were used to generate the spatial weight matrix to characterise neighbourhood effects in Geoda (version 1.20.0.10). Several independent variables were then used to model this choice, as presented in Table 2 below.

3.3. Descriptive Statistics

Regarding descriptive statistics (Table 3), of the 522 sampled farmers, 435 push–pull farmers (83%) had adopted either of the soil management practices. About 72% of the push–pull farmers were using hybrid maize. The results described below indicate that a typical PPT farming household consists of about 5 people, is headed by an individual with an average of 5 years of school, and who is 48 years of age. The mean cultivated total land area was 1.05 hectares, which reflects the characteristics of small landholdings amongst most farmers in Rwanda owing to its hilly nature and land policy [50]. Regarding the use of diammonium phosphate fertiliser, 123 (31%) of push–pull farmers were also using it on their farms. This finding suggests the need for affordable soil fertility enhancing technologies such as PPT among the farmers in Rwanda.
Regarding participation in technical training, the results show that 40% of the farmers had received training, which seems low, given the length of time since PPT was introduced in the country. A total of 52% of the farmers had sought and received extension services from relevant authorities, with most of them claiming that the services are within an average of 45 min of walking time, indicating the value of extension services in rural farming households. About 69% of sampled households had at least one mobile phone in the household.
This study also assessed the status of the land physical characteristics on which PPT farmers planted maize. The mean altitude of the location of most households was 1526.72 m.a.s.l.; thus, any inappropriate land management practices and clearance of natural vegetation that can exacerbate degradation [27]. Thus, the conservation of scarce land resources is needed to achieve long-term agricultural viability (MINAGRI 2004), as cited by Nahayo et al. [27]. This can involve a combination of policies, technologies and activities to achieve socially acceptable production goals [25].

3.4. Model Estimation

With an optimal K value of 5 and a distance of 1.962 km defining the spatial weight matrix, we estimate both the non-spatial (linear) and spatial models. The Akaike Information Criterion (AIC) value for the spatial model is less (391.17) than that of the non-spatial (linear model) (393.98); thus, the former was preferred, and the results are presented in Table 4. We fail to reject the null hypothesis with a likelihood ratio test statistic (LRT) for the null hypothesis (p < 0.01). This implies that spatial dependence exists in the adoption of soil management practices among practising PPT farmers, and the adoption characteristic of PPT farmers is influenced by the characteristics of neighbouring PPT farmers’ behaviour in adopting SMP.
Table 4 also gives the model run results, including the model coefficients and the lag effects, which indicate the influence of neighbouring PTT farmers’ characteristics on the adoption of soil management practices. As predicted, yield is a key driver of the adoption of soil management practices among PTT farmers (p < 0.01). The use of hybrid maize significantly influenced the adoption of soil management practices (p < 0.01) by PPT farmers, although the effect of use was also positive, but smaller, among those using local seed. This can be linked to the accrued benefits in terms of expected yield derived from using improved seeds and lower capital requirements in crop management of pests and diseases [26]. Furthermore, the technology has the potential to address other farming challenges and to be integrated into government programmes that align with the small sizes of farmland, adopting the zero-grazing policy, and the one-family–one-cow policy that promotes higher breeding of livestock [43].
Similarly, farmers using insecticides were less likely to adopt soil management practices (p < 0.01), consistently with the basic agroecological principles of PPT. Regarding the resource endowment characteristics experienced among the farmers, sufficient income has a significant, negative effect on the PPT farmers’ soil management adoption behaviour (p < 0.05). Furthermore, as expected, farmers with larger areas of land are less likely to adopt (p < 0.001), and yet those who cultivate greater areas of land are more likely to adopt soil management practices (p < 0.001). This is linked to the inverse relationships of costs with land size in establishing soil management practices in PPT. Over 66.0% of Rwandese farmers interviewed reported that PPT is labour demanding, especially during the initial stages of establishment where they experience increased expenditure for hiring labour and purchasing of inputs such as seeds and fertilisers [43]. Labour use per acre on maize plots under PPT was significantly higher among PPT farmers than among the non-adopters [50,51]. While the labour requirements and costs reduce once companion plants are fully established, this was further confirmed by the positive effect of the number of household members on the probability of adopting SMPs (p < 0.1%). Also consistent with this expectation is the positive relationship between the adoption of soil management practices and the number of farmer groups in which the household is involved. The findings confirm that group membership increases household access to social capital and, therefore, its access to information and innovations [52].
In summary, the model estimation coefficients reveal that the use of hybrid maize, the total cultivated land, the use of DAP fertilisers, yield, and household size give rise to a positive probability of adopting soil management practices among PPT farmers, whereas household income, use of insecticides, and total land area owned have negative effects. The use of improved seeds, amount of cultivated land, and yield, which significantly affect the adoption of soil management practices in this model, can be attributed to the fact that these practices determine the propensity of an individual farmer to adopt soil management practices in a bid to achieve cost savings and increase their income through technological advancements [53].

3.5. Direct, Indirect and Total Effects Results

The immediate effects constitute the impact of change in the independent variables of farmer i on the adoption probability of farmer i. Indirect effects come from cumulative spatial spillover effects on neighbouring farmers; that is, change in the independent variable affects the adoption probability of farmer j, thereby also affecting farmer i’s probability of adoption. The total effects are a sum of the two. Table 5 presents the direct, indirect, and total effects of the coefficients, as accounted for by our model, based on the 6 nearest neighbours. The estimation results indicate that a PPT farmer’s choice to integrate soil management practice is affected by the characteristics of his/her neighbour. The magnitude of these estimates varies across the selected significant variables. The most influential being the yield, use of insecticides, household members size, and membership to farmer groups, with their indirect spatial effects being 57, 63, 54, and 29%, respectively. This implies that, as yield increases, household size and membership of farmer groups of the neighbouring increase; thus, the PPT farmers’ adoption of soil management practices is greater.

4. Conclusions

The adoption of soil management practices (SMP) is essential for promoting resilient agrifood systems in Africa. This study offers valuable insights into the factors influencing the adoption of SMP among farmers utilizing push–pull technology (PPT), with a particular emphasis on the role of social networks. The analysis reveals significant spatial dependence, meaning that a farmer’s decision to adopt SMP is influenced by the practices of neighbouring farmers. The finding that neighbouring farmers’ adoption behaviour influences the adoption of SMP highlights the importance of social networks in adoption decisions. This implies that targeting influential farmers within communities could facilitate the adoption of SMP through peer learning, local interaction, demonstration effects, trust-building, and enhanced information dissemination [54,55]. Policymakers and agricultural extension services can leverage this insight by fostering community-based learning, promoting success stories, and designing programs that harness social dynamics to accelerate technology adoption.
While this study provides valuable insights into accelerating technology adoption through social capital, it has certain limitations. First, using spatial proximity as a proxy for social networks may overlook other influential factors, such as kinship, economic ties, or cultural influences that shape social capital. Second, the findings are context-specific and may not be fully generalizable to regions with differing social or economic conditions. Third, learning about new technologies, such as SMP, from neighbours does not occur instantly and may not translate into adoption within the same season. The cross-sectional data used in this study fails to capture this time lag, suggesting that panel data, collected over time, would be better suited to address delayed adoption effects. Additionally, spatial correlations in adoption among smallholder farmers could be influenced by unobserved, shared characteristics, potentially resulting in spurious associations. Panel data could mitigate this by controlling for time-invariant, unobserved factors, thereby providing a clearer understanding of the true drivers of adoption [55]. Future research should address these limitations by incorporating a broader range of social network variables, collecting data over time, and testing the model in diverse contexts to enhance the generalizability of the findings.
The main conclusions of this study are the following:
First, the soil management practices and adoption behaviours of PPT adopters are spatially correlated, and their geographic distribution is spatially clustered. Second, when farms are within 1.962 km of each other, SMP adoption behaviours have a strong spatial dependence. Third, the use of improved seeds and household income have a high, direct impact on the adoption of soil management practices amongst PPT farmers in Rwanda. However, the spatial lag effect of training on neighbours within a region is highly significant, with p < 0.1. Last, the spatial spillover effects of neighbouring PPT adopters’ characteristics, especially yield, use of insecticides, household members size and membership to farmer groups, cannot be ignored. For policy design, leveraging on location social capital and location of demonstration plots in proximity of farmers is key.
Our findings have policy implications for SMP promotion policies. First, a “nonequilibrium promotion strategy” should be implemented to ensure a balance in the adoption of soil management practices amongst smallholder farmers owing to variability in factors that influence adoption. Because of the spatial cluster characteristics of PPT farmers’ SMP adoption behaviour, policies should be implemented in a few pilot regions, with the foundations for SMP practices, to allow these regions to reach a large area. Then, the application of SMPs could diffuse to neighbouring regions. Second, promotion policies should be multipronged. The internal condition of family farms should be improved by encouraging participation in technical training to reduce the barriers and stresses involved in SMP adoption. Last, attention should be paid to the spatial spillover effects to maximise the technology adoption and diffusion.
Family farmers who participate in technical training, have abundant labourers, and utilise improved seed should be selected as “SMP adoption leaders”. Such family farms would be ideal for use as demonstration sites to increase the spatial spillover effects.
This study still has some limitations. First, the research conclusions of this paper are based on PPT adopters in the Eastern Province of Rwanda, but whether consistent research conclusions could be drawn in other regions remains to be seen. Second, this paper measures the SMP adoption of PPT farmers in terms of “whether”, and SMP adoption could also be measured in terms of “how much”. Therefore, the spatial dependence of the SMP adoption behaviour of PPT adopters, as measured by the “degree of adoption”, remains to be investigated.

Author Contributions

Conceptualization, M.M.K. and S.N.; methodology, M.M.K., K.M.A., F.C., G.H., D.M.M., R.O., M.K. and S.N.; software, M.M.K. and K.M.A.; validation, M.M.K., Y.B. and S.N.; formal analysis, M.M.K. and K.M.A.; investigation, M.K.; resources, S.N.; data curation, M.M.K. and K.M.A.; writing—original draft preparation, K.M.A., M.M.K. and S.N.; writing—review and editing, M.M.K., K.M.A., F.C., G.H., D.M.M., R.O., M.K. and S.N.; software, M.M.K. and K.M.A.; visualization, M.M.K.; supervision, M.K.; project administration, Y.B.; funding acquisition, S.N. All authors have read and agreed to the published version of the manuscript.

Funding

We gratefully acknowledge the financial support for this research by the following organisations and agencies: Biovision Foundation for Ecological Development (Switzerland), grant number (BV DPP-010/2019); USAID/OFDA and USAID/BHA, through the project titled “Reinforcing and Expanding the Community-Based Fall Armyworm Spodoptera frugiperda (Smith) Monitoring, Forecasting for Early Warning and Timely Management to Protect Food Security and Improve Livelihoods of Vulnerable Communities-CBFAMFEW II”, grant number 720FDA20IO00133, and the European Union (EU) funded project “Integrated pest management strategy to counter the threat of invasive fall armyworm to food security and Eastern Africa (FAW-IPM)” GRANT NUMBER OOD/2018402-634. The views expressed herein do not necessarily reflect the official opinion of the donors.

Institutional Review Board Statement

Not applicable.

Informed Consent Statement

Not applicable.

Data Availability Statement

Data supporting the reported results can be requested from the corresponding authors.

Acknowledgments

We gratefully acknowledge the International Centre of Insect Physiology and Ecology, icipe for facilitating this research. The study received financial support from the USAID/OFDA through the project titled “Reinforcing and Expanding the Community Based Fall Armyworm Spodoptera frugiperda (JE Smith) Monitoring, Forecasting for Early Warning and Timely Management to Protect Food Security and Improve Livelihoods of Vulnerable Communities-CBFAMFEWII” grant Number “720FDA20IO00133” and Biovision Foundation Switzerland through the project Push–Pull for Sub-Saharan Africa, and the European Union through the project “Integrated pest management strategy to counter threat of invasive fall armyworm to food security in eastern Africa (FAW-IPM) (grant number: DCI-FOOD/2017/). The views expressed herein do not necessarily reflect the official opinion of the donors.

Conflicts of Interest

The authors declare no conflicts of interest.

Appendix A

Grouping organic soil management practices (SMP) as grass strips, terrace, tilla, soil bunds, trees, manure and compost and chemical based soil management practices as insecticide, herbicide, urea and DAP use.
A total of 520 farms out of all 522 practised organic soil management. On the other hand, only 227 farms out of all 522 practised chemical-based soil management practices. Therefore, organic soil management was more prevalent among all farms. The two farms not practising organic soil management did not practise chemical-based soil management and were therefore absent of any soil management practice.
Sustainability 16 10349 i001
Sustainability 16 10349 i002
All farms practising chemical based SMP also practised organic SMP, while not all farms practising organic SMPs practised chemical-based SMPs.
Sustainability 16 10349 i003
In the 520 farms undertaking an SMP, manure use was more prevalent (91%), followed by terraces (56%), while zero tillage was the least prevalent, being only practised in one location.
PracticeFarmsFarms (%)(×/520)
Grasstrips23845.76923
Terrace29155.96154
Zero Tillage (zero_tilla)10.1923077
Soil_bunds336.346154
Trees22342.88462
Manure47190.57692
Compost20038.46154
Insecticide13726.34615
Herbicide132.5
Urea18635.76923
Dap18635.76923
There is some correlation between the factors of grasstrips, trees, compost terrace, soil bunds and zero_tilla.
Sustainability 16 10349 i004
However, there is a negative correlation between manure and zero_tilla and grasstrips.
Defining soil management practices (SMP) as zero_tilla, compost_2, terrace_2, trees_2 and Soil_bunds.
Sustainability 16 10349 i005
Some 435 farms practise either of these five practices, while 87 do not, and 2 of these 87 farms do not practise either.
We therefore define soil management as these five practices (as zero_tilla, compost_2, terrace_2, trees_2 and Soil bunds).
  • SDPM model
  • Explanatory Variables
Some variables were highly correlated. This correlation indicates that these variables have some strong association. To formulate SDPM model, therefore, of the highly correlated variable pairs only one was included. For example, yield and its transformation, yield (natural logarithm), were highly correlated and therefore only yield (natural logarithm) was included in the equation, as well as total income and its transformation, income (natural logarithm). Training and cont_ppt were also correlated, and therefore only training was included. This was performed for all correlated variables.
Sustainability 16 10349 i006
To formulate SDPM model, highly correlated variables were therefore excluded.
The final equation takes the form.
Soil Management Practice (Org) ~ Age_hh_new + TLU_2 + soilfertil + plot_dist + dist_ext + altitude + localseed_ + lnyield + total_land + tot_cultla + ln_income + DAP_2 + insecticide + hybrid_2 + hh_size2 + credit_2 + educ_hh + numberofph + herbicide_ + hh_groups +training_2 + extension_
  • Results
Call: lagsarlm (formula = equation9, data = R_probit_analysis_2b, listw = nc2_1, type = “mixed”)
  • Residuals:
Min1QMedian3QMax
−1.048334−0.0606160.0918220.1976670.564332
  • Type: mixed
  • Coefficients: (asymptotic standard errors)
EstimateStd. Errorz ValuePr(>|z|)
(Intercept)−0.2152787880.635492186−0.33880.7347912
Age_hh_new0.0006277490.0013749610.45660.647989
TLU_2−0.0161384590.012667918−1.2740.2026765
soilfertil−0.0018418910.023687025−0.07780.9380194
plot_dist0.0011769890.0008638121.36260.1730238
dist_ext−0.0004775140.000359487−1.32830.1840721
altitude0.0000206960.0000896150.23090.8173606
localseed_0.1050472750.047235672.22390.0261554
lnyield0.0342244340.011837392.89120.0038376
total_land−0.0353879940.012352302−2.86490.0041715
tot_cultla0.0966092130.0274248623.52270.0004272
ln_income−0.0450480780.017904399−2.5160.0118684
DAP_20.055029420.0377570771.45750.1449895
insecticide−0.1035422820.039494583−2.62170.0087497
hybrid_20.1298875840.0487956112.66190.0077708
hh_size20.0133604960.007180641.86060.0627968
credit_2−0.0495157270.037017275−1.33760.1810143
educ_hh0.0074907590.0056460861.32670.1846022
numberofph0.0037987310.0035743951.06280.2878899
herbicide_0.1419113720.0988807441.43520.1512367
hh_groups0.1192690540.0510543092.33610.0194849
training_2−0.0258936690.052575736−0.49250.6223643
extension_0.038379750.0500890430.76620.4435392
lag.Age_hh_new0.0041166880.0031181041.32030.1867504
lag.TLU_2−0.020277660.027766585−0.73030.4652129
lag.soilfertil0.091266570.0543052441.68060.0928364
lag.plot_dist0.00526460.0018016322.92210.0034765
lag.dist_ext−0.0009268090.000679809−1.36330.1727765
lag.altitude−0.0000689880.000192774−0.35790.7204403
lag.localseed_0.0239645620.0944371780.25380.7996795
lag.lnyield0.0359083680.0242308381.48190.1383593
lag.total_land0.0060201130.0253124090.23780.812011
lag.tot_cultla0.0066369440.0522356740.12710.8988947
lag.ln_income0.0150461310.0408421150.36840.7125769
lag.DAP_2−0.0519749910.083031446−0.6260.5313362
lag.insecticid−0.1413786190.083269934−1.69780.0895389
lag.hybrid_2−0.0754723210.10116769−0.7460.4556601
lag.hh_size20.0120318460.0169985070.70780.4790584
lag.credit_2−0.1213600290.083361088−1.45580.1454381
lag.educ_hh0.0038791220.0124575220.31140.7555057
lag.numberofph0.0184347190.0087426972.10860.0349804
lag.herbicide_0.0351706660.1904628450.18470.8534966
lag.hh_groups0.0248994020.1102912060.22580.8213877
lag.training_20.0330805510.1088503970.30390.7611977
lag.extension_0.0118911470.106260420.11190.9108982
Rho: 0.14888, LR test value: 4.8641, p-value: 0.027421
Asymptotic standard error: 0.066296
z-value: 2.2457, p-value: 0.02472
Wald statistic: 5.0434, p-value: 0.02472
Log likelihood: −148.5598 for mixed model
ML residual variance (sigma squared): 0.10521, (sigma: 0.32435)
Number of observations: 504
Number of parameters estimated: 47
AIC: 391.12, (AIC for lm: 393.98)
LM test for residual autocorrelation
test value: 0.47136, p-value: 0.49236
  • Low AIC values indicate a good model fit
  • Local seed, yield, total land, total cultivated land, income, insecticide, hybrid, household size, house hold group, lag. plot distance and lag number of phones were significant with p-values less than 0.05.
DirectIndirectTotal
Age_hh_new0.000730.004840.00557 (−0.00189, 0.01326)
TLU_2−0.01669−0.02610−0.04279 (−0.11397, 0.02686)
soilfertil0.000360.104710.10507 (−0.02585, 0.23024)
plot_dist0.001310.006260.00757 (0.00326, 0.01213)
dist_ext−0.00050−0.00115−0.00165 (−0.00338, −0.00012)
altitude0.00002−0.00008−0.00006 (−0.00050, 0.00040)
localseed_0.106010.045570.15158 (−0.07572, 0.37378)
lnyield0.035220.047180.08240 (0.02863, 0.13919)
total_land−0.035370.00086−0.03451 (−0.09748, 0.02672)
tot_cultla0.097120.024190.12131 (−0.00012, 0.24929)
ln_income−0.044850.00960−0.03525 (−0.13776, 0.06286)
DAP_20.05397−0.050380.00359 (−0.20882, 0.20769)
insecticid−0.10734−0.18043−0.28776 (−0.49739, −0.08137)
hybrid_20.12853−0.064590.06393 (−0.18604, 0.31258)
hh_size20.013700.016130.02983 (−0.01350, 0.07277)
credit_2−0.05263−0.14813−0.20077 (−0.42408, 0.00599)
educ_hh0.007610.005750.01336 (−0.02050, 0.04441)
numberofph0.004260.021860.02612 (0.00487, 0.04634)
herbicide_0.143270.064780.20806 (−0.22190, 0.67516)
hh_groups0.120300.049090.16939 (−0.12826, 0.45474)
training_2−0.025190.033630.00844 (−0.24039, 0.27499)
extension_0.038810.020260.05906 (−0.22102, 0.31780)
Table A1. Direct, indirect and total effect estimates of the SDM probit model.
VariablesDirect EffectsIndirect EffectsTotal Effects
hh_size2−0.0153−0.0971−0.1124 (−0.2116, −0.0244)
sex_hh10.04690.36280.4097 (−0.1476, 0.9654)
altitude0.00030.00090.0012 (0.0006, 0.0019)
dist_ext0.0007−0.0016−0.0010 (−0.0038, 0.0018)
needcredit_210.02980.23480.2646 (−0.0318, 0.5912)
hh_groups_many0.05070.06670.1174 (−0.0602, 0.2848)
total_land−0.0045−0.0105−0.0150 (−0.0709, 0.0418)
TLU_20.01360.01650.0302 (−0.0569, 0.1202)
plot_dist−0.00440.0006−0.0038 (−0.0121, 0.0041)
yield0.00000.00000.0000 (−0.0001, 0.0000)
hybrid_210.23280.38470.6175 (0.0191, 1.2320)
phones10.03410.22020.2543 (−0.1461, 0.6586)
training_21−0.0195−0.1470−0.1665 (−0.5376, 0.1752)
years_vill0.00260.00870.0113 (0.0020, 0.0216)

References

  1. The State of Food Security and Nutrition in the World: Safeguarding Against Economic Slowdowns and Downturns; United Nations Publications: New York, NY, USA, 2019.
  2. Kariuki, S.; Mwangi, M.N. Factors determining adoption of new agricultural technology by smallholder farmers in developing countries Factors Determining Adoption of New Agricultural Technology by Smallholder Farmers in Developing Countries. J. Econ. Sustain. Dev. 2015, 6, 208–216. [Google Scholar]
  3. Kalovoto Damariis, M.; Kimiti Jacinta, M.; Manono Bonface, O. Influence of women empowerment on adoption of agroforestry technologies to counter climate change and variability in semi-arid Makueni County, Kenya. Int. J. Environ. Sci. Nat. Resour. 2020, 24, 47–55. [Google Scholar]
  4. Harris, T. (Ed.) Africa Agriculture Status Report 2014: Climate Change and Smallholder Agriculture in Sub-Saharan Africa; AGRA: Nairobi, Kenya, 2014. [Google Scholar]
  5. Kassie, M.; Stage, J.; Diiro, G.; Muriithi, B.; Muricho, G.; Ledermann, S.T.; Pittchar, J.; Midega, C.; Khan, Z. Push–pull farming system in Kenya: Implications for economic and social welfare. Land Use Policy 2018, 77, 186–198. [Google Scholar] [CrossRef]
  6. Reynolds, T.W.; Waddington, S.R.; Anderson, C.L.; Chew, A.; True, Z.; Cullen, A. Environmental impacts and constraints associated with the production of major food crops in Sub-Saharan Africa and South Asia. Food Secur. 2015, 795–822. [Google Scholar] [CrossRef]
  7. Tadele, Z. Raising Crop Productivity in Africa through Intensification. Agronomy 2017, 7, 22. [Google Scholar] [CrossRef]
  8. Waddington, S.R.; Li, X.; Dixon, J.; Hyman, G.; de Vicente, M.C. Getting the focus right: Production constraints for six major food crops in Asian and African farming systems. Food Secur. 2010, 2, 27–48. [Google Scholar] [CrossRef]
  9. FAO. Country Fact Sheet on Food and Agriculture Policy Trends—Rwanda; FAO: Rome, Italy, 2016; p. 7. [Google Scholar]
  10. Gibbon, D.; Dixon, J.; Flores, D. Beyond Drought Tolerant Maize: Study of Additional Priorities in Maize; CIMMYT: El Batan, Mexico, 2007. [Google Scholar]
  11. Rwomushana, I.; Bateman, M.; Beale, T.; Beseh, P.; Cameron, K.; Chiluba, M.; Clottey, V.; Davis, T.; Day, R.; Early, R.; et al. Fall Armyworm: Impacts and Implications for Africa: Evidence Note Update, October 2018; CIMMYT: El Batan, Mexico, 2018. [Google Scholar]
  12. Tambo, J.A.; Uzayisenga, B.; Mugambi, I.; Bundi, M.; Silvestri, S. Plant clinics, farm performance and poverty alleviation: Panel data evidence from Rwanda. World Dev. 2020, 129, 104881. [Google Scholar] [CrossRef]
  13. Kassie, M.; Wossen, T.; De Groote, H.; Tefera, T.; Sevgan, S.; Balew, S. Economic impacts of fall armyworm and its management strategies: Evidence from southern Ethiopia. Eur. Rev. Agric. Econ. 2020, 47, 1473–1501. [Google Scholar] [CrossRef]
  14. Yigezu, G.; Wakgari, M. Local and indigenous knowledge of farmers management practice against fall armyworm(Spodoptera frugiperda) (J. E. Smith)(Lepidoptera:Noctuidae): A review. J. Entomol. Zool. Stud. 2020, 8, 765–770. [Google Scholar]
  15. Kfir, R.; Overholt, W.A.; Khan, Z.R.; Polaszek, A. Biology and management of economically important lepidopteran cereal stem borers in Africa. Annu. Rev. Entomol. 2002, 47, 701–731. [Google Scholar] [CrossRef]
  16. Rodenburg, J.; Demont, M.; Zwart, S.J.; Bastiaans, L. Parasitic weed incidence and related economic losses in rice in Africa. Agric. Ecosyst. Environ. 2016, 235, 306–317. [Google Scholar] [CrossRef]
  17. Nkomoki, W.; Bavorov, M.; Banout, J. Factors Associated with Household Food Security in Zambia. Sustainability 2019, 11, 2715. [Google Scholar] [CrossRef]
  18. Meijer, S.S.; Catacutan, D.; Ajayi, O.C.; Sileshi, G.W.; Nieuwenhuis, M. The role of knowledge, attitudes and perceptions in the uptake of agricultural and agroforestry innovations among smallholder farmers in sub-Saharan Africa. Int. J. Agric. Sustain. 2015, 13, 40–54. [Google Scholar] [CrossRef]
  19. Pickett, J.A.; Woodcock, C.M.; Midega, C.A.O.; Khan, Z.R. Push–pull farming systems. Curr. Opin. Biotechnol. 2014, 26, 125–132. [Google Scholar] [CrossRef] [PubMed]
  20. Khan, Z.R.; Midega, C.A.O.; Pittchar, J.O.; Murage, A.W.; Birkett, M.A.; Bruce, T.J.A.; Pickett, J.A. Achieving food security for one million sub-Saharan African poor through push–pull innovation by 2020. Philos. Trans. R. Soc. B Biol. Sci. 2014, 369, 20120284. [Google Scholar] [CrossRef] [PubMed]
  21. Khan, Z.R.; Midega, C.A.O.; Njuguna, E.M.; Amudavi, D.M.; Wanyama, J.M.; Pickett, J.A. Economic performance of the ‘push–pull’ technology for stemborer and Striga control in smallholder farming systems in western Kenya. Crop Prot. 2008, 27, 1084–1097. [Google Scholar] [CrossRef]
  22. Khan, Z.R.; Pickett, J.A. The ‘push-pull’strategy for stemborer management: A case study in exploiting biodiversity and chemical ecology. In Ecological Engineering for Pest Management: Advances in Habitat Manipulation for Arthropods; Comstock Publishing Associates: Ithaca, NY, USA, 2004; pp. 155–164. [Google Scholar]
  23. Abate, M.; Atnafu, G.; Alemu, B.; Alameneh, Y.; Molla, A.; Tadesse, M.; Gebremariam, G. Evaluation of push-pull technology for pest and soil fertility management on maize in northwestern Ethiopia. Ital. J. Agron. 2024, 19, 00012. [Google Scholar] [CrossRef]
  24. Niassy, S.; Agbodzavu, M.K.; Mudereri, B.T.; Kamalongo, D.; Ligowe, I.; Hailu, G.; Kimathi, E.; Jere, Z.; Ochatum, N.; Pittchar, J.; et al. Performance of Push–Pull Technology in Low-Fertility Soils under Conventional and Conservation Agriculture Farming Systems in Malawi. Sustainability 2022, 14, 2162. [Google Scholar] [CrossRef]
  25. Teshome, A.; De Graaff, J.; Ritsema, C.; Kassie, M. Farmers’ perceptions about the influence of land quality, land fragmentation and tenure systems on sustainable land management in the north western Ethiopian highlands. Land Degrad. Dev. 2014, 898, 884–898. [Google Scholar] [CrossRef]
  26. Agboka, K.M.; Tonnang, H.E.Z.; Abdel-Rahman, E.M.; Odindi, J.; Mutanga, O.; Niassy, S. Data-Driven Artificial Intelligence (AI) Algorithms for Modelling Potential Maize Yield under Maize–Legume Farming Systems in East Africa. Agronomy 2022, 12, 3085. [Google Scholar] [CrossRef]
  27. Nahayo, A.; Pan, G.; Joseph, S. Factors influencing the adoption of soil conservation techniques in Northern Rwanda. J. Plant Nutr. Soil Sci. 2016, 367–375. [Google Scholar] [CrossRef]
  28. Lapple, D.; Kelley, H. Spatial Dependence in the Adoption of Organic Drystock Farming in Ireland. Eur. Rev. Agric. Econ. 2014, 42, 315–337. [Google Scholar] [CrossRef]
  29. Laepple, D.; Holloway, G.; Lacombe, D.J.; O’Donaghue, C. Sustainable technology adoption: Who and what matters in a farmer’s decision? Eur. Rev. Agric. Econ. 2017, 44, 810–835. [Google Scholar]
  30. Tirkaso, W.T.; Hailu, A. Does Neighborhood Matter? Spatial Proximity and Farmers Technical Efficiency in Ethipia. Agric. Econ. 2019, 53, 374–386. [Google Scholar] [CrossRef]
  31. Manski, C.F. Identification of endogenous social effects: The reflection problem. Rev. Econ. Stud. 1993, 60, 531–542. [Google Scholar] [CrossRef]
  32. Funes, J. The Role of Social Interaction in the Adoption and Geographic Diffusion of an Agricultural Technology: The Case of High Iron Bean (Phaseolus Vulgaris) in Rwanda. In Proceedings of the 2018 Agricultural & Applied Economics Association Annual Meeting, Washington, DC, USA, 5–7 August 2018. [Google Scholar]
  33. Krishnan, P.; Patnam, M. Neighbours and Extension Agents in Ethiopia: Who Matters more for Technology Diffusion? The IGC: London, UK, 2013; pp. 1–31. [Google Scholar]
  34. Ward, P.S.; Pede, V.O. Capturing social network effects in technology adoption: The spatial diffusion of hybrid rice in Bangladesh. Aust. J. Agric. Resour. Econ. 2015, 59, 225–241. [Google Scholar] [CrossRef]
  35. Yamauchi, F. Social learning, neighborhood effects, and investment in human capital: Evidence from Green-Revolution India. J. Dev. Econ. 2007, 83, 37–62. [Google Scholar] [CrossRef]
  36. Abdulai, A.; Huffman, W. The adoption and impact of soil and water conservation technology: An endogenous switching regression application. Land Econ. 2014, 90, 26–43. [Google Scholar] [CrossRef]
  37. Maertens, A.; Barrett, C.B. Measuring social networks’ effects on agricultural technology adoption. Am. J. Agric. Econ. 2013, 95, 353–359. [Google Scholar] [CrossRef]
  38. Qi, X.; Liang, F.; Yuan, W.; Zhang, T.; Li, J. Factors influencing farmers’ adoption of eco-friendly fertilization technology in grain production: An integrated spatial–econometric analysis in China. J. Clean. Prod. 2021, 310, 127536. [Google Scholar] [CrossRef]
  39. Conley, T.G.; Udry, C.R. Learning about a new technology: Pineapple in Ghana. Am. Econ. Rev. 2010, 100, 35–69. [Google Scholar] [CrossRef]
  40. Yang, W. Spatial dependence and determinants of dairy farmers’ adoption of best management practices for water protection. In Proceedings of the 29th Annual FLRC Workshop, Online, 9–11 February 2016; pp. 1–7. [Google Scholar]
  41. Adjognon, S.; Liverpool-Tasie, L.S. Spatial Neighborhood Effects in Agricultural Technology Adoption: Evidence from Nigeria. In Proceedings of the International Association of Agricultural Economists 2015 Conference, Milan, Italy, 9–14 August 2015. [Google Scholar]
  42. Amudavi, D.; Khan, Z.; Wanyama, J.; Midega, C.; Pittchar, J.; Nyangau, I.; Hassanali, A.; Pickett, J. Assessment of technical efficiency of farmer teachers in the uptake and dissemination of push–pull technology in Western Kenya. Crop Prot. 2009, 28, 987–996. [Google Scholar] [CrossRef]
  43. Niassy, S.; Kidoido, M.; Mbeche, N.I.; Pittchar, J.; Hailu, G.; Owino, R.; Amudavi, D.; Khan, Z. Adoption and willingness to pay for the push–pull technology among smallholder maize farmers in Rwanda. Int. J. Agric. Ext. Rural Dev. 2020, 8, 3254–5428. [Google Scholar]
  44. Hui, E.C.M.; Liang, C. Spatial spillover effect of urban landscape views on property price. Appl. Geogr. 2016, 72, 26–35. [Google Scholar] [CrossRef]
  45. LeSage, J.; Pace, R.K. Introduction to Spatial Econometrics; Chapman & Hall: London, UK, 2009. [Google Scholar]
  46. Allaire, G.; Cahuzac, E.; Simioni, M. Spatial Diffusion and Adoption of European Agri-Environmental Supports Related to Extensive Grazing in France. In Proceedings of the 5èmes Journées De Recherche En Sciences Sociales, Dijon, France, 8–9 December 2011; pp. 1–25. [Google Scholar]
  47. Yang, W.; Sharp, B. Spatial Dependence and Determinants of Dairy Farmers’ Adoption of Best Management Practices for Water Protection in New Zealand. Environ. Manag. 2017, 59, 594–603. [Google Scholar] [CrossRef]
  48. Dharshing, S. Household dynamics of technology adoption: A spatial econometric analysis of residential solar photovoltaic (PV) systems in Germany. Energy Res. Soc. Sci. 2017, 23, 113–124. [Google Scholar] [CrossRef]
  49. Wollni, M.; Andersson, C. Spatial patterns of organic agriculture adoption: Evidence from Honduras. Ecol. Econ. 2014, 97, 120–128. [Google Scholar] [CrossRef]
  50. Boliko, M.C. FAO and the situation of food security and nutrition in the world. J. Nutr. Sci. Vitaminol. 2019, 65, S4–S8. [Google Scholar] [CrossRef]
  51. Muriithi, B.W.; Menale, K.; Diiro, G.; Muricho, G. Does gender matter in the adoption of push-pull pest management and other sustainable agricultural practices? Evidence from Western Kenya. Food Secur. 2018, 10, 253–272. [Google Scholar] [CrossRef]
  52. Nyang’au, J.O.; Mohamed, J.H.; Mango, N.; Makate, C.; Wangeci, A.N. Smallholder farmers’ perception of climate change and adoption of climate smart agriculture practices in Masaba South Sub-county, Kisii, Kenya. Heliyon 2021, 7, e06789. [Google Scholar] [CrossRef]
  53. Wossen, T.; Berger, T.; Mequaninte, T.; Alamirew, B. Social network effects on the adoption of sustainable natural resource management practices in Ethiopia. Int. J. Sustain. Dev. World Ecol. 2013, 20, 477–483. [Google Scholar] [CrossRef]
  54. Tessema, Y.M.; JAsafu-Adjaye Kassie, M.; Mallawaarachchi, T. Do Neighbours Matter in Technology Adoption? The Case of Conservation Tillage in Northwest Ethiopia. Afr. J. Agric. Resour. Econ. 2016, 11, 211–225. [Google Scholar]
  55. Deichmann, U. A Spatial Analysis of Technology Adoption in Sub-Saharan Africa; University of California: Santa Barbara, CA, USA, 1996. [Google Scholar]
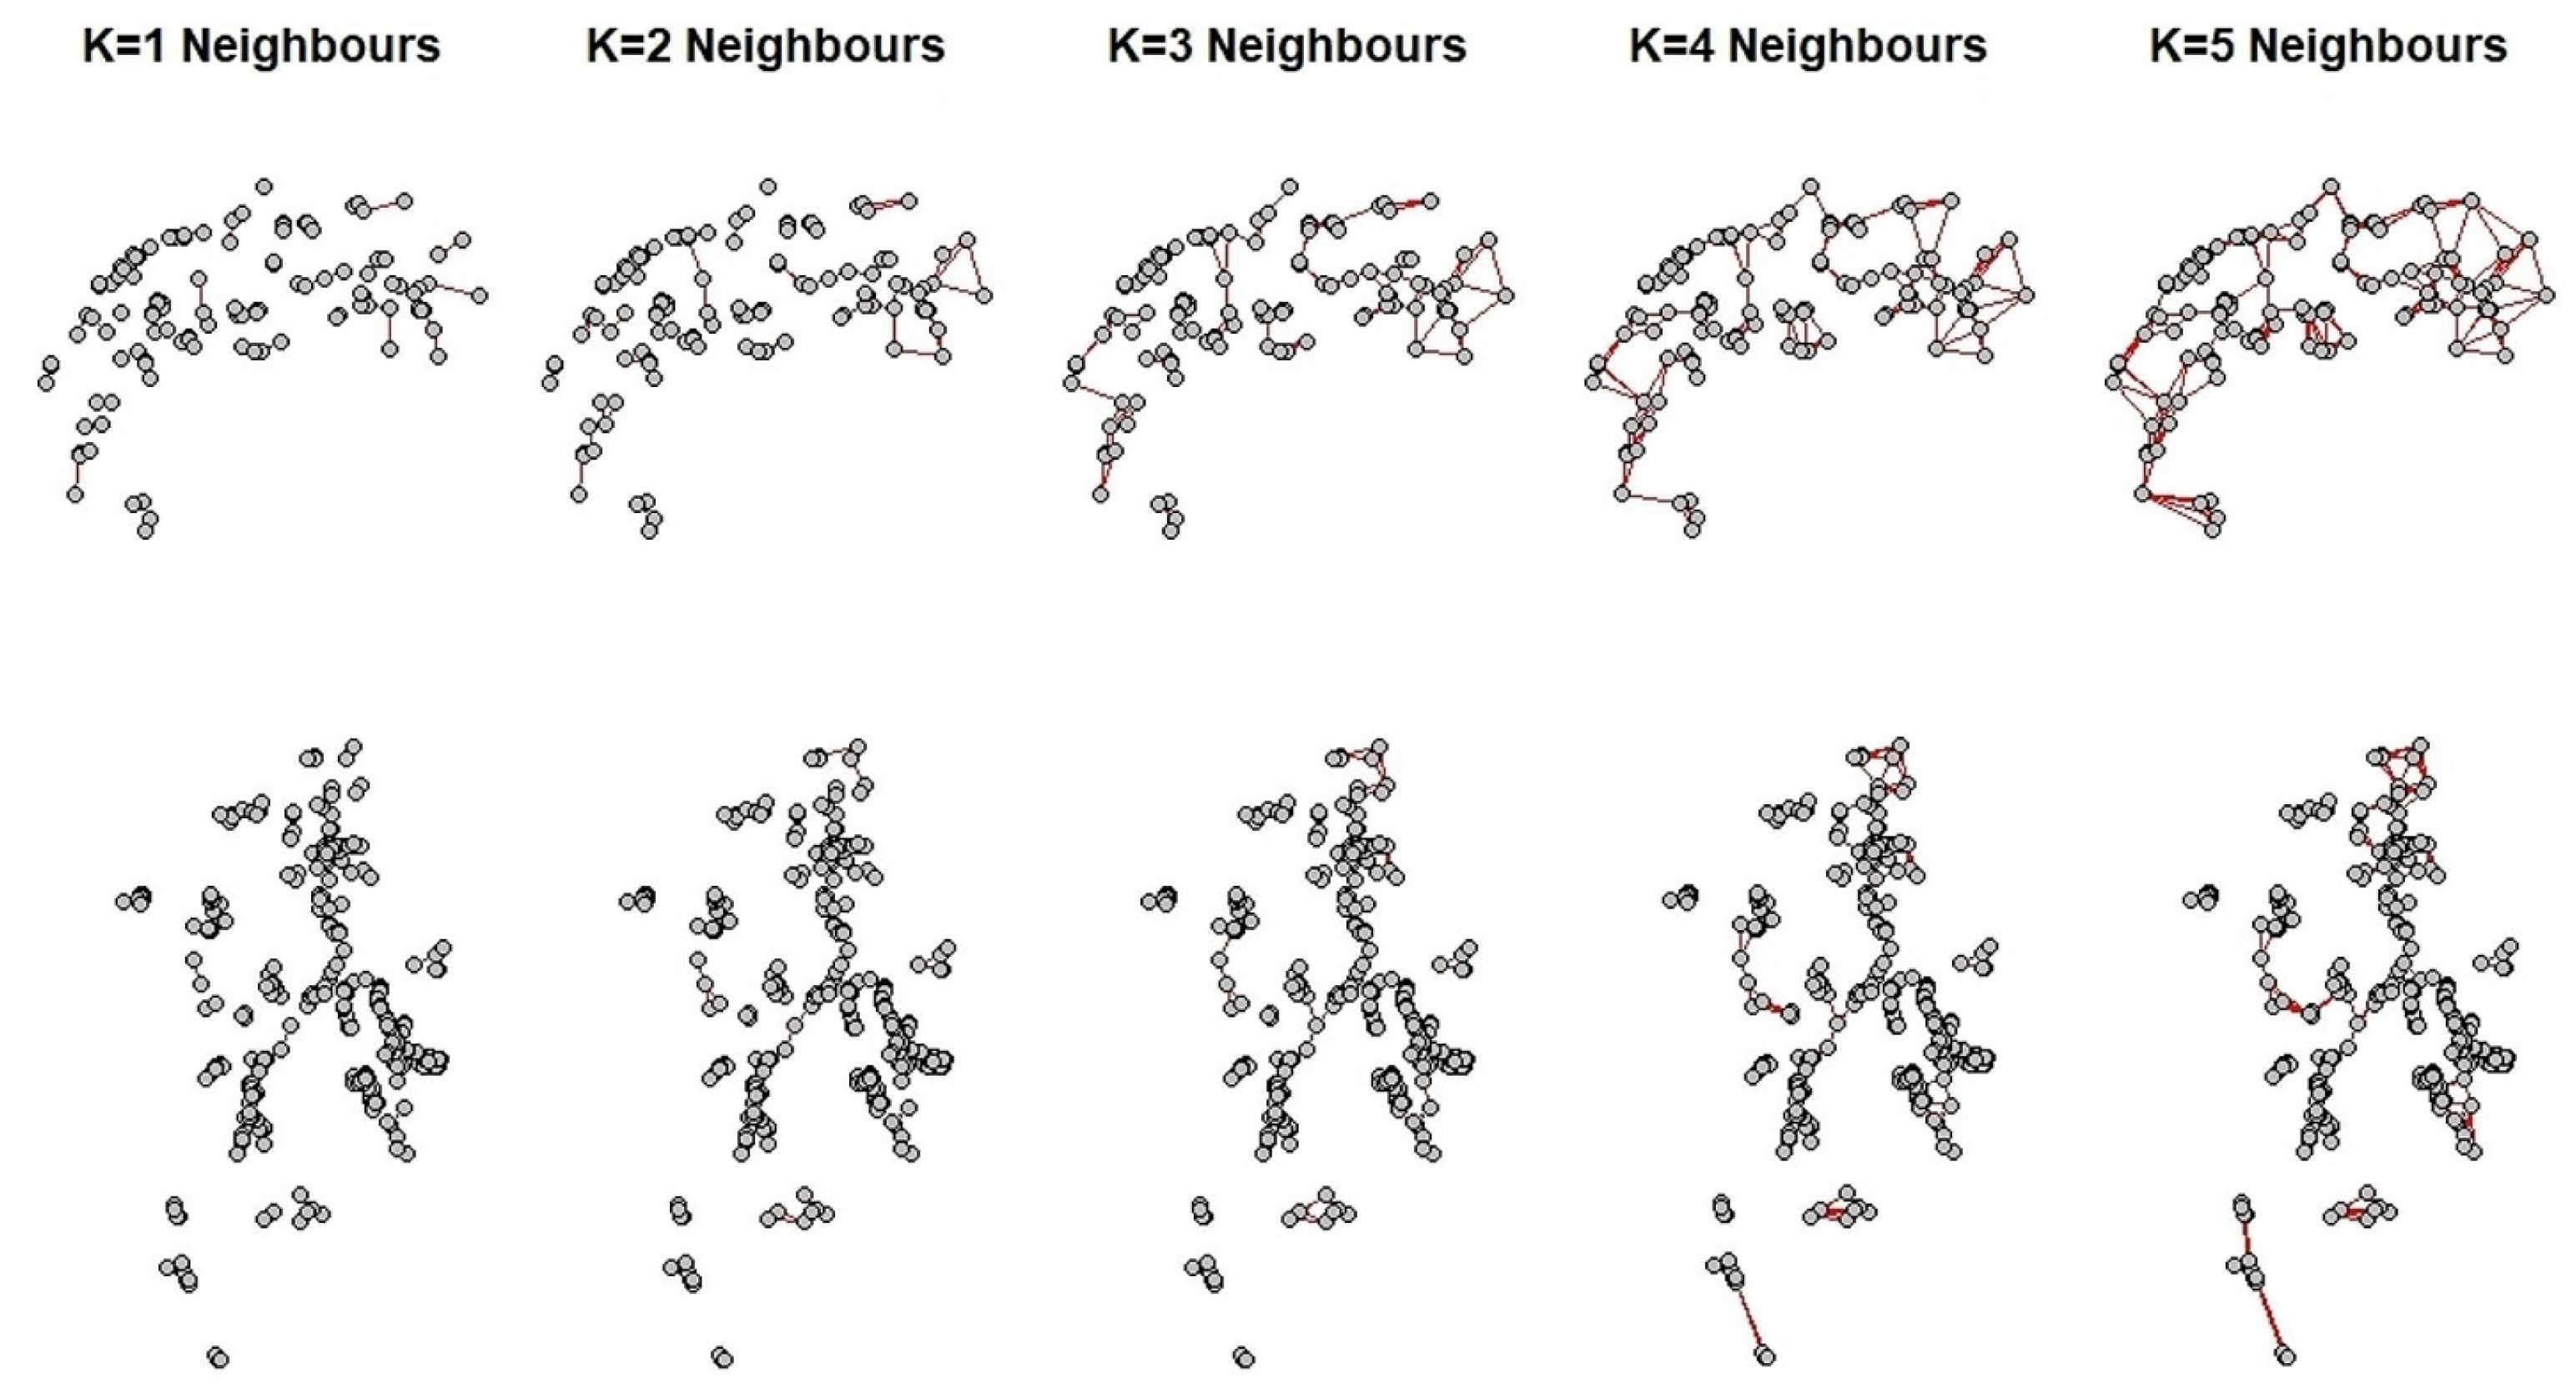
Figure 1. Sampled push–pull technology farmers in Gatsibo and Nyagatare districts within Eastern Province, Rwanda.
Sustainability 16 10349 g001
Figure 2. Representation of the disjoint regions that form a sphere of influence, based on varying K-values in a K-nearest neighbour analysis.
Sustainability 16 10349 g002
Table 1. K-mean value estimation.
K ValueDisjoint RegionsDistance (m)
11521189.90
2621292.52
3291308.05
4161907.34
581962.38
682257.92
762307.59
862327.46
952671.36
1042793.70
Table 2. Model variables definitions.
VariablesDescriptions
Response Variable
Soil ManagementUse of grass strips or/and soil bunds as soil management practices (SMP) (No = 0, Yes = 1)
Explanatory Variables
Age_hh_new Age of the household head (years)
TLU_2Tropical livestock units (TLUs)
Soilfertil Soil fertility (Good = 1, Medium = 2, Low = 3)
Plot_distDistance to the cultivated plot (in minutes of walking time)
Dist_extDistance to source of extension services (in minutes of walking time)
AltitudeGround height measured in metres above sea level (m.a.s.l)
Localseed_Use of local seed (No = 0, Yes = 1)
Lnyield Natural log of maize yield achieved by the household
Total_land Total land owned (hectares)
Tot_cultlaTotal cultivated land (hectares)
Ln_income Natural log of household income
Hybrid_2Farmers use of hybrid maize (No = 0, Yes = 1)
DAP_2Use of diammonium phosphate fertiliser (No = 0, Yes = 1)
Insecticide Used insecticide (No = 1, Yes = 1)
Hh_size2Total number of people in the household
credit_2 Used credit in maize production (No = 0, Yes = 1)
Continue PPTFarmer willingness to continue PPT (No = 0, Yes = 1).
numberofphNumber of mobile phones within the household (No = 0, One = 5 Two or more = 12)
educ_hhActual number of schooling years of household head.
herbicideUsed herbicides (No = 0, Yes = 1)
Hh_groupsNumber of farmer groups the household belongs to
Extension Access to extension services from relevant authorities (No = 0, Yes = 1).
training_2Household received training in PPT use (No = 0, Yes = 1).
Table 3. Summary of descriptive statistics of the variables of the model.
VariablesMinimumMaximumMeanStd. Deviation
Response Variable
Soil Management0.001.000.830.37
Explanatory VariableMinimumMaximumMeanStd. Deviation
Age of house head (years)22.0086.0047.6611.83
Total Livestock Units 0.0013.000.941.25
Soil fertility status (Good = 1, Medium = 2, Low = 3)1.003.001.900.65
Plot distance (minutes of walking time) 1.0090.0016.2217.82
Distance to extension services (minutes of walking time)2.00240.0043.5144.86
Altitude (m.a.s.l.)1133.005047.001526.72191.89
Used local seed (No = 0, Yes = 1)0.001.000.320.47
Natural log of yield 3.309.106.111.40
Total land owned (ha)0.0214.822.072.49
Total land cultivated (ha)0.044.591.051.12
Natural log of household income 8.5812.7510.840.94
Used DAP fertiliser (No = 0, Yes = 1)0.001.000.310.46
Used insecticide (No = 0, Yes = 1)0.001.000.260.44
Used hybrid seed (No = 0, Yes = 1)0.001.000.720.45
Household size (members) 1.0019.005.212.17
Used credit (No = 0, Yes = 1)0.001.000.250.43
Education level of household head (years)0.0017.004.632.84
Number of mobile phones in the household (No = 0, One = 5 Two or more = 12).0.0012.005.874.84
Used herbicides (No = 0, Yes = 1)0.001.000.030.16
Number of farmer groups household belongs to (number)0.001.000.890.31
Accessed training in PPT (No = 0, Yes = 1)0.001.000.400.49
Accessed extension services (No = 0, Yes = 1)0.001.000.520.50
Table 4. Spatial Durbin probit model results of statistical test.
EstimateStd. Errorz ValuePr(>|z|)
(Intercept)−0.2150.636−0.3390.735
Age of house head (years)0.0010.0010.4570.648
Total Livestock Units −0.0160.013−1.2740.203
Soil fertility status (Good = 1, Medium = 2, Low = 3)−0.0020.024−0.0780.938
Plot distance (minutes of walking time)0.0010.0011.3630.173
Distance to extension services (minutes of walking time)−0.0010.000−1.3280.184
Altitude (m.a.s.l.)0.0000.0000.2310.817
Used local seed (No = 0, Yes = 1)0.1050.0472.2240.026 **
Natural log of yield 0.0340.0122.8910.004 ***
Total land owned (ha)−0.0350.012−2.8650.004 ***
Total land cultivated (ha)0.0970.0273.5230.000 ***
Natural log of household income −0.0450.018−2.5160.012 **
Used DAP fertiliser (No = 0, Yes = 1)0.0550.0381.4580.145
Used insecticide (No = 0, Yes = 1)−0.1040.039−2.6220.009 ***
Used hybrid seed (No = 0, Yes = 1)0.1300.0492.6620.008 ***
Household size (members) 0.0130.0071.8610.063 *
Used credit (No = 0, Yes = 1)−0.0490.037−1.3380.181
Education level of household head (years)0.0080.0061.3270.185
Number of mobile phones in the household (No = 0, One = 5, Two or more = 12).0.0040.0041.0630.288
Used herbicides (No = 0, Yes = 1)0.1420.0991.4350.151
Number of farmer groups household belongs to (number)0.1190.0512.3360.019 **
Accessed training in PPT (No = 0, Yes = 1)−0.0260.053−0.4930.622
Accessed extension services (No = 0, Yes = 1)0.0380.0500.7660.444
lag.Age_hh_new0.0040.0031.3200.187
lag.TLU_2−0.0200.028−0.7300.465
lag.soilfertil0.0910.0541.6810.093 *
lag.plot_dist0.0050.0022.9220.003 ***
lag.dist_ext−0.0010.001−1.3630.173
lag.altitude0.0000.000−0.3580.720
lag.localseed_0.0240.0940.2540.800
lag.lnyield0.0360.0241.4820.138
lag.total_land0.0060.0250.2380.812
lag.tot_cultla0.0070.0520.1270.899
lag.ln_income0.0150.0410.3680.713
lag.DAP_2−0.0520.083−0.6260.531
lag.insecticid−0.1410.083−1.6980.090 *
lag.hybrid_2−0.0760.101−0.7460.456
lag.hh_size20.0120.0170.7080.479
lag.credit_2−0.1210.083−1.4560.145
lag.educ_hh0.0040.0120.3110.756
lag.numberofph0.0180.0092.1090.035 *
lag.herbicide_0.0350.1900.1850.853
lag.hh_groups0.0230.1100.2260.821
lag.training_20.0330.1090.3040.761
lag.extension_0.0120.1060.1120.911
Rho: 0.14888, LR test value: 4.8641, p-value: 0.027421
Asymptotic standard error: 0.066296
z-value: 2.2457, p-value: 0.02472
Wald statistic: 5.0434, p-value: 0.02472
Log likelihood: −148.5598 for mixed model
ML residual variance (sigma squared): 0.10521, (sigma: 0.32435)
Number of observations: 504
Number of parameters estimated: 47
AIC: 391.12, (AIC for lm: 393.98)
LM test for residual autocorrelation
test value: 0.47136, p-value: 0.49236
Note: *, **, and *** denote statistical significance at the 0.1, 0.05, and 0.01 levels, respectively.
Table 5. Direct, indirect and total effect estimates of the SDM probit model.
DirectIndirectTotal
Age of house head (years)0.0010.0050.006 (−0.00189, 0.01326)
Total Livestock Units −0.017−0.026−0.043 (−0.11397, 0.02686)
Soil fertility status (Good = 1, Medium = 2, Low = 3)0.0000.1050.105 (−0.02585, 0.23024)
Plot distance (minutes of walking time)0.0010.0060.008 (0.00326, 0.01213)
Distance to extension services (minutes of walking time)−0.001−0.001−0.002 (−0.00338, −0.00012)
Altitude (m.a.s.l.)0.0000.000−0.000 (−0.00050, 0.00040)
Used local seed (No = 0, Yes = 1)0.1060.0460.152 (−0.07572, 0.37378)
Natural log of yield 0.0350.0470.082 (0.02863, 0.13919)
Total land owned (ha)−0.0350.001−0.035 (−0.09748, 0.02672)
Total land cultivated (ha)0.0970.0240.121 (−0.00012, 0.24929)
Natural log of household income −0.0450.010−0.035 (−0.13776, 0.06286)
Used DAP fertiliser (No = 0, Yes = 1)0.054−0.0500.004 (−0.20882, 0.20769)
Used insecticide (No = 0, Yes = 1)−0.107−0.180−0.288 (−0.49739, −0.08137)
Used hybrid seed (No = 0, Yes = 1)0.129−0.0650.064 (−0.18604, 0.31258)
Household size (members) 0.0140.0160.029 (−0.01350, 0.07277)
Used credit (No = 0, Yes = 1)−0.053−0.148−0.201 (−0.42408, 0.00599)
Education level of household head (years)0.0080.0060.013 (−0.02050, 0.04441)
Number of mobile phones in the household (No = 0, One = 5 Two or more = 12).0.0040.0220.026 (0.00487, 0.04634)
Used herbicides (No = 0, Yes = 1)0.1430.0650.208 (−0.22190, 0.67516)
Number of farmer groups household belongs to (number)0.1200.0490.169 (−0.12826, 0.45474)
Accessed training in PPT (No = 0, Yes = 1)−0.0250.0340.008 (−0.24039, 0.27499)
Accessed extension services (No = 0, Yes = 1)0.0390.0200.059 (−0.22102, 0.31780)
Disclaimer/Publisher’s Note: The statements, opinions and data contained in all publications are solely those of the individual author(s) and contributor(s) and not of MDPI and/or the editor(s). MDPI and/or the editor(s) disclaim responsibility for any injury to people or property resulting from any ideas, methods, instructions or products referred to in the content.

