Abstract
This study explores the measurement of FTZs’ investment attraction from a sustainable corporate development perspective. Through a comprehensive evaluation framework, the study assesses FTZs’ investment attraction across five indicators: urban business environment, economic development strength, innovation and openness vitality, urban environmental friendliness, and high-quality enterprise development. The weights of each layer’s indicators are calculated using entropy weight and the PCA method. The evaluation results of the investment attractiveness of China’s FTZs show that the investment attraction of FTZs in different regions exhibits hierarchical characteristics and unbalanced development. East China and South China occupy the forefront. Disparities in provincial FTZs’ developmental balance are conspicuous. Guangdong, Shanghai, and Beijing top the charts in terms of congruence with their overall environment rankings, whereas Jiangsu, Zhejiang, and Fujian exhibit a mismatch between their sub-indices and their relatively strong overall investment attractiveness. Conversely, Henan, Anhui, Hebei, Heilongjiang, Hunan, and Tianjin, though balanced in sub-environmental development, lag in overall investment appeal, necessitating concerted efforts towards balanced development. On the whole, compared with other indicators, innovation and openness vitality and high-quality enterprise development seem relatively weak. Drawing from our insights, foreign investors can choose free trade zones according to their own development needs. Policymakers can devise targeted interventions to bolster FTZs’ investment attractiveness, tailored to scores and rankings.
1. Introduction
Within the intricate fabric of global economic integration, free trade zones (FTZs) have emerged as strategic epicenters, fostering international trade and investment flows while igniting economic growth and diversification. Traditionally, FTZs leveraged preferential policies, such as tax incentives and streamlined regulatory frameworks, as magnets for foreign direct investment (FDI). However, the global investment landscape has undergone a significance transformation, with sustainability ascending to the forefront of corporate decision-making processes [1].
The ascendancy of sustainability as a pivotal investment criterion underscores a broader recognition of the intricate interdependencies between economic, social, and environmental dimensions. Prior research on FTZ investment attraction has predominantly focused on economic fundamentals like market size, infrastructural development, and policy incentives [2]. Multinational enterprises (MNEs) now are more inclined to invest in regions that promote the sustainable development of enterprises, aiming to mitigate environmental impacts, foster social welfare, and ensure economic resilience [3]. This paradigm shift necessitates a reassessment of FTZs’ investment attractiveness, particularly those in China, which have long been vanguards in terms of attracting FDI.
In order to cater to the new considerations of enterprise development, this paper attempts to develop a comprehensive evaluation framework for FTZ investment attraction based on sustainable enterprise development. It makes a new contribution by providing a sustainable perspective to measure the investment attractiveness of FTZs. By focusing on China’s FTZs, we test the effectiveness of this indicator system and conduct a detailed comparison of the FTZ investment attraction in various provinces. The findings provide guidance for improving the investment attraction of FTZs and promoting the sustainable development of enterprises, and they also provide a reference for foreign investors to formulate investment strategies.
The following section brings out the existing indicators for evaluating investment attractiveness and the factors of focus in location selection under the requirements of sustainable corporate development. Section 3 proposes an FDI attractiveness evaluation system based on sustainable corporate development. In Section 4, we evaluate the development of China’s FTZs. The conclusions, with policy implications and suggestions for foreign investment, are contained in Section 5.
2. Literature Review
2.1. Free Trade Zones’ Investment Attraction
FTZs have emerged as strategic enclaves within national borders, offering reduced tariffs, quotas, and bureaucratic barriers to attract new businesses and FDIs. Governments worldwide, particularly in China, have vigorously promoted FTZs to bolster economic growth, increase foreign exchange earnings, foster export-oriented industries, and create job opportunities [1]. Existing studies on FTZs primarily focus on two aspects: the first explores the role of free trade zone development in regional development [4,5,6,7]. The second explores the determinants of FTZ development, spanning market access, the business environment, government supervision, and the financial landscape [8,9]. In addition, a few studies have focused on the establishment of evaluation frameworks for FTZ development [10,11,12].
Regarding the construction of indicator systems for investment attractiveness, the majority of research has focused on investment environments that are closely related to investment attractiveness. A widely acknowledged perspective is that the investment environment encompasses at least two aspects: a hard environment and soft environment [13,14]. Specifically, the hard environment refers to concrete, materialized, and objective factors such as infrastructure development and resource and energy reserves [15]. In contrast, the soft environment comprises abstract, non-material elements, including legal policies, capital markets, and technological levels [16]. For example, ref. [17] proposes the foreign investment environment evaluation system, mainly including indicators from four aspects: resources, policies, economy, and society. When conducting a comprehensive evaluation of the regional investment environment from the perspective of attracting investments, scholars believe that building indicators should include economy, social culture, infrastructure, politics and law, technology, and natural resources [18,19,20]. Among the important instruments for attracting investment are Special Economic Zones (SEZs) [21]. The low-cost business environment, strategic location, type of operator, and infrastructure and services provided within the zone can attract increasing attention [22]. Ref. [23] emphasizes the importance of labor resources and costs as well as transport accessibility. An FTZ universalizes this institutional advantage by implementing the policy of liberalization and simplification of trade and investment, bringing about tremendous energy for economic development [24].
2.2. Sustainable Corporate Development and Location Selection
The determinants of FDI location have been key issues in academic research. In the previous literature, low labor costs, abundant natural resources, advanced technology, and attractive market size meet the agglomeration effect and resource-seeking motivation of foreign investors [25]. In addition, the institutional affinity of SEZs and FTZs itself could attract more foreign firms [26]. More recently, heightened attention has been directed towards the intricacies of the business environment, particularly fostering corporate sustainability [27]. The primary objective of FTZs lies in attracting FDI [28]. As FTZs strive to attract high-quality FDI, they must demonstrate a commitment to more sustainable corporate development. Therefore, this study argues that sustainability should be a core criterion in assessing FTZs’ investment attraction.
In terms of sustainable corporate development, several factors can be integrated into the evaluation model.
Firstly, environmental indicator is paramount [29]. From an economic perspective, enterprises that prioritize environmental stewardship often enjoy greater operational efficiency and cost savings [30]. Moreover, a favorable local natural environment also serves as a key driver for attracting and retaining talent. Employees, particularly those in skilled and professional roles, often prioritize living in areas with high-quality natural surroundings [31]. Clean air, ample green spaces, and well-maintained public areas can significantly enhance the quality of life, making FTZs more attractive to potential employees. This, in turn, can lead to lower employee turnover, higher job satisfaction, and increased productivity, which are vital for the long-term sustainability of businesses.
Secondly, economic development strength and innovation and the opening-up vitality are essential for sustainability. FTZs should demonstrate strong capital potential [32] and foster an environment conducive to innovation and technology transfer [33,34]. Intellectual property protection is a vital aspect, as it encourages investment in R&D and attracts FDIs seeking advanced technology and know-how [35,36].
Finally, a high-quality business environment can save transaction costs for enterprises [37]. Meanwhile, the presence of high-quality enterprises in a region not only underscores the region’s market potential and investment opportunities but also plays a pivotal role in nurturing a supportive ecosystem [38]. It facilitates knowledge spillovers and technological advancements through inter-firm collaborations and competitive dynamics, enabling firms to innovate and adapt rapidly to market changes [39]. High-quality enterprises tend to establish robust supply chain networks locally, which not only strengthens economic resilience but also fosters mutual dependency and trust among businesses, facilitating smoother operations and reducing transaction costs [40]. This interconnectedness can lead to collective efficiency and the sharing of best practices, ultimately accelerating the pace of business evolution and adaptation to external shocks.
Drawing upon the aforementioned contextual backdrop, this research meticulously formulates investment attraction evaluation metrics from the vantage point of sustainable corporate development. The proposed framework encompasses five pivotal indicators: the city business environment, economic development strength, innovation and openness vitality, urban environmental friendliness, and high-quality enterprise development. To ground this theoretical framework in reality, the paper focuses on China’s FTZs. It meticulously analyzes the current status of these zones in terms of their sustainability efforts, highlighting both the notable achievements and the formidable challenges they face.
3. Materials and Methods
3.1. Methodology
In this study, we used two methods to calculate indicator weights to enhance the robustness of the investment attractiveness indicators for FTZs. The first method is the entropy weight method and the second method is the principal component analysis (PCA) method. Both methods are suitable for calculating the weights of investment attractiveness indicators, and each have their own advantages [41,42,43]. A detailed introduction to each method is provided below.
3.1.1. Entropy Weight Method
Entropy, a measure of the degree of disorder in a system, is an ideal scale for multi-objective decision-making and evaluation. The entropy weight method calculates a comprehensive index by evaluating the information provided by each index. The weights are determined based on the amount of information that each index conveys to the decision-maker [44]. The larger the entropy value of the indicator, the smaller the degree of variation in the indicator value, the amount of information provided, and its role in comprehensive evaluation [45]. The entropy weight method can objectively reflect the amount of information implied by the evaluation index, improve its resolution, and avoid selection bias arising from minor index differences. It can also centrally reflect the indicator information and effectively solve the selection deviation owing to the difference between indicators being too small [46], thereby improving scientific decision-making. The entropy method is used for determining the weights of particular factors to reduce the regional differences between indicators and ensure that the data fluctuation in an index system is within a reasonable range. The entropy weight method, while systematic and objective, relies on the assumption that greater data variability indicates greater importance. This assumption may lead to an overemphasis on areas with more dynamic changes, potentially overlooking the significance of indicators that exhibit stable performance. This is a recognized limitation of the entropy weight method and should be taken into account when interpreting the results.
The calculation process of the entropy weight method is as follows:
- (1)
- Data Standardization
First, the indicators are standardized at all levels. The standardization equations of positive and negative indicators are inconsistent. The standardization of positive indicators is shown in Equation (1), where represents the j-th indicator of the i-th FTZ.
The publicity of negative indicators is shown in Equation (2), where represents the j-th indicator of the i-th FTZ.
- (2)
- Entropy Weight
The entropy weight calculation is divided into two steps. First, we calculate the information entropy using Equations (3)–(5), where represents the j-th index of the standardized i-th FTZ.
Second, the weight is determined by calculating information redundancy using Equations (6) and (7).
- (3)
- Final Scores
The score of each trade test zone is calculated using the weight obtained by the entropy weight method, as shown in Equation (8).
3.1.2. PCA
PCA is an objective weighting method based on dimensionality reduction and feature extraction that is widely used in multi-indicator comprehensive evaluations [47]. Its main purpose is to convert multiple correlated original variables into a few uncorrelated “principal components”, which retain most of the information from the original data and are used to assign weights to indicators.
The advantage of PCA lies in its ability to reduce dimensionality by transforming the original high-dimensional data into a few independent principal components, which retain most of the information from the original data. This simplification reduces the model’s complexity and data redundancy [48]. Furthermore, when calculating weights, PCA relies on the internal correlations within the data, analyzing the covariance matrix to determine the variable combinations that best explain the variance. This provides a way to reduce the effects of multicollinearity. However, PCA has some disadvantages, particularly in terms of interpretability, as the principal components are linear combinations of the original indicators, making it difficult to directly interpret the actual meaning of each principal component. Moreover, PCA assumes linear relationships among the data, which may not fully capture nonlinear features, thus potentially reducing the model’s performance in those cases.
The calculation process of the PCA method is as follows:
- (1)
- Data Standardization
Normalize each indicator to remove scale effects and ensure each indicator is equally important in the analysis. The formula for standardization is:
where is the value of the j-th indicator for the i-th sample and and are the mean and standard deviation of the j-th indicator, respectively.
- (2)
- Constructing the Covariance Matrix
Using the standardized data, construct the covariance matrix:
where is the matrix of standardized data.
- (3)
- Eigenvalue Decomposition
Perform eigenvalue decomposition on the covariance matrix to extract eigenvalues and corresponding eigenvectors :
- (4)
- Selecting Principal Components
Based on the magnitude of the eigenvalues, select the top k principal components. Typically, components are selected such that their cumulative contribution to the variance exceeds a certain threshold, like 85%.
- (5)
- Calculating Indicator Weights
Calculate the weight of each indicator within the principal components by considering the size of the elements in the eigenvectors and the influence of the corresponding eigenvalues:
where is the weight for the j-th indicator, is the element of the k-th eigenvector corresponding to the j-th indicator, and is the eigenvalue of the k-th principal component.
- (6)
- Normalizing Weights
To make the weights interpretable and suitable for further analysis, normalize the calculated weights:
where is the normalized weight of the j-th indicator, ensuring the sum of all weights is 1.
3.2. Index Composition
The model embraces five pivotal sub-indicators, emphasizing economic growth, innovation, environmental stewardship, and high-quality enterprise development as interdependent pillars supporting corporate sustainability.
3.2.1. Urban Business Environment: A Facilitator of Investment Convenience
The urban business environment serves as a cornerstone for investment attraction, with a focus on enhancing investment convenience. Drawing upon the World Bank’s Doing Business report, this study selects three key dimensions for evaluation: the ease of starting a business, registering property, and enforcing contracts. These dimensions facilitate the operational efficiency of enterprises by reducing the complexity and time associated with administrative procedures. Additionally, the literature posits that labor costs are a major determinant of FDI location decisions, reflecting the balance between cost-effectiveness and talent retention [49].
3.2.2. Economic Development Strength: Capitalizing on Momentum and Competitiveness
Economic development strength encapsulates the FTZ’s economic vitality and competitiveness, serving as a proxy for capital potential and market scale. Provincial and regional GDP are chosen as secondary indicators. These metrics provide a comprehensive assessment of the economic health and market access within the FTZ [50]. The import and export volumes reflect the FTZ’s integration into global markets and its ability to attract foreign trade [51]. Businesses can tap into robust economic growth and diversified market opportunities, which, in turn, support corporate sustainability [52].
3.2.3. Innovation and Opening-Up Vitality: Fostering a Dynamic Ecosystem
Innovation and opening-up vitality emphasizes the FTZ’s capacity for innovation and intellectual property protection. Local fiscal expenditures on science and technology, as well as authorized patents, reflect the FTZ’s investment capacity in research and development and its ability to safeguard intellectual property rights [53]. The volume and frequency of venture capital investments and mergers and acquisitions demonstrate the FTZ’s proficiency in facilitating business growth and expansion within the province [54]. The activity of existing investments influences a region’s investment attractiveness [38]. Bidirectional exchanges with existing foreign-invested enterprises, leveraging the knowledge spillover effect, can also enhance corporate technological development and innovation capabilities, thus rendering the amount of foreign investment as a crucial indicator [55]. These indicators collectively contribute to the sustainable development of enterprises.
3.2.4. Urban Environmental Friendliness: A Green Approach to Investment
Urban environmental friendliness evaluates the FTZ’s habitability, with a strong emphasis on environmental sustainability. Key secondary indicators, such as industrial solid waste utilization rates, domestic waste harmless treatment rates, AQI (air quality index), and PM2.5 levels, serve as proxies for the FTZ’s commitment to environmental stewardship. High utilization rates of industrial solid waste and domestic waste indicate efficient waste management systems, reducing environmental pollution and preserving natural resources [56]. Low AQI and PM2.5 levels signify good air quality, which is vital for the health and well-being of residents and employees [57].
3.2.5. High-Quality Enterprise Development: Nurturing Market Potential
High-quality enterprise development focuses on the FTZ’s ability to nurture the growth of high-performing enterprises, augmenting market capacity and investment prospects. The number, scale, market value, and sustained growth potential of listed companies are chosen as secondary indicators, reflecting the FTZ’s capacity to attract and support the development of high-quality enterprises [21]. By nurturing high-quality enterprises, the FTZ contributes to corporate sustainability through market diversification, which mitigates risks associated with economic downturns and enhances the enterprises’ resilience to external shocks.
3.3. Data Sources
Since joining the World Trade Organization in 2001, China’s economy has grown rapidly. After the 2008 Global Financial Crisis, however, China faced a series of challenges in terms of opening up to the rest of the world, such as the rise in trade protectionism. In this context, on 27 September 2013, the State Council officially approved the establishment of China’s (Shanghai) FTZ, with institutional innovation as its core goal and replicability and popularization as its basic requirements. China’s FTZs aim at conducting pilot projects to accelerate the transformation of governmental functions, explore institutional innovation, and promote investment and trade facilitation. Furthermore, they explore novel methods and accumulate new experiences for comprehensively deepening reform and opening up. In China, FTZs are set up and managed with provincial administrative regions as units. As of September 2023, China has established 21 FTZs.
The data details are shown in Table 1. When obtaining the enterprise data, we used the FTZ’s official website to query the geographical scope, matched the company’s office address, and evaluated whether it is in the FTZ’s street. Finally, the matching results were supplemented by querying enterprises listed in the FTZ.

Table 1.
Evaluation index system of free trade zone investment attraction.
3.4. Weight Calculation
The results for the weights of the investment attraction index system are shown in Table 2. The entropy weight method and PCA yield similar outcomes in the weight assessment of investment attractiveness indicators, which enhances the reliability and objectivity of the results. This consistency suggests that, whether approached from the perspective of information entropy or the covariance structure of the data, the importance of these indicators remains relatively stable for evaluating the investment attractiveness of FTZs. Among the primary indicators, objectively, innovation, and opening-up vitality has the highest weight, that is, an FTZ’s innovation and opening-up environment constitute the most important factors for evaluating investment attraction.
Table 2.
Weight distribution of the investment attraction index system.
Considering that the indicator weights calculated using the entropy weight and PCA method are largely consistent, we choose to use the entropy weight method as an example to calculate scores. Following this, we conduct an in-depth analysis of the investment attractiveness across various FTZs.
3.5. Validity and Robustness Check
To verify the effectiveness of the investment attraction index system, the authors conduct a regression analysis of the FTZs’ investment situation in 2019 with the attraction index score.
In Model 1 of Table 3, the investment attractiveness score of FTZs is the independent variable, and the actual utilized foreign capital is the dependent variable. During regression, we standardized the actual utilized foreign capital. The regression results indicate a significant positive correlation between the free trade zone score and actual foreign investment (p < 0.001). Considering that the distribution of actual utilized foreign capital is right-skewed, we applied a logarithmic transformation to this variable. Model 2 presents the regression results after this transformation, showing results (p < 0.01) that are largely consistent with Model 1, confirming a significant positive relationship between the FTZ score and actual foreign investment.
Table 3.
The regression results of the FTZ investment attraction score.
To further examine the relationship between investment attractiveness indicators and foreign investment in FTZs, we conducted robustness tests with Models 3 and 4. In these models, the number of newly established foreign-funded enterprises serves as the dependent variable. Model 3 involves a regression analysis with the standardized dependent variable, revealing a significant positive correlation between the investment attractiveness score and the number of new foreign enterprises (p < 0.01). In Model 4, we treat the number of new foreign enterprises as a count variable. After evaluating the goodness of fit for Poisson regression, we find that issues regarding the poor model fit and overdispersion. Consequently, we employ a negative binomial regression, with the results being shown in Model 4. These results indicate a significant positive relationship between the investment attractiveness score and the number of newly established foreign-funded enterprises (p < 0.01).
In summary, our findings demonstrate that foreign investment is closely related to investment attractiveness in FTZs. Specifically, both the number of newly established foreign-funded enterprises and the amount of foreign capital utilized are positively and significantly influenced by investment attractiveness. This result to some extent proves the effectiveness and robustness of this index system.
4. Evaluation Results and Analysis of China FTZs’ Investment Attraction
4.1. Comprehensive Score
The investment attraction of China’s FTZs is evaluated using this index system, as shown in Table 4. It can be seen that the top three FTZs in China in terms of investment attraction are Guangdong, Shanghai, and Jiangsu. Guangdong ranks first, with an average score of 73, followed by Shanghai, with 66. This indicates that these FTZs have a higher level of investment attraction compared to others. The investment attraction of the seven FTZs, including Anhui, Hunan, Henan, Guangxi, Hebei, Tianjin, and Heilongjiang, is positioned at the bottom.
Table 4.
A comprehensive score of FTZs’ investment attraction score.
In order to acquire a comprehensive understanding of the disparities in investment attraction among various regions, we conduct an evaluation of the FTZs from the perspective of geographical region delineation. The aggregate scores for investment attraction reveal a pronounced dichotomy, with East China and South China occupying the forefront, recording notable totals of 44.5 and 44 points, respectively. These scores are substantially higher than those recorded in other regions, underscoring their superior attractiveness for investment. These regions are followed by a tier comprising North China (37), Southwest China (36.3), and Northwest China (36), which demonstrate a moderate level of attractiveness. Subsequently, Central China lags slightly with 31, whereas Northeast China trails considerably, achieving a score of merely 23 points. This stratification underscores the heterogeneous landscape of investment allure across China’s diverse regional geographies.
4.2. Regional Analysis
We further analyze the reasons for the differences in the investment attractiveness performance of free trade zones in different regions by comparing the inter-group mean and intra-group standard deviation on five indicators.
Firstly, as illustrated in Figure 1, the investment attractiveness of FTZs in different regions of China is primarily attributed to one or two specific sub-indicators, with no region yet demonstrating comprehensive development across all indicators. Taking the two regions with the highest composite scores, East China and South China, as examples, the development of FTZs across these five indicators is also uneven. Notably, the most prominent feature of East China’s FTZs in terms of strong investment attractiveness is their excellent urban business environment, exemplified by Shanghai and Jiangsu. Shanghai, as China’s economic hub, boasts a comprehensive transportation network, advanced industrial systems, and abundant business resources. Coupled with an internationalized business environment and policy support [58], it provides vast development opportunities for enterprises within the FTZ. Jiangsu, relying on its robust manufacturing base and diversified economic structure, offers rich upstream and downstream resources within the industrial chain and efficient supporting services for enterprises within the FTZ [59], further enhancing the investment attractiveness of East China’s FTZs. The prominent feature of South China’s FTZs in terms of attractiveness is their high urban-environment friendliness, which is fully embodied in Guangdong, Hainan, and Guangxi. Guangdong, as the forefront of China’s reform and opening up, has been committed to promoting ecological civilization construction. By strengthening environmental governance, enhancing public service levels, and optimizing the living environment, it has created a favorable living and working environment for enterprises and residents within the FTZ. Hainan, leveraging its unique geographical location and natural resource advantages, strives to build an international tourism and consumption center and a national ecological civilization pilot zone, further enhancing the environmental friendliness of its FTZ. Guangxi, through strengthening ecological protection and promoting green development, provides a strong guarantee for the sustainable development of its FTZ.
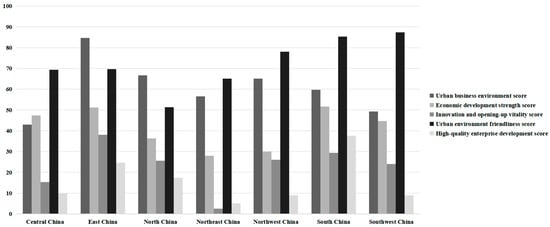
Figure 1.
The performance of regional FTZs in five indicators.
Figure 1 also visually illustrates the weak aspects of investment attractiveness in free trade zones in different regions. For instance, Central China and Northeast China exhibit significant weaknesses in both innovation and opening-up vitality and high-quality enterprise development. The weakness of Southwest China in terms of high-quality enterprise development cannot be ignored.
In addition to focusing on the disparities in investment attractiveness among FTZs across different regions, we employ the intra-group standard deviation to illustrate the degree of variation in the development of FTZs among various provinces and municipalities within the same region. With Northwest China (which only encompasses the FTZ of Shanxi Province, excluded), Figure 2 presents the varying degrees of attractiveness among FTZs in six regions based on provincial and municipal divisions. By combining Figure 1, regional issues in FTZ development become even more evident. The FTZs in provinces and municipalities within South China exhibit a relatively consistent level of urban environment friendliness, which also happens to be the best-performing indicator. Consequently, urban environment friendliness stands out as a distinctive feature of the attractiveness of FTZs in the South China region.
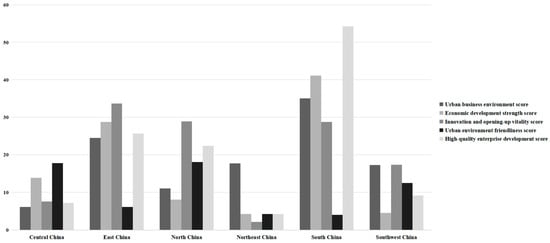
Figure 2.
Differences in the performance of intra-regional FTZs.
Furthermore, the weaknesses of Central China and Northeast China in terms of innovation and opening-up vitality and high-quality enterprise development are consistently observed within their respective regions, encompassing Hubei, Hunan, Henan, Liaoning, and Heilongjiang. To explore the reasons behind the poor performance of these five provinces and municipalities in the aforementioned aspects, one can start by examining the regional characteristics. Although Central China is situated in the hinterland of China, with convenient transportation, its industrial structure has long been heavily reliant on traditional industries, and the pace of transformation and upgrading has been relatively slow, potentially limiting its rapid progress in terms of innovation and openness. As for Northeast China, as an old industrial base that once flourished, it has recently faced challenges such as resource depletion and industrial aging, which have somewhat weakened its capacity for innovation and openness. Coupled with severe talent outflow and a lack of sufficient innovation momentum and high-end talent support, the development of high-quality enterprises is constrained.
Delineating the performance of FTZs by region provides policymakers with an overhead perspective, enabling them to observe more intuitively the characteristics of FTZ attractiveness and the regional development features presented. However, by combining Figure 1 and Figure 2, we can still observe significant differences among FTZs in different provinces and municipalities within the same region. To provide concrete recommendations for investors, we proceed with an in-depth analysis in the following section.
4.3. Subsystem Score
A nuanced examination of the primary indicators presented in Figure 3, Figure 4, Figure 5, Figure 6 and Figure 7 reveals disparities among FTZs situated in various provinces. Upon analyzing the comprehensive investment attraction scores outlined in Table 4, it becomes evident that Guangdong, Shanghai, Jiangsu, Beijing, and Zhejiang emerge as the top five FTZs in China. Among those, Guangdong’s FTZs exhibit exceptional performance across all five evaluation dimensions, underscoring their comprehensive attractiveness. Conversely, Beijing and Jiangsu’s FTZs encounter challenges in terms of urban environmental friendliness, indicating areas for potential improvement. A notable shortcoming across China’s FTZs lies in their performance regarding innovation and opening-up vitality, as well as the development of high-quality enterprises. In this regard, Jiangsu and Zhejiang’s FTZs occupy an intermediate position, indicating significant potential for improvement in these vital domains.
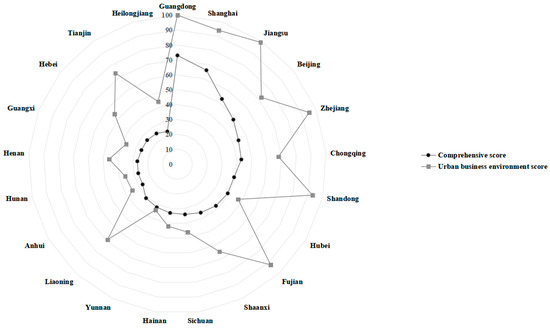
Figure 3.
The performance of provincial FTZs in the dimensions of urban business environment.
Figure 4.
The performance of provincial FTZs in the dimensions of economic development strength.
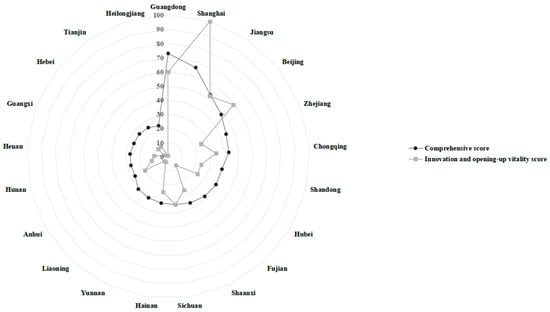
Figure 5.
The performance of provincial FTZs in the dimensions of innovation and opening-up vitality.
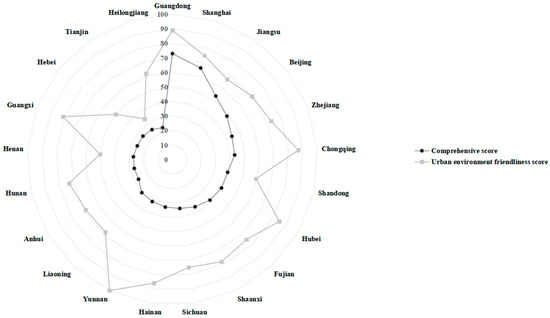
Figure 6.
The performance of provincial FTZs in the dimensions of urban environment friendliness.
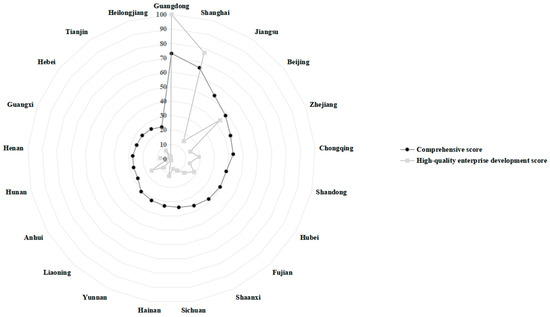
Figure 7.
The performance of provincial FTZs in the dimensions of high-quality enterprise development.
Notably, despite not ranking highly in the overall investment attraction scores, Henan and Shandong’s FTZs demonstrate notable strengths in economic development strength and urban business environment, respectively, highlighting their unique advantages. Additionally, Yunnan and Hainan’s FTZs boast a favorable urban environment, offering investors alternative options tailored to their specific requirements for factors such as work environment beyond the comprehensive offerings of FTZs in provinces like Guangdong.
4.4. Development Equilibrium
To gain a clearer understanding of the equilibrium among the five key indicators influencing investment attraction, we delved into calculating their respective standard deviations. The inverse relationship between these deviations and the degree of balance in each dimension underscores the importance of a harmonious distribution. Figure 8 illustrates the juxtaposition between the overall investment attraction scores and the sub-indicator balance achieved by various regions.
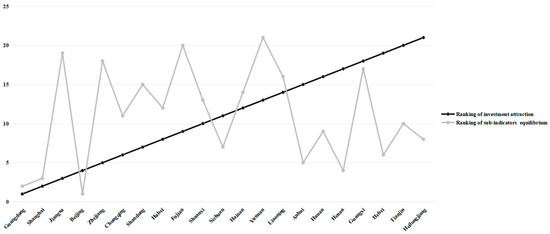
Figure 8.
Comparison between the ranking of investment attraction and sub-indicators equilibrium.
Notably, Guangdong, Shanghai, and Beijing stand out as exemplars, boasting both remarkable overall performance and a commendable balance across their sub-indicators, setting a high benchmark for China’s FTZs. While Jiangsu, Zhejiang, and Fujian occupy esteemed positions within the top 10, their sub-indicators reveal a concerning imbalance and significant fluctuations. To sustain their overall competitiveness, these provinces must prioritize enhancing their weaker sub-environments while preserving their strengths. Strategies could include fostering the growth of high-quality enterprises, bolstering innovation and development vitality in Zhejiang and Fujian, and sharpening the focus on economic development prowess in Fujian.
Turning our attention to sub-environmental balance among the top 10 provinces, Henan, Anhui, Hebei, Heilongjiang, Hunan, and Tianjin lag behind, signaling an urgent need for comprehensive development aimed at achieving harmony across all facets. By vigorously addressing these imbalances, these regions can work towards enhancing their overall investment attractiveness.
5. Conclusions and Recommendations
5.1. Conclusions
This study, grounded in the prism of investment attraction, meticulously constructs a multifaceted, five-dimensional FTZ investment attractiveness evaluation framework tailored to the imperatives of corporate sustainability. Our key findings underscore several salient aspects: Firstly, pronounced disparities exist in investment attractiveness across China’s seven regional blocs, with East and South China emerging as pre-eminent magnets, followed by the north, southwest, and northwest regions, while Central and Northeast China lag behind. Secondly, a hierarchical stratification is evident in the investment attractiveness of provincial FTZs, with Guangdong and Shanghai showcasing exemplary prowess, Beijing closely trailing, and a third tier comprising Zhejiang, Hubei, Chongqing, and Shandong indicating good performance, while Hebei, Guangxi, Tianjin, and Heilongjiang occupy the lower echelon. Thirdly, disparities in developmental balance are conspicuous, with Guangdong, Shanghai, and Beijing topping the charts in congruence with their overall environment rankings, whereas Jiangsu, Zhejiang, and Fujian exhibit a mismatch between their sub-indices and their relatively strong overall investment attractiveness. Conversely, Henan, Anhui, Hebei, Heilongjiang, Hunan, and Tianjin, though balanced in sub-environmental development, lag in overall investment appeal, necessitating concerted efforts towards balanced development. From the overall level of China’s FTZs, there is still room for improvement in terms of innovation and opening-up vitality, as well as high-quality enterprise development.
5.2. Policy Implications
Since the inception of China’s reform and opening-up policies, FDI has catalyzed regional progress through capital infusion, technological diffusion, and structural enhancement [60]. Amidst the global FDI downturn of 42% in 2020, China’s FDI resilience shone through, registering a countervailing 4% growth [61]. Relying on its unique endowment of labor resources and vast market potential, China has occupied a central position in the global capital flow landscape.
Precisely selecting locations within the strategic layout of China’s FTZ is a crucial step in advancing sustainable corporate development. This study systematically evaluates the investment attractiveness of China’s FTZs using an FTZ investment attractiveness evaluation system developed from the perspective of corporate sustainability. Among them, Guangdong and Jiangsu, as two major engines of China’s economy, have FTZs that not only demonstrate robust economic growth momentum and a vast market size but also reduce corporate operating costs and enhance market competitiveness by optimizing the policy environment and strengthening service support, laying a solid foundation for sustainable corporate development. Simultaneously, these FTZs actively promote industrial upgrading and technological innovation, transforming enterprises towards high-quality development by introducing international advanced technologies and management experiences, achieving a harmonious coexistence of economic and social benefits. The Shanghai FTZ, with its outstanding innovation capabilities and highly open business environment, has emerged as a forefront for international enterprises to explore new technologies, models, and formats. By strengthening international cooperation and exchanges, this FTZ has constructed a global innovation network, providing enterprises with vast international markets and resource platforms. Furthermore, the Shanghai FTZ emphasizes the construction of a green, low-carbon, and circular sustainable development system, guiding enterprises to achieve a win–win situation between economic and ecological benefits, thereby injecting new vitality into sustainable corporate development. Yunnan and Hainan, with their unique geographical locations and abundant ecological resources, offer invaluable opportunities for enterprises seeking green development, pushing them towards more environmentally friendly and sustainable directions.
The establishment of this comprehensive investment attractiveness evaluation system for China’s provincial FTZs serves as a benchmark for optimizing investment appeal and guiding future FTZ development. Policymakers can devise targeted interventions to bolster FTZs’ investment attractiveness that are tailored to scores and rankings. For instance, Guangdong, Shanghai, and Beijing should deepen reforms and continue spearheading FTZ advancements. Jiangsu and Zhejiang, despite high overall investment attractiveness, must optimize specific sub-environments while preserving their overall advantages. Lower-ranked provinces should prioritize enhancing comparative advantage-driven sub-environments, addressing shortcomings to bolster overall investment appeal. Section 4.2 of this paper, Regional Analysis, interprets the significant differences in attractiveness of different FTZs from the perspective of uneven regional development, and policymakers should also pay attention to this phenomenon.
China’s FTZs have unique regional advantages and policy support, providing guarantees for sustainable corporate development. Foreign investors can make targeted choices for the location of FTZs based on their own development needs.
5.3. Limitations and Future Research Directions
Despite its theoretical significance and practical value, this study is subject to certain limitations. The investment attractiveness evaluation model proposed by this research evaluates the foreign investment attractiveness of China’s FTZs. In the future, we hope that this index can be adapted to more countries, especially emerging economies, for evaluating the investment attractiveness of free trade zones.
Author Contributions
Conceptualization, J.L. and X.D.; methodology, X.D.; software, X.D.; validation, J.L.; formal analysis, X.D. and X.L.; investigation, X.D.; resources, J.L.; data curation, X.D.; writing—original draft preparation, X.L.; writing—review and editing, X.L. and S.X.; visualization, X.L.; supervision, J.L.; project administration, J.L.; funding acquisition, J.L. All authors have read and agreed to the published version of the manuscript.
Funding
This research is financially supported by the National Natural Science Foundation of China [grant number 71972196], and the MOE Project of Humanities and Social Sciences [grant number 18YJA630051].
Institutional Review Board Statement
Not applicable.
Informed Consent Statement
Not applicable.
Data Availability Statement
The data supporting the findings of this study are available from the corresponding author upon reasonable on request.
Conflicts of Interest
Author Xiaomeng Du had been employed by Beijing PERCENT Technology Group Co., Ltd. The remaining authors declare that the research was conducted in the absence of any commercial or financial relationships that could be construed as potential conflicts of interest.
References
- Cheng, J.; Ma, L. China’s Pilot Free Trade Zones and Company’s Sustainability Performance. Sustainability 2023, 15, 14632. [Google Scholar] [CrossRef]
- Chen, H.; Yuan, B.; Cui, Q. Does the Pilot Free Trade Zone Policy Attract the Entering of Foreign-Invested Enterprises? The Evidence from China. Appl. Econ. Lett. 2020, 28, 1162–1168. [Google Scholar] [CrossRef]
- Vincze, Z.; Hällerstrand, L.; Örtqvist, D.; Rist, L. Strategic Corporate Sustainability in a Post-Acquisition Context. Sustainability 2021, 13, 6017. [Google Scholar] [CrossRef]
- He, B.; Tian, S.; Zhang, X. Does the Pilot Free Trade Zone Policy Increase Regional Innovation Ability? Evidence from China. Appl. Econ. Lett. 2023, 1–6. [Google Scholar] [CrossRef]
- Lin, X.; Leng, L.; Qiu, Y. Research on the Policy Effect of Free Trade Zone on Regional Innovation Capability: Evidence from China. Appl. Econ. Lett. 2023, 30, 689–694. [Google Scholar] [CrossRef]
- Yang, J.; Li, Y.; Dai, F.; Ni, J. How Can Pilot Free Trade Zones Affect Regional Technology Innovation? –Evidence from China at the City Level. Appl. Econ. 2024, 1–16. [Google Scholar] [CrossRef]
- Lv, L.; Chen, Y. Impact of the Free Trade Zone Policy on Firm Labour Investment Efficiency: Evidence from China. Appl. Econ. Lett. 2024, 1–5. [Google Scholar] [CrossRef]
- Peng, Y.; Chen, Z.H. Research on Evaluation Index System of Investment and Trade Facilitation in China (Shanghai) Pilot Free Trade Zone. Int. Econ. Trade Explor. 2014, 30, 63–75. [Google Scholar]
- Liu, M.M.; Mo, H.L. Analysis on Influencing Factors of Financial Ecological Environment in China ASEAN Free Trade Area Based on AHP Method. Contemp. Econ. 2015, 35, 145–147. [Google Scholar]
- Tian, B.F.; Li, W. Study on the Establishment and Evaluation of Inland Free Trade Zone: A Case of Wuhan. Int. Bus. Res. 2015, 36, 47–55. [Google Scholar]
- Liu, J.; Yang, Z.Z. Research on Comprehensive Performance Evaluation Index System of China’s Pilot Free Trade Zone. Asia Pac. Econ. 2016, 3, 113–121. [Google Scholar]
- Zhang, S.L. Study on Evaluation of Influencing Factors of Comprehensive Development Level of Free Trade Zone. Reg. Econ. Rev. 2017, 6, 112–120. [Google Scholar]
- Li, F.; Li, J. The Foreign Investment Environment in China: The Soft Environment (I). In Foreign Investment in China; Palgrave Macmillan: London, UK, 1999; pp. 116–150. [Google Scholar]
- Li, F.; Li, J. The Foreign Investment Environment in China: The Hard Environment. In Foreign Investment in China; Palgrave Macmillan: London, UK, 1999; pp. 82–115. [Google Scholar]
- Patibandla, M. Pattern of Foreign Direct Investment in Developing Economies: A Comparative Analysis of China and India. Int. J. Manag. Decis. Mak. 2007, 8, 356–377. [Google Scholar] [CrossRef]
- Davies, K. Inward Foreign Direct Investment in China and Its Policy Context. Transnatl. Corp. Rev. 2010, 2, 87–101. [Google Scholar] [CrossRef]
- Wu, W.J.; Wang, W. To Construct the Evaluation System of Foreign Investment Environment of Mining Enterprises in China. Appl. Mech. Mater. 2014, 522, 1426–1433. [Google Scholar] [CrossRef]
- Raluca, A. Model for Evaluating Regional Competitiveness Regarding Foreign Investment Attraction. Int. Econ. 2012. Available online: http://www.ipedr.com/vol39/029-ICITE2012-K00010.pdf. (accessed on 1 December 2023).
- Grishina, I.; Myakshin, V. Interregional Differentiation of Investment Attractiveness in Russia: New Evaluation Tool. In E3S Web of Conferences; EDP Sciences: Les Ulis, France, 2021; Volume 301, p. 01004. [Google Scholar]
- Liu, W.W.; Duan, W.C.; Du, Y.W.; Li, N. Regional Environment System Influence Factor Identification for Attracting Investments. Appl. Mech. Mater. 2013, 321, 2415–2418. [Google Scholar] [CrossRef]
- UNCTAD. World Investment Report 2019: Special Economic Zones; United Nations: Geneva, Switzerland, 2019; Available online: https://unctad.org/system/files/official-document/wir2019_en.pdf (accessed on 4 January 2021).
- Frick, S.A.; Rodríguez-Pose, A. What Draws Investment to Special Economic Zones? Lessons from Developing Countries. Reg. Stud. 2023, 57, 2136–2147. [Google Scholar] [CrossRef]
- Dorożyński, T.; Świerkocki, J.; Urbaniak, W. Determinants of Investment Attractiveness of Polish Special Economic Zones. Entrep. Bus. Econ. Rev. 2018, 6, 161–180. [Google Scholar] [CrossRef]
- Na, B. The Development from Special Economic Zone (SEZ) to Free Trade Zone (FTZ) of China. IOP Conf. Ser. Mater. Sci. Eng. 2019, 667, 012008. [Google Scholar] [CrossRef]
- Homlong, N.; Springler, E. Is Vietnam the New Asian Tiger? Scoreboard and Macroeconomic Evaluation of the Attractiveness for Foreign Direct Investment. Int. J. Econ. Financ. Stud. 2012, 4, 175–184. [Google Scholar]
- Song, Y.; Deng, R.; Liu, R.; Peng, Q. Effects of Special Economic Zones on FDI in Emerging Economies: Does Institutional Quality Matter? Sustainability 2020, 12, 8409. [Google Scholar] [CrossRef]
- Sheehy, B.; Farneti, F. Corporate Social Responsibility, Sustainability, Sustainable Development and Corporate Sustainability: What Is the Difference, and Does It Matter? Sustainability 2021, 13, 5965. [Google Scholar] [CrossRef]
- Chaisse, J.; Dimitropoulos, G. Special Economic Zones in International Economic Law: Towards Unilateral Economic Law. J. Int. Econ. Law 2021, 24, 229–257. [Google Scholar] [CrossRef]
- Ebenstein, A.; Fan, M.; Greenstone, M.; He, G.; Yin, P.; Zhou, M. Growth, Pollution, and Life Expectancy: China from 1991–2012. Am. Econ. Rev. 2015, 105, 226–231. [Google Scholar] [CrossRef]
- Li, Z.; Shao, Q.; Song, J. The Efforts of Manufacturing Enterprises toward Sustainable Development under Voluntary Environmental Policy: The Roles of External Pressure, Attraction, and Internal Attributes. Corp. Soc. Responsib. Environ. Manag. 2023, 30, 2315–2329. [Google Scholar] [CrossRef]
- Guzzo, R.F.; Suess, C.; Legendre, T.S. Biophilic Design for Urban Hotels—Prospective Hospitality Employees’ Perspectives. Int. J. Contemp. Hosp. Manag. 2022, 34, 2914–2933. [Google Scholar] [CrossRef]
- Vershinina, A.A.; Zhdanova, O.A.; Maksimova, T.P.; Perepelitsa, D.G. The Formation of Indicator Framework for Effective Assessment of Investment Attractiveness of the Region. Int. J. Econ. Financ. Issues 2015, 5, 136–141. [Google Scholar]
- Li, H. The Impact of China’s Intellectual Property Protection on Foreign Direct Investment. J. Northeast Univ. Financ. Econ. 2007, 2, 35–39. [Google Scholar]
- Wu, C.P.; Tang, D. Enforcement of Intellectual Property Protection, Technological Innovation and Enterprise Performance: Evidence from Chinese Listed Companies. Econ. Res. 2016, 51, 125–139. [Google Scholar]
- Braga, P.; Carlos, A.P.; Fink, C. Reforming Intellectual Property Rights Regimes: Challenges for Developing Countries. J. Int. Econ. Law 1998, 1, 537–554. [Google Scholar] [CrossRef]
- Branstetter, L.; Fisman, R.; Foley, C.F.; Saggi, K. Does Intellectual Property Rights Reform Spur Industrial Development? J. Int. Econ. 2011, 83, 27–36. [Google Scholar] [CrossRef]
- Zhang, Z.G.; Xu, Y.Q.; Cheng, J. Business Environment, Innovation Activity, and High-Quality Development of Enterprises. China Soft Sci. 2024, 1, 130–138. [Google Scholar]
- Mustafakulov, S. Investment Attractiveness of Regions: Methodic Aspects of the Definition and Classification of Impacting Factors. Eur. Sci. J. 2017, 13, 433–449. [Google Scholar] [CrossRef]
- Wang, P.; Zhong, M. Industrial Cluster Networks, Technological Innovation, and Urban Economic Resilience. Urban Probl. 2021, 8, 63–71. [Google Scholar]
- Mao, Y.H.; Qiu, X.Q.; Rong, J.X. The Effect of Industrial Cluster and Firms’ Digital Transformation: Based on a Survey of Manufacturing Clusters in Guangdong. South China J. Econ. 2024, 5, 150–166. [Google Scholar]
- Wang, H.; Zhao, X. Study on Investment Environment Evaluation Based on Principal Component Analysis: Evidence from Western China. Procedia Eng. 2016, 154, 769–776. [Google Scholar]
- Zhao, X.; Yang, Y. Application of Entropy Weight Method in the Evaluation of Foreign Investment Attractiveness of Economic Development Zones. IOP Conf. Ser. Earth Environ. Sci. 2018, 170, 032131. [Google Scholar] [CrossRef]
- Wu, H.; Zhao, H. Evaluation of Investment Environment in China’s Yangtze River Delta Using Entropy Weight and TOPSIS Method. J. Coast. Res. 2019, 93, 830–835. [Google Scholar] [CrossRef]
- Phillips, S.J.; Anderson, R.P.; Schapire, R.E. Maximum Entropy Modelling of Species Geographic Distributions. Ecol. Model. 2006, 190, 231–259. [Google Scholar] [CrossRef]
- Ren, J.; Xiong, Y. An Optimized Method of Weighting Combination in Multi-Index Comprehensive Evaluation. Int. J. Appl. Decis. Sci. 2010, 3, 34–52. [Google Scholar]
- Coifman, R.R.; Wickerhauser, M.V. Entropy-Based Algorithms for Best Basis Selection. Inf. Theory 1992, 38, 713–718. [Google Scholar] [CrossRef]
- Abdi, H.; Williams, L.J. Principal Component Analysis. Wiley Interdiscip. Rev. Comput. Stat. 2010, 2, 433–459. [Google Scholar] [CrossRef]
- Li, X.; Zhang, C. Evaluation of Regional Investment Environment Based on Principal Component Analysis. Procedia Comput. Sci. 2014, 31, 450–456. [Google Scholar]
- Zhang, H.; Kim, H. Institutional Quality and FDI Location: A Threshold Model. Econ. Model. 2022, 114, 105942. [Google Scholar] [CrossRef]
- United Nations Economic and Social Commission for Asia and the Pacific (UNESCAP). Handbook on Policies, Promotion, and the Facilitation of Foreign Direct Investment for Sustainable Development in Asia and the Pacific; UNESCAP: Bangkok, Thailand, 2022; Available online: https://www.unescap.org/kp/2022/handbook-policies-promotion-and-facilitation-foreign-direct-investment-sustainable (accessed on 10 November 2024).
- Li, N.; Zhang, Y. Suggestions on How FTZ Construction Can Help Develop Port Economy in Shaanxi. Am. J. Ind. Bus. Manag. 2022, 12, 1375–1381. [Google Scholar] [CrossRef]
- Fan, G.; Xie, X.; Chen, J.; Wan, Z.; Yu, M.; Shi, J. Has China’s Free Trade Zone Policy Expedited Port Production and Development? Mar. Policy 2022, 137, 104951. [Google Scholar] [CrossRef]
- Liu, C. Infrastructure Public–Private Partnership (PPP) Investment and Government Fiscal Expenditure on Science and Technology from the Perspective of Sustainability. Sustainability 2021, 13, 6193. [Google Scholar] [CrossRef]
- Cappellari, T.; Gucciardi, G. Equity Investments and Environmental Pressure: The Role of Venture Capital. Sustainability 2024, 16, 241. [Google Scholar] [CrossRef]
- He, B.; Ma, C. Can the Inclusiveness of Foreign Capital Improve Corporate Environmental, Social, and Governance (ESG) Performance? Evidence from China. Sustainability 2024, 16, 9626. [Google Scholar] [CrossRef]
- Zhou, B.; Sun, C.; Yi, H. Solid Waste Disposal in Chinese Cities: An Evaluation of Local Performance. Sustainability 2017, 9, 2234. [Google Scholar] [CrossRef]
- Li, X.; Cheng, B.; Hong, Q.; Xu, C. Can a Win–Win Situation of Economy and Environment Be Achieved in Cities by the Government’s Environmental Regulations? Sustainability 2021, 13, 5829. [Google Scholar] [CrossRef]
- Chi, M. Regulation of Special Economic Zones Through Regional Trade Agreements: Confronting the Synergy Issue. J. Int. Econ. Law 2021, 24, 423–442. [Google Scholar] [CrossRef]
- Zeng, D.Z. The Past, Present, and Future of Special Economic Zones and Their Impact. J. Int. Econ. Law 2021, 24, 259–275. [Google Scholar] [CrossRef]
- Wang, L.J.; Wu, F.X.; Jiang, X.J. Can Two-Way FDI Technology Spillovers Boost High-Quality Economic Development? Financ. Sci. 2019, 4, 64–79. [Google Scholar]
- UNCTAD. World Investment Report 2021—Investing in Sustainable Recovery; United Nations: Geneva, Switzerland, 2021. [Google Scholar]
Disclaimer/Publisher’s Note: The statements, opinions and data contained in all publications are solely those of the individual author(s) and contributor(s) and not of MDPI and/or the editor(s). MDPI and/or the editor(s) disclaim responsibility for any injury to people or property resulting from any ideas, methods, instructions or products referred to in the content. |
© 2024 by the authors. Licensee MDPI, Basel, Switzerland. This article is an open access article distributed under the terms and conditions of the Creative Commons Attribution (CC BY) license (https://creativecommons.org/licenses/by/4.0/).